


NATIONAL
DISASTER RISK MANAGEMENT COMMISSION
(NDRMC)
WEREDA DISASTER RISK PROFILE (WDRP)
REGION: SNNP
ZONE: GAMO
WEREDA: MIRAB ABAYA
December, 2020
Addis Ababa

About the National Disaster Risk Management Commission (NDRMC)
The National Disaster Risk Management Commission (NDRMC) was reestablished in
December 2015 and recognized by an act of Council of Ministers (Regulation No.
363/2015) as an autonomous Federal Government office mandated to conduct
appropriate activities for the comprehensive implementation and realization of
the objectives of the National Disaster Risk Management Policy and Strategy and
to coordinate, monitor and provide appropriate support with respect to activities
carried out by the lead sector institutions.
Address: Kirkos Sub-city Behind Dembel City Center, Addis Ababa, Ethiopia.
P.O.Box: 5686
Tele: 0115524259/4272
Website: www.dppc.gov.et
© 2020 National Disaster Risk Management Commission. All rights reserved
Printed in Addis Ababa, Ethiopia.
Citation- This Document May be Cited as Follows:
National Disaster Risk Management Commission (2020), Mierab Abaya Woreda
Disaster Risk Profile, Addis Ababa, Ethiopia.

PREFACE
Ethiopia is well aware of the impact that disasters can have on the
development goals that we are rigorously pursuing through our
Growth and Transformation Plan II. With this recognition we
started a paradigm shift a few years ago, largely triggered by the
revised National Policy and Strategy on Disaster Risk Management.
To make the DRM programme implementation in the country well-informed, a
comprehensive information management system is required. We have been
undertaking a comprehensive risk assessment exercise under which Disaster Risk
Profiles are being prepared for each district and at sub-district levels in the country.
This Wereda Disaster Risk Profile establishes an extensive database on disaster risk
elements that will help decision makers at all levels to be better informed at
community and Wereda level about the characteristics of potential hazards, their
potential exposure, vulnerabilities of communities, capacities and that can also be an
input for Wereda Disaster Risk Reduction Plans and area specific early warning tools.
Wereda Disaster Risk Profiles developed are publically available here for the use of all
development partners and government sectors at all levels. Also, other data sources
of NDRMC, such as Desinventar, Livelihood Baseline and the Early Warning information
will be integrated and harmonized with this Information Management System.
Finally, we need to acknowledge the support of partners who have funded this
programme and we also look for the support of donors and all development partners
in order to achieve the ambitious indicators of this risk information and providing
every district with the disaster risk profile and their respective risk-informed plans.
H.E. Ato Mitiku Kassa
Commissioner
National Disaster Risk Management Commission (NDRMC)
The Federal Democratic Republic of Ethiopia (FDRE)

PREFACE
Woreda Disaster Risk Profiling (WDRP) is a government owned
programme undertaken by the National Disaster Risk
Management Commission (NDRMC) in collaboration with
regional DRM offices and development partners to provide
baseline information for disaster risk management practices
and activities in the country. The programme is designed by
taking into account the experiences gained from the implementation of pervious
strategies and actions like the Hygo Framework for Action (2000-2015) and the Sendai
Framework for Disaster Risk Reduction (2015-2030).
WDRP is composed of diversified indicators including hazard related issues, crop and
livestock production, landholding and environmental issues, human and livestock
health issues, education and social issues at wereda and kebele level. It provides
basic and detailed indicators with both quantitative and qualitative information which
obtained from both primary and secondary data sources.
Moreover, two pages summary of profiles is also prepared to help users easily
understand WDRP results for each wereda without going into detail for all indicators.
In addition to this booklet, developed profiles are uploaded on WDRP website
(http://profile.ndrmc.gov.et) to be viewed by all users; we encourage all DRM actors
at all levels to use this profile as baseline information for all DRM initiatives.
This WDRP booklet was produced through exemplary collaboration of all concerned
bodies and I would like to give my deepest gratitude to all who directly or indirectly
contribute for the success of the programme particularly for data enumerators and
supervisors, data encoders and profile development teams, consultants and advisors,
partner ministries and all DRM stakeholders.
Abraham Abebe
Director
Disaster Risk Reduction and Rehabilitation Directorate (DRRRD)
National Disaster Risk Management Commission (NDRMC)
Contents
No. Indicator Name
Page
Wereda Location
I
Preface
II
Wereda Location in Ethiopian Map
III
WDRP Methodology
VI
Summary Profile
Hazard Related Characteristics
1
1. Biological Hazards of the Wereda
2
2. Geological Hazards of the Wereda
3
3. Hydro Metrological Hazards of the Wereda
4
4. Socio Economic Hazards of the Wereda
5
5. Technological Hazards of the Wereda
6
6. Disaster Characteristics by Kebele
7
7. Hazards: Conflict as an Issue
24
8.
Hazard Situation During Last Disaster - Characteristics of most recent disaster that
affected the community
27
9. Frequency of Disaster Occurrence
29
10. Household Exposure to Hazards
30
11. Months of Occurrence of Frequent Disasters
31
Conflicts: Perception of households on conflict issues - Is conflict an issue in this
12. community?
32
Conflicts: Perception of households on conflict issues - Who do you turn to in case
13. of a conflict?
33
14. Losses from Disasters - Losses from all disasters (household response in %)
34
15. Losses from Disasters - Main Losses by Type of Disasters (household response in %) 35
Losses from Disasters - Secondary Losses by Type of Disasters (household response
16. in %)
38
17. Seasonal Calendar for Hazards, Activities and Income Level By Kebele
41
No. Indicator Name
Page
Infrastructure Access Characteristics
61
Physical Vulnerability: Access to Roads & Urban Centers - Households access to
18. road and urban center
62
Physical Vulnerability: Access to Electricity - Households’ access and utilization of
19. electricity
63
20. Physical Vulnerability: Type of Dwelling Units - Households’ type of dwelling houses 64
Socio Demographic Characteristics
65
Economic Vulnerability: Level of Migration - Migration level and its characteristics
21. by Kebele
66
Economic Vulnerability: Household Migration - Household migration and reason for
22. migration
68
Economic Vulnerability: Household Migration - Disasters as a triggering factor for
23. migration (households response in %)
69
24. Demography: Population Structure
70
25. Demography: Population Trends and Ethnic Groups
72
Social Vulnerability: Household Demographic Characteristics - Demographic
26. characteristics of households
73
Social Vulnerability: Level of Educational Attainment - Education status of
27. household members
74
Social Vulnerability: Gender Parity - Gender parity in education level (7+ years)
28. and household heading
76
Environmental Characteristics
77
Environmental Situation: Environmental Problems - Major environmental problems
29. by Kebele
78
Environmental Situation: General Land Quality - Perceptions of the community
30. on changes in the general quality of land over a decade
80
Environmental Situation: Changes in Landscape - Changes observed by the
31. community on landscape and the problems due to the changes
81
32.
Environmental Situation: Land-Use other than crop production - Types of land use
other than crop production across Kebeles
83
33.
Environmental Situation: Deforestation - Observed changes over levels of
deforestation by the community and its problems
85
Environmental Situation: Natural Resources Availability - Natural resources
34. available and changes observed by the community
87
No. Indicator Name
Page
Environmental Situation: Rainfall & Temperature - Observed changes on rainfall
35. and temperature by the community over the last decade
97
36. Environmental Situation: Reasons for Environmental Changes
99
Environmental Situation: Soil Erosion - Observed changes on levels of soil erosion
37. by the community
100
Livelihood, Occupation and Source of food
101
Economic Vulnerability: Major Occupational Categories - Major categories of
38. occupation and percent of population engaged in the occupation by Kebele
102
Economic Vulnerability: Livelihoods - Households important sources of
39. livelihood (response in %)
104
Economic Vulnerability: Occupational Categories - Percent of population above 15
40. years age by occupation categories
107
41.
Economic Vulnerability: Sources of Food - Households source for different food
items (response in %)
108
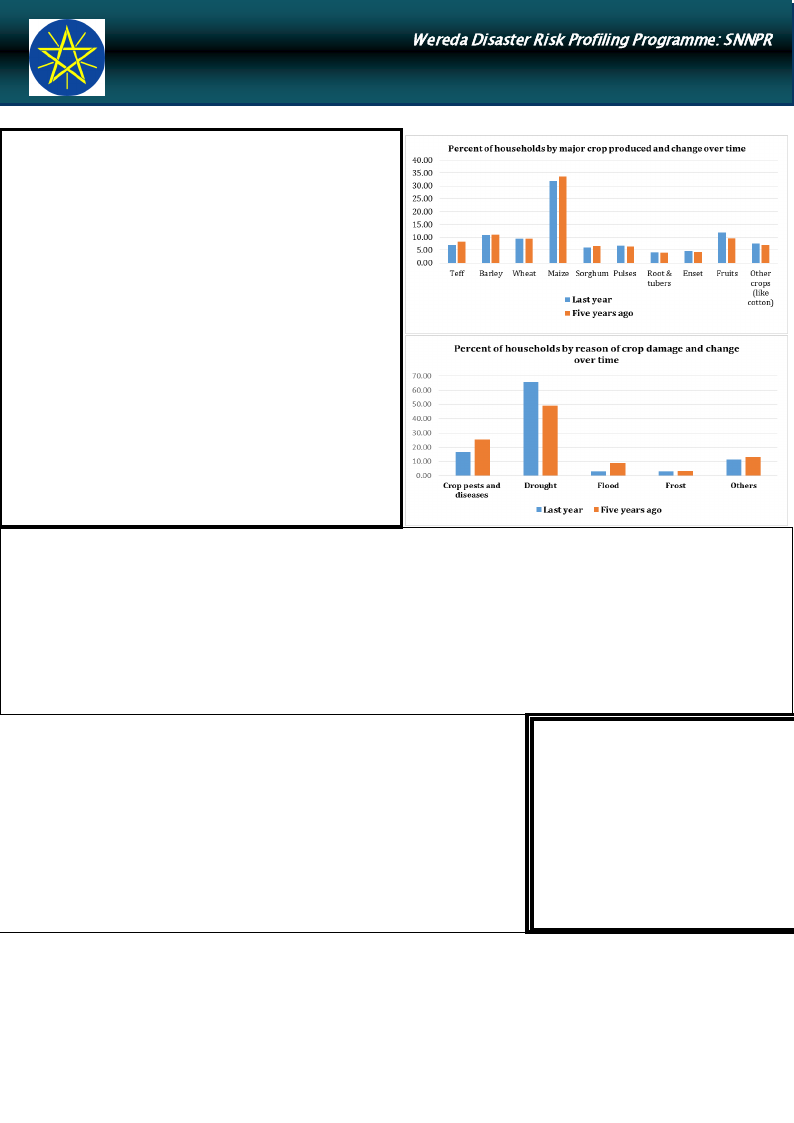
Crop Production
110
Hazards: Change in Crop Damages - Proportion of total crop damage (percentage
42. response by households)
111
Hazards: Change in Crop Damages - Major reasons for crop damage (percentage
43. response by households)
112
Hazards: Change in Crop Damages - Proportion of Damage for Major Crops
44. (percentage response by households)
113
Hazards: Change in Crop Damages - Reasons for Damage of Major Crops
45. (percentage response by households)
115
Agricultural Situation: Change in Crops Grown - Five major crops grown by
46. proportion of total cultivated land
118
47.
Agricultural Situation: Access to Extension - Perception of the community on
Access to Agricultural extension Services
125
48. Economic Vulnerability: Crops Grown - Types of crops grown by households
127
49.
Economic Vulnerability: Crops Grown - Proportion of households by amount of yield
of major crops (last year)
129
50.
Economic Vulnerability: Crops Grown - Proportion of households by amount of yield
of major crops (Five years ago)
130
51. Economic Vulnerability: Land Ownership and Quality - Landownership of households 132
No. Indicator Name
Page
52.
Economic Vulnerability: Land Ownership and Quality - Farmers’ perception on the
quality of their agricultural land
133
Agricultural Situation: Access to Inputs - Perception of the community on access
53. to improved agricultural inputs
134
Agricultural Situation: Water for irrigation - Access to water for irrigation in the
54. community
135
Agricultural Situation: Soil Fertility - Perception of the community on soil fertility
55. and its change over time
136
Economic Vulnerability: Status of Agriculture - Methods of tillage, Irrigation and
56. other agricultural input utilization by households
137
57.
Economic Vulnerability: Change in Agricultural Situation - Households
perception on changes of crop type, size of cultivated area and crop yields
138
58. Economic Vulnerability: Crops Grown - Number of crops grown by households
140
Livestock Production
141
Agricultural Situation: Status of Livestock Disease - Change In Livestock Disease
59. Status By Kebele
142
Livestock Prevalent of Diseases & Veterinary Facility - Livestock Diseases
60. Prevalence
144
Livestock Prevalent of Diseases & Veterinary Facility - Evaluation of Access to
61. Veterinary Services and Livestock Drugs
145
62.
Agricultural Situation: Water Availability for Livestock - Water availability for
livestock in the community
146
Agricultural Situation: Livestock Diversity - Type of livestock and their economic
63. importance in the community
147
Economic Vulnerability: Livestock Ownership and Changes - Percentage of
64. households by number and type of livestock owned
152
65.
Economic Vulnerability: Livestock Ownership and Changes - Households’ perception
on changes in livestock number in the last five years (response in %)
154
66.
Economic Vulnerability: Livestock Ownership and Changes - Households
perception on changes in livestock number in the last five years (response in %)
155
67.
Agriculture (Livestock): Pasture Availability - Households’ perception on access and
quality of pasture
157
Agriculture (Livestock): Pasture Availability - Households’ perception on
68. problematic months for pasture availability
158
No. Indicator Name
Page
Agriculture (Livestock): Water Availability - Households’ response on water
69. availability for livestock
159
70.
Agriculture (Livestock): Water Availability - Households’ perception on problematic
months of water availability for livestock
160
Agriculture (Livestock): Water Availability - Sources of water for livestock
71. (households response in %)
161
Access to Markets and Credit
162
Economic Vulnerability: Proportion of Produce Sold and Market - Proportion of
72. crops and livestock sold from total production and markets
163
73. Economic Vulnerability: Kebele Access to Markets - Access to market by Kebele
165
Economic Vulnerability: Formal & Informal Transfers - Percentage of households
74. reporting received formal transfers
166
75. Capacity: Access to Credit Facilities - Households access to credit facilities
168
Capacity: Access to Credit Facilities - Percentage of households by major reasons
76. of borrowing money
169
Capacity: Access to Credit Facilities - Percentage of households by major sources
77. of credit
170
Capacity: Access to Credit Facilities - Percent of households with ability to raise
78. 500 birr in one week
171
Health and Sanitation Characteristics
172
79. Household Access to Health Facilities - Where do patients go for health care?
173
80. Hazards: Health problems and changes over the last decade
174
81. Household Health Status - Households’ health condition and major health problems 176
82.
Household Access to Sanitation - Percentage of households with access to different
kind of toilet facilities
178
Household Access to Drinking Water - Sources of drinking water for households
83. (response in %)
179
Household Access to Drinking Water - Households’ methods of treating drinking
84. water
180
85.
Household Access to Drinking Water - Number of times households fetch water in a
week
181
Household Access to Drinking Water - Time taken per day to fetch water for
86. households
182

No. Indicator Name
Page
Coping Mechanisms and Preparedness Measures
184
87. Capacity: Community Preparedness against Sudden Onset Disasters
185
88. Capacity: Community Preparedness against Increase in Disaster Intensity
188
89. Capacity: Community Preparedness against Disasters
191
90. Hazard: Coping and recovering during last Disaster
194
91. Capacity: Type Community Participation
204
Capacity: Recovery from Losses from Disasters - Percentage of Households who
92. have managed to recover from losses of disasters
205
Capacity: Coping Strategies Adopted by Households - Main coping strategies
93. adopted by households to recover from respective losses
206
94.
Capacity: Coping Strategies Adopted by Households - Percentage of households
by frequency of main coping strategies adopted
211
95.
Capacity: Alternative Livelihood Sources - Alternative livelihood sources suggested
by the community
213
96.
Capacity: Recovery from Losses from Disasters - Percentage of households
recovered from past disasters by type of Disasters
215
Capacity: Recovery from Losses from Disasters - Proportion of households
97. recovered by type of Losses
216
Capacity: Coping Options if More Resources Available - What coping strategy could
98. be adopted if more resource were available?
217
Capacity: Coping Strategies Adopted by Households - Percentage of households by
99. major type of coping strategies adopted (at least once)
218
Capacity: Coping Strategies Adopted by Households - Main coping strategies
100. adopted by households for respective disasters
220
Capacity: Coping Strategies Adopted by Households - Secondary coping strategies
101. adopted by households for respective disasters
227
Community Perception and Suggestions
231
No. Indicator Name
Page
Interventions: Community Perception on Mediums to Influence DRM Actors -
102. Community perception on the effectiveness of institutional channels to use to
232
influence DRM actors
Interventions: Community Perception on their Knowledge used in DRM Process -
103. Perception of the community on how their knowledge influences the priorities and 238
measures of DRM actors
Interventions: Suggestions to improve preparedness - Interventions suggested by
104. the community to development actors to improve preparedness in the area
240
Interventions: Suggestions to DRM Actors in the Area - Community suggested
105. measures to DRM actors in the area for effective DRM actions
241
Economic Vulnerability: Community Suggestions to Improve Economic Situation -
106. Community suggested measures to improve the economic situation of the area
244
107. Community Awareness of Disaster Risk Management System and Actors
247
Community Perception of DRM System and Actors - Perception of the community on
108. the effectiveness of DRM system in helping them to prevent, cope and recover
257
from disasters
Major Public Interventions Desired - Percentage of households by type of
109. intervention desired
259
Others
261
110. Capacity: Community Based Organizations
262
Supporting Agencies against Disasters - Percentage of households by supporting
111. institutions to handle or recover from disaster damages
269
Type of Support Received From Supporting Agencies – Household responses of types
112. of support received from supporting agencies
270
Government Actors in the Field of Disaster Risk Management - Government actors
113. and their activities in the field of Disaster Risk Managements
271
Non-Government Actors in the Field of Disaster Risk Management - Non-government
114. actors and their activities in the field of Disaster Risk Management
273
115. Interventions: Community Suggestions to Development Actors
274
116. Wereda SWOT Analysis
284
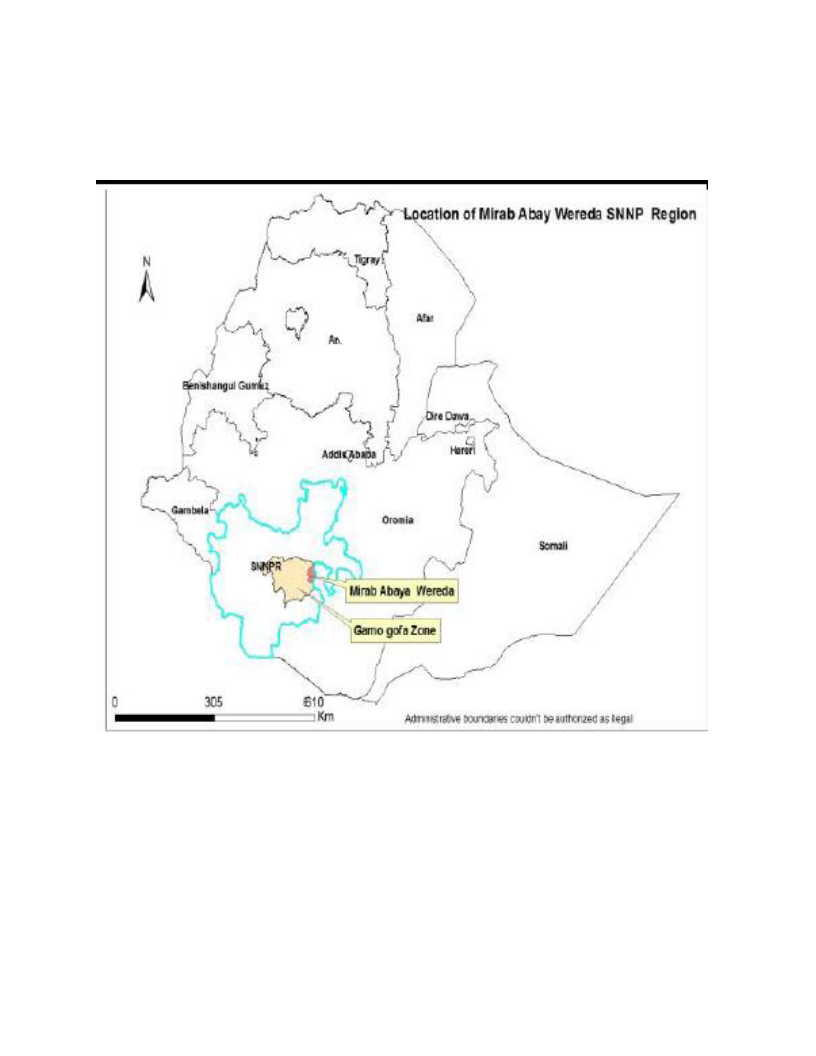
WEREDA LOCATON
METHODOLOGY
WDRP Content :
• Comprehensive information on disaster risk components
(Hazards, Vulnerability and Capacity)
• Multi-sectoral and multi-hazard information.
Research Approach:
• Mixed Approach
• Both quantitative and qualitative information
Data Sources:
• Primary Data:
Household Questionnaires: statistically significant number
(around 400 households).
Focus Groups Discussions: One per kebele
Key Informant Interviews: with major woreda level government
and non-government DRM actors
Problem Tree Analyses : to see the cause and effect of disasters
• Secondary Data:
collected relevant to WDRP indicators:
LIU, SERA Project, Risk baseline, other ministries…
Sampling Technique:
• Multistage cluster sampling
• Both Probability and Non-probability sampling
Methods of Analysis:
• Descriptive Statistics
• Textual Analysis
• Cispro and SPSS
• Automate WDRP software

WEREDA
SUMMARY DISASTER RISK PROFILE
INFORMATION
Wereda Disaster Risk Profiling Programme: SNNPR
Disaster Risk Profile: Mirab Abaya Wereda (January 2017)
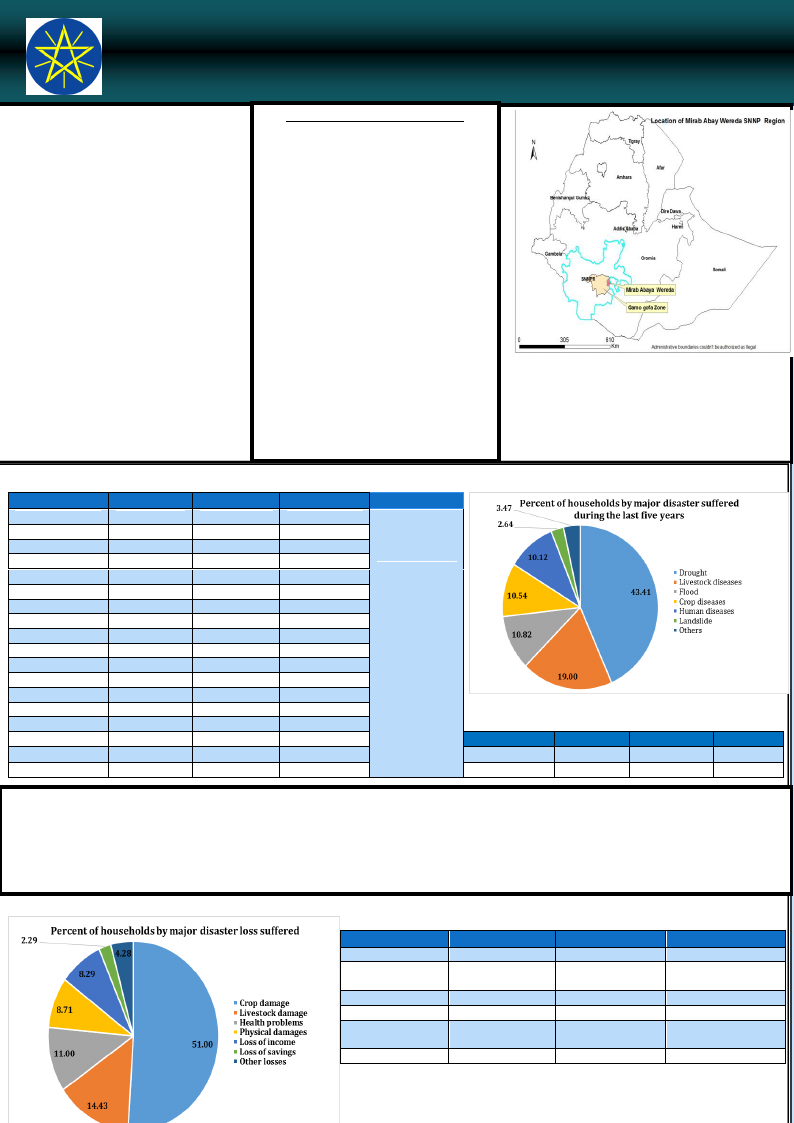
SUMMARY OF WEREDA PROFILE
Drought, livestock diseases (mainly
Trypanasomiasis), flooding, crop diseases
and pests and human diseases (Malaria)
are the major disaster risks reported in
the wereda. Soil erosion and deforestation
are the main environmental problems.
Lack of pure water, lack of environmental
sanitation, poor access to drought and
disease resistant crops, poor agronomic
practices, low access to irrigation and
poor saving and economic condition are
the major vulnerability factors.
Developing irrigation, water harvesting,
increasing soil and water conservation,
improving veterinary services and
developing water sources are the major
interventions required. Infrastructure
development (health, road and school),
strengthening livelihood diversification
and saving habits and awareness creation
on disaster risk reduction activities are
also desired.
LIVELIHOOD ZONE SUMMARY
Chamo-Abaya Irrigated Banana (CIB)
Livelihood Zone
This zone is essentially food secure and,
despite erratic rainfall, is one of the most
prosperous in the Region. The main road to
Addis Ababa allows most of the bulk
produced bananas to be sold in Addis Ababa.
Not all kebeles have access to irrigation, and
the main cash crop is cotton, sold in Awassa
and Addis for processing. The dominant food
crop is maize. Abundant pastures mean that
even poor households keep three to five cattle.
Gamo Gofa Maize and Root Crop
(GMR) Livelihood Zone
This zone is characterized by small
landholdings, low soil fertility, frequent
rainfall
irregularities,
endemic
trypanosomiasis and relative isolation, and is
highly food-insecure. Less than one in five
households are normally self-sufficient in
staple food. Enset and root crops are
important drought-resistant crops, but food
shortage forces most households to cut their
Enset before it matures.
MAJOR DISASTERS REPORTED IN WEREDA
Kebele
Algae
Ankober
Delbo
Doshe
Faraosa
Fetele
Pura
Layo Terga
Molle
Moreda
Kola Banena
Kola Mulato
Korga Geramo
Ugayo
Umo Lante
Wanke Wagefo
Woye Barena
Yayeke
Disaster 1
Livestock dis.
Flood
Drought
Drought
Drought
Drought
Drought
Drought
Drought
Drought
Drought
Drought
Drought
Drought
Flood
Drought
Drought
Drought
Disaster 2
Drought
Drought
Flood
Livestock dis.
Livestock dis.
Livestock dis.
Livestock dis.
Flood
Livestock dis.
Crop disease
Livestock dis.
Livestock dis.
Livestock dis.
Livestock dis.
Drought
Livestock dis.
Flood
Livestock dis.
Disaster 3
Water logging
Livestock dis.
Livestock dis.
Human dis.
Crop diseases
Livestock dis.
Flood
Human dis.
Flood
Human dis.
Flood
Human dis.
Livestock dis.
Flood
Livestock dis.
Flood
LIU Info
Chronic
Hazards:
CIB LZ:
Erratic rainfall,
livestock
diseases and
malaria
GMR LZ:
Rainfall
shortage, crop
pests,
Trypanosomia
sis, market
price
fluctuation and
malaria
Kebele
Zala Gutesha
Zala Barana
Disaster 1
Crop dis.
Drought
Disaster 2
Drought
Crop dis.
Disaster 3
Landslide
Livestock
SHORT NARRATIVE ON MAJOR DISASTERS:
Drought is the major disaster risk which causes crop and livestock damage, loss of water sources and prevalence of human and livestock diseases.
Trypanasomiasis is the most prevalent livestock disease in the wereda followed by Foot and Mouth disease, Black leg and Anthrax. Flooding
affects most kebeles in the wereda (particularly Ankober, Umo Lante and Zala Gutesha kebeles) from April to July. Malaria is the main health
problem in the wereda which is caused by presence of ponds, lake, hot weather condition and lack of environmental sanitation. Prevalence of
diarrhea, typhoid and typhus is also reported. On the other hand, crop diseases and pests are additional constraints in crop production.
Disasters
Drought
Livestock
disease
Flooding
Crop diseases
Human diseases
Landslides
EFFECT OF DISASTERS
Loss 1
Crop damage
Death of animals
Crop damage
Crop damage
Death and illness
Crop damage
Loss 2
Livestock damage
Loss of animal
products
Death of animals
Loss of income
Loss of working
manpower
Damage roads
Loss 3
Loss of food
Loss of income
Soil erosion
Lack of food
Loss of income
Damage infrastruct.
Wereda Disaster Risk Profiling Programme: SNNPR
Disaster Risk Profile: Mirab Abaya Wereda (January 2017)
HOUSEHOLD AND COMMUNITY
VVULUNLENRERAABBILIILTITYY
Both crop and livestock production are the main livelihood activities
in the wereda. Crops are susceptible to rainfall shortage due to poor
access to drought tolerant and short maturing crop varieties,
shortage of irrigation water, lack of enough water harvesting
activities and poor agronomic practices. Some kebeles have access to
irrigation water from rivers, Abaya Lake and ponds, but very few of
them have used irrigation. Crops are also exposed to diseases and
pests due to lack of pesticides, poor agronomic practices (including
mono-cropping) and changing weather condition. On the other hand,
January and February are the most problematic months in terms of
water and pasture availability for livestock. Lack of periodic
vaccination, poor animal husbandry and favourable weather
condition for tse-tse fly exposed livestock to diseases.
Water logging, community settlement near Lake Abaya, presence of
ponds, high temperature, lack of environmental sanitation, poor
hygiene, food shortage (malnutrition) and lack of clean water
exposed households to major human diseases like malaria, diarrhea,
typhus and typhoid. Flood also affect the community due to sloppy
topography and lack of conservation works in some areas.
About 32% of the households have participated in cash-for-work
projects, while 16% have received food aid. Moreover, only 47% of
the households have managed to recover from disaster loss they
suffered implying weak resilience capacity of the community in the
wereda.
Accessibility:
Access to road and urban centre: it took households 22 minutes to reach the nearest paved road, while average time taken to reach the nearest
urban center is 2 hours. Of the total households surveyed, 48% of them are located in the community with electricity, and 42% of them are
actually connected to electric power. In most kebeles, access to market is good except seasonal market price fluctuation.
Access to veterinary facility: 2/3rd of the households reported to have good access to veterinary service and livestock drugs.
Access to agricultural extension service: good access to extension service has been reported in all Kebeles of the wereda, and 89% of the
households have received agricultural extension service.
Access to fertilizer, pesticides and improved seeds: 60% of the households have used chemical fertilizer, while only 15% of the households
have used pesticides in crop production. On the other hand, 83% of the households reported using improved variety of seeds.
Access to water and sanitation: 2/3rd of the households primarily obtain drinking water from communal tab and 91% of the households do not
use water treatments. On the other hand, 96% of the households use outdoor latrine (hole on plot).
Access to credit: 35% of the households have borrowed money mainly from formal lending institutions to pay for various expenses.
Level of Awareness and Institutional Development
The literacy level of the population above 7 years of age is 15%, out of which 25% of them
completed only below first grade level, while 46% and 26% of the population attended
primary and secondary school respectively. With regard to gender disparity in education,
proportion of female students dominates at below first grade level, but their number
dwindles and highly dominated by males as the education level gets higher. Of the total
households surveyed, 14% of them are female-headed households.
Community awareness about disaster risk management system and actors is good. There
are many community based organizations such as Edir (to facilitate funeral ceremonies
and other social affairs), Ekub (money saving association), Debo (to help each other during
agricultural activities such as weeding and hoeing), Fishing associations and cooperatives.
There are NGOs such as World Vision Ethiopia, UNICEF, IRC and other NGOs helping the
community during disasters and on development issues.
InfoBits:
Population
: 74901 (2007)
Sex ratio
: 1003 F/1000 M
Urban Population : 5831 (2007)
Mean Altitude : 1303 m
Mean Slope
: 3.7%
Road density
: 77 m/km2
Measles caseload : 12 (2004-2009)
Sources: Various Secondary Sources
COMMUNITY CAPACITY TO COPE
Major coping mechanisms adopted by households during disasters include selling more livestock than usual, consumption rather than sale of crop
surplus, borrowing of food/cash to purchase food and labour migration.
Collection and sale of fire wood and grasses, collection of wild fruits for consumption,
Strong social network and cooperation is available in the area where the community help each other through Edir, Debo and others.
Crop and livestock diversity: average number of crops grown is 2, and the major types of crops grown include maize, wheat, barley, teff,
sorghum, haricot bean, Enset and cotton. On the other hand, cattle, goat, sheep and donkey are the major types of livestock owned by households
in the wereda.
Some households take credit from formal lending institutions like Omo microfinance and banks and participate in income generating activities.
There is also fishing opportunity for some community from Lake Abaya. Poultry production, petty trade, beekeeping, mineral mining and
weaving are additional sources of income.
WDRP Indicators
Hazard Related Characteristics
1
Wereda Disaster
Risk Profile
National Disaster Risk Management
Commission (NDRMC)
Data_Collected_Date
Tuesday, November 5, 2019
Region S.N.N.P
Zone
GAMO GOFA
Wereda
MIRAB ABAYA
Selected Indicator
Biological Hazards of the Wereda
Hazard_Name
Hazard_Sub_Type
Crop diseases and pests
Cause_Of_Hazard
Crop diseases and pests
Change in weather condition
Mono-cropping and poor agronomic
practices
Lack of pesticides
Hazard_Sub_Type
Human diseases
• Malaria
• Diarrhea
• Typhoid
• Typhus
Water logging
Community settlement near Lake Abaya
Favourable weather condition for
mosquito reproduction in the area
High temperature
Lack of environmental sanitation
Poor hygiene
Lack of clean water
Food shortage and malnutrition
Hazard_Sub_Type
Livestock diseases
• Trypanosomiasis
• Foot and mouth disease
• Black leg
• Anthrax
Shortage of pasture
Lack of periodic vaccination
Poor animal husbandry
Favourable weather condition for
tse-tse fly reproduction in the area
which causes trypanosomiasis
Effects_Of_Hazard
Crop yield reduction
Crop damage
Lack of crop residues for livestock feed
Loss of income
Food shortage
School dropout
Illness
Death of humans
Loss of working manpower
Decrease human productivity
Loss of saving to cover medical expense
Loss of income
Death of animals
Lack of oxen for tillage
Loss of animal products
Loss of income
Loss of saving
Page 1 of 1
2
Wereda Disaster
Risk Profile
National Disaster Risk Management
Commission (NDRMC)
Data_Collected_Date
Tuesday, November 5, 2019
Region S.N.N.P
Zone
GAMO GOFA
Wereda
MIRAB ABAYA
Selected Indicator
Geological Hazards of the Wereda
Hazard_Name
Hazard_Sub_Type
Landslide
Cause_Of_Hazard
Landslide
Poor land use system
Poor cultivation system
Effects_Of_Hazard
Crop damage
Loss of cultivation land
Damage road
Page 1 of 1
3
Wereda Disaster
Risk Profile
National Disaster Risk Management
Commission (NDRMC)
Data_Collected_Date
Tuesday, November 5, 2019
Region S.N.N.P
Zone
GAMO GOFA
Wereda
MIRAB ABAYA
Selected Indicator
Hydro Metrological Hazards of the Wereda
Hazard_Name
Hazard_Sub_Type
Drought
Cause_Of_Hazard
Drought
Shortage of rainfall
Erratic rain
Deforestation
Agro-ecology of the area
Hazard_Sub_Type
Flood
Hazard_Sub_Type
Water logging
Flood
High rainfall
Topography
Poor land use system
Settlement near water area
Lack of enough water and soil
conservation works in some areas
Water logging
Deforestation
Topography of the area
Lack of enough soil and water
conservation works
Effects_Of_Hazard
Crop damage
Lack of pasture for animals
Shortage of food and water
Death of animals
Malnutrition
Occurrence of human and livestock
diseases
Loss of income
Migration of households for labour work
Households are exposed to credit
Damage houses, property and crops
Displacement
Death of human and animals
Student drop school out
Damage farm and grass land
Soil erosion
Land degradation
Loss of crop and pasture land
Damage on infrastructures
Displacement of people
Page 1 of 1
4

Wereda Disaster
Risk Profile
National Disaster Risk Management
Commission (NDRMC)
Data_Collected_Date
Tuesday, November 5, 2019
Region S.N.N.P
Zone
GAMO GOFA
Wereda
MIRAB ABAYA
Selected Indicator
Socio Economic Hazards of the Wereda
Hazard_Name
Hazard_Sub_Type
Socio-economic hazard
Cause_Of_Hazard
Socio-economic hazard
No socio-economic hazard is reported
Effects_Of_Hazard
Page 1 of 1
5

Wereda Disaster
Risk Profile
National Disaster Risk Management
Commission (NDRMC)
Data_Collected_Date
Tuesday, November 5, 2019
Region S.N.N.P
Zone
GAMO GOFA
Wereda
MIRAB ABAYA
Selected Indicator
Technological Hazards of the Wereda
Hazard_Name
Hazard_Sub_Type
Technological hazard
Cause_Of_Hazard
Technological hazard
No technological hazard is reported
Effects_Of_Hazard
Page 1 of 1
6

Wereda Disaster
Risk Profile
National Disaster Risk Management
Commission (NDRMC)
Data_Collected_Date
Tuesday, November 5, 2019
Region S.N.N.P
Zone GAMO GOFA
Wereda MIRAB ABAYA
Selected Indictor:
Kebele Name
ALGAE
Disaster Characteristics By Kebele
Disaster_Type Common Period
Year
Worst_ Trends of
Occured Year Effects
Livestock
diseases
February,
March, April
2000,
2005,
2006,
2007
2000
Increased
Drought
June, May
1982,
1983,
2005,
2006,
2007,
2008
Increased
Water Logging October
1990,
200
Increased
2003,
2005,
2006,
2007
Root Causes
Lack of
fodder, lack
of periodical
vaccination
Shortage of
rain fall
Climate
change,
deforestation
ANKOBER
Flood
April - November
1992,
2001,
2002,
2003
2002
Decreased High rain fall
Effects
Death of
livestock,
loss of
production
Crop yield
reduction,
loss of
income
Vulnerability
Shortage of fodder,
long journey of
animals, lack of
quality laboratory
They depend on
rain fed agriculture
Loss of crop
and pasture
land, damage
on
infrastructur
es,
displacement
of people
Damage
houses,
property and
crop,
displacement
, death of
human and
animals,
student drop
school out
Topography of the
land
The settlement is
vulnerable to flood,
topography.
Coping Strategy
Traditional and
medical treatment
Migration of youth,
migration to other
place to search for
job
Soil and water
conservation
activity, sharing
farming system
Evacuation, gabion
construction
7
Page 1 of 17

Wereda Disaster
Risk Profile
National Disaster Risk Management
Commission (NDRMC)
Data_Collected_Date
Tuesday, November 5, 2019
Region S.N.N.P
Zone GAMO GOFA
Wereda MIRAB ABAYA
Selected Indictor:
Kebele Name
ANKOBER
DELBO
Disaster Characteristics By Kebele
Disaster_Type Common Period
Year
Worst_ Trends of
Occured Year Effects
Drought
March, April,
May, June, July
1958,
1964,
1969,
1974,
1977,
2000
Increased
Root Causes
Erratic rain
fall
Livestock
diseases
April -
September
1983,
1984,
1992,
2000,
2008
1983
Decreased
Poor livestock
management
system, lack
of pasture
Drought
January,
February,
March, April,
May, June, July,
August
1956,
1977,
1980,
1983,
2004,
1977
Increased
Shortage of
rain fall, lack
of adequate
irrigation
water
Effects
Vulnerability
Migration,
loss of
income, yield
reduction,
death of
humans and
animals
Lack of oxen
for land
tillage, loss
of income,
loss of
animal and
their
products
Loss of
income,
student drop
out, exposed
to credit and
loan,
exposed to
malnutrition
Population number
increasing, climate
change, lack of rain
fall
Lack of job
opportunities in the
community, poor
capacity of the
community,
shortage of
cultivated land
Coping Strategy
Collection of fire
wood and grass,
harvesting forest
fruit, growing
drought tolerant
crop, labour,
migration
Traditional
treatment and
medical treatment
Fire wood selling,
using savings,
livestock sale, labor
work, sharing
resources
8
Page 2 of 17

Wereda Disaster
Risk Profile
National Disaster Risk Management
Commission (NDRMC)
Data_Collected_Date
Tuesday, November 5, 2019
Region S.N.N.P
Zone GAMO GOFA
Wereda MIRAB ABAYA
Selected Indictor:
Kebele Name
DELBO
Disaster Characteristics By Kebele
Disaster_Type Common Period
Flood
March, April,
July, August,
June, October,
November
Year
Occured
1975,
1991,
2001,
2003,
2008
Worst_
Year
2003
Trends of
Effects
Increased
Root Causes
Poor land use
system,
deforestation
Livestock
diseases
January,
February,
March, April,
May
1982,
1986,
2000 -
2008
1983
Increased
Lack of
pasture, lack
of medicine,
shortage of
grass land
DOSHE
Drought
April, May,
June, July,
September,
October
1954,
1955,
1967,
1977-
1980,
2001
Increased
Shortage of
rain fall
Effects
Vulnerability
Loss of
cultivation
land, damage
crops, soil
erosion, loss
of soil
fertility
Loss of
income,
children and
pregnant
women are
more
affected
because of
livestock
product
shortage,
lack of oxen
for tillage
Migration,
causes
disease
incidence
due to loss of
immunity
River side
cultivation,
topography of the
community, lack of
reporting
Favorable weather
condition for tsetse
fly reproduction,
lack of livestock
clinic in the
community.
Geographical aspect
which is vulnerable
to drought, dry low
land, rain fed
agricultural
practice
Coping Strategy
Active community
participation in soil
and water
conservation, gabion
and wood bund
construction
Traditional
treatment, sell
livestock, isolation
of disease affected
animals from healthy
ones, shift livestock
production to other
Collection of fire
wood and grass for
sale, labour work,
temporary
migration, harvesting
forest fruit
9
Page 3 of 17

Wereda Disaster
Risk Profile
National Disaster Risk Management
Commission (NDRMC)
Data_Collected_Date
Tuesday, November 5, 2019
Region S.N.N.P
Zone GAMO GOFA
Wereda MIRAB ABAYA
Selected Indictor:
Kebele Name
DOSHE
FARAOSA
Disaster Characteristics By Kebele
Disaster_Type Common Period
Livestock
diseases
February,
March, April
Year
Occured
1963,
1983,
1998,
2008
Worst_
Year
1983
Trends of
Effects
Decreased
Root Causes
Absence of
vaccination
and
treatment,
shortage of
food, drought
Human
diseases
February,
March, April
1988,
1989,
1991,
1992,
1998
1984
Decreased
Mosquito
reproduction
in the area,
high
temperature
Drought
March - July
1991,
1977,
997,
1983,
1990
1983
Increased
Shortage of
rain fall
Livestock
diseases
March, April,
May
1954,
1955,
1956,
1984,
1985,
2008
Increased
Shortage of
pasture
Effects
Loss of
income, loss
of animal
production,
loss of oxen
for tillage
Loss of
income,
death of
humans
Crop
damage,
death of
animals,
human
disease
Low income,
school drop
out
Vulnerability
Lack of pasture,
traditional
management system
Temperature is very
high
Settlement of the
people
Poor management
of animals
Coping Strategy
Local treatment,
medical treatment
Traditional
treatment, medical
treatment
Labour work, selling
livestock more than
usual
Medical treatment,
collect fodder, zero
grazing
10
Page 4 of 17

Wereda Disaster
Risk Profile
National Disaster Risk Management
Commission (NDRMC)
Data_Collected_Date
Tuesday, November 5, 2019
Region S.N.N.P
Zone GAMO GOFA
Wereda MIRAB ABAYA
Selected Indictor:
Kebele Name
FETELE
Disaster Characteristics By Kebele
Disaster_Type Common Period
Drought
January, August
Year
Occured
1962,
1977,
1983,
1991,
1998,
Worst_
Year
1977
Trends of
Effects
Increased
Root Causes
Shortage of
rain fall
Livestock
diseases
March, April,
May, June. July,
August
1983,
1998,
2000,
2003 -
2008
1983
Increased
Lack of
forage
PURA
Drought
January - August
1967,
1977,
1991,
1992,
1993,
1977
Increased
Shortage of
rain fall
Effects
Vulnerability
Loss of
income,
student drop
out, credit
and loan,
death of
animals
Loss of
income,
death of
livestock,
lack of oxen
for land
tillage
Loss of
income,
exposed to
credit and
loan,
migration for
labour work,
student drop
out,
household
renting of
their
cultivation
land
Lack of irrigation
water
Lack of awareness,
lack of livestock
clinic, skilled man
power
Lack of irrigation
water supply,
shortage of
cultivation land
Coping Strategy
Using forest fruits,
sharing resources
Isolation,
preparation of
traditional
medicines, selling
livestock
Fire wood collection
from forest, selling
livestock in cheap
price, cut and carry
grass and sell to buy
food
11
Page 5 of 17

Wereda Disaster
Risk Profile
National Disaster Risk Management
Commission (NDRMC)
Data_Collected_Date
Tuesday, November 5, 2019
Region S.N.N.P
Zone GAMO GOFA
Wereda MIRAB ABAYA
Selected Indictor:
Kebele Name
PURA
Disaster Characteristics By Kebele
Disaster_Type Common Period
Year
Worst_ Trends of
Occured Year Effects
Livestock
diseases
January - July
1967,
1977,
1983,
2000,
2003 -
1983
Increased
Root Causes
Lack of
fodder, poor
access to
livestock
veterinary
service
Effects
Lack of oxen
for tillage,
livestock
product loss,
loss of
income
Vulnerability
Shortage of periodic
treatment, lack of
sufficient grazing
land, lack of
awareness
Flood
September,
October, July,
August
1975,
1991,
2001,
2004 -
2008
2003
Increased
Poor land use
system,
deforestation
Crop
damage, loss
of asset, loss
of cultivation
land, loss of
soil fertility
Topography of the
community, lack of
soil and water
conservation
activities
LAYO TERGA
Drought
April, May,
June,
September,
October
1965,
1977,
1991,
2000,
2004,
1977
Increased
Weather and
climate
change, lack
of irrigation
water
Student drop
out,
migration for
labour, loss
of income,
fodder
shortage,
death of
animals
Weather change,
lack of irrigation
water
Coping Strategy
Selling livestock in
cheap price,
isolation of
livestock, prepare
traditional
medication from
different crop
species
Soil and water
conservation
activities, soil and
stone bund
construction, gabion
construction,
afforestation, area
closure of affected
area, evacuation
from the area
Labour work,
collection of fire
wood for sale, selling
livestock with low
price, eat different
forest fruits and
vegetables,
evacuation
12
Page 6 of 17

Wereda Disaster
Risk Profile
National Disaster Risk Management
Commission (NDRMC)
Data_Collected_Date
Tuesday, November 5, 2019
Region S.N.N.P
Zone GAMO GOFA
Wereda MIRAB ABAYA
Selected Indictor:
Kebele Name
LAYO TERGA
Disaster Characteristics By Kebele
Disaster_Type Common Period
Year
Worst_ Trends of
Occured Year Effects
Flood
April, May, July,
August,
September,
October
1976,
1982,
2005,
2008
2008
Increased
Root Causes
Deforestation
, poor land
use system
Livestock
diseases
March, April,
October,
November
1978,
1983,
2005 -
2008
1978
Increased
Lack of
fodder
Crop diseases
March, June,
October,
November
1978,
1983,
1996,
1998,
2000 -
2007
Increased
Lack of crop
rotation, lack
of pesticide
Effects
Crop
damage,
famine,
erosion, loss
of income,
reduce soil
fertility
Loss of
income, lack
of oxen for
land tillage,
exposed to
credit and
loan, loss of
livestock
product
Loss of crop
yield, credit
and loan,
school drop
out
Vulnerability
Poor land use
system, topography
of the community
Climate and
weather change
Poor field
sanitation, climate
change
Coping Strategy
Soil and water
conservation
activities, cut off
drain, afforestation,
soil and stone bund
construction
Isolate affected
livestock from
healthy animals
Traditional methods,
use of new
technologies
13
Page 7 of 17

Wereda Disaster
Risk Profile
National Disaster Risk Management
Commission (NDRMC)
Data_Collected_Date
Tuesday, November 5, 2019
Region S.N.N.P
Zone GAMO GOFA
Wereda MIRAB ABAYA
Selected Indictor:
Kebele Name
MOLLE
Disaster Characteristics By Kebele
Disaster_Type Common Period
Drought
June, May
Year
Occured
1967,
1977,
2000,
2008
Worst_
Year
1977
Trends of
Effects
Increased
Root Causes
Shortage of
rain fall
MOREDA
Livestock
diseases
Flood
Drought
March, April,
May
April, July
October,
November,
December,
April, May,
June, July
1958,
1983,
2008
1983
Increased
Lack of
grazing land,
poor
management
of animals
1975,
2002,
2008
2002
Decreased Deforestation
, high rainfall
1957,
1977,
1983 -
1988,
1991
1991
Increased
Lack of rain
fall
Effects
Vulnerability
Crop and
livestock
damage,
famine,
income loss,
exposed to
diseases/mal
aria, school
drop out
Loss of
production,
income loss
Loss of asset,
temporary
evacuation,
crop damage
Loss of crop
yield, loss of
pasture,
migration,
loss of
income,
student
dropout
Not sufficient
irrigation water,
high population
density, topography
of the land
Lack of veterinary
service, poor
laboratory quality,
long journey of
animals for pasture
and water
Topography of the
land, community
near to river belt
Agro-ecology of the
area
Coping Strategy
Collecting different
forest fruits, labor
work, selling forest
products/fire wood,
saving crop product
Traditional and
medical treatment
Soil and water
conservation
Collection and sale
of fire wood and
grass, temporary
migration, selling
more livestock than
usual
14
Page 8 of 17

Wereda Disaster
Risk Profile
National Disaster Risk Management
Commission (NDRMC)
Data_Collected_Date
Tuesday, November 5, 2019
Region S.N.N.P
Zone GAMO GOFA
Wereda MIRAB ABAYA
Selected Indictor:
Kebele Name
MOREDA
KOLA BANENA
Disaster Characteristics By Kebele
Disaster_Type Common Period
Year
Worst_ Trends of
Occured Year Effects
Crop diseases
April, May, July,
September,
January.
1983 -
2008
2000
Increased
Drought
January - July
1980,
1983,
1984,
1990 -
1994,
1991
Increased
Root Causes
Climate
change
Shortage of
fain fall,
scarcity of
irrigation
water
Effects
Reduction of
yield, crop
damage
Animal loss,
selling asset,
death of
humans
Vulnerability
Poor fertility of soil
and degraded land
Deforestation
Livestock
diseases
Flood
March, April,
May, June
July
2003,
2004,
2005,
2008
2002 -
2008
2008
Increased
Drought,
fodder
shortage
Low income,
loss of
animals
Poor animal
management,
fodder shortage
2002
Increased Deforestation Crop damage
KOLA MULAT0
Drought
January,
February,
March, April,
May, June, July,
August
1968,
1977,
1980,
1991,
1994,
1977
Increased
Lack of rain
fall, shortage
of irrigation
15
Death of
human being,
decrease
income,
famine,
evacuation/t
emporary
displacement
of
households
Agro-ecology of the
area
Coping Strategy
Chemical spraying
Soil and water
conservation,
construct water
harvesting
structures, loan from
credit institutions
Traditional
treatment, medical
treatment
Watershed
management
activity, gabion
treatment
Sharing resources,
collect fresh fruits,
selling fire woods
Page 9 of 17

Wereda Disaster
Risk Profile
National Disaster Risk Management
Commission (NDRMC)
Data_Collected_Date
Tuesday, November 5, 2019
Region S.N.N.P
Zone GAMO GOFA
Wereda MIRAB ABAYA
Selected Indictor:
Kebele Name
KOLA MULAT0
Disaster Characteristics By Kebele
Disaster_Type Common Period
Year
Worst_ Trends of
Occured Year Effects
Livestock
diseases
June, March
1987,
1990,
2001 -
2008
1987
Increased
Root Causes
Shortage of
fodder,
grazing land
Flood
April, July
1978,
1998,
2008
Increased
Deforestation
, poor land
use system
KORGA GERAMO
Drought
December - July
1977,
1983 -
1998,
1990 -
1997
1984
Increased
Shortage of
ran fall
Effects
Decrease
income,
decrease
livestock
production,
lack of oxen
for land
tillage
Loss of
cultivation
land, loss of
crop/cash
crop, loss of
asset,
damage
cultivation
land
Death of
humans,
migration,
income loss,
labour work,
school drop
out
Vulnerability
Lack of awareness
Topography of the
land, settlement of
community
Rain fed
agricultural system
Coping Strategy
Cultural treatment
Soil and water
conservation, gabion
construction
Collect and sell
charcoal, wood and
grass, eating forest
food
16
Page 10 of 17

Wereda Disaster
Risk Profile
National Disaster Risk Management
Commission (NDRMC)
Data_Collected_Date
Tuesday, November 5, 2019
Region S.N.N.P
Zone GAMO GOFA
Wereda MIRAB ABAYA
Selected Indictor:
Kebele Name
KORGA GERAMO
UGAYO
Disaster Characteristics By Kebele
Disaster_Type Common Period
Livestock
diseases
January -
September
Year
Occured
1983 -
1986,
1988 -
2008
Worst_
Year
1987
Trends of
Effects
Increased
Root Causes
Lack of
pasture
Flood
March -
November
2004,
2005,
2006,
2007,
2008
2008
Increased
Climate
change/high
rain fall, road
construction
Human
diseases
Drought
April -
September
2002 -
2008
2008
Increased
Poverty, high
temperature
April - August
1957,
1967,
1977,
1983,
1983,
1977
Increased
Shortage of
rain fall,
shortage of
irrigation
water
17
Effects
Vulnerability
Loss of oxen,
income loss,
reduction of
livestock
production,
poverty
Damage
property and
house,
damage crop
yield, death
of animal,
damage
cultivated
land
Loss of
income,
death of
humans
Renting
cultivation
land, death
of humans,
displacement
of
community,
school drop
out
Traditional rearing
system, high
temperature,
shortage of grazing
land
The upper part of
the community is
mountain, lake
Abaya is near
residence
Climate change
Lack of irrigation
water
Coping Strategy
Medical treatment,
vaccination, using
traditional medicine
Evacuation, soil and
water conservation
activity, area closure
Medical treatment
and traditional
treatment
Migration, collecting
and selling fire
wood, labour work,
fishing, collect wild
fruit
Page 11 of 17

Wereda Disaster
Risk Profile
National Disaster Risk Management
Commission (NDRMC)
Data_Collected_Date
Tuesday, November 5, 2019
Region S.N.N.P
Zone GAMO GOFA
Wereda MIRAB ABAYA
Selected Indictor:
Kebele Name
UGAYO
UMO LANTE
Disaster Characteristics By Kebele
Disaster_Type Common Period
Year
Worst_ Trends of
Occured Year Effects
Root Causes
Livestock
diseases
January - July
1977,
1978,
1982,
1983,
1997,
1983
Increased
Lack of
fodder, lack
of sufficient
treatment
Human
diseases
July - October
1964,
1980,
1995,
2007
1964
Increased
Lack of
clinical
service and
laboratory
instrument
Flood
April - November
1996 -
2006
2003
Decreased
High rain fall,
deforestation
, topography
Drought
March - August
2001,
2004,
2006,
2007,
2008
2008
Increased
Shortage of
rain fall,
erratic rain
fall, delay of
rain fall
Effects
Vulnerability
Exposed to
credit and
loan,
increase
joblessness
Death of
humans
Lack of sufficient
hospital, high cost
for treatment
Damage crop
and
property,
loss of
income, loss
of cultivated
land, death
of human
being
Poverty,
economic
loss,
migration,
reduction of
crop yield,
deforestation
The community
settlement were
below the river,
lack of awareness
to prevent flood
High immigration,
shortage of land
Coping Strategy
Firing body of
livestock, cutting
tongue and ear
Reporting to
governmental
institution, tradition
treatment
Construction of
gabion on river
banks, construction
of different physical
and biological soil
and water
conservation
activities.
Labour work,
out-migration, eating
forest fruit,
harvesting wood
grass, making
charcoal
18
Page 12 of 17

Wereda Disaster
Risk Profile
National Disaster Risk Management
Commission (NDRMC)
Data_Collected_Date
Tuesday, November 5, 2019
Region S.N.N.P
Zone GAMO GOFA
Wereda MIRAB ABAYA
Selected Indictor:
Kebele Name
WANKE WAGEFO
Disaster Characteristics By Kebele
Disaster_Type Common Period
Year
Worst_ Trends of
Occured Year Effects
Root Causes
Drought
May, June, July
1966,
1997,
1972,
1983,
1977,
1967
Decreased Lack of rain
fall
Livestock
diseases
June, July,
August
1969,
2000 -
2008
1980
Decreased
Shortage of
fodder,
un-periodic
vaccination,
lack of
laboratory
Flood
February, May,
1970,
200
Increased Deforestation
June, September 1980,
, poor land
1988,
use system,
1995,
lack of soil
2000,
and water
conservation
Effects
Vulnerability
Crop loss,
famine,
death of
human and
livestock,
migration,
school drop
out
Loss of
income,
manual
tillage due to
lack of oxen,
loss of
livestock
products
Loss of asset,
evacuation,
death of
humans,
damage on
farm land,
loss of
ornaments
Unwise use of
natural resources,
shortage of
cultivation land,
shortage of
irrigation water
Lack of awareness
Lack of awareness
in soil and water
conservation,
topography of the
area
Coping Strategy
Eat different
vegetable roots and
forest fruit and
borrow food from
relatives
Traditional
treatment, collect
tree leaves and grind
with water for
treatment
Soil and water
conservation
19
Page 13 of 17

Wereda Disaster
Risk Profile
National Disaster Risk Management
Commission (NDRMC)
Data_Collected_Date
Tuesday, November 5, 2019
Region S.N.N.P
Zone GAMO GOFA
Wereda MIRAB ABAYA
Selected Indictor:
Kebele Name
WOYE BARENA
YAYEKE
Disaster Characteristics By Kebele
Disaster_Type Common Period
Drought
February, -
September
Year
Occured
2000,
2002,
2003,
2007,
2008
Worst_
Year
2008
Trends of
Effects
Increased
Root Causes
Climate
change,
change in
season of rain
fall
Flood
Livestock
diseases
Drought
July, August,
June
March,
February, April
1992,
1998,
2000,
2004
1998,
2000,
2007,
2008
February - July
1970,
1977,
1980,
1986,
1991,
1998
Decreased Deforestation
1998
1992
Increased
Increased
Shortage of
fodder, poor
accessibility
to veterinary
service
Shortage of
rain fall
Effects
Vulnerability
Human
disease, crop
damage,
death of
animals and
loss of
income
Soil erosion,
damage crop
Climate change
Topography of the
land
Loss of
animals,
decrease
income
Topography of the
land
Loss of asset,
students
dropout,
migration,
community
health
problem,
income loss
Rain fed agriculture
Coping Strategy
Pasture production,
goat and sheep
husbandry, labor
work
Plantation of grass,
plantation of forest
tree
Medical and
traditional treatment
Labour work,
migration, relief
from government,
sell fire wood and
grass, harvesting
forest fruit and
vegetables
20
Page 14 of 17

Wereda Disaster
Risk Profile
National Disaster Risk Management
Commission (NDRMC)
Data_Collected_Date
Tuesday, November 5, 2019
Region S.N.N.P
Zone GAMO GOFA
Wereda MIRAB ABAYA
Selected Indictor:
Kebele Name
YAYEKE
Disaster Characteristics By Kebele
Disaster_Type Common Period
Livestock
diseases
April, May, June
Year
Occured
1963,
14983,
1998,
2008
Worst_
Year
1983
Trends of
Effects
Decreased
Root Causes
Lack of
periodic
vaccination,
drought
Flood
April
19841,
1993
1993
Decreased High rain fall
ZALA GUTESHA
Flood
March, April,
June, July,
August
1970 -
2008
1993
Increased
Poor land use
system, high
rain fall
Effects
Vulnerability
Loss of
income, loss
of livestock
production
and
productivity,
death of
livestock
Evacuation,
damage
houses and
property,
death of
livestock
Decrease
production,
loss of soil
fertility, loss
of income,
temporary
displacement
, evacuation
of
community,
crop damage
Lack of pasture,
traditional
management system
of livestock
Settlement of
community near
river
Topography,
deforestation,
population number
increment, not
much cultivation
land
Coping Strategy
Traditional
treatment, medical
treatment, isolation
Gabion construction,
water and soil
conservation
activities
Soil and water
conservation, sharing
of resource, labour
and materials
21
Page 15 of 17

Wereda Disaster
Risk Profile
National Disaster Risk Management
Commission (NDRMC)
Data_Collected_Date
Tuesday, November 5, 2019
Region S.N.N.P
Zone GAMO GOFA
Wereda MIRAB ABAYA
Selected Indictor:
Kebele Name
ZALA GUTESHA
Disaster Characteristics By Kebele
Disaster_Type Common Period
Drought
June, October
Year
Occured
1967,
1970,
1977,
1980,
1983,
Worst_
Year
1977
Trends of
Effects
Increased
Root Causes
Fluctuation of
weather
Landslide
July, August,
September,
October
Crop diseases
April, May,
June,
December,
November
1993,
1998,
2002,
2004,
2008
2003,
2004,
2006,
2007,
2008
1993
Increased
Poor land use
system, poor
cultivation
system
2008
Increased
Poor
agronomic
practices
Effects
Vulnerability
Famine,
evacuation/y
outh/,
production
decrease,
income
decrease,
exposed to
credit and
loan
Crop
damage, loss
of cultivation
land, damage
road
Lack of sufficient
cultivation land.
Type of soil, lack of
soil and water
conservation
Crop
damage,
food
shortage,
loss of
income,
exposed to
credit and
loan
Shortage of
cultivation land,
lack of resistance
variety, shortage of
insecticide
Coping Strategy
Selling wood and
grass, labour work,
evacuation, eat wild
fruits
Sharing resources
/money, labour and
etc.
Reporting to
government, cultural
and traditional
treatment
22
Page 16 of 17
Wereda Disaster
Risk Profile
National Disaster Risk Management
Commission (NDRMC)
Data_Collected_Date
Tuesday, November 5, 2019
Region S.N.N.P
Zone GAMO GOFA
Wereda MIRAB ABAYA
Selected Indictor:
Kebele Name
ZALA GUTESHA
ZALA BARANA
Disaster Characteristics By Kebele
Disaster_Type Common Period
Livestock
diseases
March, June,
October
Year
Occured
1983,
1998,
2000,
2007
Worst_
Year
1983
Trends of
Effects
Decreased
Root Causes
Weather
change/clima
te change
Drought
April, May,
June,
September,
October,
November
1967,
1977,
2000,
2003,
2008
2008
Increased
Shortage of
rain fall
Crop pest and
crop disease
April, May,
August,
September
1999,
2000,
2003,
2008
2008
Increased
Bacteria and
virus
IMPORTANT: The years and months mentoned in this report are according to Ethiopian Calendar (EC).
Effects
Livestock
production
decrease
Vulnerability
Lack of
laboratory/veterina
ry service
Poverty, lack
of pasture,
migration,
economical
crises,
students
dropout
Loss of yield,
loss of asset,
poverty
Topography
Coping Strategy
Treatment
Selling animals, eat
forest fruit, wood
and grass harvesting,
labour work, rent
out farm land
Using traditional and
chemical treatment
23
Page 17 of 17
Wereda Disaster
Risk Profile
Data_Collected_Date
Region S.N.N.P
Zone GAMO GOFA
Selected Indictor:
KebeleName
ALGAE
Hazards: Conflict as an Issue
Description_Of_Conflict
No conflict
ANKOBER
No conflict
DELBO
No conflict
DOSHE
Conflict
FARAOSA
No conflict
FETELE
No conflict
PURA
No conflict
LAYO TERGA
No conflict
MOLLE
No conflict
MOREDA
No conflict
KOLA BANENA
KOLA MULAT0
No
KORGA GERAMO
No conflict
UGAYO
UMO LANTE
No
No conflict
WANKE WAGEFO
WOYE BARENA
No
Medium
National Disaster Risk Management
Commission (NDRMC)
Tuesday, November 5, 2019
Wereda MIRAB ABAYA
Change_In_Last_Decade
Main_Causes_Of_Conflict
Increased
Land boundary
No change
24
Communal land demand
Page 1 of 2
Wereda Disaster
Risk Profile
Data_Collected_Date
Region S.N.N.P
Zone GAMO GOFA
Selected Indictor:
KebeleName
YAYEKE
Hazards: Conflict as an Issue
Description_Of_Conflict
Medium
ZALA GUTESHA
No
ZALA BARANA
No conflict
National Disaster Risk Management
Commission (NDRMC)
Tuesday, November 5, 2019
Wereda MIRAB ABAYA
Change_In_Last_Decade
Increased
Main_Causes_Of_Conflict
Expansion of border land
25
Page 2 of 2

Wereda Disaster Risk
Profile
Data_Collected_Date
National Disaster Risk Management
Commission (NDRMC)
Tuesday, November 5, 2019
Region S.N.N.P
Zone
GAMO GOFA
Wereda
MIRAB ABAYA
Selected Indicator: Hazard Situation During Last Disaster - Characteristics of most recent disasters that affected the community
KebeleName
Types of Disasters
Hazard_Description
Effect_Of_Disaster
Most_Severly_Affected
Reason
ALGAE
ANKOBER
DELBO
Drought
Drought
Drought
DOSHE
FARAOSA
FETELE
PURA
Drought
Drought
Drought
Drought
The magnitude of the disaster is
severe and the duration is long period
of time
Magnitude of disaster is severe,
duration of disaster is for 12 - 18
months
The magnitude of disaster was
medium, duration for long period of
time, frequency repeated every year,
severity of disaster is medium
High magnitude and long period
duration
The magnitude of the disaster is
severe for long period of time
The magnitude of drought is medium
and duration of drought was seasonal
The magnitude is medium, duration
of drought is seasonal and the
severity of the disaster is medium
Crop yield reduction,
livestock death,
famine, human
disease
Labour, migration
Children, women and
pregnant and lactating
women
Children, pregnant and
lactating women, elders
Exposed to credit and
loan and crop and
livestock damage
Migration, poverty,
prevalence of diseases
Asset loss, exposed
diseases
Disabled person, women
and the poor are more
affected because of poor
capacity to cope the
disaster
Children, elders,
lactating and pregnant
women
Children, elders, women
and poor
Migration for labour
and the community is
exposed to credit
Community exposed to
credit and loan,
labour migration
Disabled person,
children, pregnant and
lactating women and
others
Disabled people,
women, children
They have no
capacity to resist
They are dependent
on others
Because of poor
capacity, shortage
of resources, lack
of savings
They cannot
migrate for job
opportunities
Because their
economic capacity
is low
Lack of capacity
Because they have
no capacity to cope
the disaster
26
Page 1 of 3

Wereda Disaster Risk
Profile
Data_Collected_Date
National Disaster Risk Management
Commission (NDRMC)
Tuesday, November 5, 2019
Region S.N.N.P
Zone
GAMO GOFA
Wereda
MIRAB ABAYA
Selected Indicator: Hazard Situation During Last Disaster - Characteristics of most recent disasters that affected the community
KebeleName
Types of Disasters
Hazard_Description
Effect_Of_Disaster
Most_Severly_Affected
Reason
LAYO TERGA
MOLLE
MOREDA
KOLA BANENA
KOLA MULAT0
KORGA GERAMO
UGAYO
Drought, crop disease
Drought
Drought
Drought
Drought
Flood
Magnitude of the disaster is high in
both cases, the disasters increased
The magnitude of the disaster is
severe /large, and the durations long
period of time
The magnitude of the drought is high,
the duration of the drought is
medium
The magnitude of the disaster is
severe and the durations is long
period of time
The magnitude of drought was
medium, duration of the disaster is
seasonal and frequent
Medium magnitude and short duration
Livestock disease, crop
disease, drought
The magnitude of disasters is high,
duration of the disaster is for medium
period of time
Migration for labour
and the community is
exposed to credit
Asset loss, exposed
diseases/malaria,
typhoid, typhus.
Loss of income
Asset loss, exposed
diseases (malaria,
typhus, typhoid)
Migration for labour
and the community is
exposed to credit
Death of animals,
damage property and
houses, crop yield
reduction, gully
formation
Loss of income, crop
yield reduction, death
of livestock due to
shortage of rain fall
and lack of irrigation
water
Children, women,
disabled person and
elders are more affected
Children, elders,
pregnant and lactating
women.
Children, lactating and
pregnant women, elders
Children, pregnant and
lactating women, elders
Disabled, children,
elders, pregnant and
lactating women
All crops and animals
Because of poor
economic capacity
Because of poor
economic capacity
Because of their
dependence on
their family
Because of poor
economic capacity
Lack of capacity to
cope the disaster
They are dependent
on others
27
Page 2 of 3
Wereda Disaster Risk
Profile
Data_Collected_Date
National Disaster Risk Management
Commission (NDRMC)
Tuesday, November 5, 2019
Region S.N.N.P
Zone
GAMO GOFA
Wereda
MIRAB ABAYA
Selected Indicator: Hazard Situation During Last Disaster - Characteristics of most recent disasters that affected the community
KebeleName
Types of Disasters
Hazard_Description
Effect_Of_Disaster
Most_Severly_Affected
Reason
UMO LANTE
Drought
WANKE WAGEFO
Flood
WOYE BARENA
YAYEKE
Drought
Drought
ZALA GUTESHA
Drought
ZALA BARANA
Drought
The magnitude of drought is medium,
duration of drought is short period
Magnitude of disaster is medium
Magnitude is medium, long duration
Magnitude of the incident is severe,
duration of the incident is long period
The magnitude of drought is medium
and duration is seasonal
Magnitude of the disaster is medium,
duration of the disaster is long period
Loss of income,
economic crisis,
deforestation for
charcoal and fire
wood sale
Loss of asset,
temporary
displacement
Reduction of yield,
income loss
Migration, loss of
income and loss of
asset
Migration for labour
and the community is
exposed to credit
Crop damage, food
shortage, death of
animals, economical
hardship, loss of asset
Children, pregnant and
lactating women and
elders
Those households living
near river side
Women, children and
elders
Children, lactating and
pregnant women and
elders
Disabled person,
pregnant and lactating
women, children
Elders, pregnant and
lactating women and
children
They are dependent
on others
Because they are
dependent on
others
They have no
capacity to resist or
prevent the disaster
They have poor
capacity
28
Page 3 of 3
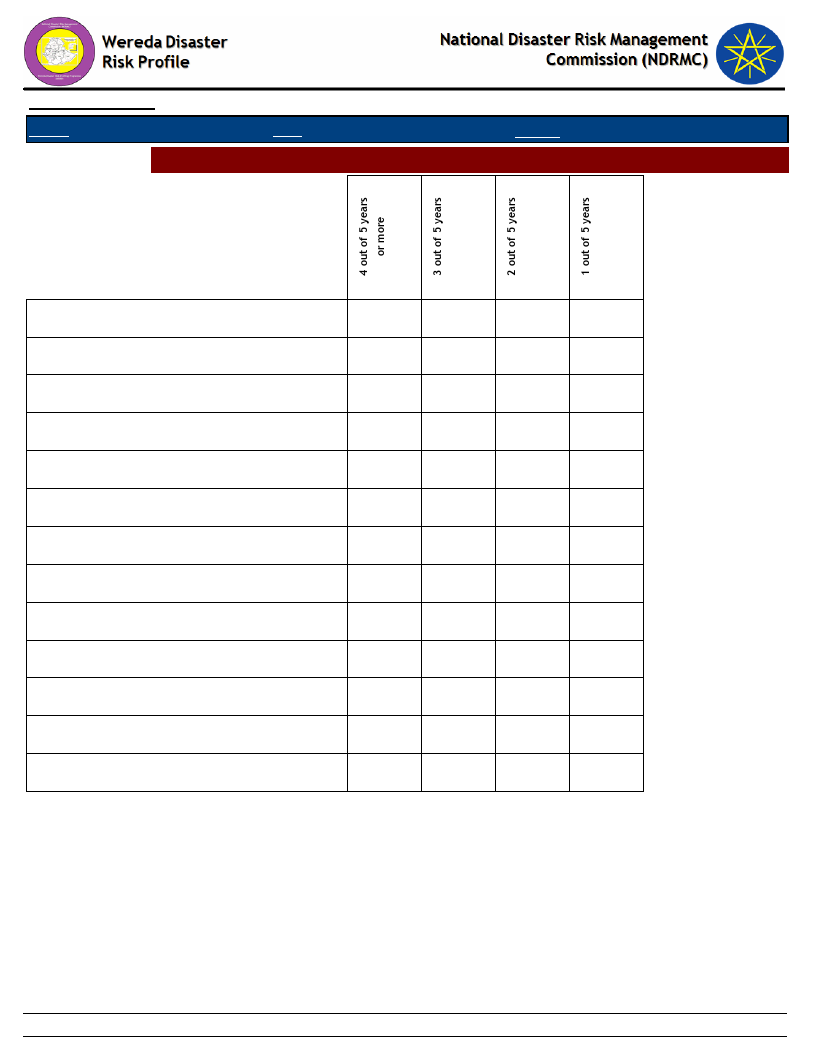
Data_Collected_Date
Region S.N.N.P
Zone GAMO GOFA
Selected Indictor: Frequency of Disaster Occurrence
Wereda
Tuesday, November 5, 2019
MIRAB ABAYA
Conflicts
Crop diseases
Drought
Economic / Price shock
Flood
Frost / Cold waves
Heat waves/ High temp
Heavy Rain
Human diseases
Landslide
Livestock diseases
Road Accident
Storms / hail storm
25.00
16.67
58.71
100.00
18.42
100.00
40.00
30.56
25.48
23.68
20.00
26.98
16.67
12.70
31.25
27.27
50.00
27.78
10.32
25.00
25.00
5.48
32.89
25.00
40.00
9.52
31.25
24.24
100.00
50.79
37.50
31.82
100.00
100.00
29
Page 1 of 1
Data_Collected_Date
Region S.N.N.P
Zone GAMO GOFA
Selected Indictor: Household Exposure to Hazards
Disaster Type
Drought
Livestock diseases
Flood
Human diseases
Crop diseases
Landslide
Economic / Price shock
Heat waves/ High temp
Conflicts
Storms / hail storm
Heavy Rain
Road Accident
DK
Earthquake
Frost / Cold waves
No Disaster
Tuesday, November 5, 2019
Wereda MIRAB ABAYA
General_Exposure
37.60
17.98
13.63
10.93
10.58
2.70
1.65
1.65
0.82
0.82
0.59
0.47
0.24
0.24
0.24
0.12
Last_Five_Years_Exposure
43.41
19.00
10.82
10.12
10.54
2.64
0.83
0.69
0.69
0.28
0.28
0.42
0.28
30
Page 1 of 1
Wereda Disaster
Risk Profile
Data_Collected_Date
Region S.N.N.P
Selected Indictor:
Zone GAMO GOFA
Months of Occurrence of Frequent Disasters
National Disaster Risk Management
Commission (NDRMC)
Tuesday, November 5, 2019
Wereda MIRAB ABAYA
Conflicts
Crop diseases
Drought
Economic / Price shock
Flood
Frost / Cold waves
Heat waves/ High temp
Human diseases
Landslide
Livestock diseases
100.00
6.67
6.67
33.33
13.33
33.33
6.67
1.10
1.65
7.14
6.59
14.84
65.38
3.30
16.67
16.67
66.67
6.67
33.33
26.67
13.33
20.00
50.00
50.00
33.33
33.33
33.33
10.53
15.79
21.05
5.26
15.79
15.79
15.79
100.00
7.69
11.54
46.15
26.92
7.69
31
Page 1 of 1
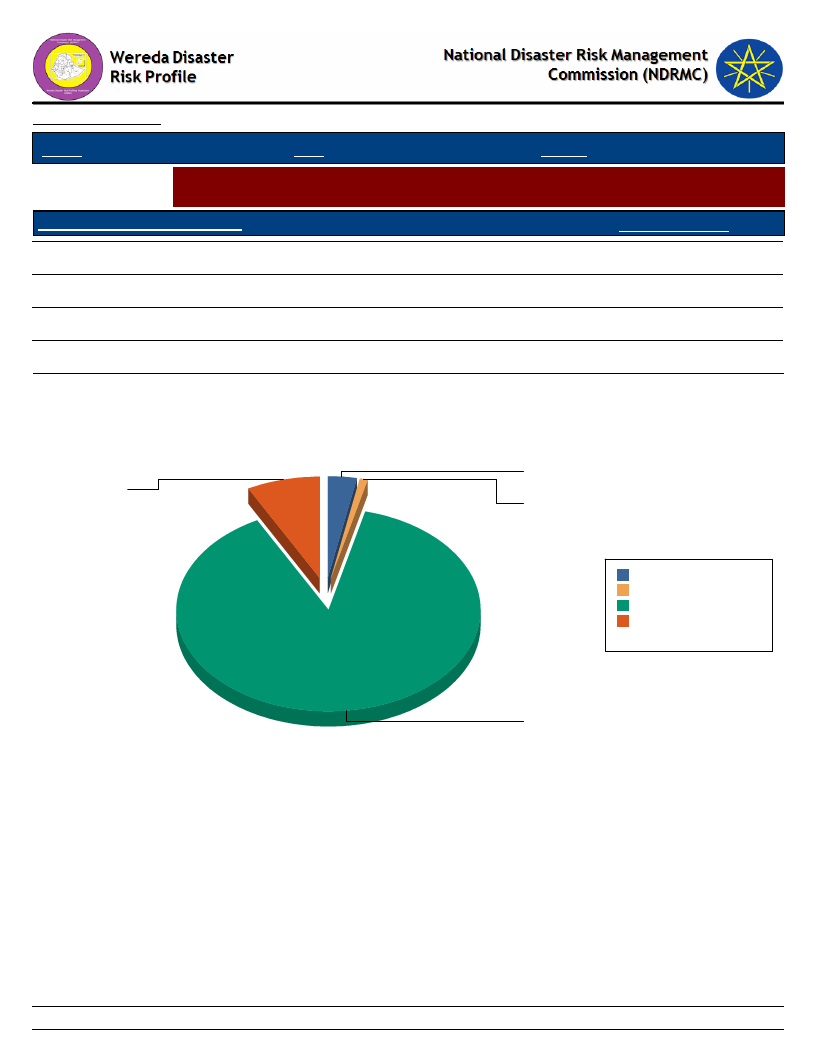
Data_Collected_Date
Tuesday, November 5, 2019
Region S.N.N.P
Zone GAMO GOFA
Wereda MIRAB ABAYA
Selected Indictor:
Conflicts: Perception of households on conflict issues - Is conflict an issue in this
community?
Is Conflict an Issue in Community?
Response_Percent
Yes
7.69
No
88.33
DK
2.92
NA
1.06
Is Conflict an Issue in Community?
DK
Yes
2.9
7.7
NA
1.1
DK 2.9 2.9%
NA 1.1 1.1%
No 88.3 88.3%
Yes 7.7 7.7%
Total: 100 100.0%
No
88.3
32
Page 1 of 1
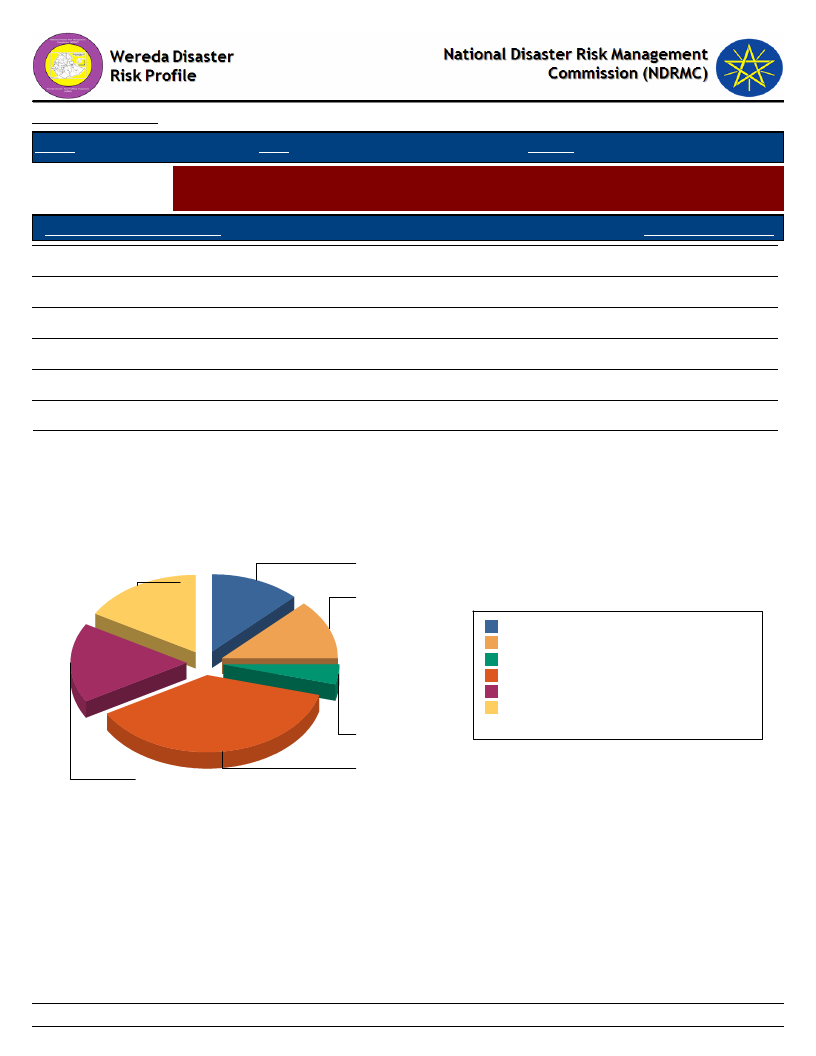
Data_Collected_Date
Region S.N.N.P
Zone GAMO GOFA
Tuesday, November 5, 2019
Wereda MIRAB ABAYA
Selected Indictor:
Conflicts: Perception of households on conflict issues - Who To Turn To in case
of Conflict?
Who To Turn During Conflict?
Response_Percentage
Family members
12.50
Elders
12.50
Wereda administration
16.67
Police
37.50
Regional representatives
16.67
Other
4.17
Who To Turn During Conflict?
Wereda administration
17
Regional
representatives
17
Elders
13
Family members
13
Other
4
Police
38
Elders
Family members
Other
Police
Regional representatives
Wereda administration
13 12.5%
13 12.5%
4 4.2%
38 37.5%
17 16.7%
17 16.7%
Total:
100 100.0%
33
Page 1 of 1
Data_Collected_Date
Region S.N.N.P
Zone GAMO GOFA
Tuesday, November 5, 2019
Wereda MIRAB ABAYA
Selected Indictor: Losses from Disasters - Losses from all disasters (household response in %)
Type of Loss
Main_Loss_Percent
Secondary_Loss_Percent
Physical damages on houses and property
8.71
3.79
Crop damage
51.00
7.57
Livestock damage
14.43
3.15
Death of household members
1.57
0.16
Illness/health problems
11.00
4.89
Loss of access to social services, including school
1.14
1.26
Loss of income
8.29
47.32
Loss of savings
2.29
27.13
Lost access to grazing land
1.00
3.47
Lost access to water source
0.14
0.47
Had to flee/change residence area
0.14
0.47
Other losses/damages
0.29
0.32
34
Page 1 of 1

Wereda Disaster
Risk Profile
National Disaster Risk Management
Commission (NDRMC)
Data_Collected_Date
Region S.N.N.P
Zone GAMO GOFA
Wereda MIRAB ABAYA
Tuesday, November 5, 2019
Selected Indictor: Losses from Disasters - Main Losses by Type of Disasters (household response in %)
Type of Loss
Type of Disasters which mainly caused Listed Losses
Crop damage
Death of household
members
Had to flee/change
residence area
Illness/health problems
Livestock damage
35
Page 1 of 3
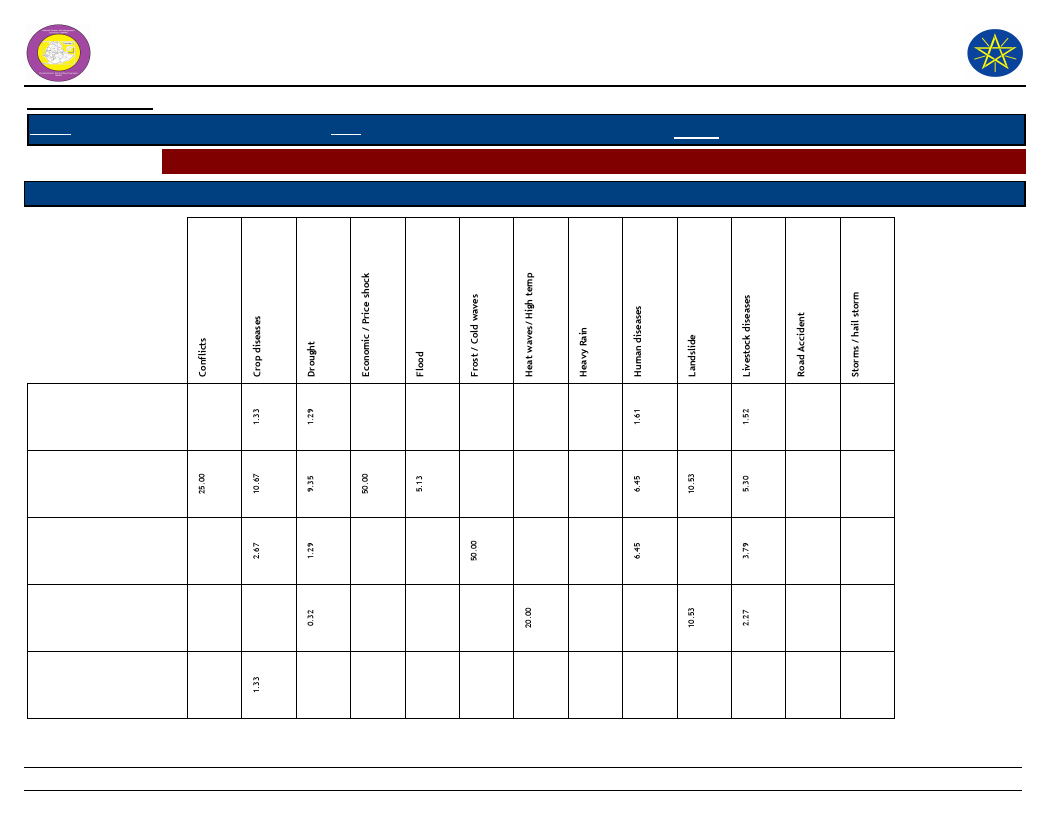
Wereda Disaster
Risk Profile
National Disaster Risk Management
Commission (NDRMC)
Data_Collected_Date
Region S.N.N.P
Zone GAMO GOFA
Wereda MIRAB ABAYA
Tuesday, November 5, 2019
Selected Indictor: Losses from Disasters - Main Losses by Type of Disasters (household response in %)
Type of Loss
Type of Disasters which mainly caused Listed Losses
Loss of access to social
services, including
school
Loss of income
Loss of savings
Lost access to grazing
land
Lost access to water
source
36
Page 2 of 3

Wereda Disaster
Risk Profile
National Disaster Risk Management
Commission (NDRMC)
Data_Collected_Date
Region S.N.N.P
Zone GAMO GOFA
Wereda MIRAB ABAYA
Tuesday, November 5, 2019
Selected Indictor: Losses from Disasters - Main Losses by Type of Disasters (household response in %)
Type of Loss
Type of Disasters which mainly caused Listed Losses
Other losses/damages
Physical damages on
houses and property
37
Page 3 of 3

Wereda Disaster Risk
Profile
Data_Collected_Date
Region S.N.N.P
Zone GAMO GOFA
National Disaster Risk Management
Commission (NDRMC)
Wereda MIRAB ABAYA
Tuesday, November 5, 2019
Selected Indictor: Losses from Disasters - Secondary Losses by Type of Disasters (household response in %)
Type of Loss
Type of Disasters which caused Listed Secondary Losses
Crop damage
Death of household
members
Had to flee/change
residence area
Illness/health problems
Livestock damage
6.85
9.38
25.00
12.86
50.00
0.35
0.35
2.86
4.51
4.29
1.37
5.56
38
3.92
11.76
0.83
5.88
5.88
9.17
2.50
Page 1 of 3
Wereda Disaster Risk
Profile
Data_Collected_Date
Region S.N.N.P
Zone GAMO GOFA
National Disaster Risk Management
Commission (NDRMC)
Wereda MIRAB ABAYA
Tuesday, November 5, 2019
Selected Indictor: Losses from Disasters - Secondary Losses by Type of Disasters (household response in %)
Type of Loss
Type of Disasters which caused Listed Secondary Losses
Loss of access to social
services, including school
Loss of income
Loss of savings
Lost access to grazing land
Lost access to water source
2.74
1.04
2.50
66.67
52.05
61.46
25.00
30.00
50.00
50.00
21.57
11.76
37.50
50.00
33.33
28.77
11.81
50.00
37.14
100.00
50.00
66.67
29.41
37.50
50.00
2.74
1.74
2.86
17.65
8.33
0.35
2.86
39
Page 2 of 3
Wereda Disaster Risk
Profile
Data_Collected_Date
Region S.N.N.P
Zone GAMO GOFA
National Disaster Risk Management
Commission (NDRMC)
Wereda MIRAB ABAYA
Tuesday, November 5, 2019
Selected Indictor: Losses from Disasters - Secondary Losses by Type of Disasters (household response in %)
Type of Loss
Type of Disasters which caused Listed Secondary Losses
Other losses/damages
Physical damages on houses
and property
5.48
3.47
7.14
1.96
5.88
17.65
1.67
40
Page 3 of 3

Wereda Disaster
Risk Profile
Data_Collected_Date
National Disaster Risk Management
Commission (NDRMC)
Tuesday, November 5, 2019
Region S.N.N.P
Zone GAMO GOFA
Wereda MIRAB ABAYA
Selected Indictor: Seasonal Calendar for Hazards, Activities and Income Level By Kebele
Month of Hazard
Major_Problems /Disasters
Hazard Severity
Rank
Agricultural_Activities
Kebele Name ALGAE
E - Jan (Tir)
---------
Land preparation
Income
Level Rank
---------
F - Feb (Yekatit)
Livestock disease
1
Land preparation, fattening
1st
G - Mar (Megabit)
Livestock disease
1
Crop sowing
---------
H - Apr (Meazea)
Livestock disease
1
Crop sowing, weeding
1st
I - May (Ginbot)
---------
Crop sowing, weeding
---------
J - Jun (Sene)
Drought
1
Land Preparation
---------
K - Jul (Hamle)
Drought
1
Crop sowing
---------
L - Aug (Nehase)
---------
Crop harvesting, weeding
---------
A - Sep (Meskerem)
---------
Crop harvesting
---------
B - Oct (Tikimt)
---------
Fattening, harvesting
---------
C - Nov (Hidar)
---------
Harvesting
---------
D - Dec (Tahsas)
---------
Harvesting
1st
NOTE: Hazard Severity Rank helps prioritize the more severe hazards that have occurred in the months of disaster occurrence, 3 being the worst and 1
the least severe hazards.
41
Page 1 of 20

Wereda Disaster
Risk Profile
Data_Collected_Date
National Disaster Risk Management
Commission (NDRMC)
Tuesday, November 5, 2019
Region S.N.N.P
Zone GAMO GOFA
Wereda MIRAB ABAYA
Selected Indictor: Seasonal Calendar for Hazards, Activities and Income Level By Kebele
Month of Hazard
Major_Problems /Disasters
Hazard Severity
Rank
Agricultural_Activities
Kebele Name ANKOBER
E - Jan (Tir)
---------
Land preparation
Income
Level Rank
1st
F - Feb (Yekatit)
Drought
3
Ploughing
3rd
G - Mar (Megabit)
Drought
3
Ploughing
3rd
H - Apr (Meazea)
Drought, livestock disease
1
Sowing
3rd
I - May (Ginbot)
Drought, flood, livestock disease
1
Weeding
3rd
J - Jun (Sene)
Drought, flood, livestock disease
1
Ploughing
3rd
K - Jul (Hamle)
Drought, flood, livestock disease
1
Harvesting, fastening
3rd
L - Aug (Nehase)
Flood, livestock disease
2
Harvesting, weeding
3rd
A - Sep (Meskerem)
Flood, livestock disease
2
Harvesting
1st
B - Oct (Tikimt)
Flood
3
Harvesting
3rd
C - Nov (Hidar)
---------
Fattening
2nd
D - Dec (Tahsas)
---------
Harvesting
2nd
NOTE: Hazard Severity Rank helps prioritize the more severe hazards that have occurred in the months of disaster occurrence, 3 being the worst and 1
the least severe hazards.
42
Page 2 of 20

Wereda Disaster
Risk Profile
Data_Collected_Date
National Disaster Risk Management
Commission (NDRMC)
Tuesday, November 5, 2019
Region S.N.N.P
Zone GAMO GOFA
Wereda MIRAB ABAYA
Selected Indictor: Seasonal Calendar for Hazards, Activities and Income Level By Kebele
Month of Hazard
Major_Problems /Disasters
Hazard Severity
Rank
Agricultural_Activities
Kebele Name DELBO
E - Jan (Tir)
Livestock disease, drought
3
Fattening, harvesting
Income
Level Rank
1st
F - Feb (Yekatit)
Livestock disease, drought
3
Land preparation
3rd
G - Mar (Megabit)
Livestock disease, drought, flood
3
Seed preparation
3rd
H - Apr (Meazea)
Livestock disease, drought, flood
3
Sowing, weeding
3rd
I - May (Ginbot)
Livestock disease, drought
3
Weeding
3rd
J - Jun (Sene)
Flood, drought
2
Weeding
3rd
K - Jul (Hamle)
Flood, drought
2
Weeding, land preparation
3rd
L - Aug (Nehase)
Flood
3
Weeding, land preparation
3rd
A - Sep (Meskerem)
---------
Marketing, harvesting
1st
B - Oct (Tikimt)
Flood
3
Weeding
3rd
C - Nov (Hidar)
Flood
3
Weeding
3rd
D - Dec (Tahsas)
---------
Marketing, harvesting
1st
NOTE: Hazard Severity Rank helps prioritize the more severe hazards that have occurred in the months of disaster occurrence, 3 being the worst and 1
the least severe hazards.
43
Page 3 of 20

Wereda Disaster
Risk Profile
Data_Collected_Date
National Disaster Risk Management
Commission (NDRMC)
Tuesday, November 5, 2019
Region S.N.N.P
Zone GAMO GOFA
Wereda MIRAB ABAYA
Selected Indictor: Seasonal Calendar for Hazards, Activities and Income Level By Kebele
Month of Hazard
Major_Problems /Disasters
Hazard Severity
Rank
Agricultural_Activities
Kebele Name DOSHE
E - Jan (Tir)
Human disease
3
Harvesting
Income
Level Rank
3rd
F - Feb (Yekatit)
Human disease
3
Land preparing
4th
G - Mar (Megabit)
Drought, livestock and human disease
3
Land preparing
7th
H - Apr (Meazea)
Drought, livestock disease
1
Ploughing
8th
I - May (Ginbot)
Drought, livestock disease
1
Crop sowing
5th
J - Jun (Sene)
Drought, livestock disease
1
Weeding
10th
K - Jul (Hamle)
Drought
3
Weeding, fattening, ploughing
11th
L - Aug (Nehase)
Economic hardship/income increasing
2
Sowing, fattening
12th
A - Sep (Meskerem)
Economic hardship/income increasing
2
Weeding, fattening
6th
B - Oct (Tikimt)
Economic hardship/income increasing
2
Harvesting
2nd
C - Nov (Hidar)
---------
Harvesting
2nd
D - Dec (Tahsas)
---------
Harvesting
1st
NOTE: Hazard Severity Rank helps prioritize the more severe hazards that have occurred in the months of disaster occurrence, 3 being the worst and 1
the least severe hazards.
44
Page 4 of 20

Wereda Disaster
Risk Profile
Data_Collected_Date
National Disaster Risk Management
Commission (NDRMC)
Tuesday, November 5, 2019
Region S.N.N.P
Zone GAMO GOFA
Wereda MIRAB ABAYA
Selected Indictor: Seasonal Calendar for Hazards, Activities and Income Level By Kebele
Month of Hazard
Major_Problems /Disasters
Hazard Severity
Rank
Agricultural_Activities
Kebele Name FARAOSA
E - Jan (Tir)
Shortage of rain fall
3
Harvesting, fattening
Income
Level Rank
1st
F - Feb (Yekatit)
Shortage of rain fall
3
Land preparation
2nd
G - Mar (Megabit)
Livestock disease, drought
3
Land preparation
2nd
H - Apr (Meazea)
Livestock disease, drought
3
Sowing
2nd
I - May (Ginbot)
Livestock disease, drought
3
Weeding
2nd
J - Jun (Sene)
Livestock disease, drought
3
Weeding
2nd
K - Jul (Hamle)
Livestock disease, drought
3
Weeding
2nd
L - Aug (Nehase)
---------
Weeding, land preparation
1st
A - Sep (Meskerem)
---------
Harvesting, marketing, sowing
1st
B - Oct (Tikimt)
---------
Weeding
2nd
C - Nov (Hidar)
---------
Weeding
2nd
D - Dec (Tahsas)
---------
Harvesting
1st
NOTE: Hazard Severity Rank helps prioritize the more severe hazards that have occurred in the months of disaster occurrence, 3 being the worst and 1
the least severe hazards.
45
Page 5 of 20

Wereda Disaster
Risk Profile
Data_Collected_Date
National Disaster Risk Management
Commission (NDRMC)
Tuesday, November 5, 2019
Region S.N.N.P
Zone GAMO GOFA
Wereda MIRAB ABAYA
Selected Indictor: Seasonal Calendar for Hazards, Activities and Income Level By Kebele
Month of Hazard
Major_Problems /Disasters
Hazard Severity
Rank
Agricultural_Activities
Kebele Name FETELE
E - Jan (Tir)
Drought
3
Harvesting, fattening, land preparation
Income
Level Rank
1st
F - Feb (Yekatit)
Drought
3
Land preparation
2nd
G - Mar (Megabit)
Drought, livestock disease
3
Land preparation
2nd
H - Apr (Meazea)
Drought, livestock disease
3
Sowing
2nd
I - May (Ginbot)
Drought, livestock disease
3
Weeding
2nd
J - Jun (Sene)
Drought, livestock disease
3
Weeding, land preparation
2nd
K - Jul (Hamle)
Drought, livestock disease
2
Weeding, land preparation
2nd
L - Aug (Nehase)
Drought, livestock disease
2
Harvesting
1st
A - Sep (Meskerem)
12
Weeding
2nd
B - Oct (Tikimt)
---------
Weeding
2nd
C - Nov (Hidar)
---------
Weeding
2nd
D - Dec (Tahsas)
---------
Harvesting
1st
NOTE: Hazard Severity Rank helps prioritize the more severe hazards that have occurred in the months of disaster occurrence, 3 being the worst and 1
the least severe hazards.
46
Page 6 of 20
Wereda Disaster
Risk Profile
Data_Collected_Date
National Disaster Risk Management
Commission (NDRMC)
Tuesday, November 5, 2019
Region S.N.N.P
Zone GAMO GOFA
Wereda MIRAB ABAYA
Selected Indictor: Seasonal Calendar for Hazards, Activities and Income Level By Kebele
Month of Hazard
Major_Problems /Disasters
Hazard Severity
Rank
Agricultural_Activities
Kebele Name KOLA BANENA
E - Jan (Tir)
Drought
1
Land preparation
Income
Level Rank
1st
F - Feb (Yekatit)
Drought
1
Land preparation, fattening
1st
G - Mar (Megabit)
Drought, livestock disease
3
Crop sowing
1st
H - Apr (Meazea)
Drought, livestock disease
3
Crop sowing, weeding
1st
I - May (Ginbot)
Drought, livestock disease
3
Crop sowing, weeding
1st
J - Jun (Sene)
Drought, livestock disease
3
Land preparation
1st
K - Jul (Hamle)
Drought, livestock disease
3
Crop sowing
1st
L - Aug (Nehase)
---------
Crop sowing, weeding
1st
A - Sep (Meskerem)
---------
Harvesting
1st
B - Oct (Tikimt)
---------
Fattening, harvesting
1st
C - Nov (Hidar)
---------
Harvesting
1st
D - Dec (Tahsas)
---------
Harvesting
1st
NOTE: Hazard Severity Rank helps prioritize the more severe hazards that have occurred in the months of disaster occurrence, 3 being the worst and 1
the least severe hazards.
47
Page 7 of 20

Wereda Disaster
Risk Profile
Data_Collected_Date
National Disaster Risk Management
Commission (NDRMC)
Tuesday, November 5, 2019
Region S.N.N.P
Zone GAMO GOFA
Wereda MIRAB ABAYA
Selected Indictor: Seasonal Calendar for Hazards, Activities and Income Level By Kebele
Month of Hazard
Major_Problems /Disasters
Hazard Severity
Rank
Agricultural_Activities
Kebele Name KOLA MULAT0
E - Jan (Tir)
Drought
3
Land preparation, harvesting
Income
Level Rank
1st
F - Feb (Yekatit)
Drought
3
Land preparation
3rd
G - Mar (Megabit)
Drought
3
Seed preparation
3rd
H - Apr (Meazea)
Drought, livestock disease
3
Sowing, fattening
3rd
I - May (Ginbot)
Drought, flood
3
Weeding
3rd
J - Jun (Sene)
Drought
3
Weeding
3rd
K - Jul (Hamle)
Drought, livestock disease
2
Weeding, land preparation
3rd
L - Aug (Nehase)
Drought, flood
2
Harvesting, sowing
3rd
A - Sep (Meskerem)
Drought
2
Market, weeding
1st
B - Oct (Tikimt)
---------
Weeding, fattening
3rd
C - Nov (Hidar)
---------
Weeding
3rd
D - Dec (Tahsas)
---------
Weeding
3rd
NOTE: Hazard Severity Rank helps prioritize the more severe hazards that have occurred in the months of disaster occurrence, 3 being the worst and 1
the least severe hazards.
48
Page 8 of 20

Wereda Disaster
Risk Profile
Data_Collected_Date
National Disaster Risk Management
Commission (NDRMC)
Tuesday, November 5, 2019
Region S.N.N.P
Zone GAMO GOFA
Wereda MIRAB ABAYA
Selected Indictor: Seasonal Calendar for Hazards, Activities and Income Level By Kebele
Month of Hazard
Major_Problems /Disasters
Hazard Severity
Rank
Agricultural_Activities
Kebele Name KORGA GERAMO
E - Jan (Tir)
Drought
2
Water shad management
Income
Level Rank
2nd
F - Feb (Yekatit)
Livestock disease, drought
2
Cleaning cultivated land
2nd
G - Mar (Megabit)
Livestock disease, drought
2
Ploughing
3rd
H - Apr (Meazea)
Livestock disease, drought
1
Sowing
3rd
I - May (Ginbot)
Livestock disease, drought
1
Weeding
3rd
J - Jun (Sene)
Livestock disease, drought
3
Ploughing
3rd
K - Jul (Hamle)
Livestock disease, drought
3
Ploughing
3rd
L - Aug (Nehase)
Livestock disease, drought
3
Sowing
3rd
A - Sep (Meskerem)
Drought
3
Harvesting, weeding
2nd
B - Oct (Tikimt)
---------
Harvesting
1st
C - Nov (Hidar)
---------
Fattening
1st
D - Dec (Tahsas)
---------
Fattening
1st
NOTE: Hazard Severity Rank helps prioritize the more severe hazards that have occurred in the months of disaster occurrence, 3 being the worst and 1
the least severe hazards.
49
Page 9 of 20

Wereda Disaster
Risk Profile
Data_Collected_Date
National Disaster Risk Management
Commission (NDRMC)
Tuesday, November 5, 2019
Region S.N.N.P
Zone GAMO GOFA
Wereda MIRAB ABAYA
Selected Indictor: Seasonal Calendar for Hazards, Activities and Income Level By Kebele
Month of Hazard
Major_Problems /Disasters
Hazard Severity
Rank
Agricultural_Activities
Kebele Name LAYO TERGA
E - Jan (Tir)
---------
Fattening, harvesting
Income
Level Rank
1st
F - Feb (Yekatit)
---------
Land preparation
1st
G - Mar (Megabit)
Crop disease
2
Seed preparation
3rd
H - Apr (Meazea)
Drought, flood, livestock disease
3
Sowing
3rd
I - May (Ginbot)
Drought, livestock disease
3
Weeding
3rd
J - Jun (Sene)
Drought, crop disease
3
Weeding, land preparation
3rd
K - Jul (Hamle)
Flood
2
Weeding, seed preparation
3rd
L - Aug (Nehase)
Flood
2
Sowing
3rd
A - Sep (Meskerem)
Flood
2
Weeding, marketing
2nd
B - Oct (Tikimt)
Flood, drought, livestock disease, crop disease
3
Weeding
3rd
C - Nov (Hidar)
Livestock disease
2
Weeding
3rd
D - Dec (Tahsas)
---------
Weeding
3rd
NOTE: Hazard Severity Rank helps prioritize the more severe hazards that have occurred in the months of disaster occurrence, 3 being the worst and 1
the least severe hazards.
50
Page 10 of 20

Wereda Disaster
Risk Profile
Data_Collected_Date
National Disaster Risk Management
Commission (NDRMC)
Tuesday, November 5, 2019
Region S.N.N.P
Zone GAMO GOFA
Wereda MIRAB ABAYA
Selected Indictor: Seasonal Calendar for Hazards, Activities and Income Level By Kebele
Month of Hazard
Major_Problems /Disasters
Hazard Severity
Rank
Agricultural_Activities
Kebele Name MOLLE
E - Jan (Tir)
---------
Land preparation
Income
Level Rank
---------
F - Feb (Yekatit)
---------
Land preparation, fattening
1st
G - Mar (Megabit)
Livestock disease
3
Crop sowing
---------
H - Apr (Meazea)
Livestock disease, flood
2
Crop sowing, weeding
1st
I - May (Ginbot)
Drought, livestock disease
3
Crop sowing, weeding
---------
J - Jun (Sene)
Drought
3
Land preparation
---------
K - Jul (Hamle)
Flood
3
Crop sowing
---------
L - Aug (Nehase)
---------
Harvesting, weeding
---------
A - Sep (Meskerem)
---------
Harvesting
---------
B - Oct (Tikimt)
---------
Harvesting, fattening
---------
C - Nov (Hidar)
---------
Harvesting, fattening
---------
D - Dec (Tahsas)
---------
Harvesting
1st
NOTE: Hazard Severity Rank helps prioritize the more severe hazards that have occurred in the months of disaster occurrence, 3 being the worst and 1
the least severe hazards.
51
Page 11 of 20

Wereda Disaster
Risk Profile
Data_Collected_Date
National Disaster Risk Management
Commission (NDRMC)
Tuesday, November 5, 2019
Region S.N.N.P
Zone GAMO GOFA
Wereda MIRAB ABAYA
Selected Indictor: Seasonal Calendar for Hazards, Activities and Income Level By Kebele
Month of Hazard
Major_Problems /Disasters
Hazard Severity
Rank
Agricultural_Activities
Kebele Name MOREDA
E - Jan (Tir)
Lack of pasture
2
Plaughing, harvesting
Income
Level Rank
1st
F - Feb (Yekatit)
Lack of pasture
2
Plaughing
2nd
G - Mar (Megabit)
Drought, economic hardship, livestock disease, crop
1
Sowing
3rd
disease
H - Apr (Meazea)
Drought, economic hardship, livestock disease, crop
1
Sowing, fattening
7th
disease
I - May (Ginbot)
Drought, economic hardship, livestock disease, crop
1
Weeding
12th
disease
J - Jun (Sene)
Economic hardship
3
Weeding
11th
K - Jul (Hamle)
---------
Plaughing, harvesting
10th
L - Aug (Nehase)
---------
Sowing
4th
A - Sep (Meskerem)
---------
Weeding
8th
B - Oct (Tikimt)
Drought
1
Weeding, harvesting
5th
C - Nov (Hidar)
---------
Harvesting
9th
D - Dec (Tahsas)
---------
Harvesting
6th
NOTE: Hazard Severity Rank helps prioritize the more severe hazards that have occurred in the months of disaster occurrence, 3 being the worst and 1
the least severe hazards.
52
Page 12 of 20

Wereda Disaster
Risk Profile
Data_Collected_Date
National Disaster Risk Management
Commission (NDRMC)
Tuesday, November 5, 2019
Region S.N.N.P
Zone GAMO GOFA
Wereda MIRAB ABAYA
Selected Indictor: Seasonal Calendar for Hazards, Activities and Income Level By Kebele
Month of Hazard
Major_Problems /Disasters
Hazard Severity
Rank
Agricultural_Activities
Kebele Name PURA
E - Jan (Tir)
Drought, livestock disease
2
Harvesting, fattening
Income
Level Rank
1st
F - Feb (Yekatit)
Drought, livestock disease
2
Land preparation, fattening
2nd
G - Mar (Megabit)
Drought, livestock disease
3
Seed preparation
2nd
H - Apr (Meazea)
Drought, livestock disease
3
Sowing
3rd
I - May (Ginbot)
Drought, livestock disease
3
Weeding, fattening
3rd
J - Jun (Sene)
Drought, livestock disease
2
Weeding
3rd
K - Jul (Hamle)
Drought, livestock disease, flood
3
Weeding, land preparation
3rd
L - Aug (Nehase)
Drought, livestock disease, flood
3
Harvesting, sowing
1st
A - Sep (Meskerem)
Flood
1
Harvesting, weeding
1st
B - Oct (Tikimt)
Flood
1
Weeding, protection
3rd
C - Nov (Hidar)
---------
Weeding, fattening
3rd
D - Dec (Tahsas)
---------
Fattening
3rd
NOTE: Hazard Severity Rank helps prioritize the more severe hazards that have occurred in the months of disaster occurrence, 3 being the worst and 1
the least severe hazards.
53
Page 13 of 20

Wereda Disaster
Risk Profile
Data_Collected_Date
National Disaster Risk Management
Commission (NDRMC)
Tuesday, November 5, 2019
Region S.N.N.P
Zone GAMO GOFA
Wereda MIRAB ABAYA
Selected Indictor: Seasonal Calendar for Hazards, Activities and Income Level By Kebele
Month of Hazard
Major_Problems /Disasters
Hazard Severity
Rank
Agricultural_Activities
Kebele Name UGAYO
E - Jan (Tir)
Livestock disease
2
Fattening, ploughing
Income
Level Rank
3rd
F - Feb (Yekatit)
Livestock disease
3
Beekeeping
3rd
G - Mar (Megabit)
Livestock disease
3
Land preparing
3rd
H - Apr (Meazea)
Drought, livestock disease
2
Sowing
3rd
I - May (Ginbot)
Drought, livestock disease
3
Weeding, fattening
3rd
J - Jun (Sene)
Drought, livestock disease
3
Weeding, bee keeping
3rd
K - Jul (Hamle)
Drought, livestock disease, crop disease
3
poultry production
3rd
L - Aug (Nehase)
Drought, crop disease
3
Marketing
3rd
A - Sep (Meskerem)
Crop disease
2
Harvesting
1st
B - Oct (Tikimt)
Crop disease
2
Harvesting
1st
C - Nov (Hidar)
---------
Honey harvesting
1st
D - Dec (Tahsas)
---------
Marketing
1st
NOTE: Hazard Severity Rank helps prioritize the more severe hazards that have occurred in the months of disaster occurrence, 3 being the worst and 1
the least severe hazards.
54
Page 14 of 20

Wereda Disaster
Risk Profile
Data_Collected_Date
National Disaster Risk Management
Commission (NDRMC)
Tuesday, November 5, 2019
Region S.N.N.P
Zone GAMO GOFA
Wereda MIRAB ABAYA
Selected Indictor: Seasonal Calendar for Hazards, Activities and Income Level By Kebele
Month of Hazard
Major_Problems /Disasters
Hazard Severity
Rank
Agricultural_Activities
Kebele Name UMO LANTE
E - Jan (Tir)
Human disease, typhoid, typhus
3
Ploughing
Income
Level Rank
3rd
F - Feb (Yekatit)
Human disease
3
Sowing
4th
G - Mar (Megabit)
Drought
2
Sowing
5th
H - Apr (Meazea)
Flood, drought
1
Weeding
6th
I - May (Ginbot)
Flood, drought, livestock disease
2
Urea application
7th
J - Jun (Sene)
Drought
1
Irrigation
8th
K - Jul (Hamle)
Flood, drought
3
Ploughing
9th
L - Aug (Nehase)
Flood, drought
1
Harvesting, sowing
10th
A - Sep (Meskerem)
Flood
1
Harvesting, weeding
11th
B - Oct (Tikimt)
Flood
1
Urea application
12th
C - Nov (Hidar)
Human disease
3
Irrigation
2nd
D - Dec (Tahsas)
Human disease
3
Harvesting
1st
NOTE: Hazard Severity Rank helps prioritize the more severe hazards that have occurred in the months of disaster occurrence, 3 being the worst and 1
the least severe hazards.
55
Page 15 of 20

Wereda Disaster
Risk Profile
Data_Collected_Date
National Disaster Risk Management
Commission (NDRMC)
Tuesday, November 5, 2019
Region S.N.N.P
Zone GAMO GOFA
Wereda MIRAB ABAYA
Selected Indictor: Seasonal Calendar for Hazards, Activities and Income Level By Kebele
Month of Hazard
Major_Problems /Disasters
Hazard Severity
Rank
Agricultural_Activities
Kebele Name WANKE WAGEFO
E - Jan (Tir)
---------
Land preparation, harvesting
Income
Level Rank
1st
F - Feb (Yekatit)
Flood
3
Land preparation
3rd
G - Mar (Megabit)
---------
Sowing
3rd
H - Apr (Meazea)
---------
Weeding, fattening
3rd
I - May (Ginbot)
Drought, flood
3
Weeding
3rd
J - Jun (Sene)
Drought, livestock disease, flood
3
Weeding
3rd
K - Jul (Hamle)
Drought, livestock disease
3
Land preparation
3rd
L - Aug (Nehase)
Livestock disease
3
Harvesting, land preparation
1st
A - Sep (Meskerem)
Flood
3
Sowing
3rd
B - Oct (Tikimt)
Flood
3
Weeding
3rd
C - Nov (Hidar)
---------
Weeding
3rd
D - Dec (Tahsas)
---------
Harvesting
3rd
NOTE: Hazard Severity Rank helps prioritize the more severe hazards that have occurred in the months of disaster occurrence, 3 being the worst and 1
the least severe hazards.
56
Page 16 of 20

Wereda Disaster
Risk Profile
Data_Collected_Date
National Disaster Risk Management
Commission (NDRMC)
Tuesday, November 5, 2019
Region S.N.N.P
Zone GAMO GOFA
Wereda MIRAB ABAYA
Selected Indictor: Seasonal Calendar for Hazards, Activities and Income Level By Kebele
Month of Hazard
Major_Problems /Disasters
Hazard Severity
Rank
Agricultural_Activities
Kebele Name WOYE BARENA
E - Jan (Tir)
---------
Land preparation
Income
Level Rank
1st
F - Feb (Yekatit)
Drought, livestock disease
3
Land preparation
1st
G - Mar (Megabit)
Drought, livestock disease
3
1st
H - Apr (Meazea)
Drought, livestock disease
1
Crop sowing
1st
I - May (Ginbot)
Drought
1
Weeding, land preparation
1st
J - Jun (Sene)
Drought, flood
1
Land preparation, harvesting
1st
K - Jul (Hamle)
Drought, flood
2
Crop sowing
1st
L - Aug (Nehase)
Drought, flood
2
Crop sowing, weeding
1st
A - Sep (Meskerem)
Drought
2
Weeding, livestock activities
1st
B - Oct (Tikimt)
---------
1st
C - Nov (Hidar)
---------
Harvesting
1st
D - Dec (Tahsas)
---------
Harvesting, land preparation, livestock activities
1st
NOTE: Hazard Severity Rank helps prioritize the more severe hazards that have occurred in the months of disaster occurrence, 3 being the worst and 1
the least severe hazards.
57
Page 17 of 20

Wereda Disaster
Risk Profile
Data_Collected_Date
National Disaster Risk Management
Commission (NDRMC)
Tuesday, November 5, 2019
Region S.N.N.P
Zone GAMO GOFA
Wereda MIRAB ABAYA
Selected Indictor: Seasonal Calendar for Hazards, Activities and Income Level By Kebele
Month of Hazard
Major_Problems /Disasters
Hazard Severity
Rank
Agricultural_Activities
Kebele Name YAYEKE
E - Jan (Tir)
Lack of pasture, human disease
3
Land preparation
Income
Level Rank
2nd
F - Feb (Yekatit)
Drought, human disease
2
Land preparation
2nd
G - Mar (Megabit)
Drought, human disease
2
Crop sowing
3rd
H - Apr (Meazea)
Drought, flood, livestock disease
1
Weeding
3rd
I - May (Ginbot)
Drought, livestock disease
1
Weeding
3rd
J - Jun (Sene)
Drought, livestock disease
1
Weeding
3rd
K - Jul (Hamle)
Drought
2
Crop sowing
3rd
L - Aug (Nehase)
Economic hardship
2
Crop sowing
2nd
A - Sep (Meskerem)
Economic hardship
2
Crop sowing
1st
B - Oct (Tikimt)
Economic hardship
2
Harvesting
---------
C - Nov (Hidar)
---------
1st
D - Dec (Tahsas)
---------
Harvesting
1st
NOTE: Hazard Severity Rank helps prioritize the more severe hazards that have occurred in the months of disaster occurrence, 3 being the worst and 1
the least severe hazards.
58
Page 18 of 20

Wereda Disaster
Risk Profile
Data_Collected_Date
National Disaster Risk Management
Commission (NDRMC)
Tuesday, November 5, 2019
Region S.N.N.P
Zone GAMO GOFA
Wereda MIRAB ABAYA
Selected Indictor: Seasonal Calendar for Hazards, Activities and Income Level By Kebele
Month of Hazard
Major_Problems /Disasters
Hazard Severity
Rank
Agricultural_Activities
Kebele Name ZALA BARANA
E - Jan (Tir)
---------
Land preparation
Income
Level Rank
2nd
F - Feb (Yekatit)
---------
Flowing
2nd
G - Mar (Megabit)
---------
Crop sowing
2nd
H - Apr (Meazea)
Drought, Crop pest and disease
1
Weeding
3rd
I - May (Ginbot)
Drought, Crop pest and disease
2
Harvesting
3rd
J - Jun (Sene)
---------
Flowing/Fattening
3rd
K - Jul (Hamle)
---------
Crop sowing/fattening
3rd
L - Aug (Nehase)
Crop pest and disease
3
Weeding
2nd
A - Sep (Meskerem)
Drought, famine/poverty, crop pest and disease
3
Land preparation
2nd
B - Oct (Tikimt)
Drought, famine, poverty
---------
Harvesting
3rd
C - Nov (Hidar)
---------
Harvesting
1st
D - Dec (Tahsas)
---------
Store grain
1st
NOTE: Hazard Severity Rank helps prioritize the more severe hazards that have occurred in the months of disaster occurrence, 3 being the worst and 1
the least severe hazards.
59
Page 19 of 20

Wereda Disaster
Risk Profile
Data_Collected_Date
National Disaster Risk Management
Commission (NDRMC)
Tuesday, November 5, 2019
Region S.N.N.P
Zone GAMO GOFA
Wereda MIRAB ABAYA
Selected Indictor: Seasonal Calendar for Hazards, Activities and Income Level By Kebele
Month of Hazard
Major_Problems /Disasters
Hazard Severity
Rank
Agricultural_Activities
Kebele Name ZALA GUTESHA
E - Jan (Tir)
---------
Harvesting, livestock activities
Income
Level Rank
1st
F - Feb (Yekatit)
---------
Harvesting, storage
1st
G - Mar (Megabit)
Flood, livestock disease
3
Land preparation
3rd
H - Apr (Meazea)
Crop disease, flood
3
Sowing
3rd
I - May (Ginbot)
Crop disease
2
Weeding
3rd
J - Jun (Sene)
Crop disease, livestock disease, drought, flood
3
Weeding, land preparation
3rd
K - Jul (Hamle)
Flood, land sliding
3
Weeding, sowing
3rd
L - Aug (Nehase)
Flood, land sliding
3
Weeding
3rd
A - Sep (Meskerem)
Land sliding
2
Weeding, marketing
1st
B - Oct (Tikimt)
Livestock disease, drought
3
Weeding
3rd
C - Nov (Hidar)
---------
Weeding
3rd
D - Dec (Tahsas)
Crop disease
2
Harvesting
1st
NOTE: Hazard Severity Rank helps prioritize the more severe hazards that have occurred in the months of disaster occurrence, 3 being the worst and 1
the least severe hazards.
60
Page 20 of 20
WDRP Indicators
Infrastructure Access Characteristics
61
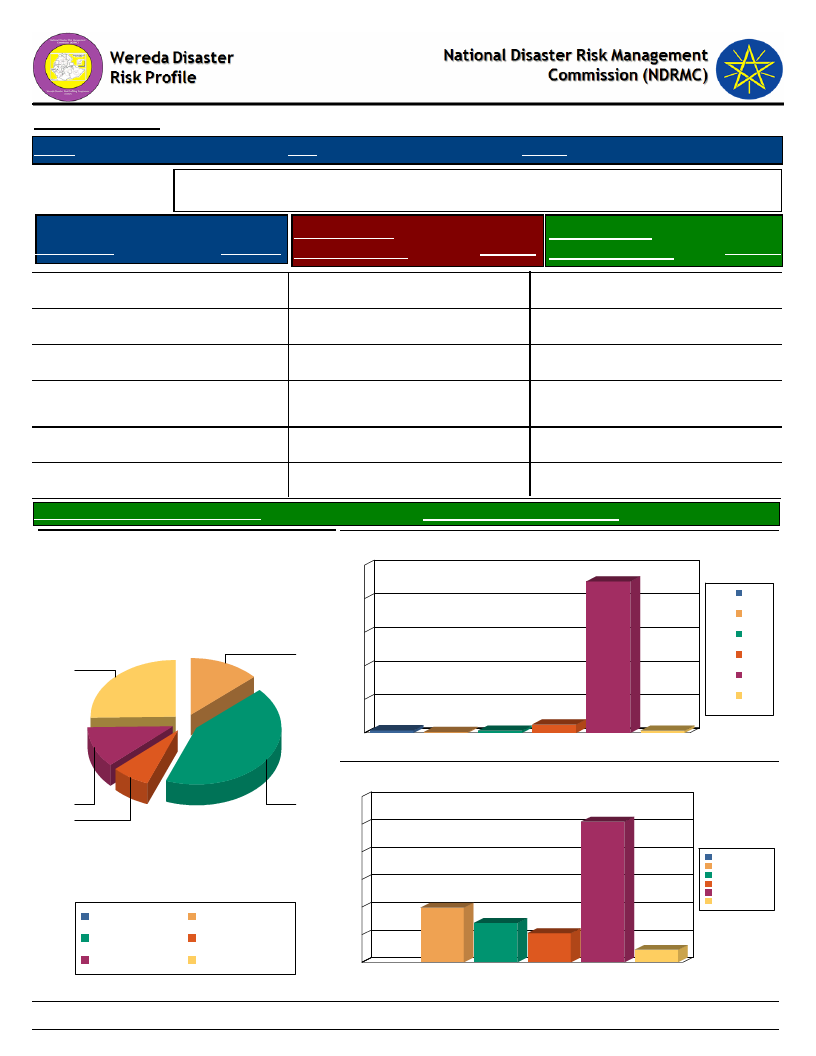
Data_Collected_Date
Region S.N.N.P
Zone GAMO GOFA
Tuesday, November 5, 2019
Wereda MIRAB ABAYA
Selected Indicator
Type of Road
Yes, paved
Physical Vulnerability: Access to Roads & Urban Centres - Households access to
road and urban centre
Time to Nearest
Response Paved Road (Mins.)
Time To Nearest
Response Urban Center (Mins.)
24.54 Less than 30 min
90.24 Less than 1 hr
Response
50.92
Yes, partly paved road
11.35 30 – 60 min
5.01 1 - 2 hrs
19.79
Yes, gravel road
7.12 1 – 2 hrs
1.58 2 - 4 hrs
14.25
Yes, dirt road (difficult
for car)
No road
41.16 2 – 3 hrs
12.93 3 – 4 hrs
0.53 4 - 6 hrs
1.32 More than 6 hrs
10.55
4.49
More than 4 hrs
1.32
Avg Time To Nearest Urban Center(Mins.)
Type of Road
13
25
11
41
7
Yes, dirt road (difficult
for car)
Yes, partly paved road
No road
Yes, gravel road
Yes, paved
121.14
Avg_Time_To_Nearest_Paved_Road
21.66
Time to reach the nearest paved road from the HH
100
90
80
60
40
20
2
0
1 – 2 hrs
1
2 – 3 hrs
1
3 – 4 hrs
5
30 – 60 min
Less than 30
min
1
More than 4
hrs
1 – 2 hrs
2 – 3 hrs
3 – 4 hrs
30 – 60 min
Less than 30 min
More than 4 hrs
Time to reach nearest urban center from the HH
60
51
50
40
30
20
20
14
11
10
1 - 2 hrs
2 - 4 hrs
4 - 6 hrs
Less than 1 hr
More than 6 hrs
4
0
1 - 2 hrs
2 - 4 hrs
4 - 6 hrs
Less than 1 hr More than 6 hrs
62
Page 1 of 1

Data_Collected_Date
Region S.N.N.P
Zone GAMO GOFA
Tuesday, November 5, 2019
Wereda MIRAB ABAYA
Selected Indicator
Physical Vulnerability: Access to Electricity - Households access and utilization
of electricity
Household_Located_In_Electricity
48.41
Household_Connected_To Electricity
41.64
63
Page 1 of 1
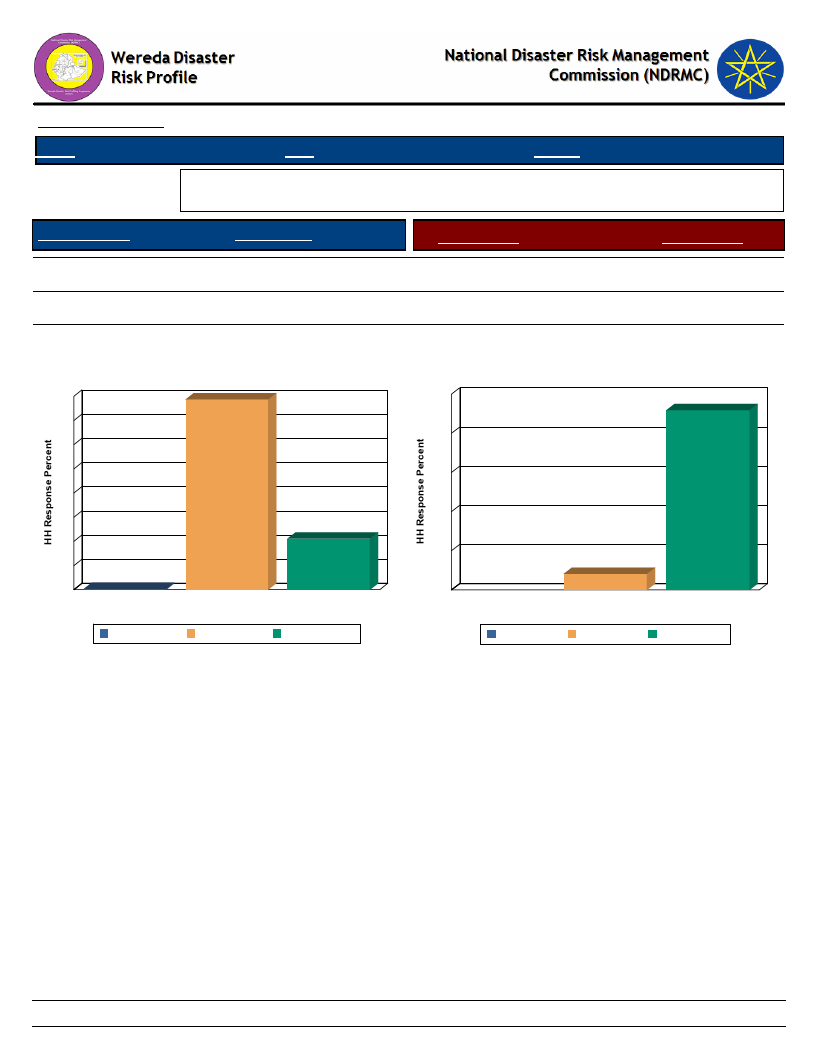
Data_Collected_Date
Region S.N.N.P
Zone GAMO GOFA
Tuesday, November 5, 2019
Wereda MIRAB ABAYA
Selected Indicator
Physical Vulnerability: Type of Dwelling Units - Households type of dwelling
houses
Floor Structure
HH Response
Type of Floor
HH Response
Tin house
78.63
Concrete
8.20
Wood and mud
21.11
Non-Concrete
91.80
Bamboo
0.26
Floor Structure
80
79
100
70
80
60
50
60
40
40
30
21
20
20
10
0
0
0
Bamboo
Tin house
Wood and mud
Floor Structure
Bamboo
Tin house
Wood and mud
Type of Floor
92
8
Concrete
Type of Floor
Concrete
Non-Concrete
Non-Concrete
64
Page 1 of 1
WDRP Indicators
Socio Demographic Characteristics
65

Wereda Disaster
Risk Profile
National Disaster Risk Management
Commission (NDRMC)
Data_Collected_Date
Tuesday, November 5, 2019
Region S.N.N.P
Selected Indicator
Kebele Name
ALGAE
ANKOBER
DELBO
DOSHE
FARAOSA
FETELE
Zone GAMO GOFA
Wereda MIRAB ABAYA
Economic Vulnerability: Level of Migration - Migration level and its characteristics by Kebele
Approx_No. Age_Group
Sex
Migration_Period
Migration Trend
Migration_Reason
Destination
8
150 - 165
Adult
All age group
Male
Both
January - April
March
Increased
Decreased
30
16 - 25
Working group
Both
Adult
Both
1998
1974, 1980, 1998
Increased
Decreased
105
All group
Both
1977, 1996
30
Working group
Both
1998
Decreased
Increased
Economic hardship,
job opportunities
Job opportunities,
loss of asset,
economic hardship.
Economic hardship.
The major reasons
for migration are loss
of assets, economic
hardship.
Job opportunities.
Economic hardship.
Dawro, Guji,
Dagene, Gomero, Melo
koza
Wanke, Majfo, Gidole,
Addis Ababa, Daramalo,
Umo lante
Arbaminch zuriya, Boreda,
Dugan
PURA
LAYO TERGA
MOLLE
30
House hold
Both
1998
30
Both
1998
Increased
Increased
---------
Economical hardship,
job opportunities,
lack of cultivation
land.
Economic hardship
Mebkozo, Dugena
Gomero/Boredo/
Dugana Gamo, Addis
Ababa, Melo koza
MOREDA
30 - 45
Adult, youth
Both
April, September
Increased
66
Job opportunities,
loss of asset,
economic hardship.
Addis Ababa, Boroda, Alge,
Ugayehu, Umo Hante,
Chano, both rural and
urban area.
Page 1 of 2
Wereda Disaster
Risk Profile
Data_Collected_Date
National Disaster Risk Management
Commission (NDRMC)
Tuesday, November 5, 2019
Region S.N.N.P
Selected Indicator
Kebele Name
KOLA BANENA
KOLA MULAT0
Zone GAMO GOFA
Wereda MIRAB ABAYA
Economic Vulnerability: Level of Migration - Migration level and its characteristics by Kebele
Approx_No. Age_Group
Sex
Migration_Period
Migration Trend
Migration_Reason
Destination
20 - 50
Adult
Both
2008
200
House head
Make
2000
Increased
Increased
Job opportunity.
Job opportunities.
Malokoza, Gammo Goffa,
Nazreth, Addis Ababa,
Hawassa, Moyale, Shathe,
Mojo
Wolkite, Melokoza
KORGA GERAMO
40
UGAYO
50
Youth and adult Both
Both
December
1977
Increased
Decreased
Economical hardship,
loss of asset.
Economic hardship.
Wolrayta, Oromiya,
Sidamo, Gofa and Kanse
Addis Ababa, Guji, Koyre
UMO LANTE
WANKE WAGEFO
30 - 40
Adult and youth Both
Decreased
---------
Loss of asset,
economic hardship,
landless.
Ginka
WOYE BARENA
YAYEKE
ZALA GUTESHA
ZALA BARANA
1000
130
120
120
All group
Youth
Both
Mixed
All age groups
Both
Both
1977 *- 2008
July, August,
September
1996
April, October
Increased
Increased
Increased
Increased
Job opportunities.
Job opportunities,
loss of asset,
economic hardship.
Economic hardship.
Wolayta Sodo, Arab Minch,
Addis Ababa
Addis Ababa, Jinka,
Diredawa
Addis Ababa, Borena,
Sidama
67
Page 2 of 2
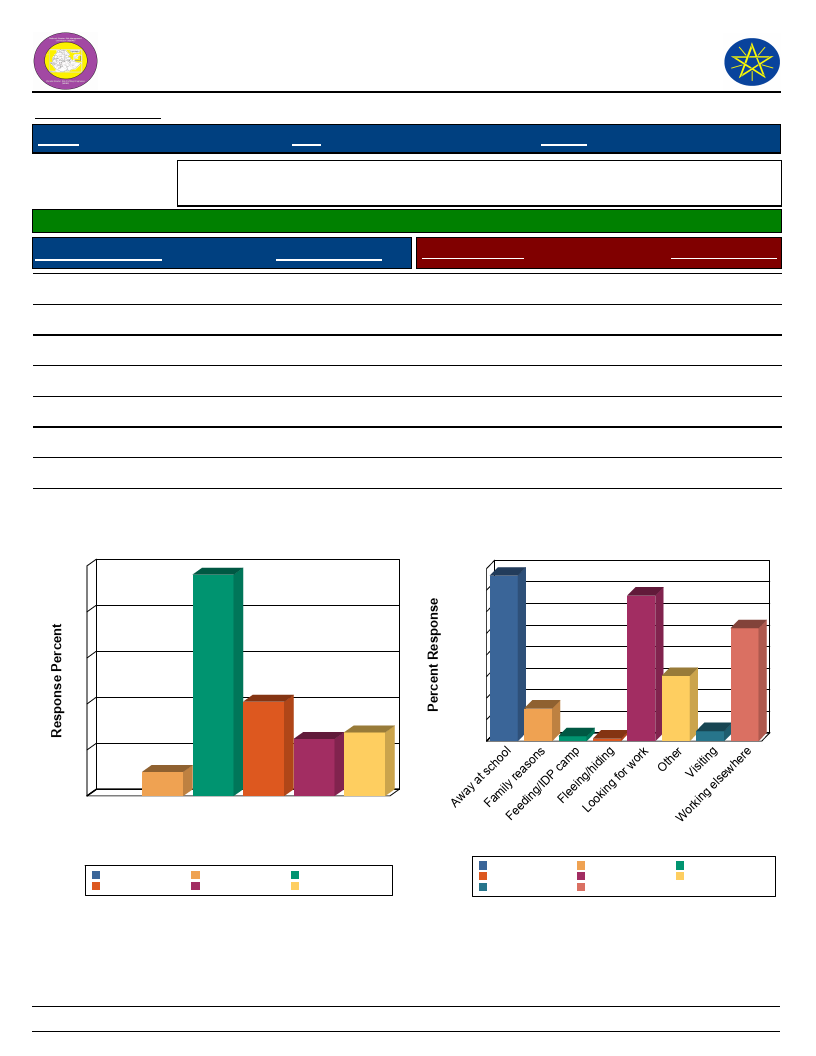
Wereda Disaster
Risk Profile
Data_Collected_Date
Region S.N.N.P
National Disaster Risk Management
Commission (NDRMC)
Tuesday, November 5, 2019
Zone GAMO GOFA
Wereda MIRAB ABAYA
Selected Indicator
Economic Vulnerability: Household Migration - Household migration and reason
for migration
Households who migrated (%)
8.79
Duration of Migration
Response Percent
Migration Reason
Response Percent
Less than 2 weeks
Two weeks – month
3 – 6 months
> 6 months
A month – 3 months
12.38
13.81
48.10
5.24
20.48
Visiting
Family reasons
Working elsewhere
Fleeing/hiding
Looking for work
Feeding/IDP camp
Away at school
Other
1.86
6.05
20.93
0.47
26.98
0.93
30.70
12.09
Duration of Migration
50
48
40
30
20
10
5
20
14
12
0
> 6 3 – 6 A month Less Two
months months – 3 than 2 weeks –
months weeks month
Duration of Migration
A month – 3 months
> 6 months
Less than 2 weeks
3 – 6 months
Two weeks – month
Migration Reason
32 31
28
27
24
21
20
16
12
12
8
6
4
10
0
Away at sFcahmooilylFereeadsinogn/sIDP cFalmeepingL/ohoidkiningg for work
2
ther
O
Visitingelsewhere
orking
W
Migration Reason
Away at school
Fleeing/hiding
Visiting
Family reasons
Looking for work
Working elsewhere
Feeding/IDP camp
Other
68
Page 1 of 1
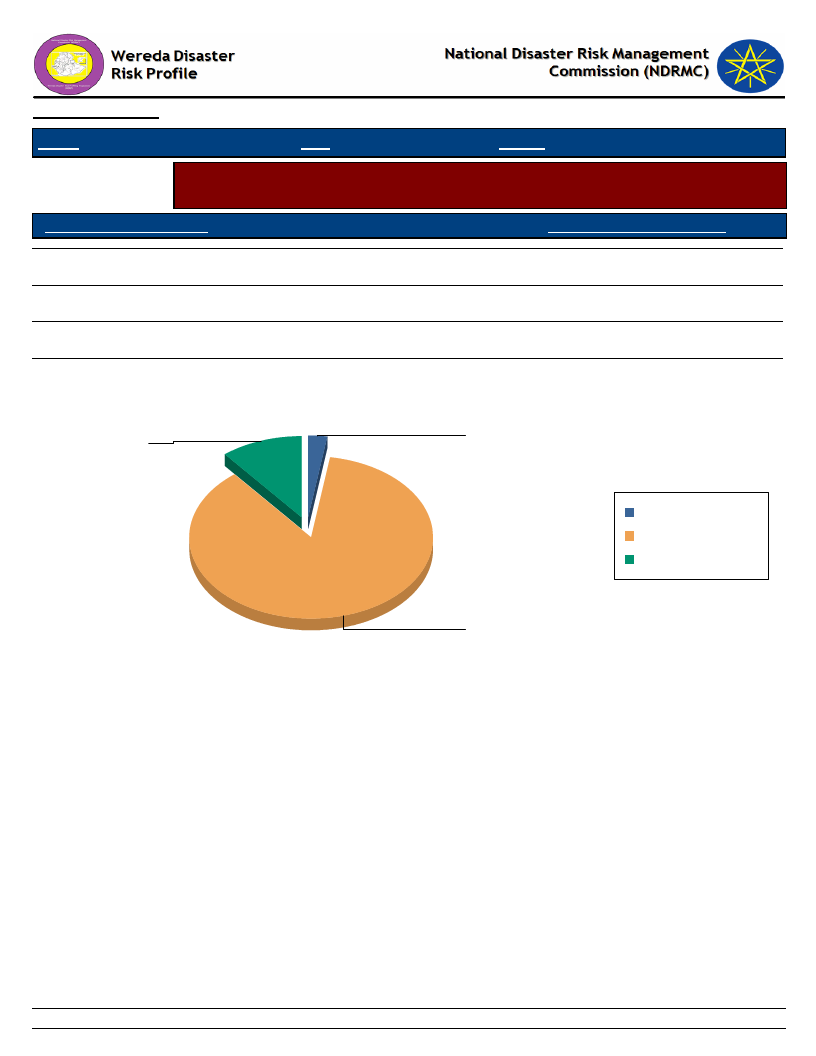
Data_Collected_Date
Tuesday, November 5, 2019
Region S.N.N.P
Zone GAMO GOFA
Wereda MIRAB ABAYA
Selected Indicator
Economic Vulnerability: Household Migration - Disasters as a triggering factor for
migration (households response in %)
Is Migration Due to Hazard?
HH Response - Due To Hazard
No
88.92
Yes
11.08
Migration partly because of such impacts
2.49
Is Migration Due to Hazard?
Yes
11.1
Migration partly because of such
impacts
2.5
Migration partly because
of such impacts
No
Yes
No
88.9
69
Page 1 of 1
Data_Collected_Date
Region S.N.N.P
Zone GAMO GOFA
Selected Indictor: Demography: Population Structure
KEY:
Male
Female
A-Children
(0-12 yrs)
ALGAE
-
-
ANKOBER
51
49
DELBO
-
-
DOSHE
49
51
FARAOSA
48
52
FETELE
-
-
KOLA BANENA
-
-
KOLA MULAT0
-
-
KORGA GERAMO
49
51
LAYO TERGA
49
51
MOLLE
-
-
MOREDA
49
51
Tuesday, November 5, 2019
Wereda MIRAB ABAYA
B-Youth
(12-25 yrs)
-
-
51
49
-
-
49
51
48
52
-
-
-
-
-
-
49
51
49
51
-
-
49
51
C-Working
(25-55 yrs)
-
-
51
49
-
-
49
51
-
-
-
-
-
-
-
-
48
52
49
51
-
-
49
51
D-Older
(Above 55
-
-
51
49
-
-
47
53
49
51
-
-
-
-
-
-
49
51
49
51
-
-
49
51
70
Page 1 of 2
Data_Collected_Date
Region S.N.N.P
Zone GAMO GOFA
Selected Indictor: Demography: Population Structure
A-Children
(0-12 yrs)
PURA
-
-
UGAYO
-
-
UMO LANTE
51
49
WANKE WAGEFO
51
49
WOYE BARENA
-
-
YAYEKE
49
51
ZALA BARANA
49
51
ZALA GUTESHA
-
-
Tuesday, November 5, 2019
Wereda MIRAB ABAYA
B-Youth
(12-25 yrs)
-
-
-
-
49
51
51
49
49
51
49
51
49
51
-
-
C-Working
(25-55 yrs)
-
-
-
-
49
51
51
49
49
51
49
51
49
51
-
-
D-Older
(Above 55
-
-
-
-
49
51
51
49
49
51
49
51
49
51
-
-
71
Page 2 of 2
Data_Collected_Date
Region S.N.N.P
Zone GAMO GOFA
Tuesday, November 5, 2019
Wereda MIRAB ABAYA
Selected Indicator
Demography: Population Trends and Ethnic Groups
Kebele Name
Population Change Trend
Population Change Reasons
Ethnic_Groups
ALGAE
ANKOBER
DELBO
DOSHE
FARAOSA
FETELE
PURA
LAYO TERGA
MOLLE
MOREDA
KOLA BANENA
KOLA MULAT0
KORGA GERAMO
Increased
Increased
Increased
Increased
Increased
Increased
Increased
Increased
Increased
Increased
Increased
Increased
Increased
UGAYO
UMO LANTE
WANKE WAGEFO
WOYE BARENA
YAYEKE
ZALA GUTESHA
ZALA BARANA
Increased
Increased
Increased
Increased
Increased
Increased
Increased
More children, high birth rate
More children
High birth rate, in migration
More children
More children
High birth rate
High birth rate, in migration
High birth rate
High birth rate/more children
More children, large local family.
High birth rate/more children
High birth rate, in-migration
More children, in-migration
High birth rate
More children, immigration
In migration
More children
More children
High birth rate
More children
Gediaho
Gamo, Wolayta,
Goffa
Gamo, Wolayta
Gammo
Gammo
Gammo
Gamo, Wolayita
Gammo
Gammo
Gammo
Gedicho
Gammo, Wolyita,
Gidlcho
Oromo, Gidicho,
Wolayita, Gammo,
Goffa, Sidama,
Konso, Amara
Gammo
Gammo, Wolayta
Gammo, Wolayta,
Gidicho, Oromo
Gammo
Gamo
Gammo
Gammo
72
Page 1 of 1
Data_Collected_Date
Tuesday, November 5, 2019
Region S.N.N.P
Zone
GAMO GOFA
Wereda MIRAB ABAYA
Selected Indicator
Social Vulnerability: Household Demographic Characteristics - Demographic
characteristics of households
Demographic Indicator
Indicator_Value Comments
Average household size
7.0
Sex ratio
971.0 Number of females per 1000 males
Child sex ratio (under 14 yrs)
1,019.0 Number of females per 1000 males
Adult sex ratio (18 & Above yrs)
959.0 Number of females per 1000 males
Dependency ratio ([(0-14)+(64+)] / (15-64)
0.8
yrs)
73
Page 1 of 1
Wereda Disaster
Risk Profile
Data_Collected_Date
National Disaster Risk Management
Commission (NDRMC)
Tuesday, November 5, 2019
Region S.N.N.P
Selected Indicator
General Awareness
Zone
GAMO GOFA
Wereda MIRAB ABAYA
Social Vulnerability: Level of Educational Attainment - Education status of household members
Percentage Educational Level
Percentage
Read and understand text - Yes, easily
Read and understand text - Yes, with
difficulty
Can write letters - Yes, easily
Can write letters - Yes, with difficulty
7.00
12.87
From Proportion of population (7+) - Less than 1st grade completed
Primary Education (Grade 1 - 6) Student
6.59
12.23
Secondary School Education (7 - 12) Student
From Proportion of population (7+) - Technical / vocational
certificate or diploma
From Proportion of population (15+) - Technical
From Proportion of population (15+) - Diploma
From Proportion of population (15+) - Pursuing or completed
University
UNIVERSITY DEGREE
From Proportion of population (7+) - University diploma
From Proportion of population (7+) - Pursuing University degree
From Proportion of population (7+) - University degree or higher
From Proportion of population (15+) - Less than 1st grade
From Proportion of population (15+) - Primary (1-6)
From Proportion of population (15+) - Secondary (7-12)
24.94
45.84
25.71
1.08
1.50
1.69
1.13
0.50
1.22
0.81
0.36
27.78
34.98
32.35
74
Page 1 of 2
Wereda Disaster
Risk Profile
Data_Collected_Date
National Disaster Risk Management
Commission (NDRMC)
Tuesday, November 5, 2019
Region S.N.N.P
Selected Indicator
General Awareness
Zone
GAMO GOFA
Wereda MIRAB ABAYA
Social Vulnerability: Level of Educational Attainment - Education status of household members
Percentage Educational Level
Percentage
General Literacy Rate
Proportion of literate population (7+) to total 7+
population
Percentage
14.73
Adult Literacy Rate
Proportion of literate population (15+) to total 15+
population
Percentage
11.21
75
Page 2 of 2

Data_Collected_Date
Tuesday, November 5, 2019
Region S.N.N.P
Zone GAMO GOFA
Wereda MIRAB ABAYA
Selected Indicator
Social Vulnerability: Gender Parity - Gender parity in education level (7+ years)
and household heading
Educational Level
Male_Percent
Female_Percent
From Proportion of population (7+) - Less than 1st grade
completed
From Proportion of population (7+) - Technical / vocational
certificate or diploma
From Proportion of population (7+) - University diploma
39.02
54.17
62.96
60.98
45.83
37.04
From Proportion of population (7+) - Pursuing University degree
66.67
33.33
From Proportion of population (7+) - University degree or higher
71.43
28.57
Primary Education (Grade 1 - 6) Student
53.30
46.70
Secondary School Education (7 - 12) Student
56.38
43.62
Male Head of HH
86.32
Female Head of HH
13.68
76
Page 1 of 1
WDRP Indicators
Environmental Characteristics
77

Data_Collected_Date
Region S.N.N.P
Zone GAMO GOFA
Tuesday, November 5, 2019
Wereda MIRAB ABAYA
Selected Indicator
Environmental Situation: Environmental Problems - Major environmental
problems by Kebele
KebeleName
Problem_1
Problem_2
Problem_3
Problem4
ALGAE
ANKOBER
Deforestation
Soil erosion
Increasing of lake
Abaya/water logging
Deforestation
DELBO
Deforestation
Soil erosion
Pests
DOSHE
Deforestation
Soil erosion
Pest and insects
FARAOSA
Deforestation
FETELE
Deforestation
Soil erosion
PURA
Land
Water
Deforestation
Soil erosion
LAYO TERGA
Soil erosion
Pests
Deforestation
MOLLE
MOREDA
Deforestation,
climate change
Soil erosion
Deforestation
KOLA BANENA
Deforestation
Soil erosion
KOLA MULAT0
Soil erosion
Deforestation
KORGA GERAMO
Soil erosion
Deforestation
High temperature
Shortage of rain fall
UGAYO
Soil erosion
Deforestation
Pest
UMO LANTE
Soil erosion
Deforestation
WANKE WAGEFO
Soil erosion
Deforestation
Insect pest
High temperature
WOYE BARENA
YAYEKE
Soil erosion
Deforestation
78
Page 1 of 2
Data_Collected_Date
Region S.N.N.P
Zone GAMO GOFA
Tuesday, November 5, 2019
Wereda MIRAB ABAYA
Selected Indicator
Environmental Situation: Environmental Problems - Major environmental
problems by Kebele
KebeleName
Problem_1
Problem_2
Problem_3
Problem4
ZALA GUTESHA
Soil erosion
Deforestation
Pest
ZALA BARANA
Soil erosion
Land slide
Deforestation
79
Page 2 of 2
Data_Collected_Date
Tuesday, November 5, 2019
Region S.N.N.P
Zone GAMO GOFA
Wereda MIRAB ABAYA
Selected Indicator
Environmental Situation: General Land Quality - Perceptions of the community
on changes in the general quality of land over a decade
KebeleName
Current_Situation
Change_Last_Decade
Comment
ALGAE
ANKOBER
Poor
Decreased
DELBO
DOSHE
Poor
Decreased
FARAOSA
FETELE
PURA
LAYO TERGA
MOLLE
MOREDA
Poor
Decreased
Soil erosion
KOLA BANENA
KOLA MULAT0
KORGA GERAMO
Medium
Decreased
UGAYO
UMO LANTE
Medium
Decreased
WANKE WAGEFO
WOYE BARENA
YAYEKE
Poor
Decreased
ZALA GUTESHA
ZALA BARANA
Poor
Decreased
80
Page 1 of 1
Data_Collected_Date
Tuesday, November 5, 2019
S.N.N.P
Region
Selected Indicator
Zone GAMO GOFA
Wereda MIRAB ABAYA
Environmental Situation: Changes in Landscape - Changes observed by the
community on landscape and the problems due to the changes
KebeleName
Changes_Observed
Problems_Due_To_Changes
ALGAE
ANKOBER
Shortage of grass land due
to expansion of farm land
Deteriorated
Income decreased, exposed to poverty, animal
product decreased
Loss of crop and animal products
DELBO
DOSHE
FARAOSA
Deforestation, shortage of
grass land due to expansion
of farm land
Temperature increased, soil erosion, gully
formation.
FETELE
PURA
LAYO TERGA
MOLLE
MOREDA
Shortage of grass land due
to expansion of farm land
Animal fodder shortage
KOLA BANENA
KOLA MULAT0
KORGA GERAMO
UGAYO
Shortage of grass land due
to expansion of farm land
Shortage of grass land due
to expansion of farm land
Expansion of cultivated
land, soil erosion
increased, deforestation,
lack of pasture
Income loss, exposed to poverty, animal
production
Drought, disease prevalence
UMO LANTE
WANKE WAGEFO
Improper land use system,
traditional and poor
management, less land
coverage
Soil erosion, land degradation
81
Page 1 of 2
Data_Collected_Date
Tuesday, November 5, 2019
S.N.N.P
Region
Selected Indicator
Zone GAMO GOFA
Wereda MIRAB ABAYA
Environmental Situation: Changes in Landscape - Changes observed by the
community on landscape and the problems due to the changes
KebeleName
Changes_Observed
Problems_Due_To_Changes
WOYE BARENA
YAYEKE
ZALA GUTESHA
Deforestation, shortage of
pasture
Soil erosion and gully formation
ZALA BARANA
Expansion of cultivated
land, soil erosion,
deforestation, lack of
pasture
Drought, animal disease and human disease
82
Page 2 of 2
Wereda Disaster Risk
Profile
Data_Collected_Date
Region S.N.N.P
Zone GAMO GOFA
National Disaster Risk Management
Commission (NDRMC)
Tuesday, November 5, 2019
Wereda MIRAB ABAYA
Selected Indicator
Kebele Name
Environmental Situation: Land-Use other than crop production - Types of land use other than crop production
across Kebeles
Landuse_1
Comments_1
Landuse_2
Comments_2
Landuse_3
Comments_3
ALGAE
Grazing land
For animal husbandry
Forest
ANKOBER
Grazing land
98.25 ha
Forest land
157 ha
Others
329.5 ha
DELBO
Grazing land
For livestock
Forest land
400 ha
Honey production
6 ha
DOSHE
Grazing land
41.5 ha
Forest
21 ha
Bush
73 ha
FARAOSA
Grazing land
120 ha
Honey production
20 ha
Forest harvest
300 ha
FETELE
Grazing land
60 a
Honey production
2 ha
Forest
360 ha
PURA
Grazing land
60 ha
Forest
Gully land
LAYO TERGA
MOLLE
Grazing land
Forest
MOREDA
Crop production
634 ha
Grazing land use
45 ha
Forest
121.5 ha
KOLA BANENA
Grazing land
Forest
KOLA MULAT0
Grazing land
Honey production
Forest
KORGA GERAMO
Grazing land
864 ha
Forest land
368 ha
UGAYO
Grazing land
Honey production
Forest harvest
UMO LANTE
Grazing land
35 ha
Forest
83
645 ha
Other/lake and
bush
130 ha
Page 1 of 2
Wereda Disaster Risk
Profile
Data_Collected_Date
Region S.N.N.P
Zone GAMO GOFA
National Disaster Risk Management
Commission (NDRMC)
Tuesday, November 5, 2019
Wereda MIRAB ABAYA
Selected Indicator
Kebele Name
Environmental Situation: Land-Use other than crop production - Types of land use other than crop production
across Kebeles
Landuse_1
Comments_1
Landuse_2
Comments_2
Landuse_3
Comments_3
WANKE WAGEFO
Grazing land
30 ha
Forest
276 ha
Bush land
210 ha
WOYE BARENA
Grazing land
Forest
YAYEKE
Cultivated land
984 ha
Forest land
64 ha
Grazing land
120 ha
ZALA GUTESHA
Grazing land
Forest harvest
Honey production
ZALA BARANA
Grazing land
192 hectare
Forest harvest
234 hectare
84
Page 2 of 2

Data_Collected_Date
Region S.N.N.P
Zone GAMO GOFA
Tuesday, November 5, 2019
Wereda MIRAB ABAYA
Selected Indicator
KebeleName
Environmental Situation: Deforestation - Observed changes over levels of
deforestation by the community and its problems
Changes_Observed
Problems_Due_To_Changes
ALGAE
Increasing
Soil fertility decreased
ANKOBER
Increased
Drought, soil erosion, climate change
DELBO
Increasing
Drought, flood
DOSHE
Increased
Climate change, erratic rain fall
FARAOSA
FETELE
Increasing
Increasing
Climate change, shortage of rain fall, change of crop
calendar
Drought, livestock disease, lack of fodder
PURA
LAYO TERGA
Increasing
Increasing
Weather and climate change, drought, flood, high
temperature in community
Climate change, re cultivation of rain period, erosion
MOLLE
Increased
Soil fertility decreased
MOREDA
Increased
Climate change, erratic rain fall, soil erosion
KOLA BANENA
Increased
Soil fertility decreased
KOLA MULAT0
Increased
Drought, soil erosion, climate change
KORGA GERAMO
UGAYO
Because of area
closure the level of
deforestation
decreased
Increasing
Grazing land coverage diminished
Drought, fluctuation of climate, lack of fodder, soil erosion
UMO LANTE
WANKE WAGEFO
Increased
Increased
Climate change, erratic rain fall, land degradation by
erosion
Drought, flood, storm/high wind pressure
WOYE BARENA
Increased
85
Page 1 of 2
Data_Collected_Date
Region S.N.N.P
Zone GAMO GOFA
Tuesday, November 5, 2019
Wereda MIRAB ABAYA
Selected Indicator
KebeleName
Environmental Situation: Deforestation - Observed changes over levels of
deforestation by the community and its problems
Changes_Observed
Problems_Due_To_Changes
YAYEKE
Decreased
Climate change, erratic rain fall
ZALA GUTESHA
Increasing
Soil erosion, climate change
ZALA BARANA
Increased
Soil erosion is high, climate change
86
Page 2 of 2
Wereda Disaster
Risk Profile
National Disaster Risk Management
Commission (NDRMC)
Data_Collected_Date
Region S.N.N.P
Zone GAMO GOFA
Wereda
MIRAB ABAYA
Tuesday, November 5, 2019
Selected Indicator
KebeleName
Environmental Situation: Natural Resources Availability - Natural resources available and changes observed by
the community
ALGAE
Resources_1
Land
Resources_3
Forest
Observed_Change_1
Decreased
Observed_Change_3
Decreased
Problems_Changes_1
Resources_2
Loss of cultivated land and scarcity of
land.
Fish
Problems_Changes_3
Resources_4
Climate change
Observed_Change_2
Problems_Changes_2
Increased
No
Observed_Change_4
Problems_Changes_4
KebeleName
ANKOBER
Resources_1
Land
Observed_Change_1
Remain the same
Problems_Changes_1
Land size problem.
Resources_3
Observed_Change_3
Problems_Changes_3
Forest
Decreased
Deforestation, climate change,
Resources_2
Water
Resources_4
Wood
Observed_Change_2
Decreased
Problems_Changes_2
Shortage of irrigation water for crop
production.
KebeleName
DELBO
Observed_Change_4
Problems_Changes_4
Decreased
Logging of time to harvest fire wood.
87
Page 1 of 10
Wereda Disaster
Risk Profile
National Disaster Risk Management
Commission (NDRMC)
Data_Collected_Date
Region S.N.N.P
Zone GAMO GOFA
Wereda
MIRAB ABAYA
Tuesday, November 5, 2019
Selected Indicator
Resources_1
Observed_Change_1
Problems_Changes_1
Resources_2
Environmental Situation: Natural Resources Availability - Natural resources available and changes observed by
the community
Land
Resources_3
Forest/wood
Decreased
Observed_Change_3
Increasing
Drought due to cultivation, land shortage,
high population growth.
Water
Problems_Changes_3
Resources_4
Climate change.
Fish
Observed_Change_2
Problems_Changes_2
Increased
Observed_Change_4
Problems_Changes_4
Decreased
Decreasing of fish population..
KebeleName
DOSHE
Resources_1
Land
Observed_Change_1
Fertility
Problems_Changes_1
Yield reduction.
Resources_3
Observed_Change_3
Problems_Changes_3
Forest
Deforestation
Climate change.
Resources_2
Water
Resources_4
Fish
Observed_Change_2
Problems_Changes_2
Drainage size
Less coverage of irrigable land.
Observed_Change_4
Problems_Changes_4
KebeleName
FARAOSA
88
Page 2 of 10

Wereda Disaster
Risk Profile
National Disaster Risk Management
Commission (NDRMC)
Data_Collected_Date
Region S.N.N.P
Zone GAMO GOFA
Wereda
MIRAB ABAYA
Tuesday, November 5, 2019
Selected Indicator
Resources_1
Observed_Change_1
Problems_Changes_1
Environmental Situation: Natural Resources Availability - Natural resources available and changes observed by
the community
Land
Resources_3
Forest
Decreased
Observed_Change_3
Decreasing
Shortage of cultivation.
Problems_Changes_3
Climate and weather change.
Resources_2
Water
Resources_4
Wood
Observed_Change_2
Problems_Changes_2
No change
No change.
Observed_Change_4
Problems_Changes_4
Decreasing
Weather pollution.
KebeleName
FETELE
Resources_1
Land
Observed_Change_1
Decreasing
Problems_Changes_1
Shortage of cultivation.
Resources_3
Observed_Change_3
Problems_Changes_3
Forest
Decreasing
Due to deforestation.
Resources_2
Water
Resources_4
Wood
Observed_Change_2
Problems_Changes_2
No change
No change
Observed_Change_4
Problems_Changes_4
Decreasing
Due to house construction.
KebeleName
KOLA BANENA
89
Page 3 of 10
Wereda Disaster
Risk Profile
National Disaster Risk Management
Commission (NDRMC)
Data_Collected_Date
Region S.N.N.P
Zone GAMO GOFA
Wereda
MIRAB ABAYA
Tuesday, November 5, 2019
Selected Indicator
Resources_1
Observed_Change_1
Problems_Changes_1
Environmental Situation: Natural Resources Availability - Natural resources available and changes observed by
the community
Land
Resources_3
Forest
Decreased
Observed_Change_3
Decrease
Shortage of cultivated land.
Problems_Changes_3
Rain fall shortage.
Resources_2
Water
Resources_4
Wood
Observed_Change_2
Problems_Changes_2
No
change
Observed_Change_4
Problems_Changes_4
Decreased
Shortage for consumption.
KebeleName
KOLA MULAT0
Resources_1
Land
Observed_Change_1
Remain the same
Problems_Changes_1
Land size problem.
Resources_3
Observed_Change_3
Problems_Changes_3
Forest
Decreased
Deforestation, soil erosion, climate change.
Resources_2
Water
Resources_4
Wood
Observed_Change_2
Decreased
Problems_Changes_2
Shortage of irrigation water for crop
production, reduce yield.
KebeleName
KORGA GERAMO
Observed_Change_4
Problems_Changes_4
Decreased
Hogging of time to harvest fire wood.
90
Page 4 of 10

Wereda Disaster
Risk Profile
National Disaster Risk Management
Commission (NDRMC)
Data_Collected_Date
Region S.N.N.P
Zone GAMO GOFA
Wereda
MIRAB ABAYA
Tuesday, November 5, 2019
Selected Indicator
Resources_1
Observed_Change_1
Problems_Changes_1
Environmental Situation: Natural Resources Availability - Natural resources available and changes observed by
the community
Land
Resources_3
Forest
Decreased of soil fertility.
Observed_Change_3
Deforestation
Yield reduction.
Problems_Changes_3
Climate change, soil erosion.
Resources_2
Water
Resources_4
Fish
Observed_Change_2
Problems_Changes_2
No change
Observed_Change_4
Problems_Changes_4
No change
KebeleName
LAYO TERGA
Resources_1
Land
Observed_Change_1
Decreased
Problems_Changes_1
Shortage of cultivation land.
Resources_3
Observed_Change_3
Problems_Changes_3
Fish
Decreased
Climate change.
Resources_2
Water
Resources_4
Wood
Observed_Change_2
Problems_Changes_2
Decreased
Lack of water dam.
Observed_Change_4
Problems_Changes_4
Decreased
Fire wood, construction increasing.
KebeleName
MOLLE
91
Page 5 of 10

Wereda Disaster
Risk Profile
National Disaster Risk Management
Commission (NDRMC)
Data_Collected_Date
Region S.N.N.P
Zone GAMO GOFA
Wereda
MIRAB ABAYA
Tuesday, November 5, 2019
Selected Indicator
Resources_1
Observed_Change_1
Problems_Changes_1
Resources_2
Environmental Situation: Natural Resources Availability - Natural resources available and changes observed by
the community
Land
Resources_3
Decreased
Observed_Change_3
Loss of cultivated land and scarcity of
land.
Forest
Problems_Changes_3
Resources_4
Observed_Change_2
Problems_Changes_2
Decreased
Climate change.
Observed_Change_4
Problems_Changes_4
KebeleName
MOREDA
Resources_1
Land
Observed_Change_1
Decreased of soil fertility
Problems_Changes_1
Reduction of yield.
Resources_2
Water
Resources_3
Observed_Change_3
Problems_Changes_3
Resources_4
Wood
Deforestation
Climate change, lack of fire wood, soil
erosion.
Forest
Observed_Change_2
Problems_Changes_2
Access of water reduced
Less consumption of water, drought.
Observed_Change_4
Problems_Changes_4
Deforestation
Migration of wild animal, soil erosion.
KebeleName
PURA
92
Page 6 of 10
Wereda Disaster
Risk Profile
National Disaster Risk Management
Commission (NDRMC)
Data_Collected_Date
Region S.N.N.P
Zone GAMO GOFA
Wereda
MIRAB ABAYA
Tuesday, November 5, 2019
Selected Indicator
Resources_1
Observed_Change_1
Problems_Changes_1
Resources_2
Environmental Situation: Natural Resources Availability - Natural resources available and changes observed by
the community
Land
Resources_3
Forest/wood
Decreased
Observed_Change_3
Increased/decreased
Shortage of cultivation land.
Water
Problems_Changes_3
Resources_4
No problems./fire wood, construction is
increasing.
Fish
Observed_Change_2
Increased
Problems_Changes_2
Irrigation water decreased, pure water
supply for community is good.
KebeleName
UGAYO
Resources_1
land
Observed_Change_1
Decreased
Problems_Changes_1
Shortage of cultivation land.
Observed_Change_4
Problems_Changes_4
Decreased
Degeneration of fish population.
Resources_3
Observed_Change_3
Problems_Changes_3
Forest
Increasing
Resources_2
Observed_Change_2
Problems_Changes_2
Water
No change
Resources_4
Observed_Change_4
Problems_Changes_4
Fish
Decreasing
Drought, soil erosion, high temperature.
KebeleName
UMO LANTE
93
Page 7 of 10

Wereda Disaster
Risk Profile
National Disaster Risk Management
Commission (NDRMC)
Data_Collected_Date
Region S.N.N.P
Zone GAMO GOFA
Wereda
MIRAB ABAYA
Tuesday, November 5, 2019
Selected Indicator
Resources_1
Observed_Change_1
Problems_Changes_1
Environmental Situation: Natural Resources Availability - Natural resources available and changes observed by
the community
Land
Resources_3
Forest
Fertility, soil erosion
Observed_Change_3
Deforestation
Yield failure, less production.
Problems_Changes_3
Land degraded, climate change.
Resources_2
Observed_Change_2
Problems_Changes_2
Water
No problem
Resources_4
Observed_Change_4
Problems_Changes_4
KebeleName
WANKE WAGEFO
Resources_1
Land
Observed_Change_1
Decreased
Problems_Changes_1
Shortage of cultivation land.
Resources_3
Observed_Change_3
Problems_Changes_3
Forest
Coverage increased
No problem at all.
Resources_2
Observed_Change_2
Problems_Changes_2
Water
Demand of irrigation increased
Due to sustainable crop problem.
Resources_4
Observed_Change_4
Problems_Changes_4
Fish
Decrease fish species
De generate of shish species.
KebeleName
WOYE BARENA
94
Page 8 of 10

Wereda Disaster
Risk Profile
National Disaster Risk Management
Commission (NDRMC)
Data_Collected_Date
Region S.N.N.P
Zone GAMO GOFA
Wereda
MIRAB ABAYA
Tuesday, November 5, 2019
Selected Indicator
Resources_1
Observed_Change_1
Problems_Changes_1
Environmental Situation: Natural Resources Availability - Natural resources available and changes observed by
the community
Land
Resources_3
Forest
Soil fertility
Observed_Change_3
Deforestation
Yield reduction.
Problems_Changes_3
Soil erosion, climate change.
Resources_2
Observed_Change_2
Problems_Changes_2
Water
Drainage rate level of water
Lack of water.
Resources_4
Observed_Change_4
Problems_Changes_4
KebeleName
YAYEKE
Resources_1
Land
Observed_Change_1
Fertility
Problems_Changes_1
Yield reduction.
Resources_3
Observed_Change_3
Problems_Changes_3
Forest
Deforestation
Climate change.
Resources_2
Observed_Change_2
Problems_Changes_2
Water
Drainage size
Drought
Resources_4
Observed_Change_4
Problems_Changes_4
Wood
KebeleName
ZALA BARANA
95
Page 9 of 10
Wereda Disaster
Risk Profile
National Disaster Risk Management
Commission (NDRMC)
Data_Collected_Date
Region S.N.N.P
Zone GAMO GOFA
Wereda
MIRAB ABAYA
Tuesday, November 5, 2019
Selected Indicator
Resources_1
Observed_Change_1
Problems_Changes_1
Environmental Situation: Natural Resources Availability - Natural resources available and changes observed by
the community
Land
Resources_3
Pasture
Decrease soil fertility.
Observed_Change_3
Decrease
Yield reduction.
Problems_Changes_3
Shortage of food.
Resources_2
Forest
Resources_4
Wood
Observed_Change_2
Problems_Changes_2
Decrease
Soil erosion.
Observed_Change_4
Problems_Changes_4
Decrease
Time wasting for harvest.
KebeleName
ZALA GUTESHA
Resources_1
Land
Observed_Change_1
Decreasing
Problems_Changes_1
Shortage of cultivation land.
Resources_3
Observed_Change_3
Problems_Changes_3
Forest
Decreasing
Climate change, air pollution.
Resources_2
Water
Resources_4
Wood
Observed_Change_2
Problems_Changes_2
No change
No problem.
Observed_Change_4
Problems_Changes_4
Decreasing
Soil erosion, air pollution.
96
Page 10 of 10
Wereda Disaster
Risk Profile
National Disaster Risk Management
Commission (NDRMC)
Data_Collected_Date
Region S.N.N.P
Selected Indicator
Zone GAMO GOFA
Wereda MIRAB ABAYA
Environmental Situation: Rainfall & Temperature - Observed changes on rainfall and temperature by the
community over the last decade
Rainfall
Temperature
Tuesday, November 5, 2019
Kebele Name
Changes Observed Problems
Changes Observed
Problems
ALGAE
ANKOBER
DELBO
DOSHE
FARAOSA
FETELE
PURA
LAYO TERGA
MOLLE
MOREDA
KOLA BANENA
KOLA MULAT0
Decreased
Decreased
Decreasing
Decreased
Decreasing
Decreasing
Decreasing
Decreasing
Decreased
Decreased
Decreased
Decreased
Drought, famine, food gap
Reduction of yield, increased
drought.
Drought, high temperature
Drought, yield loss, pasture loss,
disease/malaria, typhoid, typhus
Drought, livestock disease, lack of
fodder
Crop production loss, low income,
shortage of fodder
Drought, lack of fodder
Drought, lack of fodder
Drought, famine
Drought
Drought, famine
Reduction of yield
Increased
Increased
Increasing
Increased
Increasing
Increasing
Increasing
Increasing
Increased
Increased
Increased
Increased
Affect human health and animal health.
Drought
Inconvenient living condition
Human and livestock disease
Human and livestock disease
Human disease, livestock disease
Late/delay in cultivation or crop calendar
Drought, climate change
Affect human health
97
Page 1 of 2
Wereda Disaster
Risk Profile
National Disaster Risk Management
Commission (NDRMC)
Data_Collected_Date
Region S.N.N.P
Selected Indicator
Zone GAMO GOFA
Wereda MIRAB ABAYA
Environmental Situation: Rainfall & Temperature - Observed changes on rainfall and temperature by the
community over the last decade
Rainfall
Temperature
Tuesday, November 5, 2019
Kebele Name
KORGA GERAMO
UGAYO
UMO LANTE
WANKE WAGEFO
WOYE BARENA
YAYEKE
ZALA GUTESHA
ZALA BARANA
Changes Observed Problems
Decreased
Drought, crop yield loss, lack of
pasture
Decreasing
Drought, livestock disease
Decreased
Reduction of crop yield and pasture
Decreased
Drought, famine, human disease
Decreased
Decreased
Decreasing
Decreased
Drought, human disease/malaria,
typhoid
Drought, livestock disease, food
shortage
Drought
Changes Observed
Problems
Increased
Human disease and animal disease
Increasing
Increased
Increased
Increased
Increased
Human disease increased
Human disease/typhoid
Due to climate and weather change
Increasing
Increased
Human disease, livestock disease,
environmental pollution
Human disease
98
Page 2 of 2
Data_Collected_Date
Region S.N.N.P
Zone GAMO GOFA
Tuesday, November 5, 2019
Wereda MIRAB ABAYA
Selected Indicator
KebeleName
Environmental Situation: Reasons for Environmental Changes
Reason_For_Environmental_Changes
ALGAE
High deforestation
ANKOBER
Deforestation, lack of rain fall, population density
DELBO
Poor land use system, deforestation, population increment
DOSHE
FARAOSA
Deforestation, soil erosion, gully formation, lack of rain fall, erratic rain
fall
Deforestation, population increment, poor land use system
FETELE
Deforestation, poor land use system, population increment
PURA
Deforestation, poor land use system, population increment
LAYO TERGA
Deforestation, poor land use system
MOLLE
Deforestation, poor land use system
MOREDA
Deforestation, soil erosion, drought
KOLA BANENA
KOLA MULAT0
KORGA GERAMO
UGAYO
Population increase, shortage of rain fall, climate change, investment
surrounding lake Abaya
Deforestation, poor land use system, population increment
UMO LANTE
Deforestation, soil erosion, population density increased
WANKE WAGEFO
Deforestation, poor land use system, population increase
WOYE BARENA
Deforestation, population density, poor land use and management
YAYEKE
ZALA GUTESHA
Deforestation, soil erosion/gully formation, lack of rain fall/erratic rain
fall
Deforestation, poor land use system, population increment
ZALA BARANA
Climate change, expansion of farm land, population increase
99
Page 1 of 1
Data_Collected_Date
Region S.N.N.P
Zone GAMO GOFA
Tuesday, November 5, 2019
Wereda MIRAB ABAYA
Selected Indicator
KebeleName
ALGAE
Environmental Situation: Soil Erosion - Observed changes on levels of soil
erosion by the community
Changes_Observed
Problems_Observed
Increased
Poor soil fertility
ANKOBER
Increase
Reduction of production, siltation, land degradation
DELBO
Increasing
Loss of crop yield, loss of fodder
DOSHE
Increase
Loss of productive soil, loss of yield
FARAOSA
Increasing
Loss of fertile soil, loss of crop production
FETELE
Increasing
PURA
Increasing
Soil erosion
LAYO TERGA
Increasing
Loss of soil fertility, loss of cultivation land
MOLLE
Increased
Poor soil fertility
MOREDA
KOLA BANENA
Increased
Increased
Reduction of yield, gully formation, decreased soil
fertility
Poor soil fertility
KOLA MULAT0
KORGA GERAMO
Increased
Increased
Reduction of productivity, siltation problem, land
degradation
Poor soil fertility
UGAYO
Increasing
Crop productivity decrease, soil fertile loss
UMO LANTE
Decreased
WANKE WAGEFO
Increased
Soil fertility decreased, productivity of crop decreased
WOYE BARENA
Increased
YAYEKE
Decreased
Loss of crop productivity, loss of fertile soil
ZALA GUTESHA
Increasing
Loss of fertile soil, yield reduction of crop, low income
ZALA BARANA
Increase
Poor soil fertility
100
Page 1 of 1
WDRP Indicators
Livelihood, Occupation and Source
of Food Characteristics
101
Wereda Disaster
Risk Profile
Data_Collected_Date
National Disaster Risk Management
Commission (NDRMC)
Tuesday, November 5, 2019
Region S.N.N.P
Zone
GAMO GOFA
Wereda MIRAB ABAYA
Selected Indicator
Economic Vulnerability: Major Occupational Categories - Major categories of occupation and percent of population
engaged in the occupation by Kebele
Occupational Categories and Percent of Population engaged within these occupational categories
Percent (%) of Population
KebeleName
Occupation 1
Population Occupation 2
Population Occupation 3
Population Occupation 4
Population
ALGAE
ANKOBER
DELBO
DOSHE
Crop production,
Animal husbandry,
Fishing
Agriculture production
-
Agriculture crop
production -
Crop production -
100
-
75
Livestock and fish
production -
100 Livestock husbandry -
69
Livestock production -
-
10
Petty trade -
35
-
30
Petty trade -
-
15
-
-
1
-
FARAOSA
Crop production -
100 Livestock production -
45
-
-
FETELE
Crop production -
100 Livestock production -
50
-
-
PURA
Crop production -
100 Livestock husbandry -
45
-
-
LAYO TERGA
Crop production -
100 Livestock production -
40
-
-
MOLLE
Crop production -
Livestock production -
Fishing -
Petty trade -
MOREDA
Crop production -
65
Livestock production -
20
Petty trade -
5
Poultry -
10
KOLA BANENA
Crop production and
livestock husbandry -
100
-
-
-
102
Page 1 of 2
Wereda Disaster
Risk Profile
Data_Collected_Date
National Disaster Risk Management
Commission (NDRMC)
Tuesday, November 5, 2019
Region S.N.N.P
Zone
GAMO GOFA
Wereda MIRAB ABAYA
Selected Indicator
Economic Vulnerability: Major Occupational Categories - Major categories of occupation and percent of population
engaged in the occupation by Kebele
Occupational Categories and Percent of Population engaged within these occupational categories
Percent (%) of Population
KebeleName
Occupation 1
Population Occupation 2
Population Occupation 3
Population Occupation 4
Population
KOLA MULAT0
Crop production -
100 Livestock production -
40
-
-
KORGA GERAMO
UGAYO
Crop production -
Crop production -
85
Livestock and fish
production -
100 Livestock production -
10
Off farming -
45
Weaving -
5
-
6
-
UMO LANTE
WANKE WAGEFO
WOYE BARENA
Crop production -
Crop production -
Crop production -
70
Livestock production -
100 Livestock and poultry
production -
Livestock production -
15
Off farming, petty
trade -
35
Trading -
-
15
-
5
-
-
YAYEKE
Crop production -
75
Livestock production -
20
Petty trade -
5
-
ZALA GUTESHA
Crop production -
100 Livestock production -
45
Weaving -
5
-
ZALA BARANA
Crop production -
85
Livestock production -
12
Petty trade -
3
-
103
Page 2 of 2
Data_Collected_Date
Region S.N.N.P
Zone GAMO GOFA
Tuesday, November 5, 2019
Wereda MIRAB ABAYA
Selected Indicator
Economic Vulnerability: Livelihoods - Households important sources of
livelihood (response in %)
Type of Livelihood Activity
Order of Importnce
Agricultural laborer
1st
2nd
3rd
7.12
4.17
4.81
Animal herder
0.00
0.76
0.00
Barber or Hairdresser
0.00
0.00
0.96
Basket-making, Mat-making
0.26
0.00
0.00
Buying and selling livestock (cattle, sheep, goats, camels)
5.80
9.09
14.42
Carpenter, Furniture-maker, or Metal-worker
0.26
1.14
0.96
Construction worker (masonry)
0.53
0.00
0.96
Daily laborer
12.66
18.94
14.42
Making traditional utensils or farm tools
0.53
0.38
0.96
Others
10.29
12.50
11.54
Rearing & selling animals (camels, cattle, sheep, goats)
13.98
13.64
15.38
Religious teacher
0.00
0.38
0.00
Salaried job
2.37
3.41
0.00
104
Page 1 of 3

Data_Collected_Date
Region S.N.N.P
Zone GAMO GOFA
Tuesday, November 5, 2019
Wereda MIRAB ABAYA
Selected Indicator
Economic Vulnerability: Livelihoods - Households important sources of
livelihood (response in %)
Type of Livelihood Activity
Order of Importnce
1st
2nd
3rd
Sale_Of_Natural_Products - Animal feed (grass, fodder, forage, salty
sand, etc.)
0.53
4.55
0.00
Sale_Of_Natural_Products - Charcoal
0.53
0.38
0.00
Sale_Of_Natural_Products - Construction materials (sand, grass,
wooden poles, etc.)
Sale_Of_Natural_Products - Firewood
0.79
1.52
1.92
3.69
1.89
4.81
Sale_Of_Natural_Products - Incense, frankincense, and natural gum
0.26
0.00
0.00
Selling Cereal food crops (sorghum, maize, wheat, barley)
12.93
8.71
11.54
Selling cooked food
0.00
0.38
0.00
Selling dairy products (milk, butter, ghee, cheese)
0.79
4.92
4.81
Selling eggs (from own chickens) Beekeeping (selling honey
bees-wax, or bee-hives)
Selling fruit juice (orange, etc) or soft drink (Fanta, etc)
0.26
1.52
3.85
0.00
1.14
0.00
Selling Fruits (mango, papaya, banana, orange, lemon, etc.)
19.26
3.41
2.88
Selling hides and skins (from goats, sheep, cattle)
0.00
0.00
0.96
Selling meat (from own livestock)
0.00
0.38
0.00
105
Page 2 of 3
Data_Collected_Date
Region S.N.N.P
Zone GAMO GOFA
Tuesday, November 5, 2019
Wereda MIRAB ABAYA
Selected Indicator
Economic Vulnerability: Livelihoods - Households important sources of
livelihood (response in %)
Type of Livelihood Activity
Order of Importnce
1st
2nd
3rd
Selling Oil seeds (sesame, sunflower)
0.00
0.38
0.00
Selling Other foods (sugar, flour, coffee, etc.)
1.06
0.76
0.00
Selling Pulses (beans, cow-pea, chick-pea)
0.79
0.00
0.96
Selling Root crops (Irish potato, sweet potato)
2.11
2.27
1.92
Selling tea, coffee, cake, bread, “areki”, “tella”
0.00
0.76
0.00
Selling Vegetables (onion, tomato, cabbage, pumpkin, etc.)
1.06
0.00
0.96
Selling wool (from sheep)
0.26
0.00
0.00
Weaving, Knitting, Embroidery, Tailoring
1.85
2.65
0.96
106
Page 3 of 3

Data_Collected_Date
Region S.N.N.P
Zone GAMO GOFA
Tuesday, November 5, 2019
Wereda MIRAB ABAYA
Selected Indicator
Economic Vulnerability: Occupational Categories - Percent of population
above 15 years age by occupation categories
Type of Livelihood Activity
Main Occupation
Secondary Occupation
B)Student
C)Unemployed & seeking work
D)Neither studying nor working nor seeking work
E)Retired/ Old
F)Cultivator
G)Agricultural labourer
H)Livestock rearing
I)Non-agricultural labour
J)Craftsman
K)Shopkeeper and Petty trade
L)Home-maker (housewife)
M)Salaried
O)Physically disabled
P)Others (specify)
Q)None
1st Occupation
30.29
2.66
0.86
2.88
31.22
1.37
0.29
1.29
1.73
0.58
23.60
1.73
0.14
1.37
2nd Occupation
1.79
2.55
1.02
5.61
5.61
31.38
7.65
19.13
2.04
7.65
4.34
11.22
107
Page 1 of 1
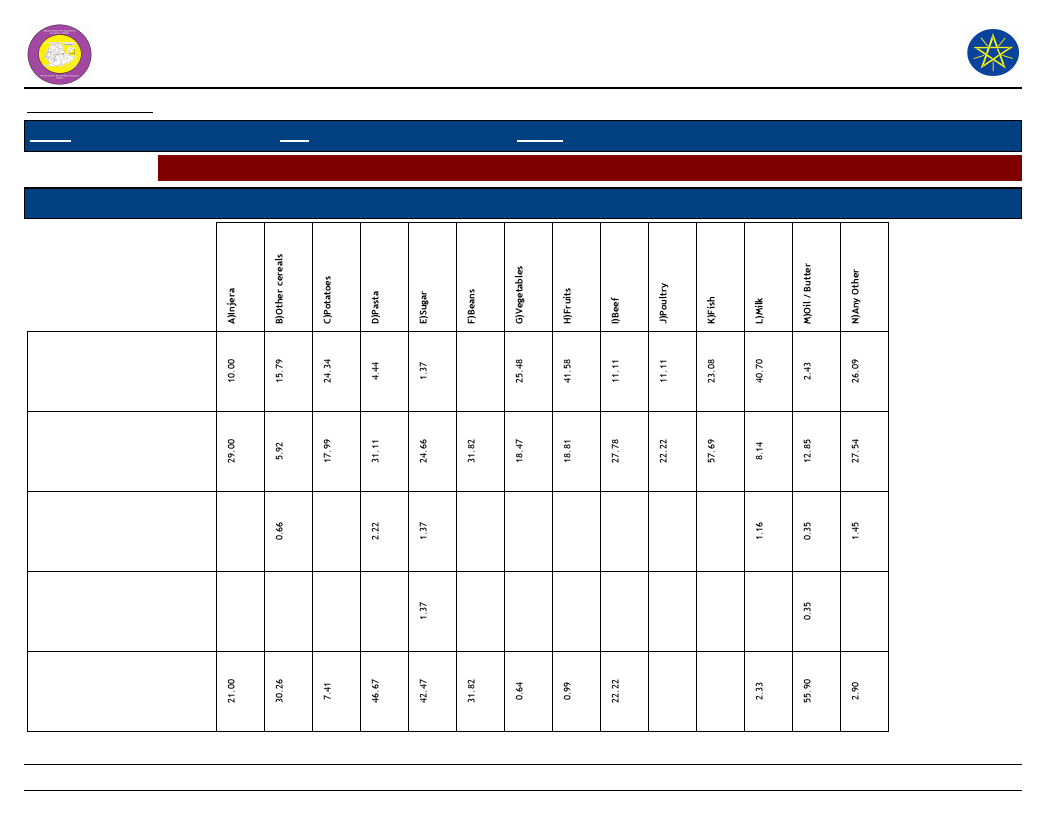
Wereda Disaster Risk
Profile
National Disaster Risk Management
Commission (NDRMC)
Data_Collected_Date
Region S.N.N.P
Zone GAMO GOFA
Wereda MIRAB ABAYA
Tuesday, November 5, 2019
Selected Indictor: Economic Vulnerability: Sources of Food - Households source for different food items (response in %)
Source of Food
Types of Food Item
A)Own
cultivation/production
B)Casual labor
C)Borrowed
D)Gifts from
friends/neighbors
E)Purchases from main
shop
108
Page 1 of 2
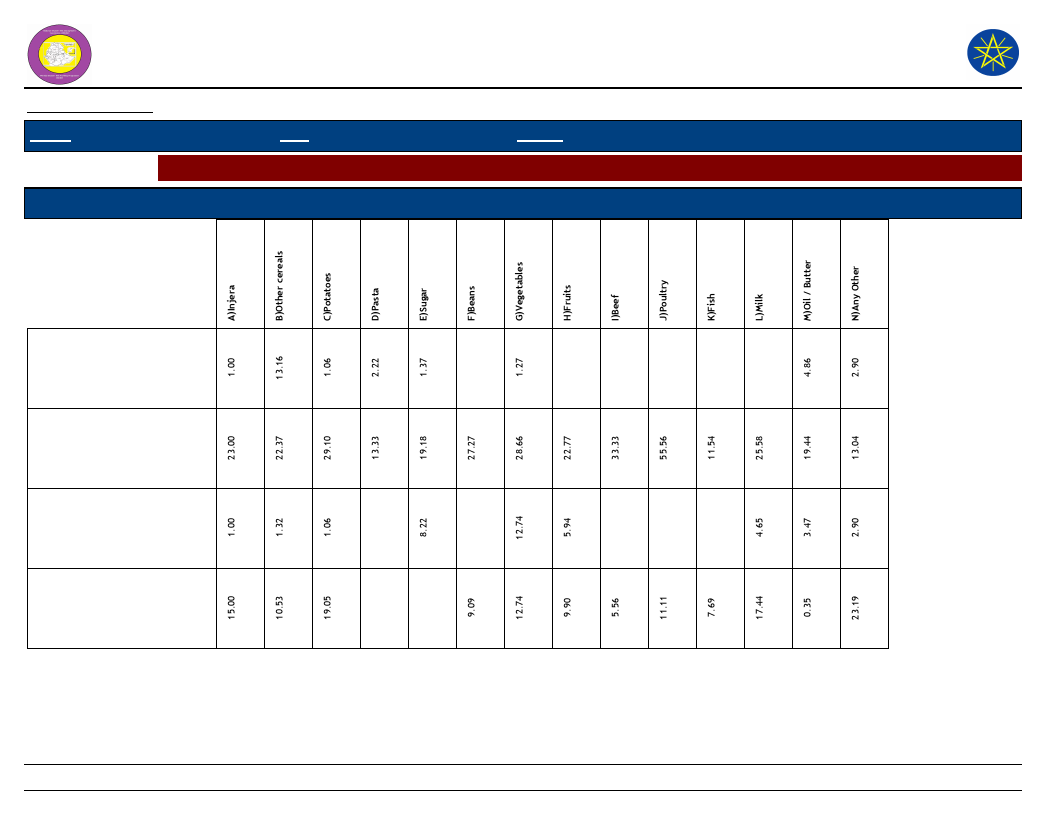
Wereda Disaster Risk
Profile
National Disaster Risk Management
Commission (NDRMC)
Data_Collected_Date
Region S.N.N.P
Zone GAMO GOFA
Wereda MIRAB ABAYA
Tuesday, November 5, 2019
Selected Indictor: Economic Vulnerability: Sources of Food - Households source for different food items (response in %)
Source of Food
Types of Food Item
F)Free meals/Food
assistance
G)Purchase from
roadside vendor/tuck
shop
H)Purchase subsidized
food from Kebele shop
K)Other
109
Page 2 of 2
WDRP Indicators
Crop Production Characteristics
110
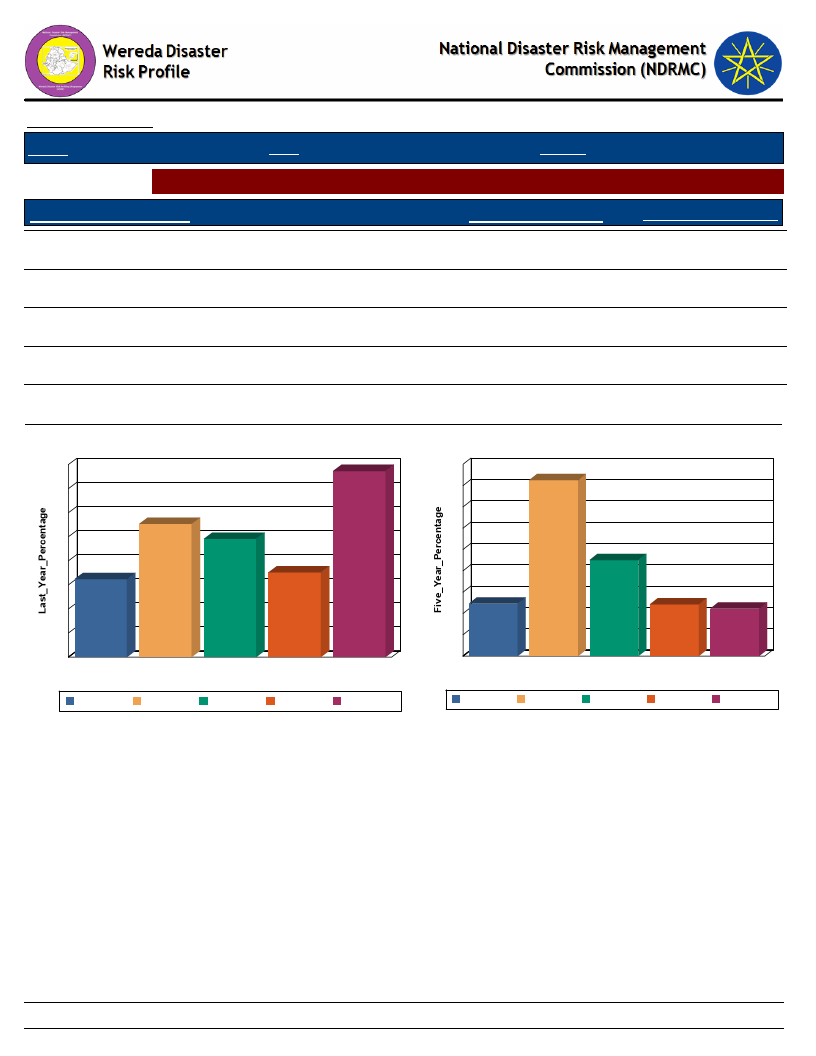
Data_Collected_Date
Region S.N.N.P
Zone GAMO GOFA
Tuesday, November 5, 2019
Wereda MIRAB ABAYA
Selected Indictor: Hazards: Change in Crop Damages - Proportion of Total Crop Damage
Extent of Crop Damage (%)
0%
Last_Year_Percentage
12.95
Five_Year_Percentage
12.27
1 - 25 %
22.14
41.27
26 - 50 %
19.64
22.51
51 - 75 %
14.07
12.12
76 - 100 %
30.92
11.11
Extent of Crop Damage Last_Year
32
31
28
24
22
20
20
16
14
13
12
8
4
0
0%
0%
1 - 25 %
26 - 50 %
51 - 75 %
Extent of Crop Damage
1 - 25 %
26 - 50 %
51 - 75 %
76 - 100 %
76 - 100 %
Extent of Crop Damage Five Years Ago
45
41
40
35
30
25
23
20
15
12
10
12
11
5
0
0%
1 - 25 %
26 - 50 % 51 - 75 %
Extent of Crop Damage
76 - 100 %
0%
1 - 25 %
26 - 50 %
51 - 75 %
76 - 100 %
111
Page 1 of 1
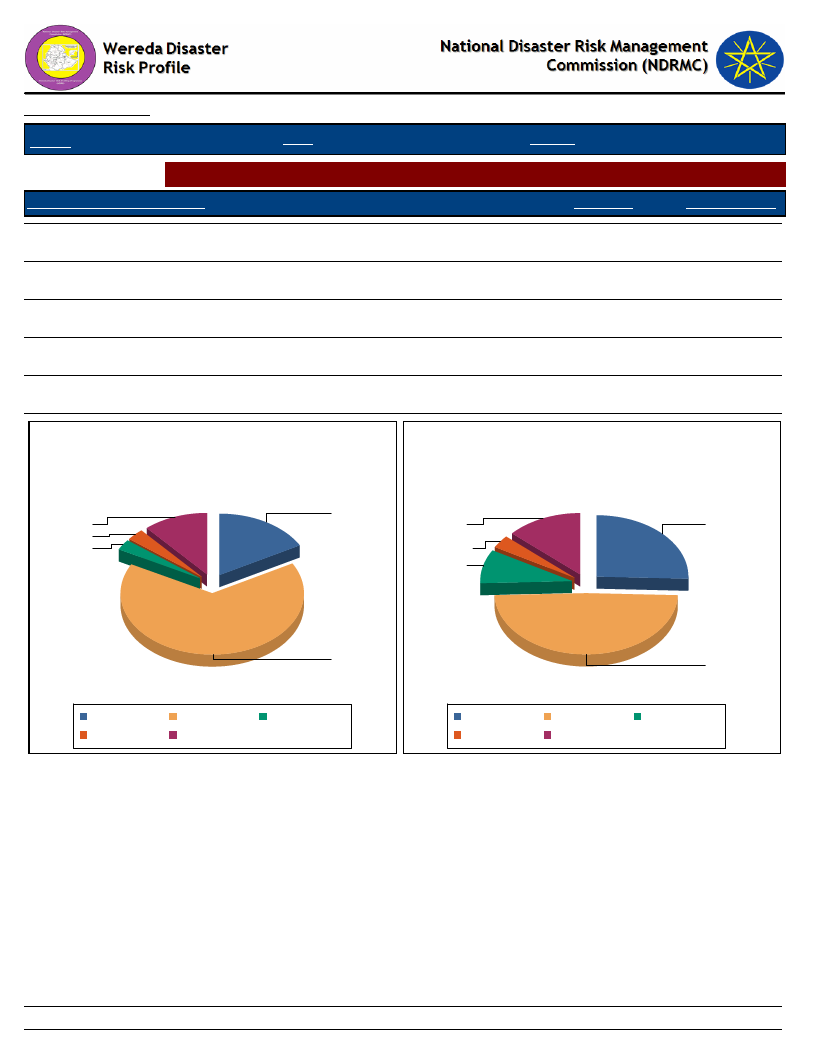
Data_Collected_Date
Tuesday, November 5, 2019
Region S.N.N.P
Zone GAMO GOFA
Wereda MIRAB ABAYA
Selected Indictor: Hazards: Change in Crop Damages - Major reasons for crop damage
Major Reason of Crop Damage
Last_Year
Five_Year_Ago
A - Pests, Insects, Weeds
16.87
25.44
B - Drought
65.81
48.96
C - Flood
3.01
8.96
D - Frost/ Cold wave
3.01
3.36
E - Others (specify)
11.30
13.28
Major Reason of Crop Damage -
Last Year
16.9
11.3
3.0
3.0
Major Reason of Crop Damage -
Five Years Ago
E - Others
(specify)
D - Frost/ Cold
wave
C - Flood
A - Pests,
Insects,
Weeds
65.8
A - Pests, Insects,
Weeds
D - Frost/ Cold wave
B - Drought
E - Others (specify)
C - Flood
A - Pests, Insects,
Weeds
D - Frost/ Cold wave
B - Drought
E - Others (specify)
C - Flood
B-
Drought
112
Page 1 of 1
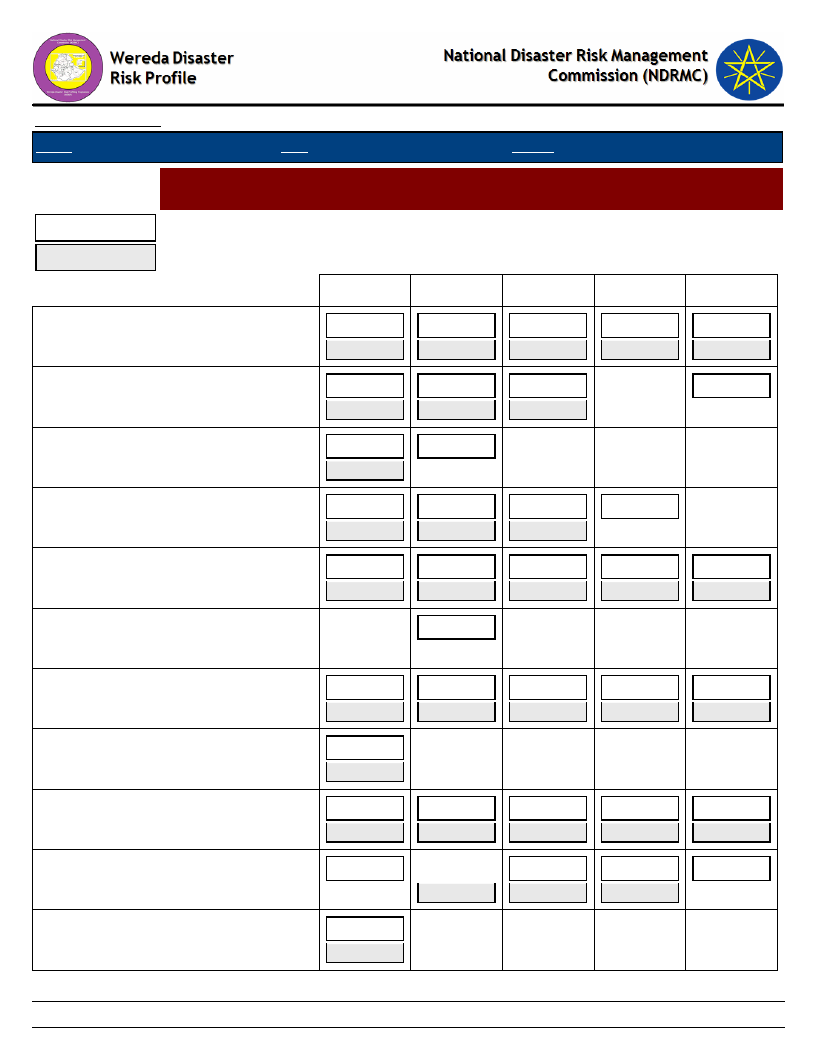
Data_Collected_Date
Region S.N.N.P
Zone GAMO GOFA
Tuesday, November 5, 2019
Wereda MIRAB ABAYA
Selected Indictor:
Last Year
Hazards: Change in Crop Damages - Proportion of Damage for Major Crops
(percentage response by households)
Five Years Ago
0%
1-25%
26-50%
51-75%
76-100%
Barley
10.26
11.84
20.51
43.42
21.79
23.68
23.08
11.84
24.36
7.89
Beans
27.27
45.45
18.18
9.09
18.18
72.73
9.09
Coffee
66.67
100.00
33.33
Enset
36.36
30.00
21.21
56.67
27.27
13.33
12.12
Fruits
15.29
40.00
34.12
4.71
5.88
13.43
40.30
22.39
17.91
4.48
Lentils
100.00
Maize
Millet
Other cash crop
Other grain (specify)
Other oilseed
9.17
5.58
100.00
100.00
11.11
18.92
16.67
100.00
100.00
15.28
37.34
27.78
40.54
50.00
17.47
25.32
8.33
24.32
50.00
25.00
13.97
12.88
11.11
10.81
16.67
25.00
44.10
18.45
41.67
2.70
16.67
113
Page 1 of 2
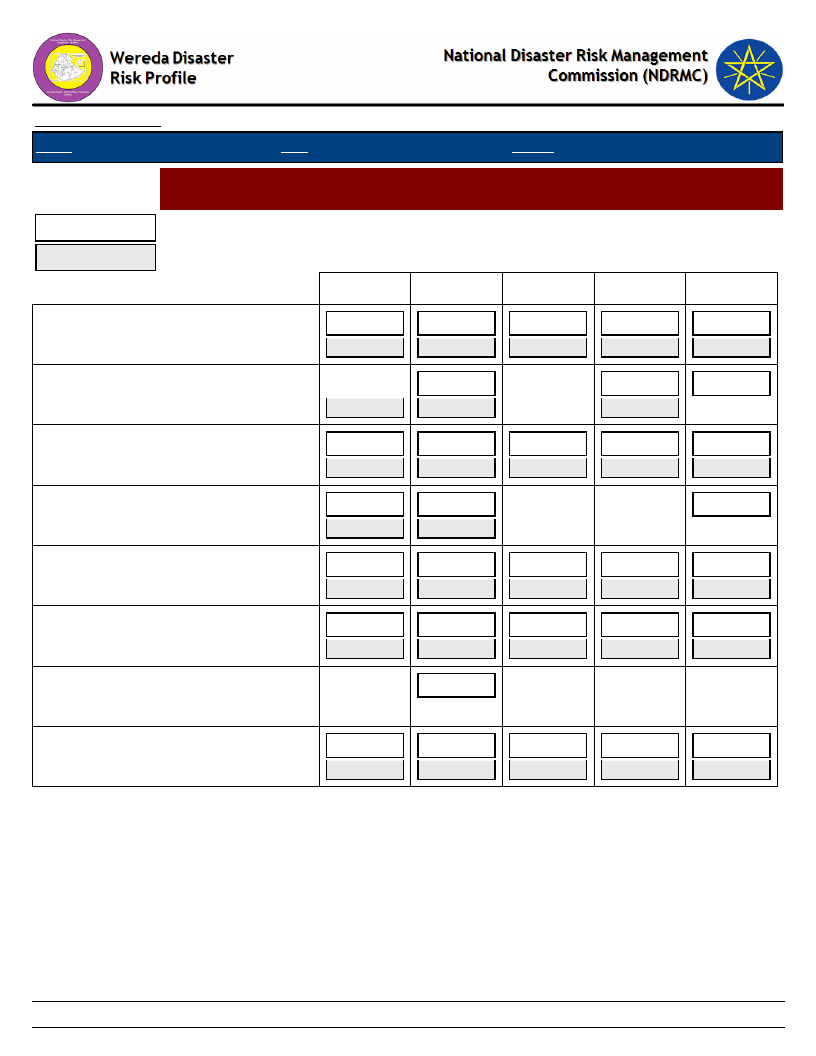
Data_Collected_Date
Region S.N.N.P
Zone GAMO GOFA
Tuesday, November 5, 2019
Wereda MIRAB ABAYA
Selected Indictor:
Last Year
Hazards: Change in Crop Damages - Proportion of Damage for Major Crops
(percentage response by households)
Five Years Ago
0%
1-25%
26-50%
51-75%
76-100%
Other pulses
12.50
21.88
9.38
6.25
50.00
13.79
58.62
17.24
6.90
3.45
Peas
25.00
25.00
25.00
25.00
50.00
50.00
Root & tubers
24.14
17.24
24.14
27.59
6.90
29.63
37.04
11.11
14.81
3.70
Sesame
16.67
50.00
16.67
50.00
66.67
Sorghum
11.63
13.33
27.91
40.00
20.93
22.22
13.95
13.33
25.58
11.11
Teff
9.80
19.61
15.69
1.96
50.98
8.77
33.33
28.07
10.53
19.30
Vegetables
100.00
Wheat
7.35
19.12
16.18
29.41
27.94
9.23
46.15
23.08
12.31
9.23
114
Page 2 of 2
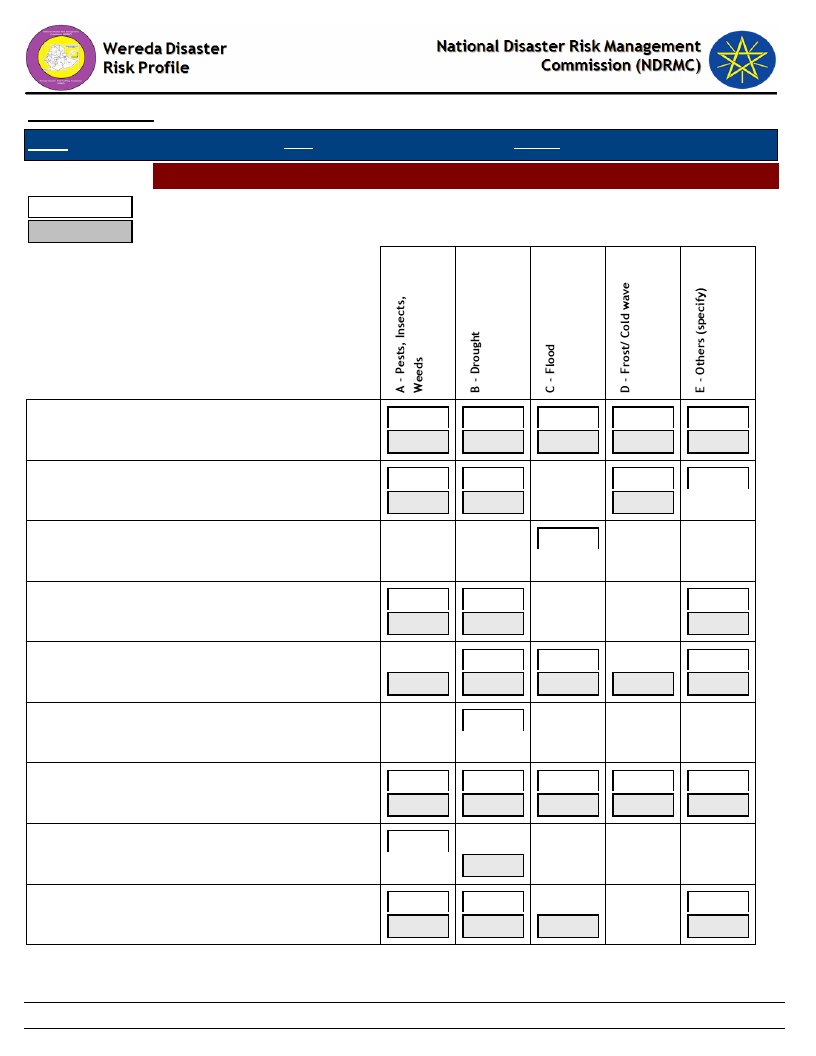
Data_Collected_Date
Region S.N.N.P
Zone GAMO GOFA
Tuesday, November 5, 2019
Wereda MIRAB ABAYA
Hazards: Change in Crop Damages - Reasons for Damage of Major Crops
Last Year
Five Years Ago
Barley
Beans
Coffee
Enset
Fruits
Lentils
Maize
Millet
Other cash crop
30.14
34.33
27.27
36.36
45.21
32.84
45.45
36.36
6.85
7.46
100.00
12.33
13.43
18.18
27.27
5.48
11.94
9.09
42.86
50.00
14.29
5.00
42.86
45.00
55.56
5.56
38.89
3.39
52.54
11.86
1.69
30.51
100.00
6.39
84.02
0.91
0.46
8.22
14.67
61.33
11.56
0.89
11.56
100.00
100.00
22.86
74.29
2.86
48.48
42.42
6.06
3.03
115
Page 1 of 3
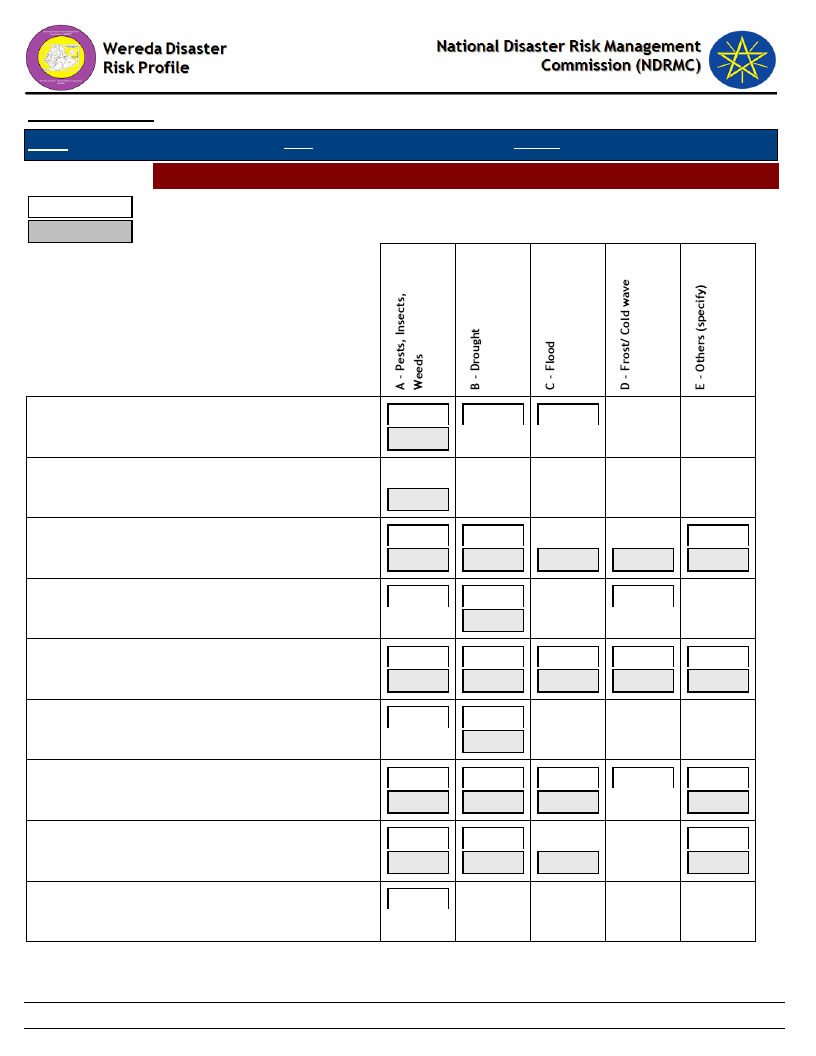
Data_Collected_Date
Region S.N.N.P
Zone GAMO GOFA
Tuesday, November 5, 2019
Wereda MIRAB ABAYA
Hazards: Change in Crop Damages - Reasons for Damage of Major Crops
Last Year
Five Years Ago
Other grain (specify)
Other oilseed
Other pulses
Peas
Root & tubers
Sesame
Sorghum
Teff
Vegetables
50.00
100.00
33.33
16.67
100.00
20.00
40.74
25.00
52.17
60.00
16.67
12.20
23.68
8.00
16.67
100.00
76.67
37.04
50.00
100.00
26.09
20.00
83.33
100.00
73.17
55.26
88.00
64.81
3.70
4.35
5.00
2.44
10.53
3.70
3.70
25.00
4.35
10.00
2.44
3.33
14.81
13.04
5.00
9.76
10.53
4.00
14.81
116
Page 2 of 3
Data_Collected_Date
Region S.N.N.P
Zone GAMO GOFA
Tuesday, November 5, 2019
Wereda MIRAB ABAYA
Hazards: Change in Crop Damages - Reasons for Damage of Major Crops
Last Year
Five Years Ago
Wheat
32.31
46.15
7.69
7.69
6.15
44.07
35.59
10.17
5.08
5.08
117
Page 3 of 3
Wereda Disaster
Risk Profile
Data_Collected_Date
Region
S.N.N.P
Zone
GAMO GOFA
National Disaster Risk Management
Commission (NDRMC)
Tuesday, November 5, 2019
Wereda
MIRAB ABAYA
Selected Indictor:
Kebele Name
ALGAE
Agricultural Situation: Change in Crops Grown - Five major crops grown by proportion of total cultivated land
Major Crops
Main Season
Present
Cropped Area
Five_Years_Ago
Reason_For_Change
Maize
Belg and
83
Meher
75
Increasing lf lake water.
Fruits
Other
7
7
ANKOBER
Teff
Haricot Bean
Teff
Belg and
5
Meher
Belg and
5
Meher
Meher
2
5
5
1
Harvesting with short period of time.
DELBO
Haricot Bean
Maize
Fruits
Fruits
Maize
Belg and
5
Meher
Belg and
10
Meher
Belg and
83
Meher
Belg and
58.4
Meher
Belg
24.7
5
Remain the same
85
Less production
86
Better production
59.1
Market access
30
Shortage of rain.
Sesame
Belg
1
Market access
Haricot Bean
Belg
3.7
10
Shortage of rain.
Vegetables
Belg and
12.2
7.1
Meher
Market access
118
Page 1 of 7
Wereda Disaster
Risk Profile
Data_Collected_Date
Region
S.N.N.P
Zone
GAMO GOFA
National Disaster Risk Management
Commission (NDRMC)
Tuesday, November 5, 2019
Wereda
MIRAB ABAYA
Selected Indictor:
Kebele Name
DOSHE
Agricultural Situation: Change in Crops Grown - Five major crops grown by proportion of total cultivated land
Major Crops
Main Season
Present
Cropped Area
Five_Years_Ago
Reason_For_Change
Teff
Meher
10
10
No change
Haricot Bean
Belg
14
9
Because of shortage of rain fall.
Cotton
Belg
9
12
Because of shortage of rain fall.
Sorghum
Belg
2
1
Because of shortage of rain fall.
FARAOSA
Maize
Maize
Haricot Bean
Belg and
65
Meher
Belg and
80
Meher
Meher
10
68
Because of shortage of rain fall.
80
No change
10
No change
Sorghum
Meher
5
5
No change
Cotton
Meher
5
5
No change
FETELE
Sesame
Belg
3
1
Sorghum
Belg
5
5
No change
Haricot Bean
Belg and
10
Meher
Maize
Belg and
80
Meher
Vegetable and
Belg
2
fruits
2
90
Shortage of rain fall
2
No change
119
Page 2 of 7
Wereda Disaster
Risk Profile
Data_Collected_Date
Region
S.N.N.P
Zone
GAMO GOFA
National Disaster Risk Management
Commission (NDRMC)
Tuesday, November 5, 2019
Wereda
MIRAB ABAYA
Selected Indictor:
Kebele Name
PURA
Agricultural Situation: Change in Crops Grown - Five major crops grown by proportion of total cultivated land
Major Crops
Main Season
Present
Cropped Area
Five_Years_Ago
Reason_For_Change
Cotton
All Season
3.7
6
Market access.
Maize
Meher
45.25
55
Lack of rain fall.
Sesame
Meher
14.27
0
Market access.
Haricot Bean
Meher
6.4
20
Market access.
Sorghum
Meher
4.57
14
Resistance of drought.
LAYO TERGA
Irish potato
Meher
9.8
15
Due to crop disease.
Sweet Potato
Meher
10.45
5
High yield.
Wheat
Meher
29.5
31
Due to crop disease.
Barley
Meher
29.17
30
Lack of new variety.
Haricot Bean
Meher
10.62
5
Due to crop disease.
MOLLE
Maize
Banana
Belg and
5
Meher
Other
95
10
Poor production
90
Good market access.
MOREDA
Barley
Belg and
13
11
Meher
Sorghum
Meher
8
6
Wheat
Belg and
11
9
Meher
120
Page 3 of 7
Wereda Disaster
Risk Profile
Data_Collected_Date
Region
S.N.N.P
Zone
GAMO GOFA
National Disaster Risk Management
Commission (NDRMC)
Tuesday, November 5, 2019
Wereda
MIRAB ABAYA
Selected Indictor:
Kebele Name
MOREDA
Agricultural Situation: Change in Crops Grown - Five major crops grown by proportion of total cultivated land
Major Crops
Main Season
Present
Cropped Area
Five_Years_Ago
Reason_For_Change
Teff
Meher
10
7
Maize
Belg
9.5
7
KOLA BANENA
Haricot Bean
Teff
Maize
Banana
Belg and
9
Meher
Belg and
6
Meher
Belg and
86
Meher
All Season
9
4
3
83
Livelihood shifting.
10
KOLA MULAT0
Sesame
---------
6.67
Lack of market access
Maize
---------
56
60
Shortage of cultivation land.
Sorghum
---------
5.5
15
Lack of market access
Haricot Bean
---------
10
5
Lack of market access
Cotton
---------
7.7
6
Lack of market access
KORGA GERAMO
Teff
Meher
15
5
Maize
Meher
65
Haricot Bean
Meher
20
50
Farming practice have been increased from
year to year.
10
UGAYO
Haricot Bean
Meher
3
2
Banana plantation.
121
Page 4 of 7

Wereda Disaster
Risk Profile
Data_Collected_Date
Region
S.N.N.P
Zone
GAMO GOFA
National Disaster Risk Management
Commission (NDRMC)
Tuesday, November 5, 2019
Wereda
MIRAB ABAYA
Selected Indictor:
Kebele Name
UGAYO
Agricultural Situation: Change in Crops Grown - Five major crops grown by proportion of total cultivated land
Major Crops
Main Season
Present
Cropped Area
Five_Years_Ago
Reason_For_Change
Maize
Meher
55.5
72
Cultivation cash crop.
Teff
Meher
3
2
No change.
Banana
Meher
36
23
Access to market.
Mango
Meher
0.4
0.5
No change.
UMO LANTE
Haricot Bean
Belg
4.4
4.6
No change
Barley
Meher
5.3
5.5
No change
Wheat
Meher
4.75
5
No change
WANKE WAGEFO
Banana
Maize
Sorghum
Belg and
53
Meher
Belg and
27.5
Meher
Meher
7.54
42
Better income source.
38
Less income source.
7.54
No change
Maize
Meher
46.34
46
Market access
Haricot Bean
Meher
8.65
5
Market access.
Sesame
Meher
11.53
Market access.
Cotton
Meher
23.06
20
Market access.
WOYE BARENA
Sorghum
Meher
15
10
122
Page 5 of 7

Wereda Disaster
Risk Profile
Data_Collected_Date
Region
S.N.N.P
Zone
GAMO GOFA
National Disaster Risk Management
Commission (NDRMC)
Tuesday, November 5, 2019
Wereda
MIRAB ABAYA
Selected Indictor:
Kebele Name
WOYE BARENA
Agricultural Situation: Change in Crops Grown - Five major crops grown by proportion of total cultivated land
Major Crops
Main Season
Present
Cropped Area
Five_Years_Ago
Reason_For_Change
Haricot Bean
Meher
10
10
Wheat
Meher
40
20
Enset
Meher
20
20
Irish potato
Meher
15
20
YAYEKE
Haricot Bean
Maize
Teff
Belg and
7
Meher
Belg and
54
Meher
Meher
5
7
No change
54
No change
5
No change
ZALA GUTESHA
Cotton
Sesame
Maize
Belg and
12.5
12
Meher
Belg and
6.5
6
Meher
Meher
3.08
2.2
No change
No change
Due to improve variety for high land areas.
Haricot Bean
Meher
16.24
14.20
Market access.
Irish potato
Meher
9.34
10
Due to delight and wilt disease.
Wheat
Belg
31.68
39.2
Due yellow rest disease.
Barley
Belg
39.66
38
Market access.
123
Page 6 of 7
Wereda Disaster
Risk Profile
Data_Collected_Date
Region
S.N.N.P
Zone
GAMO GOFA
National Disaster Risk Management
Commission (NDRMC)
Tuesday, November 5, 2019
Wereda
MIRAB ABAYA
Selected Indictor:
Kebele Name
ZALA BARANA
Agricultural Situation: Change in Crops Grown - Five major crops grown by proportion of total cultivated land
Major Crops
Irish potato
Main Season
Belg and
Meher
Present
26
Cropped Area
Five_Years_Ago
22
Reason_For_Change
Population increased.
Wheat
Meher
29
31.5
Population increased.
Haricot Bean
Barley
Maize
Belg and
15
Meher
Belg and
17
Meher
Belg and
14
Meher
12
Population increased.
18.5
Population increased.
16
Population increased.
124
Page 7 of 7

Data_Collected_Date
Tuesday, November 5, 2019
Region S.N.N.P
Zone GAMO GOFA
Wereda MIRAB ABAYA
Selected Indictor:
Agricultural Situation: Access to Extension - Perception of the community on
Access to Agricultural extension Services
KebeleName
Current_Level
Change_In_Last_Decade
Comments
ALGAE
ANKOBER
Good
Sufficient
Increased
Increased
Farmer training centre is
properly used
DELBO
DOSHE
FARAOSA
FETELE
PURA
Sufficient
Good except poor veterinary
service
Sufficient
Sufficient
Efficient
Increasing
No change
Increasing
Increasing
Increasing
LAYO TERGA
Sufficient
Increasing
MOLLE
MOREDA
Good
Good
Increased
No change
Due to skilled man power
in the community
Due to developmental
agent.
Due to development
agent.
Due to skilled man power
in the community,
developmental agent.
Due to skilled man power
in the community,
developmental agent.
Farmer training centre is
properly used
KOLA BANENA
Good
Increased
KOLA MULAT0
Sufficient
KORGA GERAMO
Good
Increased
No change
Due to skilled man power
in the community.
UGAYO
Sufficient
Increased
Skilled man power.
UMO LANTE
Good
No change
WANKE WAGEFO
Sufficient
WOYE BARENA
Increased
Due to presence of skilled
man power.
125
Page 1 of 2
Data_Collected_Date
Tuesday, November 5, 2019
Region S.N.N.P
Zone GAMO GOFA
Wereda MIRAB ABAYA
Selected Indictor:
Agricultural Situation: Access to Extension - Perception of the community on
Access to Agricultural extension Services
KebeleName
Current_Level
Change_In_Last_Decade
Comments
YAYEKE
ZALA GUTESHA
ZALA BARANA
Good
Sufficient
Good
Improved
Increasing
No change
Agricultural extension
approach
Presence of development
agents in the community.
126
Page 2 of 2
Data_Collected_Date
Region S.N.N.P
Zone GAMO GOFA
Wereda
Tuesday, November 5, 2019
MIRAB ABAYA
Selected Indicator
Economic Vulnerability: Crops Grown - Types of crops grown by households
Major Crop Type
Maize
Type of Crops Grown
Last Year
31.89
Type of Crops Grown
Five Years Ago
33.62
Fruits
11.84
9.67
Barley
10.86
10.97
Wheat
9.47
9.38
Teff
7.10
8.23
Sorghum
5.99
6.49
Other cash crop
5.01
5.34
Enset
4.60
4.33
Other pulses
4.46
4.18
Root & tubers
4.04
3.90
Beans
1.53
1.59
Sesame
0.84
0.58
Other grain (specify)
0.84
0.58
Peas
0.56
0.58
Coffee
0.42
0.29
Other oilseed
0.14
0.14
Vegetables
0.14
Lentils
0.14
Millet
0.14
0.14
127
Page 1 of 2
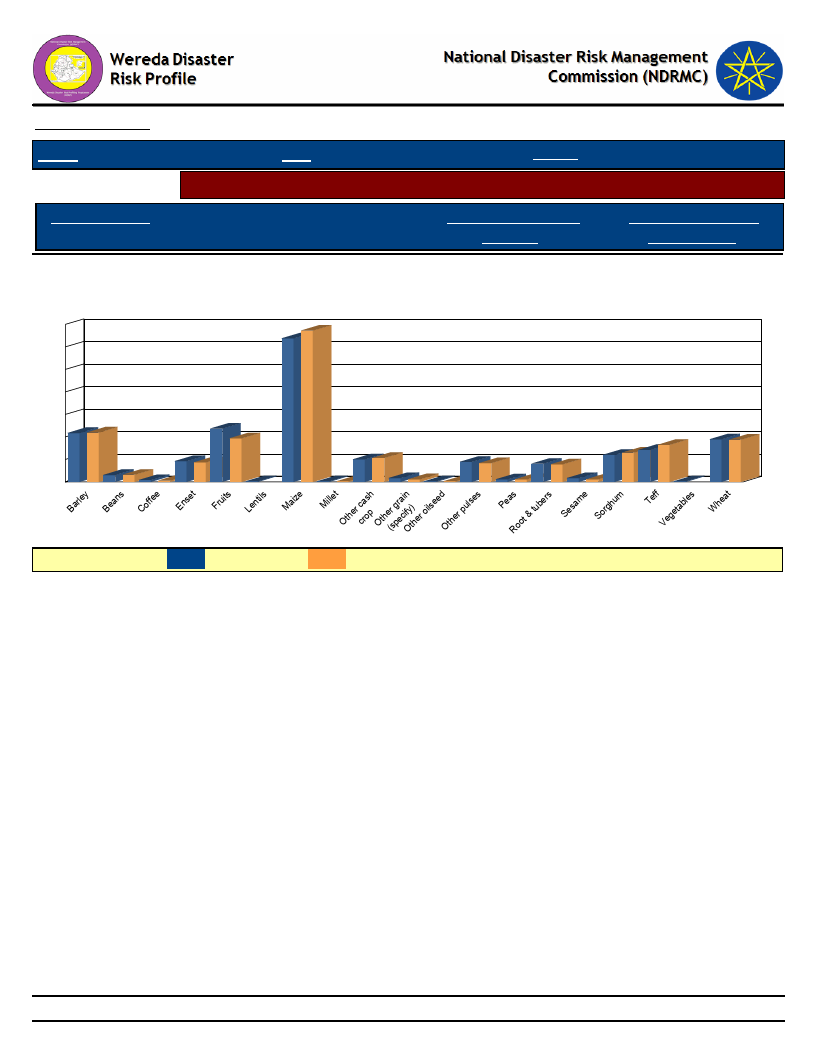
Data_Collected_Date
Region S.N.N.P
Selected Indicator
Major Crop Type
Zone GAMO GOFA
Wereda
Tuesday, November 5, 2019
MIRAB ABAYA
Economic Vulnerability: Crops Grown - Types of crops grown by households
Type of Crops Grown
Last Year
Type of Crops Grown
Five Years Ago
Types of Crops Grown - Percent Responses of HHs for Last Year as compared to
Five Years Ago
35
34
32
30
25
20
15
11 11
10
5
2
0
2
0
5
0
12
10
4
0
55
44
44
8
6 67
00
1 10 0
11
11
0
99
Barley
Beans
Coffee
Enset
Fruits
Lentils
aize
M
illet
M
ther
O
cash
crop
Othe(rsgpreaciniOfyt)her
oilseed ther
O
pulses
Peas
tubers
Root &
e
Sesam
Sorghum
Teff Vegetables
heat
W
LEGEND :
Last year
Five Years Ago
128
Page 2 of 2
Data_Collected_Date
Region S.N.N.P
Zone GAMO GOFA
Tuesday, November 5, 2019
Wereda MIRAB ABAYA
Selected Indictor:
Economic Vulnerability: Crops Grown - Proportion of households by amount of
yield of major crops (last year)
Barley
Beans
Coffee
Enset
Fruits
Lentils
Maize
Millet
Other cash crop
Other grain (specify)
Other oilseed
Other pulses
Peas
Root & tubers
Sesame
Sorghum
Teff
Vegetables
Wheat
88.46
100.00
66.67
42.42
11.76
100.00
53.71
100.00
52.78
66.67
100.00
75.00
100.00
27.59
100.00
69.77
92.16
11.54
36.36
28.24
26.64
22.22
33.33
21.88
58.62
25.58
3.92
18.18
22.35
15.28
11.11
3.12
10.34
4.65
1.96
80.88
19.12
33.33
3.03
9.41
7.06
21.18
3.06
0.44
0.87
2.78
2.78
8.33
3.45
1.96
100.00
129
Page 1 of 1

Data_Collected_Date
Region S.N.N.P
Zone GAMO GOFA
Wereda
Tuesday, November 5, 2019
MIRAB ABAYA
Selected Indictor:
Economic Vulnerability: Crops Grown - Proportion of households by amount of
yield of major crops (Five Years Ago)
Types of Major Crops
Category of Yield used to be obtained five years ago
Barley
Beans
Coffee
Enset
Fruits
Lentils
Maize
Millet
Other cash crop
Other grain (specify)
Other oilseed
Other pulses
Peas
Root & tubers
Sesame
67.11
31.58
1.32
90.91
9.09
100.00
30.00
50.00
10.00
3.33
10.45
34.33
22.39
7.46
6.67
25.37
22.32
30.90
27.04
7.30
100.00
32.43
51.35
2.70
2.70
75.00
25.00
100.00
34.48
55.17
3.45
100.00
25.93
48.15
18.52
100.00
130
5.58
2.70
7.41
6.87
8.11
6.90
Page 1 of 2

Data_Collected_Date
Region S.N.N.P
Zone GAMO GOFA
Wereda
Tuesday, November 5, 2019
MIRAB ABAYA
Selected Indictor:
Economic Vulnerability: Crops Grown - Proportion of households by amount of
yield of major crops (Five Years Ago)
Types of Major Crops
Category of Yield used to be obtained five years ago
Sorghum
Teff
Vegetables
Wheat
48.89
40.00
8.89
2.22
61.40
31.58
3.51
1.75
1.75
53.85
44.62
1.54
131
Page 2 of 2
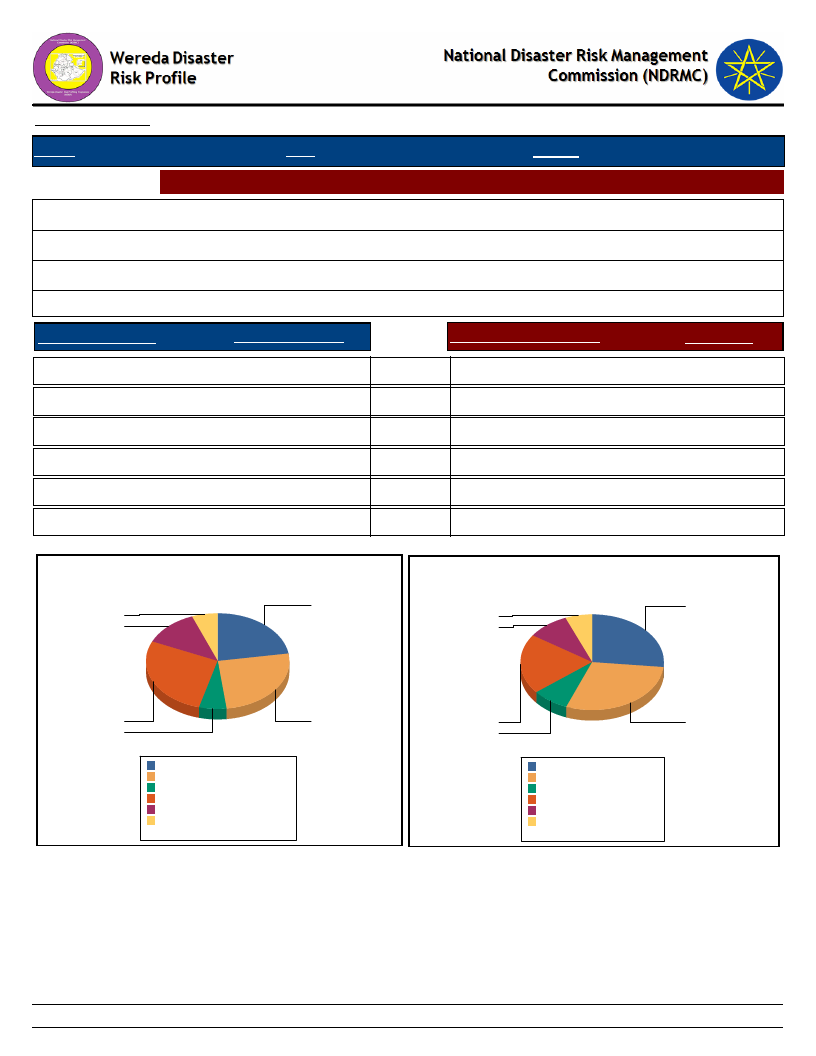
Data_Collected_Date
Tuesday, November 5, 2019
Region S.N.N.P
Zone GAMO GOFA
Wereda MIRAB ABAYA
Selected Indictor: Economic Vulnerability: Land Ownership and Quality - Landownership of HHs
Households owning land (%)
Average landholding (in Hectares)s
Households cultivating land in last 12 months (%)
Average quantity of land cultivated (in hectares)
90.50
0.83
91.45
0.70
Range Land Holding
Percent_Response
Range of Cultivated Land
% Response
A - Less than 0.25 ha
22.0
B - 0.25 - 0.50 ha
26.0
D - 0.75 - 1 ha
27.0
E - 1 - 2 ha
13.0
C - 0.5 - 0.75 ha
6.0
F - More than 2 ha
6.0
IMPORTANT: ha = Hectars
Household Responses to Range Land Holding
A - Less than 0.25 ha
25.0
B - 0.25 - 0.50 ha
27.0
D - 0.75 - 1 ha
19.0
E - 1 - 2 ha
9.0
C - 0.5 - 0.75 ha
8.0
F - More than 2 ha
6.0
Household Responses to Range Cultivated Land
22.4
24.8
5.8
5.8
12.5
8.8
27.4
6.1
25.7
A - Less than 0.25 ha
B - 0.25 - 0.50 ha
C - 0.5 - 0.75 ha
D - 0.75 - 1 ha
E - 1 - 2 ha
F - More than 2 ha
Total:
22.4%
25.7%
6.1%
27.4%
12.5%
5.8%
100.0%
18.9
7.6
27.4
A - Less than 0.25 ha 24.8
B - 0.25 - 0.50 ha 27.4
C - 0.5 - 0.75 ha
7.6
D - 0.75 - 1 ha
18.9
E - 1 - 2 ha
8.8
F - More than 2 ha
5.8
Total:
93.3
132
Page 1 of 1
Data_Collected_Date
Tuesday, November 5, 2019
Region S.N.N.P
Zone GAMO GOFA
Wereda MIRAB ABAYA
Selected Indictor:
Economic Vulnerability: Land Ownership and Quality - Farmers’ perception on the
quality of their agricultural land
Cropping_Intensity *
Households with enough land for farming
HHs with favourable location of farm
Response
Households with fertile soil
47.65
29.02
Response
Yes
35.80
Highly fertile
2.26
Partially
39.20
Fertile
50.85
No
25.00
Not fertile
46.89
* Cropping Intensity = (Gross Cropped Area / Net Cropped Area )x 100%
Household responses to the type of farm
location
Household responses tp the type of soil
fertility
25
36
47
39
No
Partially Yes
Gross Cropped Area = Irrigated Area + Unirrigated
Area
51
2
Fertile
Highly fertile Not fertile
Net Cropped Area = Total Cultivated Area in last
12 months
133
Page 1 of 1
Data_Collected_Date
Tuesday, November 5, 2019
Region S.N.N.P
Selected Indictor:
KebeleName
ALGAE
ANKOBER
DELBO
DOSHE
FARAOSA
FETELE
PURA
LAYO TERGA
MOLLE
MOREDA
KOLA BANENA
KOLA MULAT0
KORGA GERAMO
UGAYO
UMO LANTE
WANKE WAGEFO
WOYE BARENA
YAYEKE
ZALA GUTESHA
ZALA BARANA
Zone GAMO GOFA
Wereda MIRAB ABAYA
Agricultural Situation: Access to Inputs - Perception of the community on access
to improved agricultural inputs
Current_Level
Change_In_Last_Decade
Comments
Good
Sufficient
Sufficient
Medium
Sufficient
Sufficient
Efficient
Sufficient
Good
Good
Good
Sufficient
Good
Sufficient
Good
Sufficient
Good
Good
Sufficient
Good except pesticides
Increased
Increased
Increasing
No change
Increasing
Increasing
Increasing
Increasing
Increased
No change
Increased
Increased
No change
Increased
No change
Increased
Improved
Increasing
No change
Due to seed enterprise
Presence of different seed
Due to presence of seed
Because of increased
production
Presence of seed
Due to demand of the
farmers
Agricultural extension
approach
Due to presence of seed
enterprise
134
Page 1 of 1
Data_Collected_Date
Region S.N.N.P
Zone GAMO GOFA
Tuesday, November 5, 2019
Wereda MIRAB ABAYA
Selected Indictor:
Agricultural Situation: Water for irrigation - Access to water for irrigation in the
community
KebeleName
Current_Level
Change_In_Last_Decade
Comments
ALGAE
ANKOBER
DELBO
DOSHE
FARAOSA
FETELE
PURA
LAYO TERGA
MOLLE
MOREDA
KOLA BANENA
KOLA MULAT0
KORGA GERAMO
UGAYO
UMO LANTE
WANKE WAGEFO
WOYE BARENA
YAYEKE
ZALA GUTESHA
ZALA BARANA
Low
Medium
Not sufficient
Low
Poor
Poor
Medium
Poor
Medium
Low
Low
No sufficient
No irrigation
Not sufficient
Good
Not sufficient
Low
Poor
Poor
No irrigation system
Decreased
Decreased
Increased
Decreased
No change
No change
Increased
No change
Decreased
Decreased
Increased
No change
No change
No change
Increased
Decreased
No change
Decreasing
Access to irrigation water is low
Use of different technology.
The water is spring water
Near to river
High demand for irrigation
water
Lack of water resource
Because of technology for
irrigation
Lack of technology
Lack of water pump
Shortage of irrigation water
Topography of the land is
difficult for irrigation
135
Page 1 of 1
Data_Collected_Date
Tuesday, November 5, 2019
Region S.N.N.P
Zone GAMO GOFA
Wereda MIRAB ABAYA
Selected Indictor:
Kebele Name
Agricultural Situation: Soil Fertility - Perception of the community on soil fertility
and its change over time
Current_Level
Change_In_Last_Decade
Comments
ALGAE
Medium
Decreased
Salinity of lake water
ANKOBER
Medium
Decreased
DELBO
Medium
Decreased
Due to soil erosion
DOSHE
Medium
Decreased
Reduction of yield
FARAOSA
Medium
Decreasing
Soil erosion
FETELE
Medium
Decreasing
Erosion
PURA
Medium
Decreased
Due to erosion
LAYO TERGA
Poor
Decreasing
Due to erosion
MOLLE
MOREDA
Good
Medium
Increased
Decreased
Fertile soil eroded from
high land area comes to the
area
Reduction of yield
KOLA BANENA
Medium
Decreased
KOLA MULAT0
Medium
Decreasing
Due to soil erosion.
KORGA GERAMO
Medium
Decreased
Less production
UGAYO
Medium
Decreasing
Due to soil erosion
UMO LANTE
Medium
Decreased
Less yield
WANKE WAGEFO
Not fertile
Decreased
Due to erosion
WOYE BARENA
Medium
Increased
YAYEKE
ZALA GUTESHA
Good
Medium
No change
Decreasing
Soil and water conservation
work
Due to soil erosion
ZALA BARANA
Medium
Decreased
Less production
136
Page 1 of 1
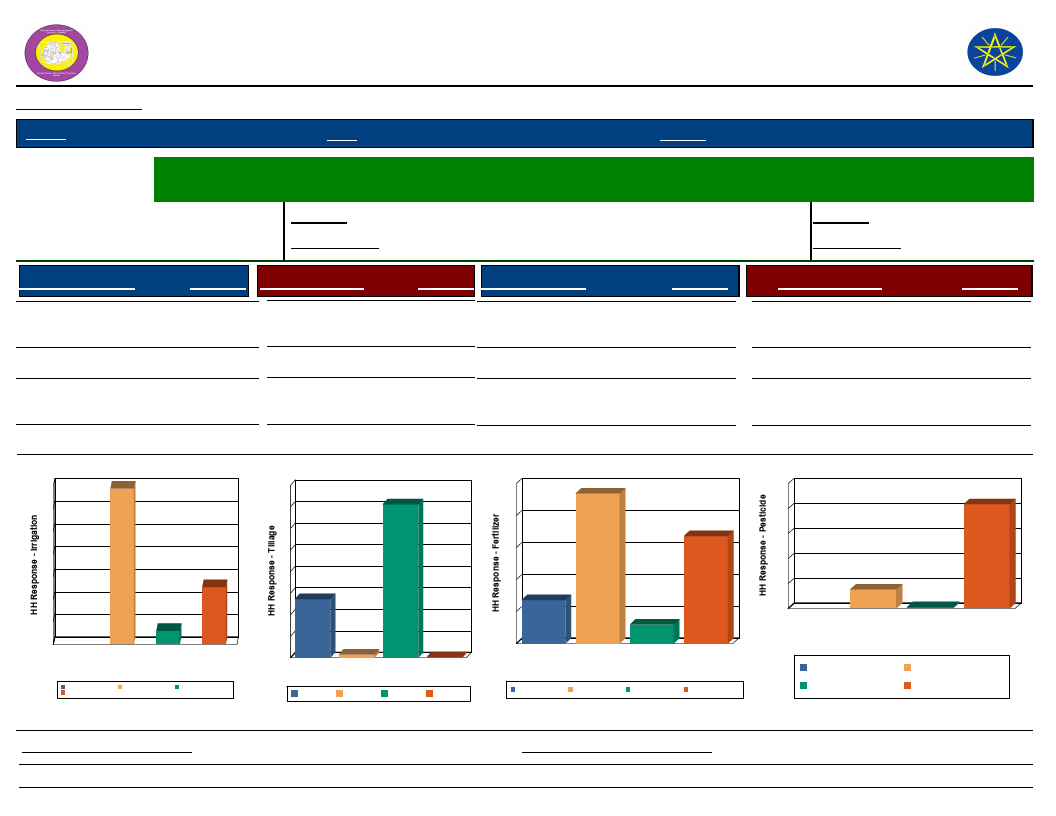
Wereda Disaster
Risk Profile
Data_Collected_Date
Region S.N.N.P
Zone GAMO GOFA
National Disaster Risk Management
Commission (NDRMC)
Tuesday, November 5, 2019
Wereda MIRAB ABAYA
Selected Indictor:
Economic Vulnerability: Status of Agriculture - Methods of tillage, Irrigation and other agricultural input utilization
by households
Percentage of
Irrigated Area
Last Year
Five Years Ago
Percentage of households
Last Year
0.93
with irrigated area
Five Years Ago
0.94
Source of Irrigation
Response Method of Tillage
Response Type of Fertilizer
Response
Type of Pesticide
Response
River/Lake/Pond
Other (specify)
25.28 Oxen
5.97 Tractor
71.10 Chemical
0.28 Natural/Animal manure
46.89
5.93
Chemicals (insecticides,
fungicide, etc)
Natural methods
15.32
1.16
No Irrigation
(Rain-fed)
68.75
Source of Irrigation
70
69
60
50
40
30
25
20
10
6
0
Other (specify)
No Irrigation (Rain-fed)
River/Lake/Pond
Source of Irrigation
River/Lake/Pond
No Irrigation (Rain-fed)
Other (specify)
Manual
None
27.20
1.42
Both Chemical and
Natural
None
13.56
33.62
Method of Tillage
80
71
70
60
50
40
30 27
20
10
0
Manual
Manual
1
None
Oxen
Method of Tillage
None
Oxen
0
Tractor
Tractor
Type of Fertilizer
50
47
40
34
30
20
14
10
6
0
Both
Chemical and
Natural
Chemical Natural/Animal
manure
Type of Fertilizer
None
Both Chemical and
Natural
Chemical
Natural/Animal manure
None
None
83.53
Type of Pesticide
100
84
80
60
40
20
15
1
0
Chemicals
Natural
None
(insecticides,
methods
fungicide, etc)
Type of Pesticide
Natural methods
Chemicals (insecticides,
fungicide, etc)
None
Proportion_Improved_Seeds
83.09
Proportion_Agriculture_Service
137
89.08
Page 1 of 1
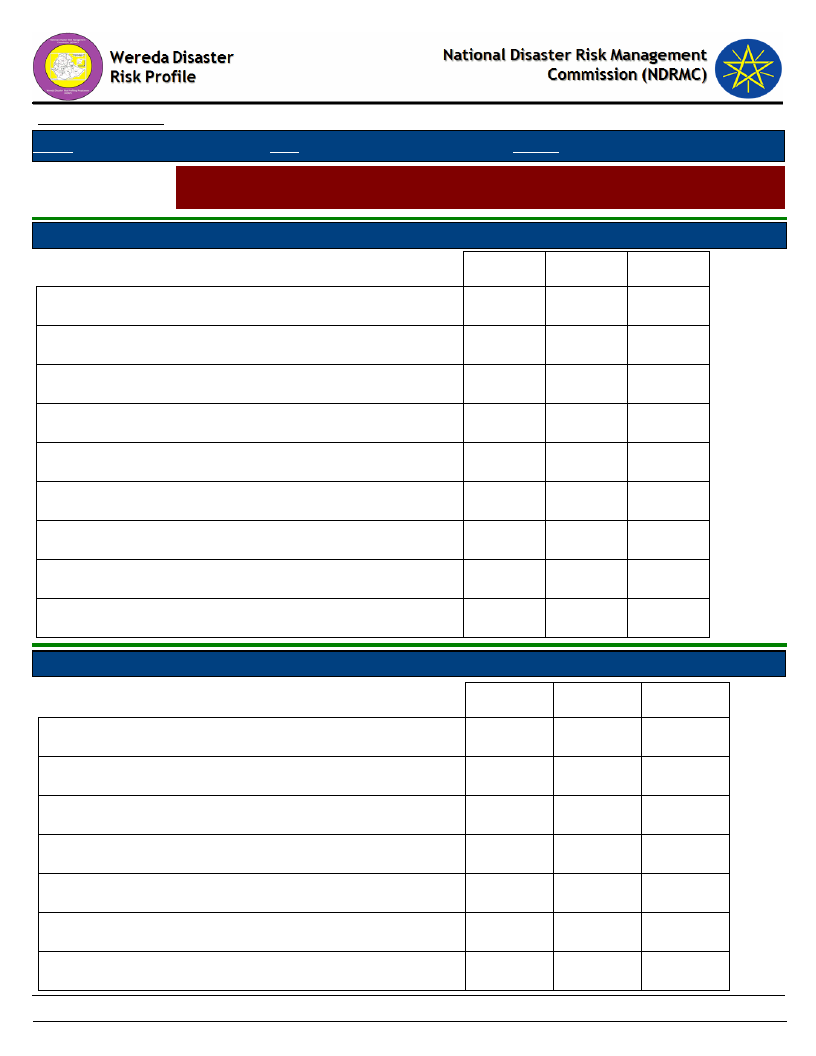
Data_Collected_Date
Region S.N.N.P
Zone GAMO GOFA
Tuesday, November 5, 2019
Wereda MIRAB ABAYA
Selected Indictor:
Economic Vulnerability: Change in Agricultural Situation - Households perception
on changes of crop type, size of cultivated area and crop yields
Proportion of households reporting change in crops grown
Adequate fertilizer
29.34
%
1st
2nd
3rd
0.97
Adequate irrigation available
1.94
Insufficient fertilizer
4.85
9.68
Insufficient irrigation available
15.53
9.68
7.14
Less rainfall
22.33
20.97
More drought resistant crop
12.62
11.29
More pest resistant crop
2.91
6.45
More yielding crop
25.24
17.74
Other
11.65
3.23
Proportion of households reporting change in size of area cultivated
19.65 %
Addition of area
1st
2nd
3rd
19.12
Insufficient irrigation available
1.47
Insufficient rainfall
7.35
14.29
Landslides
4.41
7.14
Loss of area
23.53
7.14
33.33
More yielding crop
14.71
7.14
Other
20.59
21.43
138
Page 1 of 2
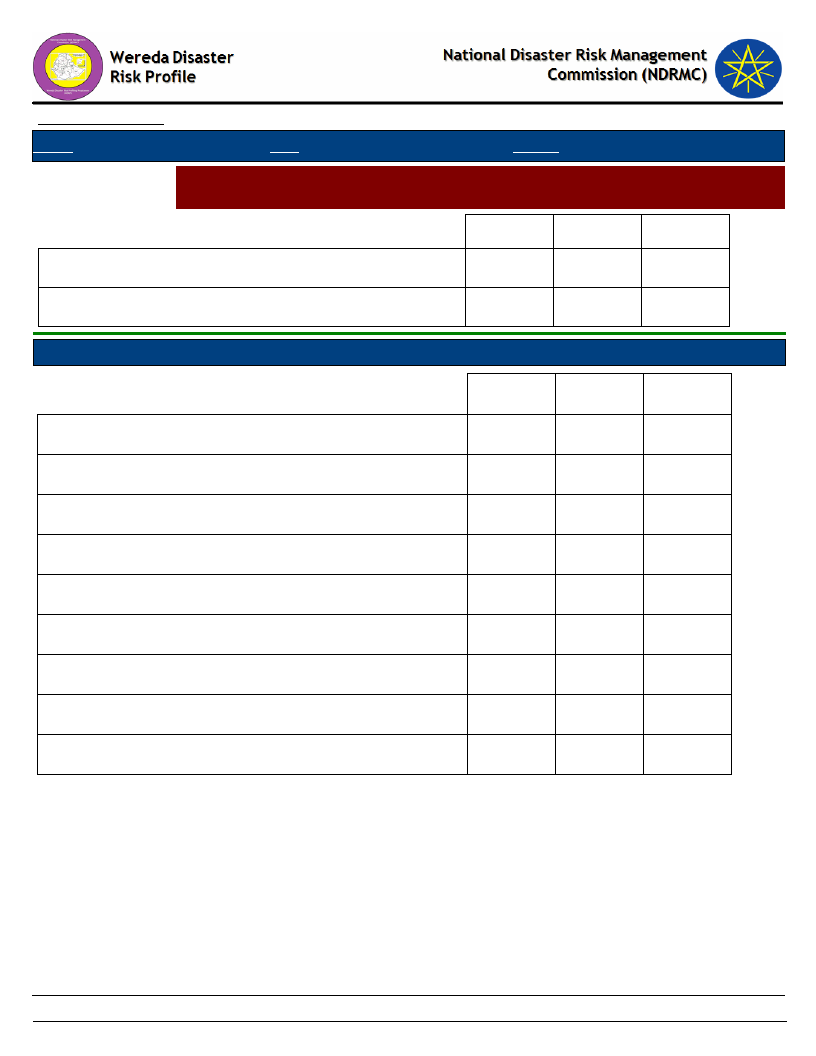
Data_Collected_Date
Region S.N.N.P
Zone GAMO GOFA
Tuesday, November 5, 2019
Wereda MIRAB ABAYA
Selected Indictor:
Economic Vulnerability: Change in Agricultural Situation - Households perception
on changes of crop type, size of cultivated area and crop yields
1st
2nd
3rd
Salinity problem
1.47
7.14
Water logging
7.35
7.14
Proportion of households reporting change in crop yield
Adequate fertilizer
Adequate irrigation available
Adequate rainfall
Better yielding crop
Improved variety of seeds
Insufficient fertilizer
Insufficient irrigation available
Insufficient rainfall
Other
71.23
%
1st
2nd
3rd
0.40
4.12
3.20
2.80
9.60
5.15
2.00
8.25
2.80
7.22
14.40
10.31
52.80
35.05
2.86
12.00
27.84
139
Page 2 of 2
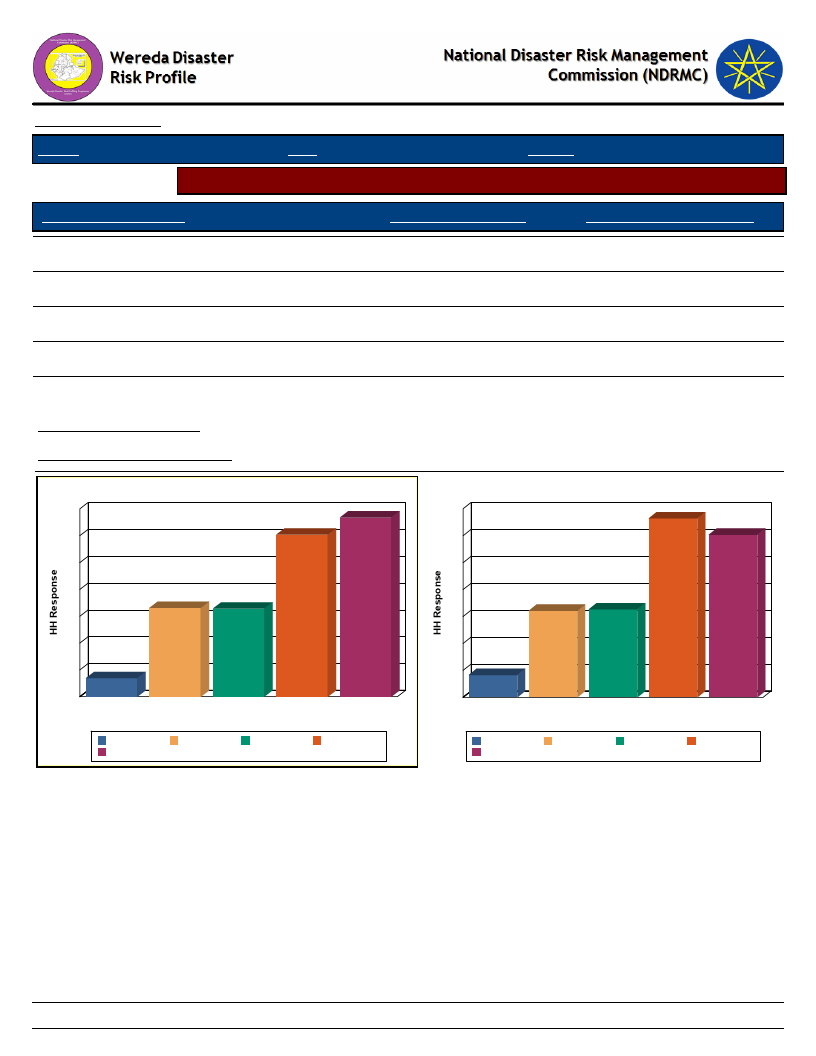
Data_Collected_Date
Region S.N.N.P
Zone GAMO GOFA
Tuesday, November 5, 2019
Wereda MIRAB ABAYA
Selected Indicator
Economic Vulnerability: Crops Grown - Number of crops grown by households
Number of Crops Grown
Crops Grown Last Year
Crops Grown Five Years Ago
One type
16.41
16.34
Two types
33.38
30.19
Three types
30.21
33.24
Four types
16.55
16.07
Five types
3.45
4.16
Avg Crops Grown Last Year
Avg Crops Grown Five Years Ago
1.91
1.91
Number of Crops Grown Last Year
35
33
30
30
25
20
17
16
15
10
5
3
0
Five types
Four types One type Three types
Number of Crops Grown
Two types
Five types
Two types
Four types
One type
Three types
Number of Crops Grown five years ago
35
33
30
30
25
20
16
16
15
10
5
4
0
Five types
Four types One type Three types Two types
Number of Crops Grown
Five types
Two types
Four types
One type
Three types
140
Page 1 of 1
WDRP Indicators
Livestock Production Characteristics
141
Data_Collected_Date
Tuesday, November 5, 2019
Region S.N.N.P
Zone GAMO GOFA
Wereda MIRAB ABAYA
Selected Indictor:
Kebele Name
ALGAE
Agricultural Situation: Status of Livestock Disease - Change in Livestock Disease
Status
Current_Level
Change_Over_Last_Decade
Comment
ANKOBER
DELBO
DOSHE
Trypanasomiasis, Foot
and mouth disease,
Anthrax, Black leg
Trypanasomiasis,
Increased
No change
Increased
No change
Lack of medicine and
treatment.
FARAOSA
FETELE
PURA
LAYO TERGA
Trypanasomiaisis,
Anthrax, Bloating
Trypanasomiasis,
Anthrax, Bloating
Vaulting,
Trypanasomiasis,
Anthrax, liver fluke
Increasing
Increasing
Increased
Lack of veterinary service,
lack of laboratory.
Lack of fodder, lack of
veterinary service.
Lack of livestock veterinary
service.
MOLLE
Medium
Decreased
Lack of pasture land
MOREDA
KOLA BANENA
KOLA MULAT0
KORGA GERAMO
UGAYO
UMO LANTE
Good animal health
service
Trypanasomiais, black
leg
Trypanasomiais, food
and mouth disease,
Anthrax
Poor health condition
Trypanasomiasis, black
leg, Anthrax
Good
Decreased
Increased
Increasing
No change
Increased
No change
Lack of periodic treatment,
lack of food
Lack of pasture and
climate change
Lack of fodder, lack of
medicine
WANKE WAGEFO
WOYE BARENA
Trypanasomiasis,
Anthrax, Black leg
Decreased
Due to shortage of
veterinary service.
142
Page 1 of 2
Data_Collected_Date
Tuesday, November 5, 2019
Region S.N.N.P
Zone GAMO GOFA
Wereda MIRAB ABAYA
Selected Indictor:
Kebele Name
YAYEKE
ZALA GUTESHA
ZALA BARANA
Agricultural Situation: Status of Livestock Disease - Change in Livestock Disease
Status
Current_Level
Change_Over_Last_Decade
Comment
Trypanasomiasis, black
leg, Anthrax, foot and
mouth disease
Anthrax, liver flack,
black leg
Good
No change
Increasing
No change
Lack of livestock veterinary
service, lack of food.
143
Page 2 of 2
Data_Collected_Date
Tuesday, November 5, 2019
Region S.N.N.P
Zone GAMO GOFA
Wereda MIRAB ABAYA
Selected Indictor: Livestock Diseases Prevalece
Type of livestock diseases affected households in the last five years (households reporting in %)
1st
2nd
3rd
African horse disease
0.62
1.29
0.74
Anthrax affecting cattle
1.85
4.85
5.58
Black leg
9.54
20.06
9.67
Contagious Caprine PLeuropneumonia (CCPP)
1.54
13.27
6.69
DK
0.31
0.32
Faciolosis
5.85
15.53
20.45
Foot and mouth disease
4.62
12.62
8.18
Heart water
0.65
0.74
Internal & External Parasites (Tick, mange, helminthiasis, fasci
0.62
2.27
2.60
Liverfluke (Sheep and cattle)
0.31
3.56
2.60
Lymphangitis
2.77
4.53
19.33
Newcasle disease (Chicken)
1.85
11.00
16.36
Pasteurellosis
0.65
0.74
Sheep pox
1.54
0.32
0.74
Trypanosomiasis
68.62
9.06
5.58
144
Page 1 of 1
Data_Collected_Date
Tuesday, November 5, 2019
Region S.N.N.P
Selected Indictor:
Level of Access
Excellent
Good
Adequate
Poor
Very poor
Zone GAMO GOFA
Wereda MIRAB ABAYA
Evaluation of Access to Veternary Services and Livestock Drugs
Households’ evaluation on access to drugs and veterinary services
Veternary Service
Livestock_Drugs
0.31
0.63
36.36
39.12
28.53
26.18
31.97
32.81
2.82
1.26
Level of Access to Veternary Services
Access Level of Livestock Drugs
29
26
3
1
32
33
0
36
Adequate Excellent
Good
Poor
Very poor
1
39
Adequate Excellent
Good
Poor
Very poor
145
Page 1 of 1
Data_Collected_Date
Tuesday, November 5, 2019
Region S.N.N.P
Selected Indictor:
Zone GAMO GOFA
Wereda MIRAB ABAYA
Agricultural Situation: Water Availability for Livestock - Water availability for
livestock in the community
KebeleName
Current_Level
Change_In_Last_Decade
Comments
ALGAE
ANKOBER
DELBO
DOSHE
FARAOSA
FETELE
PURA
LAYO TERGA
MOLLE
MOREDA
KOLA BANENA
KOLA MULAT0
KORGA GERAMO
UGAYO
UMO LANTE
WANKE WAGEFO
WOYE BARENA
YAYEKE
ZALA GUTESHA
ZALA BARANA
Good
Sufficient
Sufficient
Good
Sufficient
Sufficient
High
Sufficient
Good
Good
Medium
Sufficient
Good
Sufficient
Good
Sufficient
Good
No problem
Efficient
Low
Increased
No change
No change
No change
No change
No change
No change
No change
Increased
No change
No change
No change
No change
No change
No change
No change
Improved
Increasing
Decreased
Access to lake Abaya
Access to lake Abaya.
Presence of lake
Expansion of water line
distribution
Due to presence of river
and ponds
Shortage of water
146
Page 1 of 1

Data_Collected_Date
Tuesday, November 5, 2019
Region S.N.N.P
Zone GAMO GOFA
Wereda MIRAB ABAYA
Selected Indictor:
Agricultural Situation: Livestock Diversity - Type of livestock and their economic
importance in the community
Kebele Name
ALGAE
Type of Livestock
Cattle: Male bulls
Avg_Number
0
Economic_Importance_Rank
For ploughing, for consumption.
Cattle: Female
Goats
Donkeys
0
Domestic consumption economical
value.
0
Domestic consumption economical
value.
0
For transportation.
Camels: Female
0
ANKOBER
Cattle: Male bulls
1
Income resource
Sheep
1
Income resource
Goats
1
Income resource
Cattle: Female
1
Income resource.
Cattle: Mature Male
1
Ploughing purpose, income resource.
DELBO
Cattle: Female
1
For milk production.
Cattle: Mature Male
1
For meat, for ploughing.
Goats
1
For meat production.
Sheep
0
For milk production.
Cattle: Male bulls
0
For meat and heifer for milk 0.67.
DOSHE
Cattle: under 1 year
1
For source of income.
Cattle: Male bulls
1
For source of income.
Goats
Cattle: Mature Female
Cattle: Mature Male
3
For food consumption, source of
income.
1
For milk and milk production, source of
income.
1
For ploughing, source of income.
FARAOSA
Cattle: Mature Male
1
For ploughing, meat production.
Cattle: Mature Female
1
For milk and dairy production.
147
Page 1 of 5

Data_Collected_Date
Tuesday, November 5, 2019
Region S.N.N.P
Zone GAMO GOFA
Wereda MIRAB ABAYA
Selected Indictor:
Agricultural Situation: Livestock Diversity - Type of livestock and their economic
importance in the community
Kebele Name
FARAOSA
Type of Livestock
Cattle: Male bulls
Avg_Number
1
Economic_Importance_Rank
For meat production.
Goats
2
For meat production.
Donkeys
1
For loading goods, transpiration.
FETELE
Donkeys
0
For transportation, loading.
Sheep
1
For meat production.
Cattle: Male bulls
1
For ploughing and or meat production.
Cattle: Mature Female
1
For milk production.
Cattle: Mature Male
1
For ploughing, for meat production.
KOLA BANENA
Cattle: Mature Male
1
For ploughing, meat production.
Cattle: Mature Female
1
For milk production.
Goats
1
For consumption.
Donkeys
0
For transportation.
Camels: Female
0
KOLA MULAT0
Poultry
2
For meat and egg production.
Donkeys
0
For transportation.
Cattle: Male bulls
1
For meat production.
Cattle: Mature Female
1
For milk production.
Cattle: Mature Male
1
For ploughing, meat production.
KORGA GERAMO
Cattle: Mature Male
1
For ploughing, meat production
Cattle: Mature Female
3
For milk production, source of income.
Goats
4
Source of income.
Cattle: Male bulls
2
Source of income.
Poultry
5
For egg and meat production, source of
income.
148
Page 2 of 5
Data_Collected_Date
Tuesday, November 5, 2019
Region S.N.N.P
Zone GAMO GOFA
Wereda MIRAB ABAYA
Selected Indictor:
Agricultural Situation: Livestock Diversity - Type of livestock and their economic
importance in the community
Kebele Name
LAYO TERGA
Type of Livestock
Poultry
Avg_Number
3
Economic_Importance_Rank
For egg and meat production.
Pack Animals
2
For transportation, loading goods.
Cattle: Male bulls
1
For meat production.
Cattle: Mature Female
1
For milk production.
Cattle: Mature Male
1
For ploughing, meat production.
MOLLE
Cattle
0
For ploughing, for consumption.
Goats
Donkeys
0
Domestic consumption economical
value.
0
For transportation.
Camels: Female
0
Camels: Female
0
MOREDA
Cattle: under 1 year
1
Source of income.
Cattle: Female
1
Source of income.
Goats
Cattle: Mature Female
4
For food consumption, source of
income.
2
For milk production, source of income.
Cattle: Mature Male
1
For ploughing, source of income.
PURA
Cattle: Mature Male
1
For ploughing and meat production.
Cattle: Mature Female
1
For milk production.
Cattle: Male bulls
1
For ploughing and meat production.
Sheep
0
For meat production
UGAYO
Goats
Sheep
1
For meat production and their waste for
fertilizer.
1
For milk production.
Goats
2
For milk and meat production.
149
Page 3 of 5

Data_Collected_Date
Tuesday, November 5, 2019
Region S.N.N.P
Zone GAMO GOFA
Wereda MIRAB ABAYA
Selected Indictor:
Agricultural Situation: Livestock Diversity - Type of livestock and their economic
importance in the community
Kebele Name
UGAYO
Type of Livestock
Cattle: Male bulls
Avg_Number
1
Economic_Importance_Rank
For cultivation, meat production.
Cattle: Mature Female
1
For milk production.
Cattle: Mature Male
1
For cultivation, meat production.
UMO LANTE
Cattle: Mature Male
Camels: Young Female
1
For ploughing, meat production, source
of income.
1
For milk production, source of income.
Goat and Sheep
Poultry
Camels: Female
1
For food consumption, source of
income.
2
For food consumption, source of
income.
0
WANKE WAGEFO
Poultry
Donkeys
4
For egg and meat production, source of
income.
0
For transportation.
Goat and Sheep
Cattle: Mature Male
1
For consumption, meat production,
source of income.
1
For ploughing, meat production.
Cattle: Mature Female
1
For milk production.
WOYE BARENA
Cattle: Mature Male
1
For ploughing, source of income .
Cattle: Mature Female
1
Source of income.
Goats
1
Source of income.
Sheep
1
Source of income.
Cattle: Male bulls
1
Source of income.
YAYEKE
Camels: Female
0
Cattle: Male bulls
1
Source of income.
Goats
3
Source of income.
150
Page 4 of 5
Data_Collected_Date
Tuesday, November 5, 2019
Region S.N.N.P
Zone GAMO GOFA
Wereda MIRAB ABAYA
Selected Indictor:
Agricultural Situation: Livestock Diversity - Type of livestock and their economic
importance in the community
Kebele Name
YAYEKE
Type of Livestock
Camels: Young Female
Avg_Number
1
Economic_Importance_Rank
Source of income.
Cattle: Mature Male
1
For ploughing, source of income.
ZALA BARANA
Poultry
3
Source of income.
Sheep
1
Source of income.
Goats
1
Source of income.
Cattle: Mature Female
1
For milk production source of income./
ZALA GUTESHA
Cattle: Mature Male
Cattle
Horses
1
For ploughing, meat production source
of income.
1
For ploughing, milk and meat
production.
0
For transpiration.
Cattle: Male bulls
1
For meat production.
Sheep
0
For meat production.
Poultry
1
For egg and meat production.
151
Page 5 of 5
Wereda Disaster
Risk Profile
Data_Collected_Date
National Disaster Risk Management
Commission (NDRMC)
Tuesday, November 5, 2019
Region S.N.N.P
Zone GAMO GOFA
Wereda MIRAB ABAYA
Selected Indictor:
Economic Vulnerability: Livestock Ownership and Changes - Percentage of households by number and type of
livestock owned
Bee keeping
A - None
4.75
B - 1 to 5
2.90
C - 6 to 10
0.79
D - 11 to 50
F - More
than 100
Camels: Female
10.82
0.26
Camels: Male
10.82
0.26
Camels: Young Female
10.82
0.26
Camels: Young Male
10.55
0.53
0.26
Cattle: Female
3.17
27.97
1.85
Cattle: Male bulls
3.17
24.27
1.58
Cattle: Mature Female
1.06
57.52
1.32
0.26
0.26
Cattle: Mature Male
3.17
29.02
0.79
Cattle: under 1 year
1.58
40.63
1.32
Donkeys
3.96
15.57
0.79
Goats
2.37
33.51
2.64
1.58
Horses
4.22
0.53
0.53
152
Page 1 of 2
Wereda Disaster
Risk Profile
Data_Collected_Date
National Disaster Risk Management
Commission (NDRMC)
Tuesday, November 5, 2019
Region S.N.N.P
Zone GAMO GOFA
Wereda MIRAB ABAYA
Selected Indictor:
Economic Vulnerability: Livestock Ownership and Changes - Percentage of households by number and type of
livestock owned
Mules
A - None
3.96
B - 1 to 5
1.06
C - 6 to 10
0.53
D - 11 to 50
F - More
than 100
Poultry
3.17
40.63
4.49
0.53
Sheep
3.17
10.29
0.53
153
Page 2 of 2
Data_Collected_Date
Region S.N.N.P
Zone GAMO GOFA
Tuesday, November 5, 2019
Wereda MIRAB ABAYA
Selected Indicator
Economic Vulnerability: Livestock Ownership and Changes - Households
perception on changes in livestock number in the last five years (response in %)
Type of Livestock Owned
Changes Observed By Households
Bee keeping
A - Decreased
45.45
B - Remained the Same
27.27
C - Increased
27.27
Camels: Male
100.00
Camels: Young Male
50.00
50.00
Cattle: Female
67.57
18.02
14.41
Cattle: Male bulls
64.21
17.89
17.89
Cattle: Mature Female
71.95
10.86
17.19
Cattle: Mature Male
66.67
9.26
24.07
Cattle: under 1 year
69.03
14.19
16.77
Donkeys
31.58
43.86
24.56
Goats
68.79
11.35
19.86
Horses
66.67
33.33
Mules
25.00
25.00
50.00
Poultry
56.02
15.06
28.92
Sheep
52.78
8.33
38.89
154
Page 1 of 3
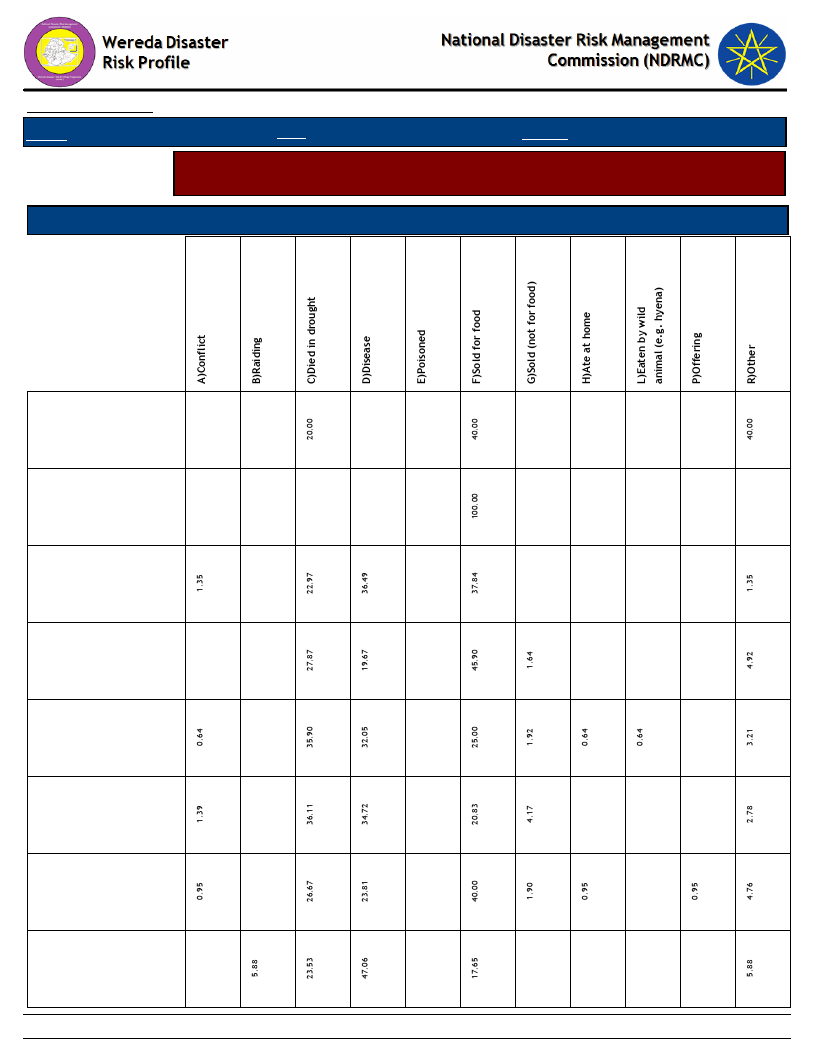
Data_Collected_Date
Region S.N.N.P
Zone GAMO GOFA
Tuesday, November 5, 2019
Wereda MIRAB ABAYA
Selected Indicator
Economic Vulnerability: Livestock Ownership and Changes - Households
perception on changes in livestock number in the last five years (response in %)
Type of Livestock Owned
Reason for Decrease in Livestock Number
Bee keeping
Camels: Young
Male
Cattle: Female
Cattle: Male bulls
Cattle: Mature
Female
Cattle: Mature
Male
Cattle: under 1
year
Donkeys
155
Page 2 of 3
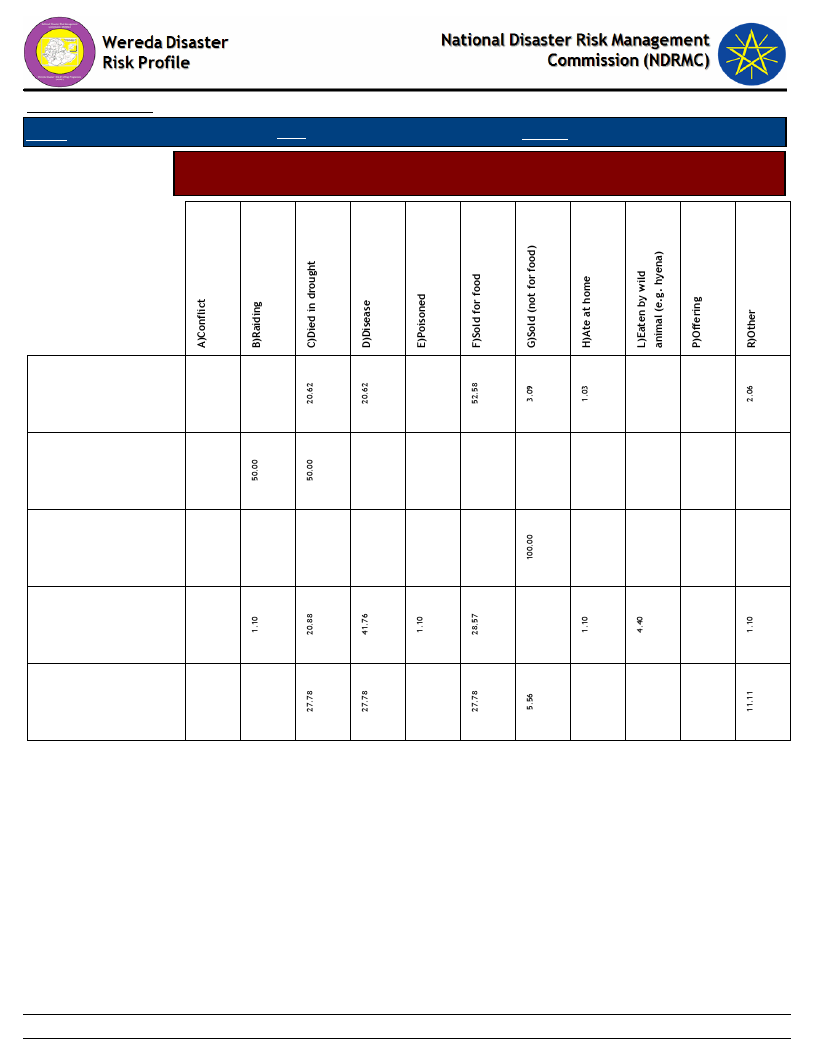
Data_Collected_Date
Region S.N.N.P
Zone GAMO GOFA
Tuesday, November 5, 2019
Wereda MIRAB ABAYA
Selected Indicator
Economic Vulnerability: Livestock Ownership and Changes - Households
perception on changes in livestock number in the last five years (response in %)
Goats
Horses
Mules
Poultry
Sheep
156
Page 3 of 3
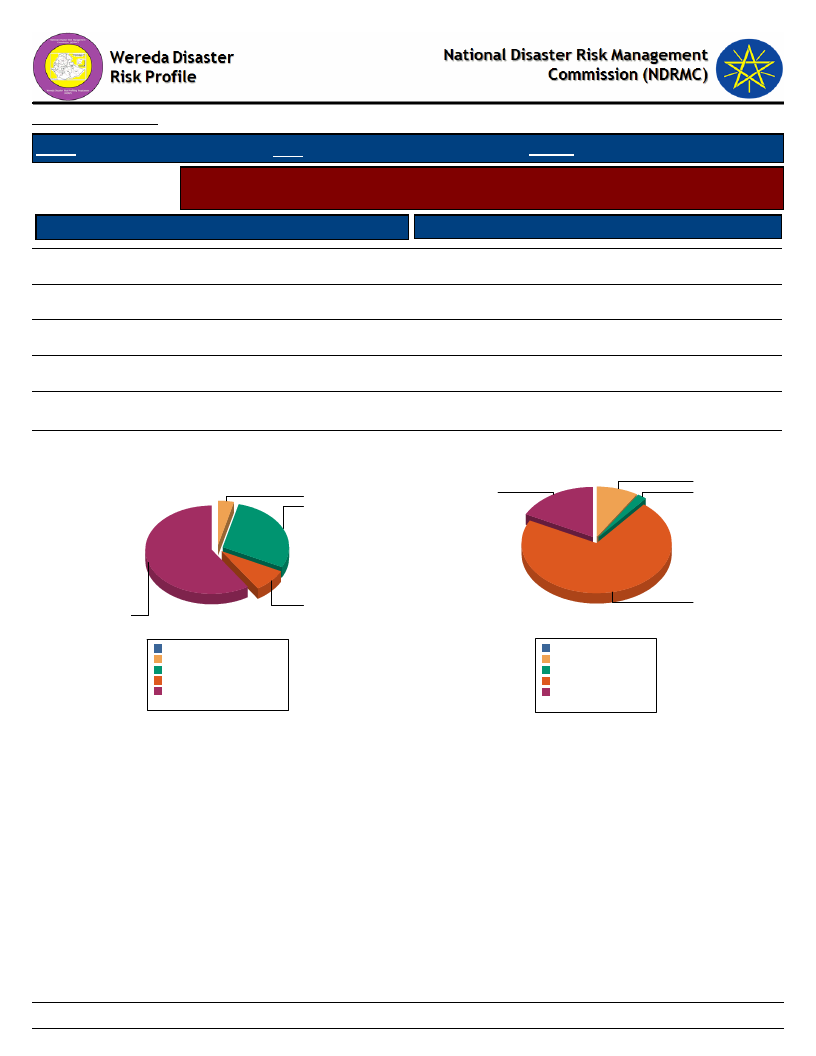
Data_Collected_Date
Tuesday, November 5, 2019
Region S.N.N.P
Zone GAMO GOFA
Wereda MIRAB ABAYA
Selected Indicator
Agriculture (Livestock): Pasture Availability - Households perception on access
and quality of pasture
Access to Pasture
Response Percent
Quality of Pasture
Response Percent
Occasionally
28.62
B - Good
8.86
Seldom available
59.12
C - Adequate
1.90
Never available
3.77
D - Poor
70.57
E - Very poor
17.41
Regularly available
8.49
Household responses to Access to Pasture for
Livestock
3.8
28.6
Household responses to Quality of Pasture
8.9
17.4
1.9
59.1
8.5
Never available
0.0%
3.8%
Occasionally
28.6%
Regularly available 8.5%
Seldom available 59.1%
Total:
100.0%
B - Good
0.0%
9.0%
C - Adequate 1.9%
D - Poor
71.5%
E - Very poor 17.6%
Total:
100.0%
70.6
157
Page 1 of 1
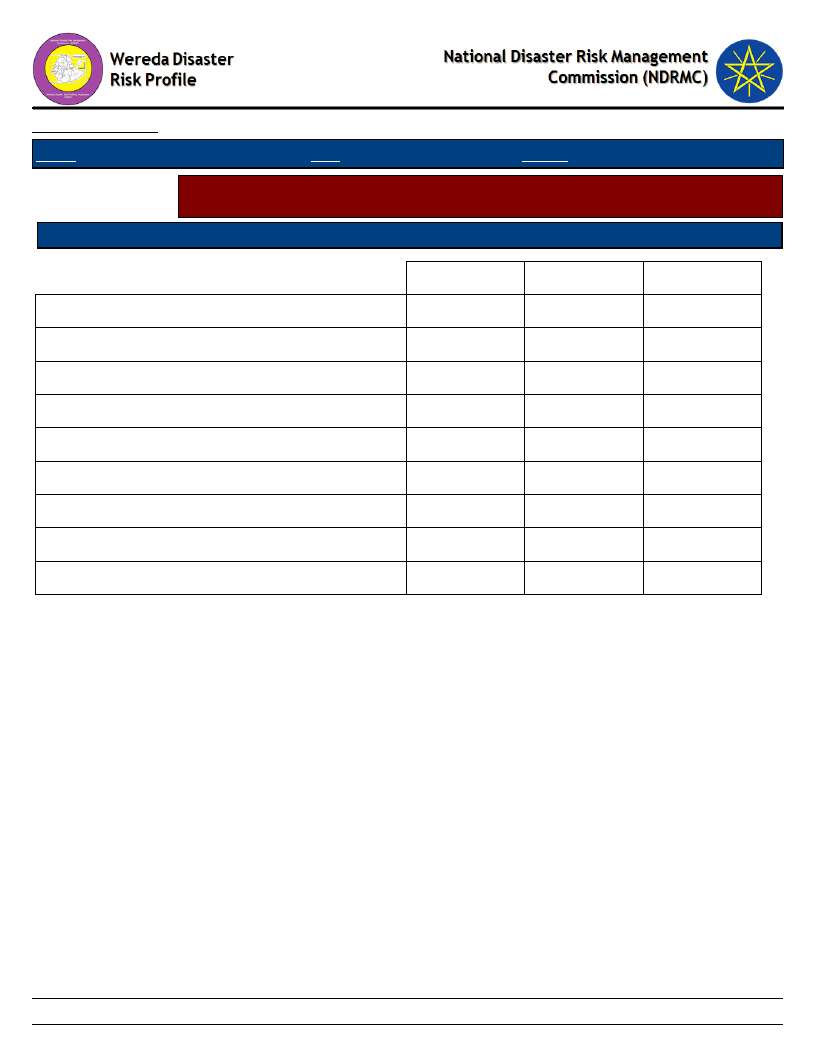
Data_Collected_Date
Region S.N.N.P
Zone GAMO GOFA
Tuesday, November 5, 2019
Wereda MIRAB ABAYA
Selected Indicator
Agriculture (Livestock): Pasture Availability - Households perception on
problematic months for pasture availability
Problematic Months
Order of Severity
A - Sep (Meskerem)
D - Dec (Tahsas)
E - Jan (Tir)
F - Feb (Yekatit)
G - Mar (Megabit)
H - Apr (Meazea)
I - May (Ginbot)
J - Jun (Sene)
K - Jul (Hamle)
1st
1.58
66.25
12.30
14.20
5.36
0.32
2nd
1.89
78.55
17.35
1.89
0.32
3rd
0.32
0.96
12.74
6.69
66.88
10.83
1.59
158
Page 1 of 1
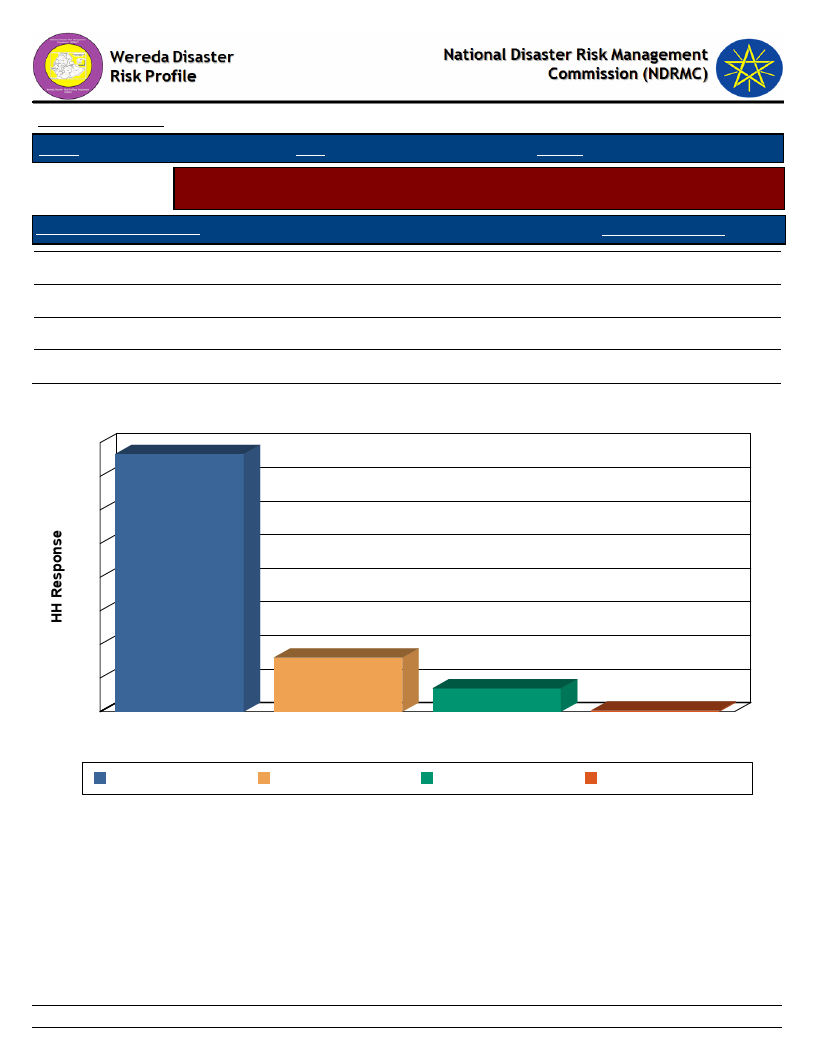
Data_Collected_Date
Region S.N.N.P
Zone GAMO GOFA
Tuesday, November 5, 2019
Wereda MIRAB ABAYA
Selected Indicator
Agriculture (Livestock): Water Availability - Households response on water
availability for livestock
Access to Water - Livestock
Household Response
A - Regularly available
B - Occasionally
C - Seldom available
D - Never available
76.66
16.09
6.94
0.32
Household Access to Water for Livestock
80
77
70
60
50
40
30
20
10
0
A - Regularly available
16
7
B - Occasionally
C - Seldom available
Access to Water - Livestock
0
D - Never available
A - Regularly available B - Occasionally
C - Seldom available
D - Never available
159
Page 1 of 1

Data_Collected_Date
Tuesday, November 5, 2019
Region S.N.N.P
Zone GAMO GOFA
Wereda MIRAB ABAYA
Selected Indicator
Agriculture (Livestock): Water Availability - Households perception on
problematic months for water availability for Livestock
Problematic Months
Order of Severity
C - Nov (Hidar)
D - Dec (Tahsas)
E - Jan (Tir)
F - Feb (Yekatit)
G - Mar (Megabit)
H - Apr (Meazea)
I - May (Ginbot)
1st
2.35
83.53
14.12
2nd
4.71
82.35
11.76
1.18
3rd
1.19
2.38
2.38
2.38
82.14
8.33
1.19
160
Page 1 of 1
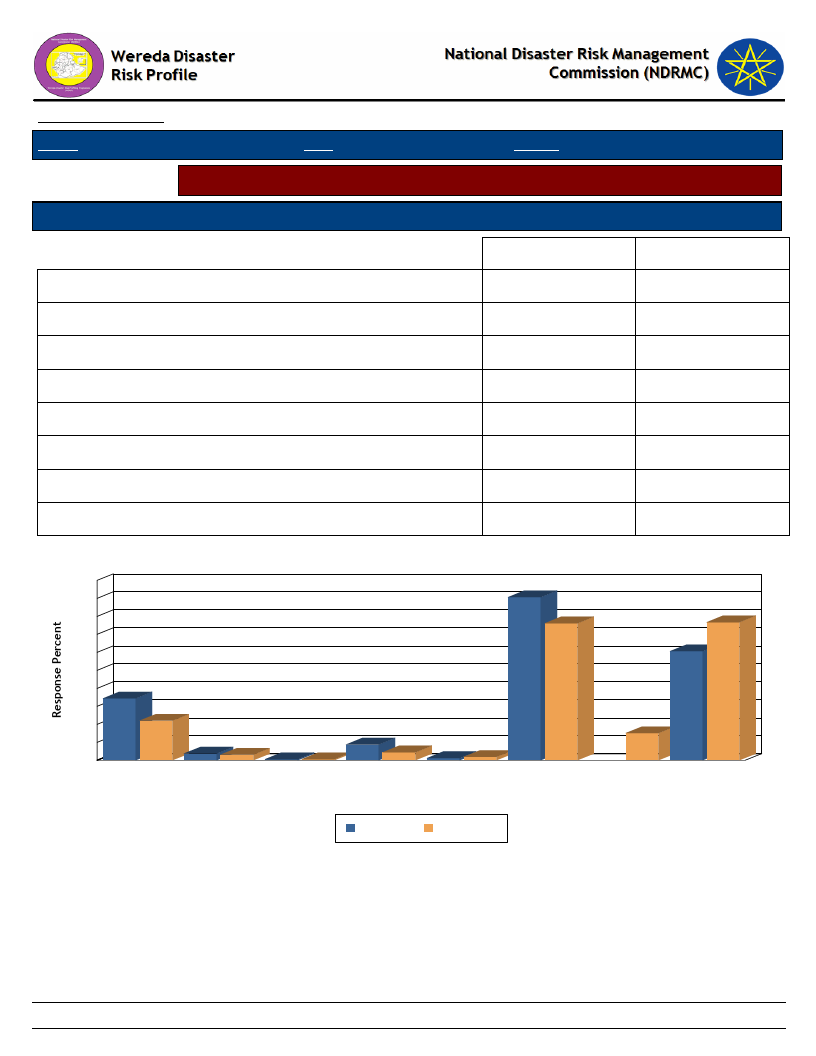
Data_Collected_Date
Region S.N.N.P
Zone GAMO GOFA
Tuesday, November 5, 2019
Wereda MIRAB ABAYA
Selected Indicator
Sources of water for livestock (households response in %)
Type of Livestock Owned
Changes Observed By Households
Communal tap (Bono)
Open/Deep well
Other
Piped water outside the house
Pond or lake (fenced)
Pond or lake (open access)
Rainwater harvesting
River, stream
Dry Season
17.19
1.88
0.31
4.38
0.62
45.31
30.31
Wet Season
11.01
1.57
0.31
2.20
0.94
38.05
7.55
38.36
Household Responses to Type of Water Source and Season for Livestock
50
45
45
40
38
35
30
25
20 17
15
11
10
5
2
2
0
Communal tap Open/Deep well
(Bono)
0
0
4
2
1
1
Other
Piped water
Pond or lake
Pond or lake
outside the
(fenced)
(open access)
Type ohfouWseater Source & Season
8
Rainwater
harvesting
Dry Season
Wet Season
38
30
River, stream
161
Page 1 of 1
WDRP Indicators
Access to Market and Credit
162

Wereda Disaster
Risk Profile
Data_Collected_Date
National Disaster Risk Management
Commission (NDRMC)
Tuesday, November 5, 2019
Region S.N.N.P
Zone GAMO GOFA
Wereda MIRAB ABAYA
Selected Indictor:
KebeleName
ALGAE
ANKOBER
DELBO
Economic Vulnerability: Proportion of Produce Sold and Market - Proportion of crops and livestock sold from total
production and markets
Market_For_Crops
Market_For_Livestock_Produce
Percent
Livestock_Sold
Total_% Comments
Sold
Mirab Abaya, Addis
Ababa, Nazreth
Mirab Abaya
25
10
Crops produced are mainly
subsistence
Ankober, Birbir,
Mirab Abaya, Chane
50
85
Wanke Wajfe, Adiss
Ababa
100
DOSHE
FARAOSA
M/Abaya, Wajfe
M/Abaya, Wajfe
50
20
Crops produced are mainly
subsistence
100
FETELE
100
PURA
100
LAYO TERGA
100
MOLLE
Mirab Abaya, Addis
Mirab Abaya
20
Ababa, Nazreth
MOREDA
Mirab Abaya,
Mirab Abaya, Chencha
25
Chencha
KOLA BANENA
Mirab Abaya, Wanke
Mirab Abaya, Wanke Wajelo
25
Wajelo
KOLA MULAT0
100
90
Crops produced are mainly
subsistence
20
10
Crops produced are mainly
subsistence
30
163
Page 1 of 2
Wereda Disaster
Risk Profile
Data_Collected_Date
National Disaster Risk Management
Commission (NDRMC)
Tuesday, November 5, 2019
Region S.N.N.P
Zone GAMO GOFA
Wereda MIRAB ABAYA
Selected Indictor:
KebeleName
KORGA GERAMO
UGAYO
Economic Vulnerability: Proportion of Produce Sold and Market - Proportion of crops and livestock sold from total
production and markets
Market_For_Crops
Market_For_Livestock_Produce
Percent
Livestock_Sold
Total_% Comments
Sold
Wanke, WAjfo,
Wanke, WAjfo, Umbo
50
20
Umbo
100
UMO LANTE
WANKE WAGEFO
Umo Lante, Ocholo
Lante
Addis Ababa
Chane, Mile
Neighbor market
25
70
60
85
WOYE BARENA
25
20
YAYEKE
Mirab Abaya
Mirab Abaya
45
25
ZALA GUTESHA
100
ZALA BARANA
Cheacha, Mirab
Cheacha, Mirab Abaya, Boroda
25
50
Abaya, Boroda
164
Page 2 of 2
Data_Collected_Date
Region S.N.N.P
Selected Indicator
Kebele Name
ALGAE
ANKOBER
DELBO
DOSHE
FARAOSA
FETELE
PURA
LAYO TERGA
MOLLE
MOREDA
KOLA BANENA
KOLA MULAT0
KORGA GERAMO
UGAYO
UMO LANTE
WANKE WAGEFO
WOYE BARENA
YAYEKE
ZALA GUTESHA
ZALA BARANA
Zone GAMO GOFA
Tuesday, November 5, 2019
Wereda MIRAB ABAYA
Economic Vulnerability: Kebele Access to Markets - Access to market by Kebele
Market_Access_Comments
Market price fluctuation
Market price fluctuation
Market price fluctuation
Market price fluctuation
Good access to market
Good access to market
The community settled near the road and there is no market problem
Good access to market
Market linkage problem specially for cash crop.
Market place is far from kebele
Market price fluctuation
Good access to market
Market price fluctuation
Good access to market
Market price fluctuation
The kebele is near to road
Market price fluctuation
Good access to market
165
Page 1 of 1
Data_Collected_Date
Region S.N.N.P
Zone GAMO GOFA
Tuesday, November 5, 2019
Wereda MIRAB ABAYA
Selected Indicator
Economic Vulnerability: Formal & Informal Transfers - Percentage of
households reporting received formal transfers
Type of Formal Transfer
Food aid
HH Response Type of Informal Transfer
Formal
15.69 Remittances (from relative living elsewhere)
HH Response
2.11
Food-for-Work project
4.27 Zakaat
0.27
Cash-for-Work project
32.01 Other cash gift
2.65
Faffa
0.53 Cash loan (no interest)
2.39
Free cash
2.41 Food or grain gift
7.39
Seeds
8.51 Grain loan (no interest)
1.32
Credit support
4.27 Seed gift
2.11
Livestock
0.53 Seed loan
1.58
Tools
0.35 Free labour
1.58
Donation or loan of milking animals to a relative or
0.53
friend
Donations of cash or animals to disaster stricken
0.27
people
Free use of oxen or plough
1.58
Restocking of poorer relatives
0.26
Distribution of meat to neighbours after a slaughter
2.37
takes place
Sacrifice made to feed the poor
0.27
Cash or kind gift to married daughters when they
0.27
visit parents or relatives
Gift of livestock to newly-weds
0.27
166
Page 1 of 2
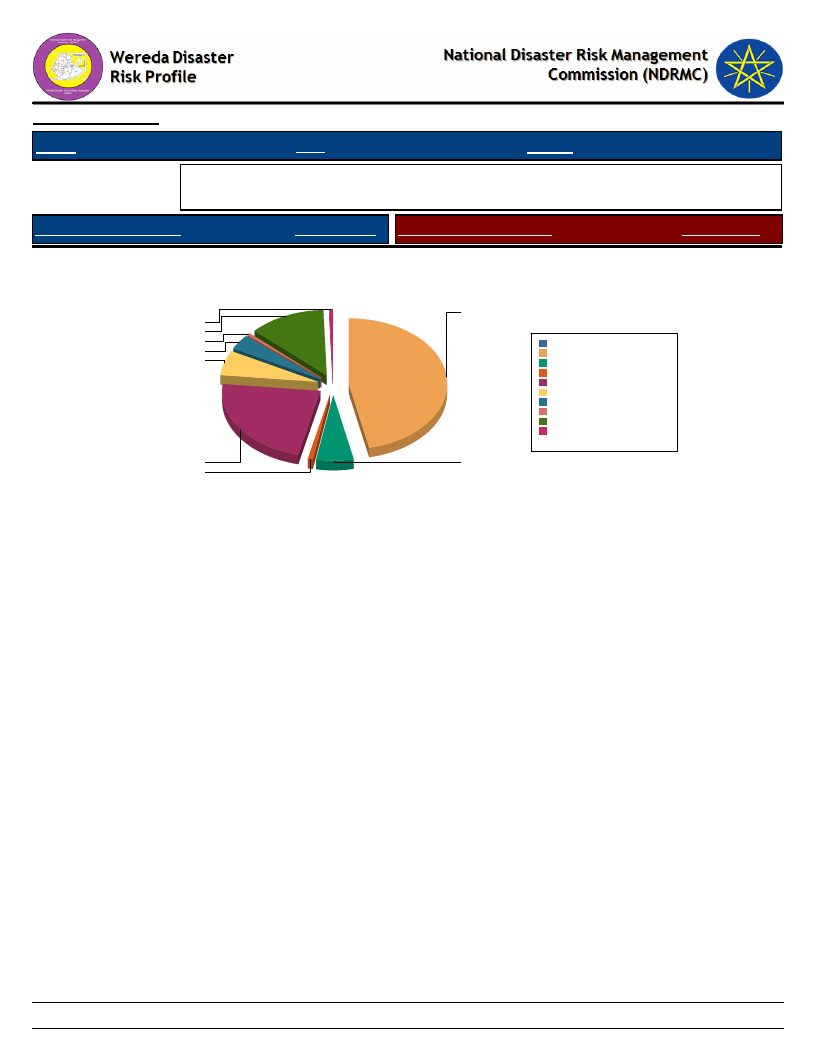
Data_Collected_Date
Region S.N.N.P
Zone GAMO GOFA
Tuesday, November 5, 2019
Wereda MIRAB ABAYA
Selected Indicator
Economic Vulnerability: Formal & Informal Transfers - Percentage of
households reporting received formal transfers
Type of Formal Transfer
HH Response Type of Informal Transfer
Formal
Type of Formal Transfer Received By Households
HH Response
0.3
8.5
0.5
2.4
4.3
15.7
0.5
32.0
4.3
0.0%
Cash-for-Work project 46.7%
Credit support
6.2%
Faffa
0.8%
Food aid
22.9%
Food-for-Work project 6.2%
Free cash
3.5%
Livestock
0.8%
Seeds
12.4%
Tools
0.5%
Total:
100.0%
167
Page 2 of 2
Data_Collected_Date
Region S.N.N.P
Zone GAMO GOFA
Tuesday, November 5, 2019
Wereda MIRAB ABAYA
Selected Indicator
Capacity: Access to Credit Facilities - Households access to credit facilities
Type of Access To Credit Facilities
Indicator_Value
Households who borrowed any money in the last one year (%)
Households who tried to borrow 1-2
Households who managed to get credit 1-2
Households who tried to borrow 5 & Above
Households who managed to get credit 5 & Above
Households with membership in any credit /micro finance society (%)
Households who tried to borrow 3-4
Households who managed to get credit 3-4
Average No. of HHs Tried to get Credit
Average No. HHs Managed to get Credit
35.38
91.54
96.00
2.31
0.80
44.83
6.15
3.20
1.13
1.45
168
Page 1 of 1

Data_Collected_Date
Region S.N.N.P
Zone GAMO GOFA
Tuesday, November 5, 2019
Wereda MIRAB ABAYA
Selected Indicator
Capacity: Access to Credit Facilities - Percentage of households by major
reasons of borrowing money
Type of Borrowing Reason
Degree of Importance of the Borrowing Reasons - HH Respones
Buy agricultural input
Buy food
Buy or rent land
Others (specify)
Pay for education
Pay for health care
Pay for social event
1st
Important
15.50
31.01
5.43
35.66
7.75
3.88
0.78
2nd
Important
23.08
29.49
2.56
8.97
20.51
12.82
2.56
3rd
Important
17.02
10.64
2.13
14.89
19.15
14.89
21.28
169
Page 1 of 1
Data_Collected_Date
Tuesday, November 5, 2019
Region S.N.N.P
Zone GAMO GOFA
Wereda MIRAB ABAYA
Selected Indicator
Capacity: Access to Credit Facilities - Percentage of households by major
sources of credit
Major Sources of Credit for Households
Degree of Importance of the Credit Source
Bank/formal lending institution
1st
Important
58.87
2nd
Important
8.33
3rd
Important
Friends/relatives
Help associations (Edir)
Informal savings group (Ekub)
Local shops / moneylenders
Neighbors
2.42
2.42
8.33
40.00
25.00
20.00
2.42
8.33
20.00
41.67
20.00
Others (specify)
33.87
8.33
170
Page 1 of 1
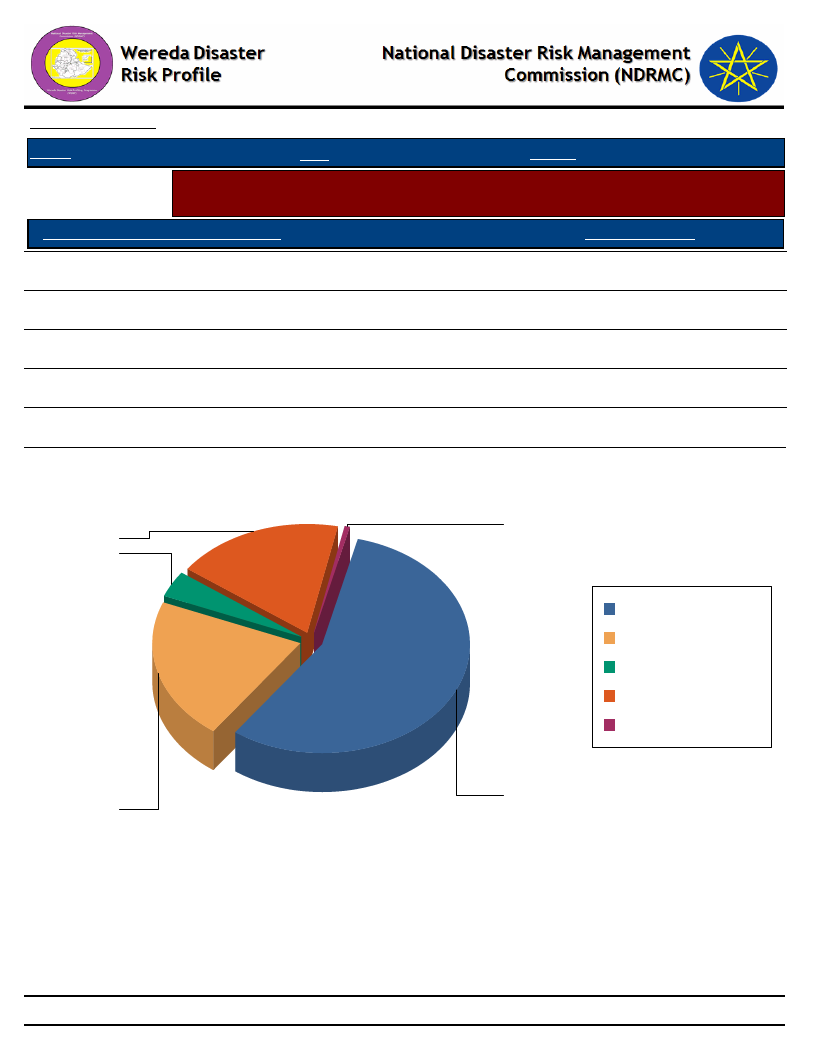
Data_Collected_Date
Tuesday, November 5, 2019
Region S.N.N.P
Zone GAMO GOFA
Wereda MIRAB ABAYA
Selected Indicator
Capacity: Access to Credit Facilities - Percent of households with ability to raise
500 birr in one week
HH Ability To Raise 500 Br in One Week
Response_Percent
Yes, we would use our savings
18.35
Yes, with some help from others
0.63
Yes, by selling asset or livestock
3.80
Yes, by borrowing money
21.20
Perhaps, but I doubt it
56.01
Households' Ability To Raise 500 Br in One Week
1
18
4
Perhaps, but I doubt it
Yes, by borrowing
money
Yes, by selling asset or
livestock
Yes, we would use our
savings
Yes, with some help
from others
56
21
171
Page 1 of 1
WDRP Indicators
Health and Sanitation
Characteristics
172
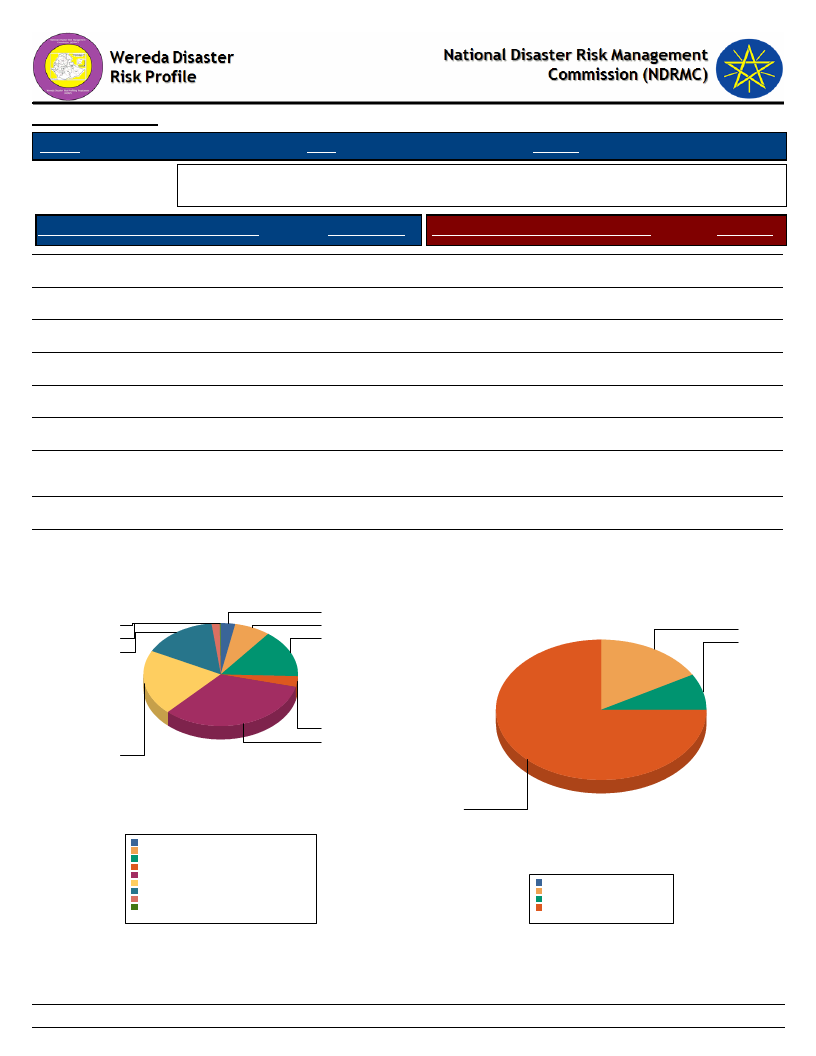
Data_Collected_Date
Region S.N.N.P
Zone GAMO GOFA
Tuesday, November 5, 2019
Wereda MIRAB ABAYA
Selected Indicator
Household Access to Health Facilities - Where do patients go for health care?
Constraints to adequate healthcare
Where do Patients Go for Healthcare
HH Response Constraints to Adequate Health Care
Response
Did not get Health Care
Central Hospital
Private hospital/clinic
Pharmacy
Traditional healer
District/Municipal hospital/health
centre/ clinic
Other public
Community health worker
3.12
3.40
7.65
1.70
16.15
0.28
33.99
21.25
15.58
No money for treatment costs
Don’t believe in health care
Health facilities are too distant
75.00
16.67
8.33
Where Do Patients go for Health care?
3
0
8
2
16
16
Constraints to Adequate Health Care
17
8
3
34
21
Central Hospital
Community health worker
Did not get Health Care
District/Municipal hospital/health centre/ clinic
Other public
Pharmacy
Private hospital/clinic
Traditional healer
3.0%
7.4%
15.1%
3.3%
33.0%
20.6%
15.7%
1.6%
0.3%
Total:
100.0%
75
Don’t believe in health care
Health facilities are too distant
No money for treatment costs
0.0%
16.7%
8.3%
75.0%
Total:
100.0%
173
Page 1 of 1
Data_Collected_Date
Region S.N.N.P
Zone GAMO GOFA
Tuesday, November 5, 2019
Wereda MIRAB ABAYA
Selected Indicator
Hazards: Health problems and changes over the last decade
Kebele Name
Health_Problems
Changes_In_Last_Decade
ALGAE
ANKOBER
DELBO
DOSHE
FARAOSA
FETELE
PURA
LAYO TERGA
MOLLE
MOREDA
KOLA BANENA
KOLA MULAT0
KORGA GERAMO
UGAYO
UMO LANTE
WANKE WAGEFO
WOYE BARENA
YAYEKE
ZALA GUTESHA
Good, but some times malaria happens due to water
logging in the community and settlement of the
community near Abaya lake
Good health condition
Good health condition
Typhoid, typhus, malaria which are caused by increasing
temperature and food shortage
Good, but some times malaria happens due to water
logging in the community
Good health condition
Good health condition
Good health condition
Good health condition but there is malaria caused by
water logging
Good health condition
Good health condition
Good health condition
Good health condition
Good health condition
Good health condition
Malaria, Typhus, Typhoid are present which are caused
by water logging, mosquito reproduction and lack of
environmental sanitation
Malaria, diarrhea are caused by lack of food
Good health condition
Good health condition
Decreased
Increased
Decreased
Decreased
Decreased
Decreased
174
Page 1 of 2

Data_Collected_Date
Region S.N.N.P
Zone GAMO GOFA
Tuesday, November 5, 2019
Wereda MIRAB ABAYA
Selected Indicator
Hazards: Health problems and changes over the last decade
Kebele Name
Health_Problems
Changes_In_Last_Decade
ZALA BARANA
Good health condition
175
Page 2 of 2
Wereda Disaster
Risk Profile
Data_Collected_Date
National Disaster Risk Management
Commission (NDRMC)
Tuesday, November 5, 2019
Region S.N.N.P
Zone GAMO GOFA
Wereda MIRAB ABAYA
Selected Indicator
Household Health Status - Households health condition and major health problems
Health Condition
HH Response Population Sickness
HH Response Children Sickness
HH Response
Good health
Ill for <3 months
Ill for more than three months
85.91
10.26
3.83
Chronic fever
Malaria
Diarrhea
Stomach pain
Asthma
Mental illness
Others
Headache
Pneumonia/ lung problem
Hyper tension
Eye problems
Back ache
HIV/AIDS
2.58
34.67
6.88
4.87
0.57
2.58
23.21
7.74
7.16
1.72
4.30
3.44
0.29
Chronic fever
Malaria
Diarrhea
Headache
Pneumonia/ lung problem
Others
3.92
43.14
17.65
1.96
19.61
13.73
176
Page 1 of 2
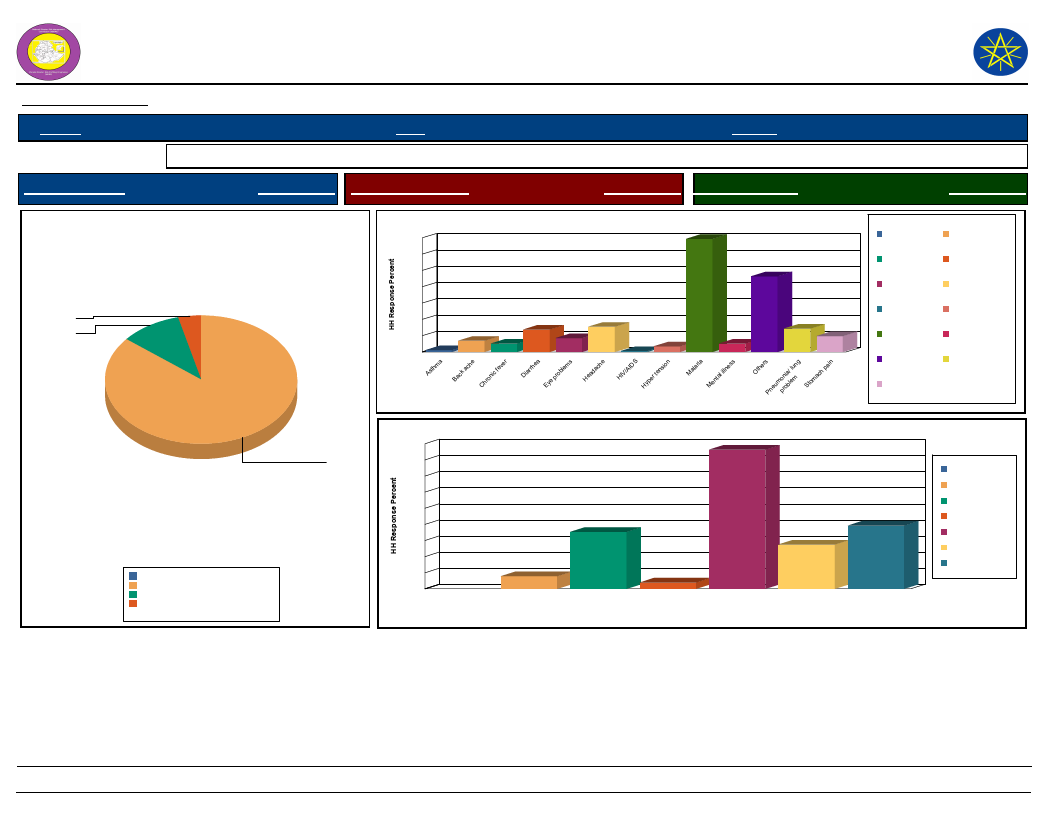
Wereda Disaster
Risk Profile
Data_Collected_Date
National Disaster Risk Management
Commission (NDRMC)
Tuesday, November 5, 2019
Region S.N.N.P
Zone GAMO GOFA
Wereda MIRAB ABAYA
Selected Indicator
Household Health Status - Households health condition and major health problems
Health Condition
HH Response Population Sickness
HH Response Children Sickness
HH Response
Health Condition of the Community
3.8
10.3
85.9
Good health
Ill for <3 months
Ill for more than three months
0.0%
85.9%
10.3%
3.8%
Total:
100.0%
Population Sickness in the Community
35
35
30
25
23
20
15
10
7
8
7
5
3
3
4
2
3
5
1
0
0
Population Sickness
Asthma
Chronic fever
Eye problems
HIV/AIDS
Malaria
Others
Stomach pain
Back ache
Diarrhea
Headache
Hyper tension
Mental illness
Pneumonia/ lung
problem
Children Sickness in the Community
45
43
40
35
30
25
20
18
15
10
5
4
2
20
14
Chronic fever
Diarrhea
Headache
Malaria
Others
Pneumonia/ lung
problem
0
Chronic fever
Diarrhea
Headache
Malaria
Others
Pneumonia/ lung
problem
Children Sickness
177
Page 2 of 2
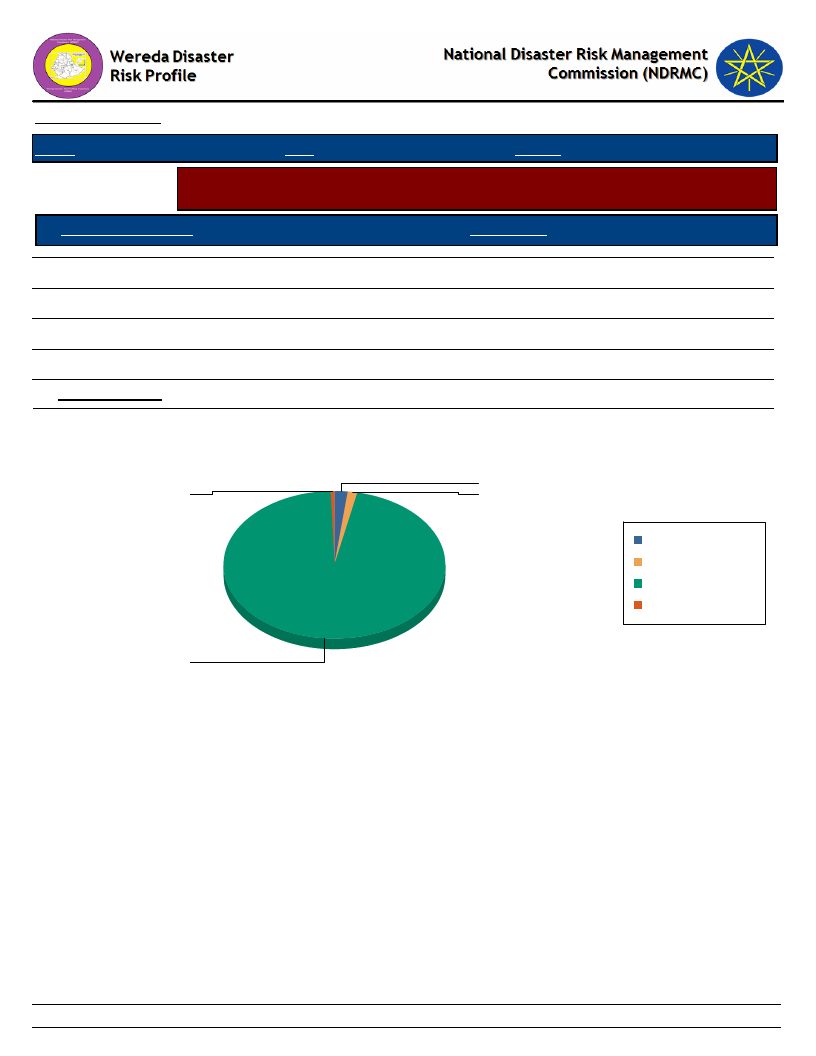
Data_Collected_Date
Tuesday, November 5, 2019
Region S.N.N.P
Zone GAMO GOFA
Wereda MIRAB ABAYA
Selected Indicator
Household Access to Sanitation - Percentage of households with access to
different kind of toilet facilities
Type of Toilet Facility
HH Response
Modern water closet
Ventilated, build in latrine
Outdoors latrine/hole on plot
No facilities/Open Space
HH Sharing Toilet
1.85
0.53
96.04
1.58
6.86
Household Responses to the type of toilet facilities in the community
1.9
0.5
1.6
Modern water closet
No facilities/Open Space
Outdoors latrine/hole on
plot
Ventilated, build in
latrine
96.0
178
Page 1 of 1
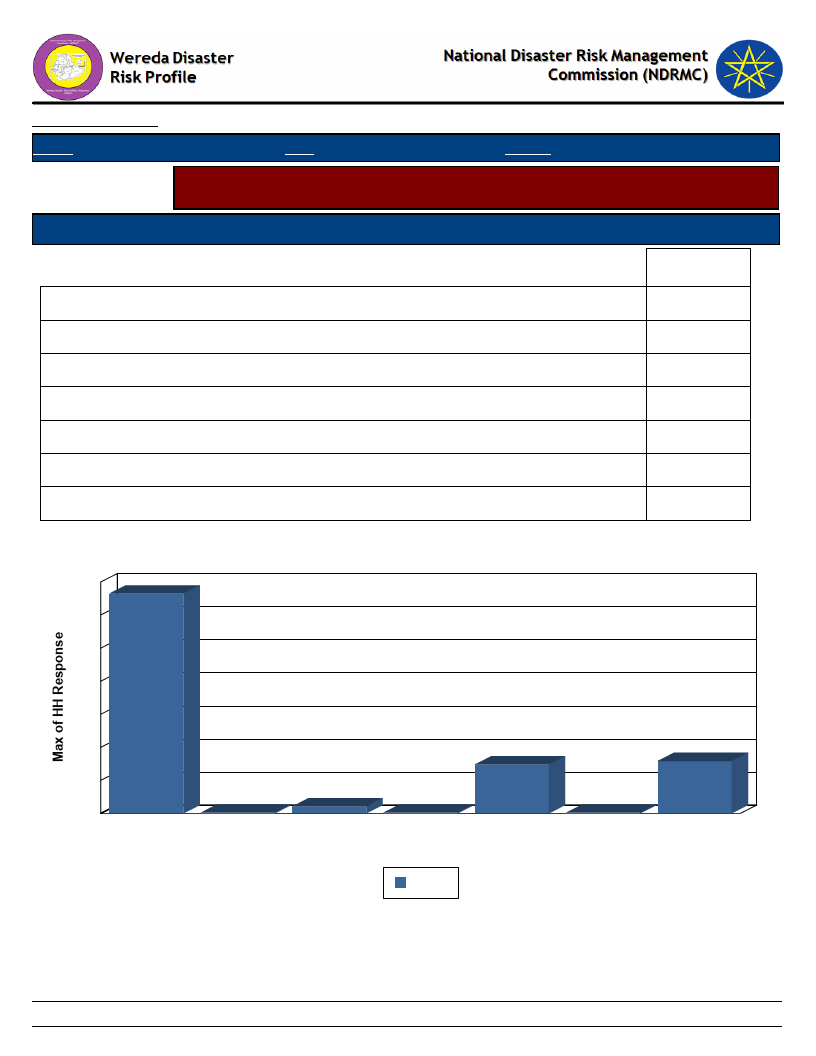
Data_Collected_Date
Region S.N.N.P
Zone GAMO GOFA
Tuesday, November 5, 2019
Wereda MIRAB ABAYA
Selected Indicator
Household Access to Drinking Water - Sources of drinking water for households
(response in %)
Sources of drinking water for Households
Priority of the Water Source
Main
Communal tap (Bono)
Covered well or borehole
Open well
Piped water into dwelling or plot
Piped water outside the house
Pond or lake (open access)
River, stream
66.49
0.26
2.11
0.26
14.78
0.26
15.83
Source of Drinking Water & Type of Source
70
66
60
50
40
30
20
10
0
Communal tap
(Bono)
0
Covered well
or borehole
15
16
2
Open well
0
Piped water
into dwelling or
plot
Piped water
outside the
house
Main
0
Pond or lake River, stream
(open access)
179
Page 1 of 1
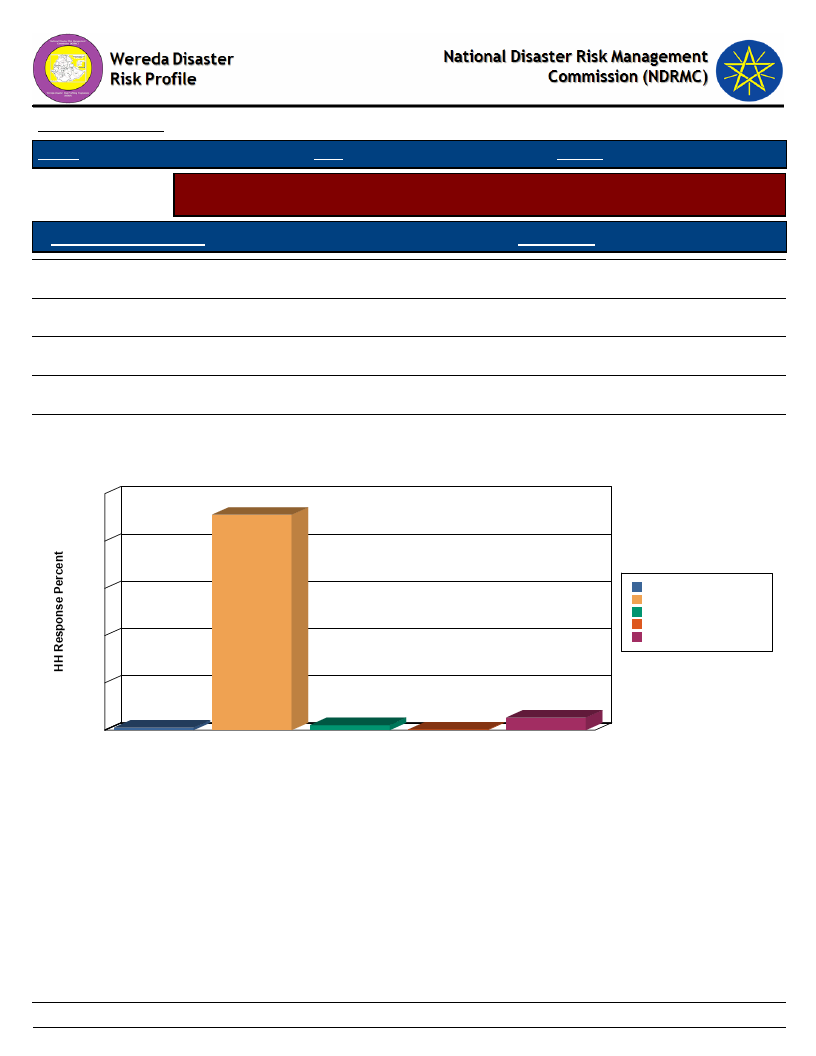
Data_Collected_Date
Region S.N.N.P
Zone GAMO GOFA
Wereda
Tuesday, November 5, 2019
MIRAB ABAYA
Selected Indicator
Household Access to Drinking Water - Households methods of treating drinking
water
Method of Treating Water
HH Response
Boil
1.07
Water Guard
5.36
Other chemicals
2.14
Other Method (specify)
0.27
None
91.15
Method of Treating Water by Households
100
91
80
60
Boil
None
Other chemicals
Other Method (specify)
40
Water Guard
20
1
0
Boil
None
2
0
Other chemicals
Other Method
(specify)
Water Treatment Method
5
Water Guard
180
Page 1 of 1
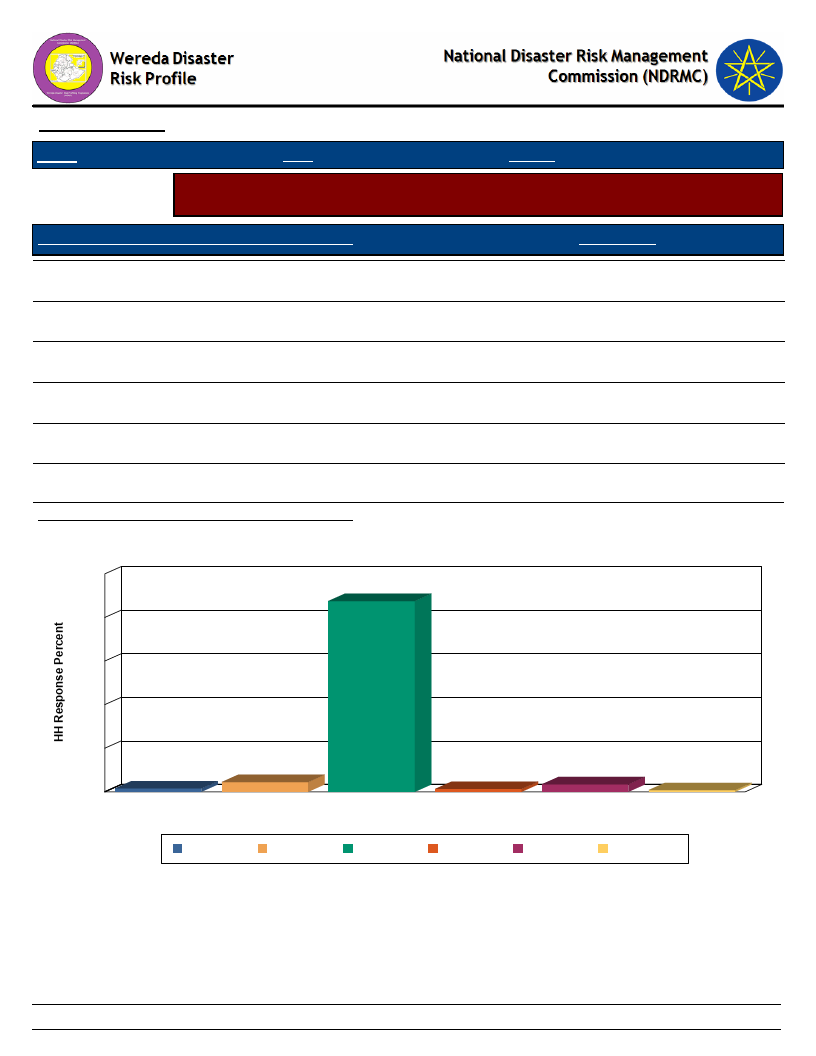
Data_Collected_Date
Tuesday, November 5, 2019
Region S.N.N.P
Zone GAMO GOFA
Wereda MIRAB ABAYA
Selected Indicator
Household Access to Drinking Water - Number of times households fetch water
in a week
Number of Times Households Fetch Water in a Week
HH Response
Twice
0.79
Three times
3.43
Four times
4.49
Five times
1.58
Six times
1.32
Seven times
Average Number of Times HH Fetch Water Per Week
Number of Times HH Fetch Water in a Week
100
88
80
87.60
6.92
60
40
20
2
0
Five times
4
1
3
Four times
Seven times
Six times
Three times
Number of Times HH Fetch Water in a Week
1
Twice
Five times
Four times
Seven times
Six times
Three times
Twice
181
Page 1 of 1
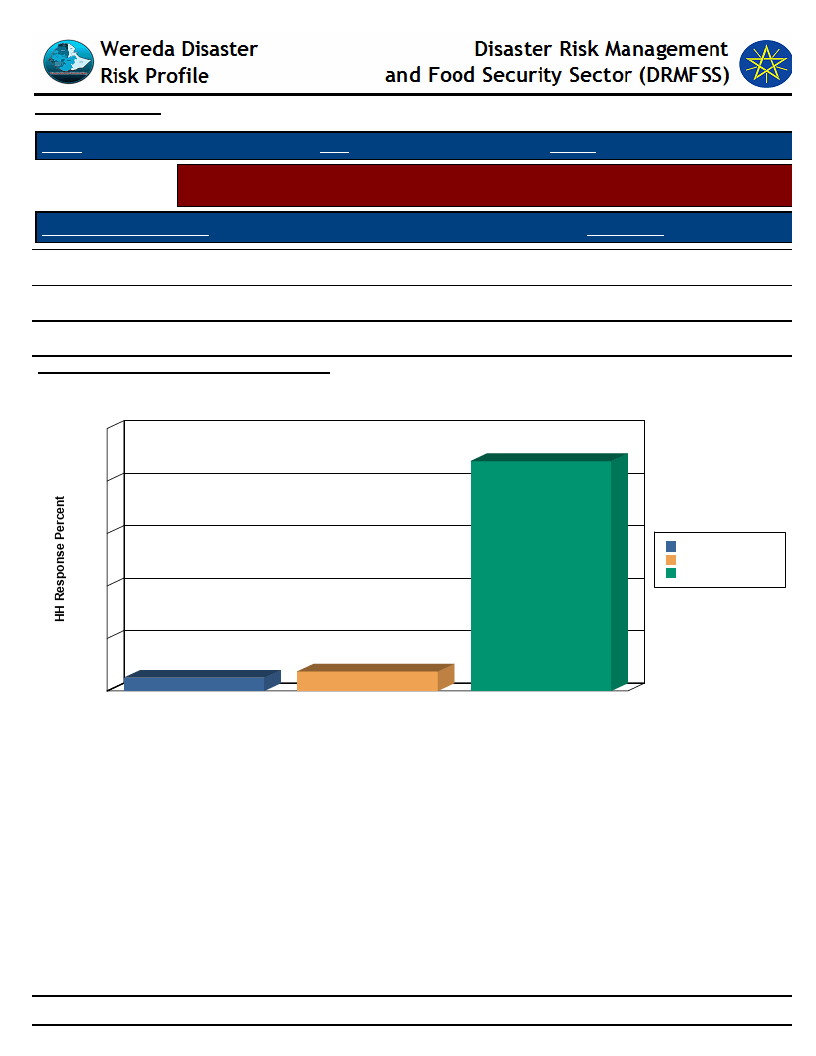
Data_Collected_Date
Tuesday, November 5, 2019
Region S.N.N.P
Zone GAMO GOFA
Wereda MIRAB ABAYA
Selected Indicator
Household Access to Drinking Water - Time taken per day to fetch water for
households
Time Taken To Fetch Water
HH Response
Less than 30 min
87.60
30 min - 1 hr
7.39
1 hr and Above
Average Number of Times Taken To Fetch Water
5.01
21.12
Time Taken To Fetch Water for the HH
100
88
80
60
1 hr and Above
30 min - 1 hr
Less than 30 min
40
20
7
5
0
1 hr and Above
30 min - 1 hr
Less than 30 min
Time Taken To Fetch Water
182
Page 1 of 1

5, 2019
in
e 1 of 1
183
WDRP Indicators
Coping Mechanisms and
Preparedness
184

Wereda Disaster Risk
Profile
Data_Collected_Date
Region S.N.N.P
Zone GAMO GOFA
Selected Indicator
KebeleName
Capacity: Community Preparedness against Sudden Onset Disasters
Precaution_1
Comment_1
Precaution_2
ALGAE
ANKOBER
DELBO
DOSHE
FARAOSA
FETELE
Evacuate people
Preparedness
measure have been
taken
Evacuate
Helping one another
Reporting to formal
and informal
institution
Inform to government
Report to
government
institution
Temporary
migration
Reporting to
formal institution
Preparedness
actions,
evacuation,
construction
Evacuate people
Readiness
PURA
Evacuation/temporar
y displaced from the
area of disaster
Announcement to
all community
household
members
National Disaster Risk Management
Commission (NDRMC)
Tuesday, November 5, 2019
Wereda MIRAB ABAYA
Comment_2
Precaution_3
Active
community
participation
Reporting to
local
administration
Preparedness
Comment_3
Active
community
participation
Evacuation
Inform
government
and non
governmental
institution
185
Page 1 of 3

Wereda Disaster Risk
Profile
Data_Collected_Date
Region S.N.N.P
Zone GAMO GOFA
National Disaster Risk Management
Commission (NDRMC)
Tuesday, November 5, 2019
Wereda MIRAB ABAYA
Selected Indicator
Capacity: Community Preparedness against Sudden Onset Disasters
KebeleName
LAYO TERGA
Precaution_1
For flood, soil and
water conservation
Comment_1
MOLLE
MOREDA
KOLA BANENA
Reporting to formal
and informal
institutions
Temporary
evacuation
Evacuation people
KOLA MULAT0
KORGA GERAMO
UGAYO
Evacuation
Preparedness actions
have been taken.
Readiness
UMO LANTE
Evacuation
Precaution_2
Reporting to
formal and
informal
institutions
Evacuate peoples
Comment_2
Preparedness
actions have been
taken
Report to
government
institutions
Introducing
government aid
Evacuation
Reporting to
formal and
informal institution
Preparedness
actions have been
taken
Precaution_3
Evacuation
Comment_3
Active
community
participation
Report to local
administration
Active
participation of
community
To reduce
disaster effect
Report to local
administrative
body
Active
participation of
community
Report to local
administration
186
Page 2 of 3

Wereda Disaster Risk
Profile
Data_Collected_Date
Region S.N.N.P
Zone GAMO GOFA
National Disaster Risk Management
Commission (NDRMC)
Tuesday, November 5, 2019
Wereda MIRAB ABAYA
Selected Indicator
KebeleName
Capacity: Community Preparedness against Sudden Onset Disasters
Precaution_1
Comment_1
Precaution_2
Comment_2
Precaution_3
Comment_3
WANKE WAGEFO
WOYE BARENA
Well
oriented/informed
Evacuate people
YAYEKE
ZALA GUTESHA
ZALA BARANA
Preparedness actions
have been taken
Prepare community
Evacuation from
sudden onset disaster
Reporting to
formal and
informal institution
Displacement to
other area
Evacuation
Reporting to
government
Awareness creation
Always
ready/hardwor
king
Inform to
government
body
Report to local
administration
Collection of
crop products
Report to
kebele
administration
187
Page 3 of 3

Wereda Disaster
Risk Profile
National Disaster Risk Management
Commission (NDRMC)
Data_Collected_Date
Region S.N.N.P
Zone GAMO GOFA
Wereda MIRAB ABAYA
Tuesday, November 5, 2019
Selected Indicator
Capacity: Community Preparedness against Increase in Disaster Intensity
KebeleName
Precaution_1
Comment_1
Precaution_2
Comment_2
Precaution_3
Comment_3
ALGAE
ANKOBER
DELBO
DOSHE
FARAOSA
Displacement of
people
Soil and water
conservation
Displacement from
the area
Saving of product
Displacement
FETELE
PURA
Isolation
Displacement
Area closure
Temporary
migration
Area closure
Job opportunity
Area closure
Shifting from
livestock to other
income generating
activities
Area closure
Shifting from
livestock
Care for
environmental
resource
Shifting to
other income
generating
activities
Follow up
current
information
about disaster
Shifting from
livestock to
other income
generating
activities
Isolation
188
Page 1 of 3

Wereda Disaster
Risk Profile
Data_Collected_Date
Region S.N.N.P
Zone GAMO GOFA
National Disaster Risk Management
Commission (NDRMC)
Tuesday, November 5, 2019
Wereda MIRAB ABAYA
Selected Indicator
Capacity: Community Preparedness against Increase in Disaster Intensity
KebeleName
Precaution_1
Comment_1
Precaution_2
Comment_2
Precaution_3
Comment_3
LAYO TERGA
MOLLE
Displacement of
the community
Displacement
MOREDA
KOLA BANENA
Temporary
migration
Displacement
Shifting the
community
Area closure
Make afforestation,
soil and water
conservation
activities
Area closure
Shifting from
livestock to
other income
generating
activities
KOLA MULAT0
KORGA GERAMO
UGAYO
Displacement of
the community
Soil and water
conservation
activities
Evacuation
Area closure
Temporary
migration
Area closure
Isolation
Natural
resource
conservation
Saving
UMO LANTE
Temporary
migration.
For income gain,
handling of better
income.
Making of
afforestation
action, soil and
water conservation
activity.
To prevent the
hazard.
Keeping of
environmental
resource.
Because of safe
farm land.
189
Page 2 of 3
Wereda Disaster
Risk Profile
National Disaster Risk Management
Commission (NDRMC)
Data_Collected_Date
Region S.N.N.P
Zone GAMO GOFA
Wereda MIRAB ABAYA
Tuesday, November 5, 2019
Selected Indicator
Capacity: Community Preparedness against Increase in Disaster Intensity
KebeleName
Precaution_1
Comment_1
Precaution_2
Comment_2
Precaution_3
Comment_3
WANKE WAGEFO
WOYE BARENA
YAYEKE
ZALA GUTESHA
ZALA BARANA
Temporary
displacement of
the community.
Inform to formal
or informal to
government
structure.
Soil and water
conservation
activities should
have done.
Evacuation.
To protect the
house hold from the
disater, to save life
and property.
Area closure.
If the disater will
happen for supply
of humantirian aid.
Water harvesting
structure develop.
Preventive measure
of disaster.
Temporary
migration.
To save life.
Free closure.
eEnset plantation.
To drought
tolerance.
Saving of product.
To protect the
community by
rehabilitation.
To constructive
measure.
Selling
animals/save
agricultural
/crop
production.
Storage of
fodder, ahy,
silage.
To feed the
family and
incrase income.
To save
animals,
drought season.
To holding of safe
environment.
Rehabilitation.
To prevent disasters.
Care of
environmental
resource.
Isolation.
Buying of grain.
To accelearte
the safe
environmental
conditons.
If the disaster
will be livetock
disease isolation
is best choise.
To
preparedness.
190
Page 3 of 3

Wereda Disaster
Risk Profile
Data_Collected_Date
Region S.N.N.P
Zone
GAMO GOFA
Selected Indicator
Capacity: Community Preparedness against Disasters
Kebele Name
Precaution 1
Comment 1
Precaution 2
ALGAE
Creation of
awareness
Giving education,
distribute pamphlets
Well oriented
ANKOBER
DELBO
Saving products
and money
To mitigate drought
season
Awareness creation
Awareness
creation about
early warning
system
Readiness
DOSHE
FARAOSA
FETELE
PURA
Selling products,
selling animal and
buying grain
Awareness creation
To mitigate drought
effect
Awareness creation
Awareness
creation on
early warning
Strength early
warning system
Planning ahead
Awareness creation
Active
participation on
people on DRR
and response
191
National Disaster Risk Management
Commission (NDRMC)
Tuesday, November 5, 2019
Wereda MIRAB ABAYA
Comment 2
Focus on
updated
metrological
data
Precaution 3
Saving agricultural
production
Comment 3
Reporting to local
administration
To mitigate
future disaster
Actively
participate in issue
of development
activity
Report to upper
administrative
body
Saving agricultural
production
Reactive and
active community
participation
Page 1 of 3

Wereda Disaster
Risk Profile
Data_Collected_Date
Region S.N.N.P
Zone
GAMO GOFA
Selected Indicator
Capacity: Community Preparedness against Disasters
Kebele Name
Precaution 1
Comment 1
Precaution 2
LAYO TERGA
MOLLE
MOREDA
KOLA BANENA
KOLA MULAT0
Active
participation of
community in DRR
Awareness creation
Saving produce
Distribution of
pamphlets, giving
education
Awareness creation
Early warning
Giving education,
distribute
pamphlets/promotion
work
KORGA GERAMO
Saving produce
UGAYO
Preparedness
To mitigate drought
effect
Timely response
Good early
warning
Form informal
association
Early warning
Active
participation of
people on DRR
Awareness
creation on
early warning
Active response
UMO LANTE
Saving products
WANKE WAGEFO
Avoid weakness
Make informal
associations.
Skill
development
192
National Disaster Risk Management
Commission (NDRMC)
Tuesday, November 5, 2019
Wereda MIRAB ABAYA
Comment 2
Precaution 3
Participatory
Comment 3
Saving agricultural
production
Awareness creation
on disaster
Saving agricultural
production.
Reporting to local
administration
Awareness creation
on disaster
Page 2 of 3

Wereda Disaster
Risk Profile
Data_Collected_Date
Region S.N.N.P
Zone
GAMO GOFA
Selected Indicator
Capacity: Community Preparedness against Disasters
Kebele Name
Precaution 1
Comment 1
Precaution 2
WOYE BARENA
YAYEKE
ZALA GUTESHA
ZALA BARANA
Saving product
Saving product
Preparedness
Saving production
To mitigate drought
effect
Make alternative
jobs
Awareness
creation on
early warning
Awareness
creation
Searching
alternative
activity
National Disaster Risk Management
Commission (NDRMC)
Tuesday, November 5, 2019
Wereda MIRAB ABAYA
Comment 2
Precaution 3
Soil and water
conservation
Reporting to local
administration
Comment 3
193
Page 3 of 3

Wereda Disaster
Risk Profile
Data_Collected_Date
Region S.N.N.P
Zone
GAMO GOFA
National Disaster Risk Management
Commission (NDRMC)
Tuesday, November 5, 2019
Wereda MIRAB ABAYA
Selected Indicator
Kebele Name
Hazard: Coping and recovering during last Disaster
ALGAE
Type of Disaster(s)
Coping_Strategy
Drought and flood
Medical treatment, soil and water conservation
Description
Isolate affected livestock form healthy one, plantation, afforstation, sufficient medical treatment
Recovery_Strategy
Change the course of river, soil and water conservation, water harvesting structure/pond
Description
Community
Participation_Ways
Description
Both biophysical and physical soil structure, excavation of pond.
Sharing inputs
Labor, money, resource sharing.
Kebele Name
Type of Disaster(s)
Coping_Strategy
Description
Recovery_Strategy
Description
Community
Participation_Ways
Description
ANKOBER
Drought and livestock diseases
Migration, labour, unusual selling of animals, harvesting fire wood, grass, selling charcoal
Isolation of animals, evacuation, loan taken, saving products.
Free work sharing, contributing money, constructing house
194
Page 1 of 10

Wereda Disaster
Risk Profile
Data_Collected_Date
Region S.N.N.P
Zone
GAMO GOFA
Selected Indicator
Kebele Name
Hazard: Coping and recovering during last Disaster
DELBO
Type of Disaster(s)
Coping_Strategy
Drought
Sharing resource, helping the poor, get aid from government
Description
Recovery_Strategy
Re-cultivate their land for future
Description
Community
Participation_Ways
Description
Activity participate in community development activity
National Disaster Risk Management
Commission (NDRMC)
Tuesday, November 5, 2019
Wereda MIRAB ABAYA
Kebele Name
Type of Disaster(s)
Coping_Strategy
Description
Recovery_Strategy
Description
Community
Participation_Ways
Description
DOSHE
Drought
Selling animal, unusual harvesting of fire wood, grass, charcoal, relief gain, money for work/PSNP
Animal husbandry, loan, petty trading, temporary migration
Sharing work, house construction, contribution of money, helping each other
195
Page 2 of 10

Wereda Disaster
Risk Profile
Data_Collected_Date
Region S.N.N.P
Zone
GAMO GOFA
Selected Indicator
Kebele Name
Hazard: Coping and recovering during last Disaster
FARAOSA
Type of Disaster(s)
Coping_Strategy
Drought
Provide loan
Description
Recovery_Strategy
Labour
Description
Community
Participation_Ways
Description
Sharing inputs with each other
Kebele Name
Type of Disaster(s)
Coping_Strategy
Description
Recovery_Strategy
Description
Community
Participation_Ways
Description
FETELE
Drought
Active participation on sharing of resources
Cerate awareness
Sharing of resource like money, labour
196
National Disaster Risk Management
Commission (NDRMC)
Tuesday, November 5, 2019
Wereda MIRAB ABAYA
Page 3 of 10

Wereda Disaster
Risk Profile
Data_Collected_Date
Region S.N.N.P
Zone
GAMO GOFA
Selected Indicator
Kebele Name
Hazard: Coping and recovering during last Disaster
KOLA BANENA
Type of Disaster(s)
Coping_Strategy
Drought
Medical treatment, soil and water conservation.
Description
Recovery_Strategy
Soil and water conservation, construction, evacuation
Description
Community
Participation_Ways
Description
Sharing input
Kebele Name
Type of Disaster(s)
Coping_Strategy
Description
Recovery_Strategy
Description
Community
Participation_Ways
Description
KOLA MULAT0
Drought
Active community participation, mitigate
Good
Soil and water conservation
Medium
Social interaction, sharing resource, active community participation
Good.
197
National Disaster Risk Management
Commission (NDRMC)
Tuesday, November 5, 2019
Wereda MIRAB ABAYA
Page 4 of 10

Wereda Disaster
Risk Profile
Data_Collected_Date
Region S.N.N.P
Zone
GAMO GOFA
Selected Indicator
Kebele Name
Hazard: Coping and recovering during last Disaster
KORGA GERAMO
National Disaster Risk Management
Commission (NDRMC)
Tuesday, November 5, 2019
Wereda MIRAB ABAYA
Type of Disaster(s)
Coping_Strategy
Flood
Migration, labour, selling of livestock, harvesting wood and grass, harvesting fruit, relief gain
Description
Recovery_Strategy
Isolation of animals, evacuation, saving product, labour
Description
Community
Participation_Ways
Description
Labour sharing, contribution of money, house construction.
Kebele Name
Type of Disaster(s)
Coping_Strategy
Description
Recovery_Strategy
Description
Community
Participation_Ways
Description
LAYO TERGA
Drought, crop disease
Re-cultivation, soil and water conservation
Selling livestock and buying food, labour work
Effective
Sharing resource, working in group, Debo
Effective
198
Page 5 of 10

Wereda Disaster
Risk Profile
Data_Collected_Date
Region S.N.N.P
Zone
GAMO GOFA
Selected Indicator
Kebele Name
Hazard: Coping and recovering during last Disaster
MOLLE
Type of Disaster(s)
Coping_Strategy
Drought
Taking loans
Description
Positive
Recovery_Strategy
Labour
Description
Community
Participation_Ways
Description
Positive
Sharing inputs
Positive
Kebele Name
Type of Disaster(s)
Coping_Strategy
Description
Recovery_Strategy
Description
Community
Participation_Ways
Description
MOREDA
Drought
Labour, unusual selling of fire wood and grass, temporary migration
Saving product, contribution of grain
By sharing grain, contributing money
199
National Disaster Risk Management
Commission (NDRMC)
Tuesday, November 5, 2019
Wereda MIRAB ABAYA
Page 6 of 10

Wereda Disaster
Risk Profile
Data_Collected_Date
Region S.N.N.P
Zone
GAMO GOFA
Selected Indicator
Kebele Name
Hazard: Coping and recovering during last Disaster
PURA
Type of Disaster(s)
Coping_Strategy
Drought
Active participation of the community, sharing resource
Description
Recovery_Strategy
Labour work and support from others
Description
Community
Participation_Ways
Description
Social interaction, create awareness, planning
Kebele Name
Type of Disaster(s)
Coping_Strategy
Description
Recovery_Strategy
Description
Community
Participation_Ways
Description
UGAYO
Livestock disease, crop disease, drought
They search for another job, governmental aid.
Rehabilitate or compensate yield loss
Sharing resources
200
National Disaster Risk Management
Commission (NDRMC)
Tuesday, November 5, 2019
Wereda MIRAB ABAYA
Page 7 of 10

Wereda Disaster
Risk Profile
Data_Collected_Date
Region S.N.N.P
Zone
GAMO GOFA
Selected Indicator
Kebele Name
Hazard: Coping and recovering during last Disaster
UMO LANTE
Type of Disaster(s)
Coping_Strategy
Drought
labour, sell fire wood and grass
Description
Recovery_Strategy
Saving product
Description
Community
Participation_Ways
Description
Contribution of money, sharing grain, preparing job opportunity
Kebele Name
Type of Disaster(s)
Coping_Strategy
Description
Recovery_Strategy
Description
Community
Participation_Ways
Description
WANKE WAGEFO
Flood
Community participation
Good
Sharing resources
Good
Sharing money or food to affected household
Good
201
National Disaster Risk Management
Commission (NDRMC)
Tuesday, November 5, 2019
Wereda MIRAB ABAYA
Page 8 of 10
Wereda Disaster
Risk Profile
Data_Collected_Date
Region S.N.N.P
Zone
GAMO GOFA
Selected Indicator
Kebele Name
Hazard: Coping and recovering during last Disaster
WOYE BARENA
Type of Disaster(s)
Coping_Strategy
Drought
Description
Recovery_Strategy
Description
Community
Participation_Ways
Description
Aid, and money.
National Disaster Risk Management
Commission (NDRMC)
Tuesday, November 5, 2019
Wereda MIRAB ABAYA
Kebele Name
Type of Disaster(s)
Coping_Strategy
Description
Recovery_Strategy
Description
Community
Participation_Ways
Description
YAYEKE
Drought
Migration, labour, unusual selling of fire wood and grass, selling of charcoal, relief gain from government.
Evacuation, saving production, labour, isolation of livestock
Free work sharing, contribution of money, construction of house
202
Page 9 of 10

Wereda Disaster
Risk Profile
Data_Collected_Date
Region S.N.N.P
Zone
GAMO GOFA
Selected Indicator
Kebele Name
Hazard: Coping and recovering during last Disaster
ZALA BARANA
Type of Disaster(s)
Coping_Strategy
Drought
Harvesting wood grass, labour, relief gain
Description
Recovery_Strategy
Helping each other through Edir
Description
Community
Participation_Ways
Description
Sharing food item and money, cultivation of land, construction of houses
Kebele Name
Type of Disaster(s)
Coping_Strategy
Description
Recovery_Strategy
Description
Community
Participation_Ways
Description
ZALA GUTESHA
Drought
Sharing resource, actively participate in social activity, reporting
Planting trees, saving, soil and water conservation
Sharing different activities
203
National Disaster Risk Management
Commission (NDRMC)
Tuesday, November 5, 2019
Wereda MIRAB ABAYA
Page 10 of 10
Data_Collected_Date
Region S.N.N.P
Zone GAMO GOFA
Selected Indicator
Capacity: Type Community Participation
Kebele Name
Levels_Comm_Participation
ALGAE
ANKOBER
DELBO
Good
Good
Good
DOSHE
FARAOSA
FETELE
PURA
LAYO TERGA
MOLLE
MOREDA
KOLA BANENA
KOLA MULAT0
KORGA GERAMO
UGAYO
UMO LANTE
WANKE WAGEFO
WOYE BARENA
YAYEKE
ZALA GUTESHA
ZALA BARANA
Good
Good
Good
Good
Good
Good
Good
Good
Good
Good
Good
Good
Good
Good
Good
Good
Good
204
Tuesday, November 5, 2019
Wereda MIRAB ABAYA
Changes_In_Last_Decade
Increased
Increased
Cooperation and participation on the
development activities increasing.
Increased
Increased
Increasing
Increasing
Increasing
Increased
Increased
Increased
Increasing
Increased
Increasing
Increased
Increased
Increased
Increased
Increasing
No change
Page 1 of 1
Data_Collected_Date
Region S.N.N.P
Zone GAMO GOFA
Tuesday, November 5, 2019
Wereda MIRAB ABAYA
Selected Indicator
Capacity: Recovery from Losses from Disasters - Percentage of Households who
have managed to recover from losses of disasters
Percentage of households who have managed to recover from losses of disasters
Comments
47.45 %
205
Page 1 of 1

Wereda Disaster
Risk Profile
National Disaster Risk Management
Commission (NDRMC)
Data_Collected_Date
Region S.N.N.P
Zone GAMO GOFA
Wereda MIRAB ABAYA
Tuesday, November 5, 2019
Selected Indicator
Capacity: Coping Strategies Adopted by Households - Main coping strategies adopted by households to recover
from respective losses
Type of Coping Strategy Adopted
Type of Loss
Borrowing of food or cash
(including purchasing food on
credit)
Collection of wild food
Consumption rather than sale
of crop surplus
Increased working hours
206
Page 1 of 5
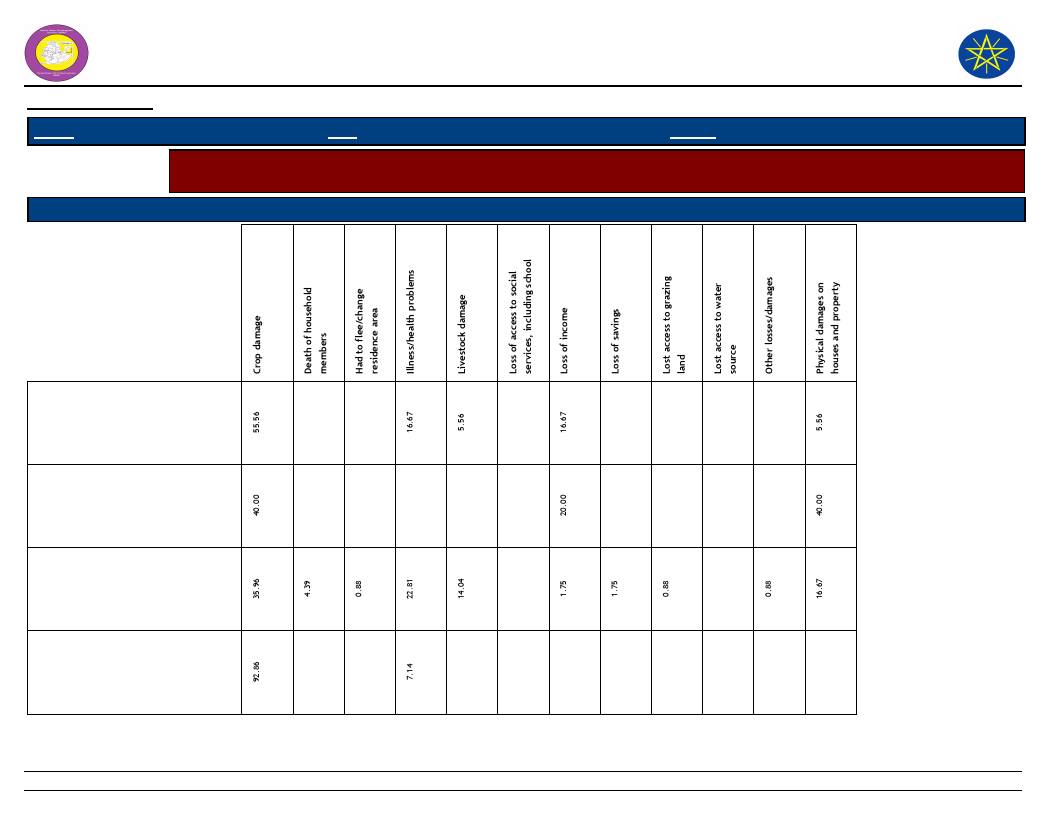
Wereda Disaster
Risk Profile
National Disaster Risk Management
Commission (NDRMC)
Data_Collected_Date
Region S.N.N.P
Zone GAMO GOFA
Wereda MIRAB ABAYA
Tuesday, November 5, 2019
Selected Indicator
Capacity: Coping Strategies Adopted by Households - Main coping strategies adopted by households to recover
from respective losses
Type of Coping Strategy Adopted
Type of Loss
Limit portion size at meals
Long-term / permanent
migration (including distress
migration of whole families)
Others -
Reduce number of meals eaten
in a day
207
Page 2 of 5
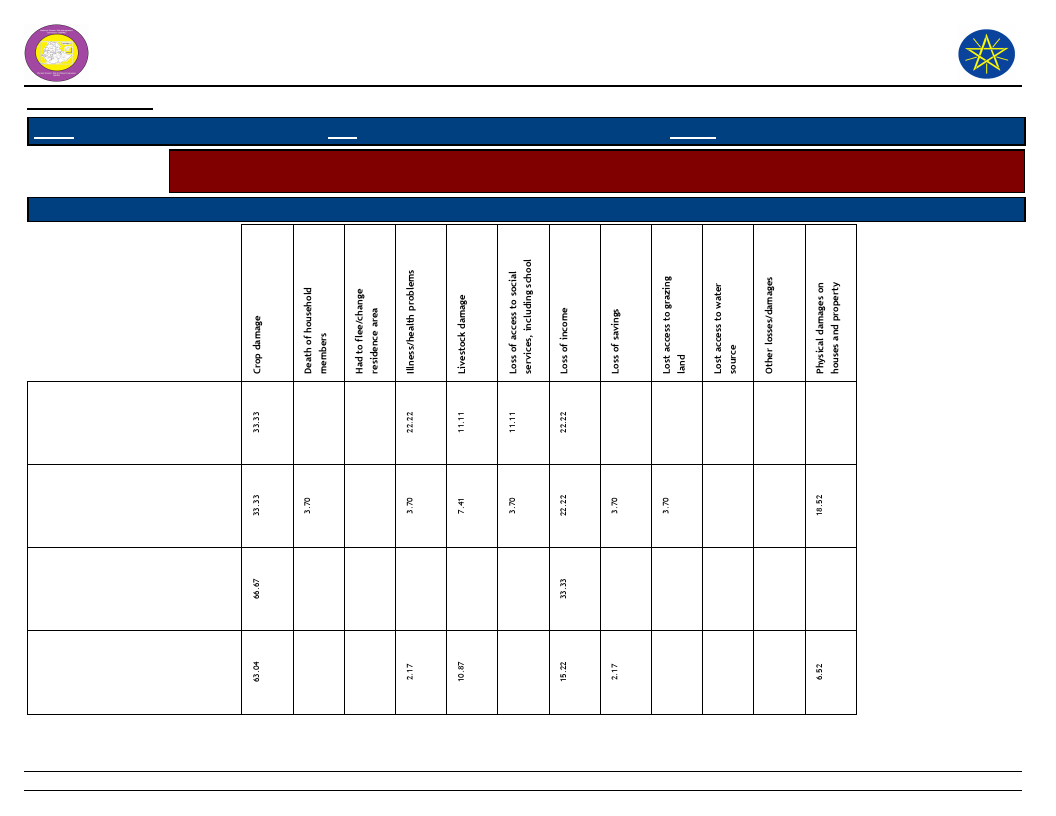
Wereda Disaster
Risk Profile
National Disaster Risk Management
Commission (NDRMC)
Data_Collected_Date
Region S.N.N.P
Zone GAMO GOFA
Wereda MIRAB ABAYA
Tuesday, November 5, 2019
Selected Indicator
Capacity: Coping Strategies Adopted by Households - Main coping strategies adopted by households to recover
from respective losses
Type of Coping Strategy Adopted
Type of Loss
Reduced expenditure on health
and education (including taking
children out of school)
Reduced expenditure on
non-essential items (beer,
cigarettes, clothes, meat, etc.)
Reduced expenditure on
productive inputs (fertilizer,
seeds, livestock drugs, etc.)
Rely on less preferred and less
expensive food
208
Page 3 of 5

Wereda Disaster
Risk Profile
National Disaster Risk Management
Commission (NDRMC)
Data_Collected_Date
Region S.N.N.P
Zone GAMO GOFA
Wereda MIRAB ABAYA
Tuesday, November 5, 2019
Selected Indicator
Capacity: Coping Strategies Adopted by Households - Main coping strategies adopted by households to recover
from respective losses
Type of Coping Strategy Adopted
Type of Loss
Restrict consumption by adults
in order for small children to
eat
Sale of non-productive assets
(Jewelry, clothing, etc.)
Seek alternative or additional
jobs
Sell more livestock than usual
209
Page 4 of 5
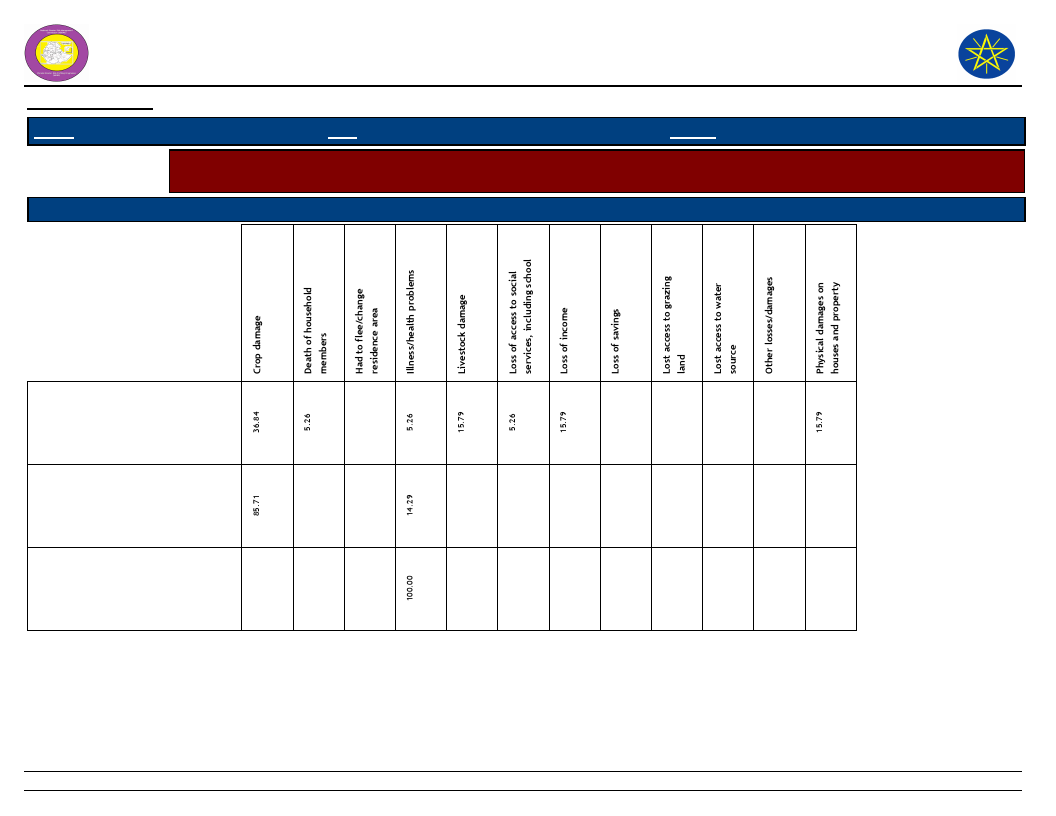
Wereda Disaster
Risk Profile
National Disaster Risk Management
Commission (NDRMC)
Data_Collected_Date
Region S.N.N.P
Zone GAMO GOFA
Wereda MIRAB ABAYA
Tuesday, November 5, 2019
Selected Indicator
Capacity: Coping Strategies Adopted by Households - Main coping strategies adopted by households to recover
from respective losses
Type of Coping Strategy Adopted
Type of Loss
Sending children of household
for work
Short-term / seasonal labor
migration
Skip entire day without eating
210
Page 5 of 5

Data_Collected_Date
Region S.N.N.P
Zone GAMO GOFA
Tuesday, November 5, 2019
Wereda MIRAB ABAYA
Selected Indicator
Capacity: Coping Strategies Adopted by Households - Percentage of households
by frequency of main coping strategies adopted
Type of Coping Strategy Adopted
Frequency of Adoption
Borrowing of food or cash (including purchasing
food on credit)
Collection of wild food
Consumption rather than sale of crop surplus
Increased working hours
Limit portion size at meals
Long-term / permanent migration (including
distress migration of whole families)
Others -
Reduce number of meals eaten in a day
Reduced expenditure on health and education
(including taking children out of school)
Reduced expenditure on non-essential items
(beer, cigarettes, clothes, meat, etc.)
Reduced expenditure on productive inputs
(fertilizer, seeds, livestock drugs, etc.)
Rely on less preferred and less expensive food
35.48
12.90
51.61
100.00
3.25
20.33
73.17
3.25
10.00
20.00
70.00
33.33
22.22
11.11
33.33
40.00
40.00
20.00
34.19
35.04
27.35
3.42
61.54
30.77
7.69
22.22
77.78
11.11
37.04
18.52
33.33
33.33
66.67
17.78
51.11
13.33
17.78
211
Page 1 of 2
Data_Collected_Date
Region S.N.N.P
Zone GAMO GOFA
Tuesday, November 5, 2019
Wereda MIRAB ABAYA
Selected Indicator
Capacity: Coping Strategies Adopted by Households - Percentage of households
by frequency of main coping strategies adopted
Type of Coping Strategy Adopted
Frequency of Adoption
Restrict consumption by adults in order for small
children to eat
Sale of non-productive assets (Jewelry, clothing,
etc.)
Seek alternative or additional jobs
Sell more livestock than usual
Sending children of household for work
Short-term / seasonal labor migration
Skip entire day without eating
50.00
50.00
33.33
66.67
2.94
38.24
11.76
42.65
4.41
6.33
25.32
67.09
1.27
5.26
15.79
31.58
47.37
71.43
14.29
14.29
100.00
212
Page 2 of 2

Wereda Disaster
Risk Profile
Data_Collected_Date
National Disaster Risk Management
Commission (NDRMC)
Tuesday, November 5, 2019
Region S.N.N.P
Zone GAMO GOFA
Wereda MIRAB ABAYA
Selected Indicator
Kebele Name
ALGAE
ANKOBER
DELBO
DOSHE
FARAOSA
FETELE
PURA
LAYO TERGA
MOLLE
MOREDA
KOLA BANENA
Capacity: Alternative Livelihood Sources - Alternative livelihood sources suggested by the community
Work_Option_1
Comment_1
Work_Option_2
Comment_2
Work_Option_3
Weaving
Taking credit for
small business
Labour work
Market accessibility,
work opportunity for
others
To generate income
Fishing
opportunity near
to lake Abaya
Petty trade
Lobar Work
Metal and wood
work
Bee keeping
Petty trade
Labour work
Labour
Lack of other job
opportunities.
Labour
Labour
Labour
Vegetable
production
Weaving
To generate income
Lack of other job
opportunities
Market accessibility
Fishing
Evacuation/migra
tion
To Addis Ababa specially
youth.
Shifting primary
income
generating
activities.
Aid
Chat production
Labour
Accessibility of
investment
Fattening
Comment_3
Access to
labour market
213
Page 1 of 2
Wereda Disaster
Risk Profile
Data_Collected_Date
National Disaster Risk Management
Commission (NDRMC)
Tuesday, November 5, 2019
Region S.N.N.P
Zone GAMO GOFA
Wereda MIRAB ABAYA
Selected Indicator
Kebele Name
KOLA MULAT0
KORGA GERAMO
UGAYO
UMO LANTE
WANKE WAGEFO
WOYE BARENA
YAYEKE
ZALA GUTESHA
ZALA BARANA
Capacity: Alternative Livelihood Sources - Alternative livelihood sources suggested by the community
Work_Option_1
Shifting
cultivation to
livestock
production
/fattening
Mineral
production
Shifting to mixed
agriculture.
Petty trade
Labour
Labour
Vegetable
production
Petty trade
Animal fattening
Comment_1
To increase income
To generate income
Work_Option_2
Trade
Beekeeping
Labour
Fishing
Trade
Weaving
Petty trade
Labour
Petty trade
Comment_2
To generate income
Work_Option_3
Fishing
Petty trade
Weaving
Weaving
Fishing
Animal husbandry
Fishing
Saving
Comment_3
To
rehabilitation
214
Page 2 of 2
Data_Collected_Date
Region S.N.N.P
Zone GAMO GOFA
Tuesday, November 5, 2019
Wereda MIRAB ABAYA
Selected Indicator
Type of Disaster
Capacity: Recovery from Losses from Disasters - Percentage of households
recovered from past disasters by type of Disasters
Recovered Percentage
Drought
39.08
Flood
12.62
Landslide
2.15
Crop diseases
7.08
Livestock diseases
19.38
Human diseases
13.85
Storms / hail storm
0.62
Heavy Rain
0.62
Frost / Cold waves
0.31
Heat waves/ High temp
1.54
Conflicts
0.62
Economic / Price shock
1.54
Road Accident
0.62
215
Page 1 of 1
Data_Collected_Date
Region S.N.N.P
Zone GAMO GOFA
Tuesday, November 5, 2019
Wereda MIRAB ABAYA
Selected Indicator:
Capacity: Recovery from Losses from Disasters - Proportion of households
recovered by type of Losses
Type of Loss
Percentage
Physical damages on houses and property
8.70
Crop damage
50.62
Livestock damage
18.01
Death of household members
1.55
Illness/health problems
13.66
Loss of access to social services, including school
0.93
Loss of income
4.04
Loss of savings
1.24
Lost access to grazing land
0.31
Had to flee/change residence area
0.31
Other losses/damages
0.62
216
Page 1 of 1

Data_Collected_Date
Region S.N.N.P
Zone GAMO GOFA
Tuesday, November 5, 2019
Wereda MIRAB ABAYA
Selected Indicator
Capacity: Coping Options if More Resources Available - What coping strategy
could be adopted if more resource were available?
Coping Strategy To Be Adopted
Response (%)
Adaptation of economic activities to hazards season (e.g. cropping cycle, short term
crops, etc.)
Storage of food and other necessities
39.14
46.92
Physical protection of buildings and property
7.51
Changing residence area/migration
2.14
Others (specify)
2.95
None
1.34
217
Page 1 of 1
Data_Collected_Date
Tuesday, November 5, 2019
Region S.N.N.P
Selected Indictor:
Zone GAMO GOFA
Wereda MIRAB ABAYA
Capacity: Coping Strategies Adopted by Households - Percentage of households by
major type of coping strategies adopted (at least once)
Coping Strategy Adopted
Main Strategy
Secondary Strategy
Reduced expenditure on non-essential items (beer, cigarettes,
clothes, meat, etc.)
Consumption rather than sale of crop surplus
3.91
4.20
17.80
3.98
Sell more livestock than usual
23.01
10.40
Borrowing of food or cash (including purchasing food on credit)
4.49
6.19
Sale of non-productive assets (Jewelry, clothing, etc.)
4.34
3.32
Sending children of household for work
2.75
3.76
Reduced expenditure on health and education (including taking
children out of school)
Reduced expenditure on productive inputs (fertilizer, seeds,
livestock drugs, etc.)
Short-term / seasonal labor migration
1.30
0.88
0.43
1.33
1.01
2.43
Long-term / permanent migration (including distress migration of
whole families)
Increased working hours
0.72
0.22
1.45
5.53
Seek alternative or additional jobs
9.84
23.67
Collection of wild food
0.29
2.88
Rely on less preferred and less expensive food
6.66
16.15
Limit portion size at meals
2.60
4.20
218
Page 1 of 2
Data_Collected_Date
Tuesday, November 5, 2019
Region S.N.N.P
Selected Indictor:
Zone GAMO GOFA
Wereda MIRAB ABAYA
Capacity: Coping Strategies Adopted by Households - Percentage of households by
major type of coping strategies adopted (at least once)
Coping Strategy Adopted
Main Strategy
Secondary Strategy
Restrict consumption by adults in order for small children to eat
0.29
1.11
Reduce number of meals eaten in a day
2.03
Skip entire day without eating
0.14
3.54
Others -
16.93
5.97
219
Page 2 of 2

Wereda Disaster
Risk Profile
National Disaster Risk Management
Commission (NDRMC)
Data_Collected_Date
Tuesday, November 5, 2019
Region S.N.N.P
Zone GAMO GOFA
Wereda MIRAB ABAYA
Selected Indicator
Capacity: Coping Strategies Adopted by Households - Main coping strategies adopted by households for respective
disasters
Coping Strtegies Adopted
Types of disaters for which HHs in the community adopt the listed
Coping Strtegies
Borrowing of food or cash
(including purchasing food
on credit)
Collection of wild food
Consumption rather than
sale of crop surplus
220
Page 1 of 7
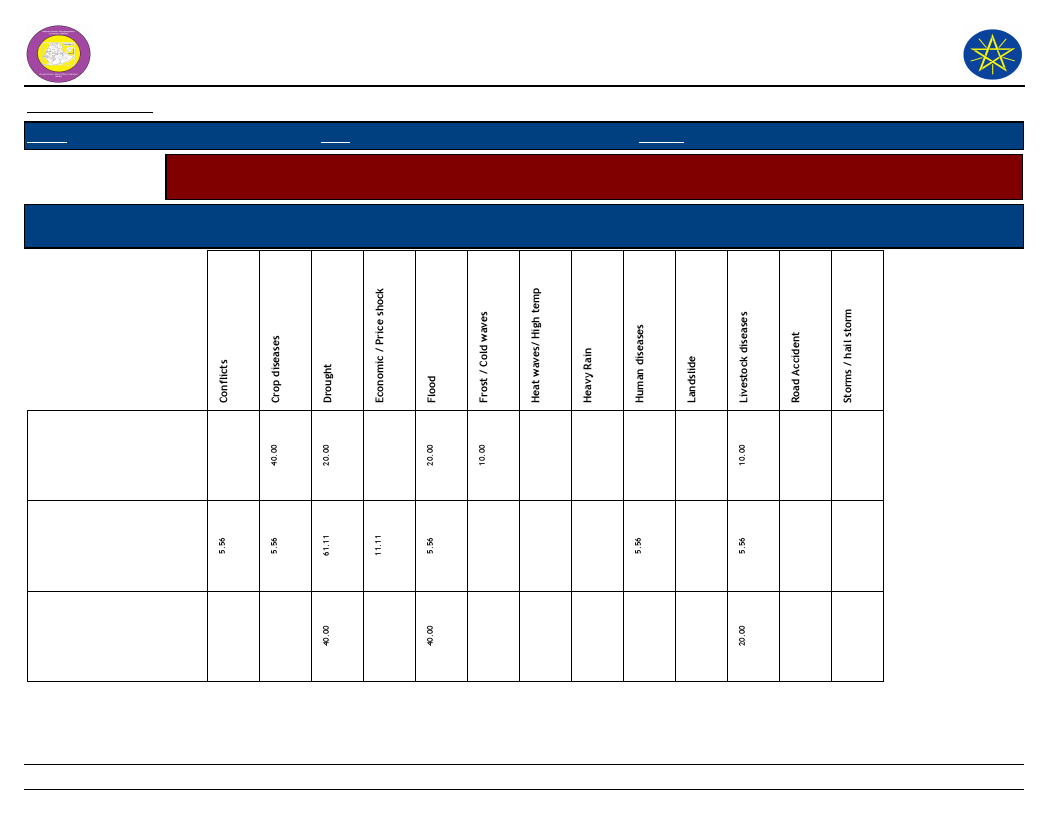
Wereda Disaster
Risk Profile
National Disaster Risk Management
Commission (NDRMC)
Data_Collected_Date
Tuesday, November 5, 2019
Region S.N.N.P
Zone GAMO GOFA
Wereda MIRAB ABAYA
Selected Indicator
Capacity: Coping Strategies Adopted by Households - Main coping strategies adopted by households for respective
disasters
Coping Strtegies Adopted
Types of disaters for which HHs in the community adopt the listed
Coping Strtegies
Increased working hours
Limit portion size at meals
Long-term / permanent
migration (including
distress migration of
whole families)
221
Page 2 of 7
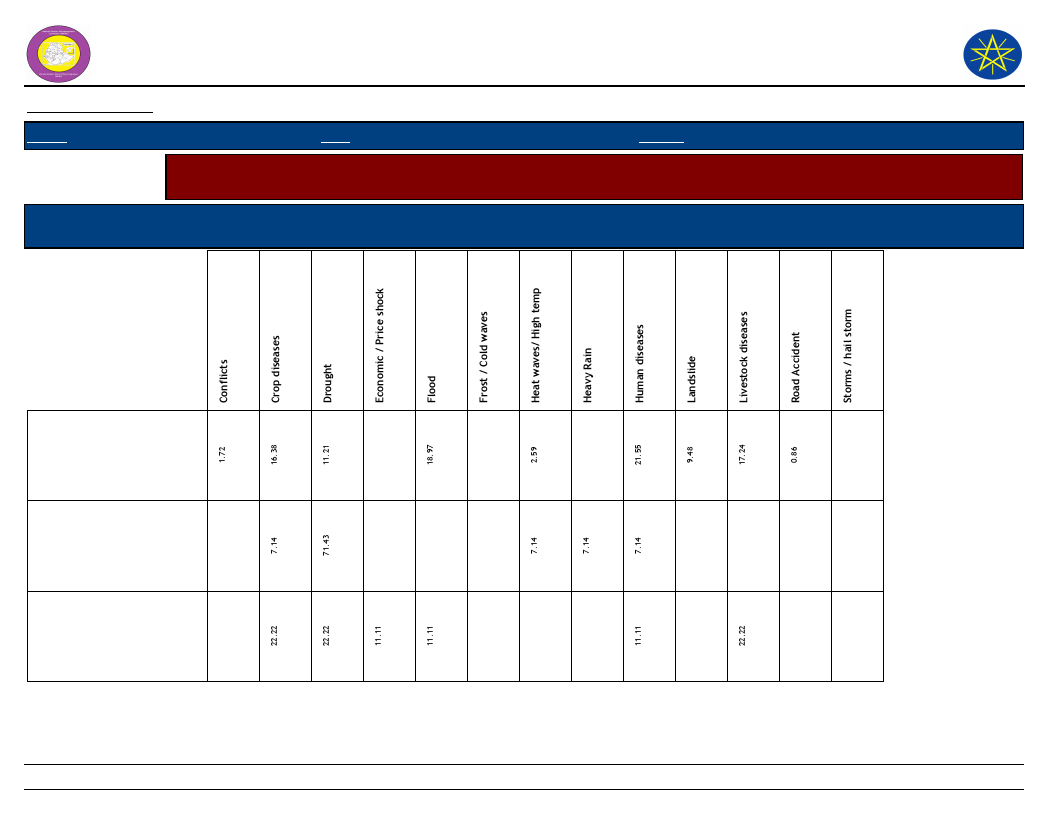
Wereda Disaster
Risk Profile
National Disaster Risk Management
Commission (NDRMC)
Data_Collected_Date
Tuesday, November 5, 2019
Region S.N.N.P
Zone GAMO GOFA
Wereda MIRAB ABAYA
Selected Indicator
Capacity: Coping Strategies Adopted by Households - Main coping strategies adopted by households for respective
disasters
Coping Strtegies Adopted
Types of disaters for which HHs in the community adopt the listed
Coping Strtegies
Others -
Reduce number of meals
eaten in a day
Reduced expenditure on
health and education
(including taking children
out of school)
222
Page 3 of 7

Wereda Disaster
Risk Profile
National Disaster Risk Management
Commission (NDRMC)
Data_Collected_Date
Tuesday, November 5, 2019
Region S.N.N.P
Zone GAMO GOFA
Wereda MIRAB ABAYA
Selected Indicator
Capacity: Coping Strategies Adopted by Households - Main coping strategies adopted by households for respective
disasters
Coping Strtegies Adopted
Types of disaters for which HHs in the community adopt the listed
Coping Strtegies
Reduced expenditure on
non-essential items (beer,
cigarettes, clothes, meat,
etc.)
Reduced expenditure on
productive inputs
(fertilizer, seeds,
livestock drugs, etc.)
Rely on less preferred and
less expensive food
223
Page 4 of 7

Wereda Disaster
Risk Profile
National Disaster Risk Management
Commission (NDRMC)
Data_Collected_Date
Tuesday, November 5, 2019
Region S.N.N.P
Zone GAMO GOFA
Wereda MIRAB ABAYA
Selected Indicator
Capacity: Coping Strategies Adopted by Households - Main coping strategies adopted by households for respective
disasters
Coping Strtegies Adopted
Types of disaters for which HHs in the community adopt the listed
Coping Strtegies
Restrict consumption by
adults in order for small
children to eat
Sale of non-productive
assets (Jewelry, clothing,
etc.)
Seek alternative or
additional jobs
224
Page 5 of 7

Wereda Disaster
Risk Profile
National Disaster Risk Management
Commission (NDRMC)
Data_Collected_Date
Tuesday, November 5, 2019
Region S.N.N.P
Zone GAMO GOFA
Wereda MIRAB ABAYA
Selected Indicator
Capacity: Coping Strategies Adopted by Households - Main coping strategies adopted by households for respective
disasters
Coping Strtegies Adopted
Types of disaters for which HHs in the community adopt the listed
Coping Strtegies
Sell more livestock than
usual
Sending children of
household for work
Short-term / seasonal
labor migration
225
Page 6 of 7
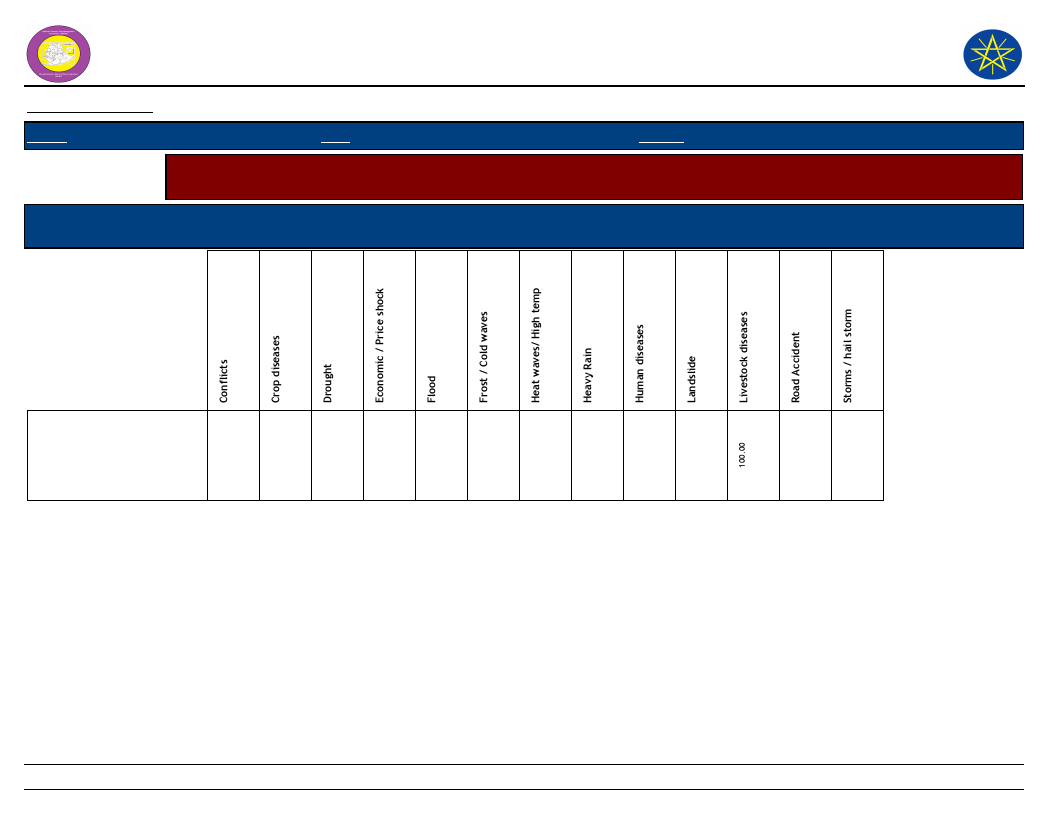
Wereda Disaster
Risk Profile
National Disaster Risk Management
Commission (NDRMC)
Data_Collected_Date
Tuesday, November 5, 2019
Region S.N.N.P
Zone GAMO GOFA
Wereda MIRAB ABAYA
Selected Indicator
Capacity: Coping Strategies Adopted by Households - Main coping strategies adopted by households for respective
disasters
Coping Strtegies Adopted
Types of disaters for which HHs in the community adopt the listed
Coping Strtegies
Skip entire day without
eating
226
Page 7 of 7

Wereda Disaster Risk
Profile
National Disaster Risk Management
Commission (NDRMC)
Data_Collected_Date
Region S.N.N.P
Zone
GAMO GOFA
Wereda MIRAB ABAYA
Tuesday, November 5, 2019
Selected Indicator
Capacity: Coping Strategies Adopted by Households - Secondary coping strategies adopted by households for
respective disasters
Begging for money or for
food
Borrowing of food or cash
(including purchasing food
on credit)
Collection of wild food
Consumption rather than
sale of crop surplus
Increased working hours
Limit portion size at meals
227
Page 1 of 4
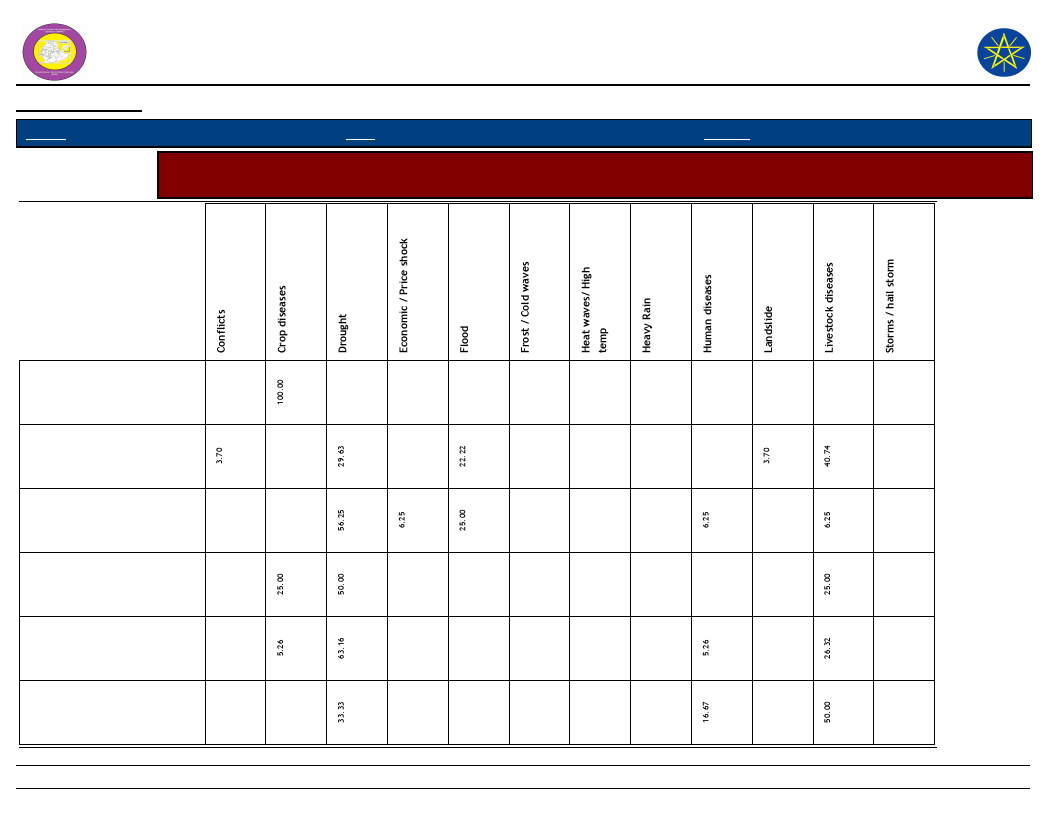
Wereda Disaster Risk
Profile
National Disaster Risk Management
Commission (NDRMC)
Data_Collected_Date
Region S.N.N.P
Zone
GAMO GOFA
Wereda MIRAB ABAYA
Tuesday, November 5, 2019
Selected Indicator
Capacity: Coping Strategies Adopted by Households - Secondary coping strategies adopted by households for
respective disasters
Long-term / permanent
migration (including
distress migration of whole
Others -
Reduce number of meals
eaten in a day
Reduced expenditure on
health and education
(including taking children
Reduced expenditure on
non-essential items (beer,
cigarettes, clothes, meat,
Reduced expenditure on
productive inputs
(fertilizer, seeds, livestock
228
Page 2 of 4
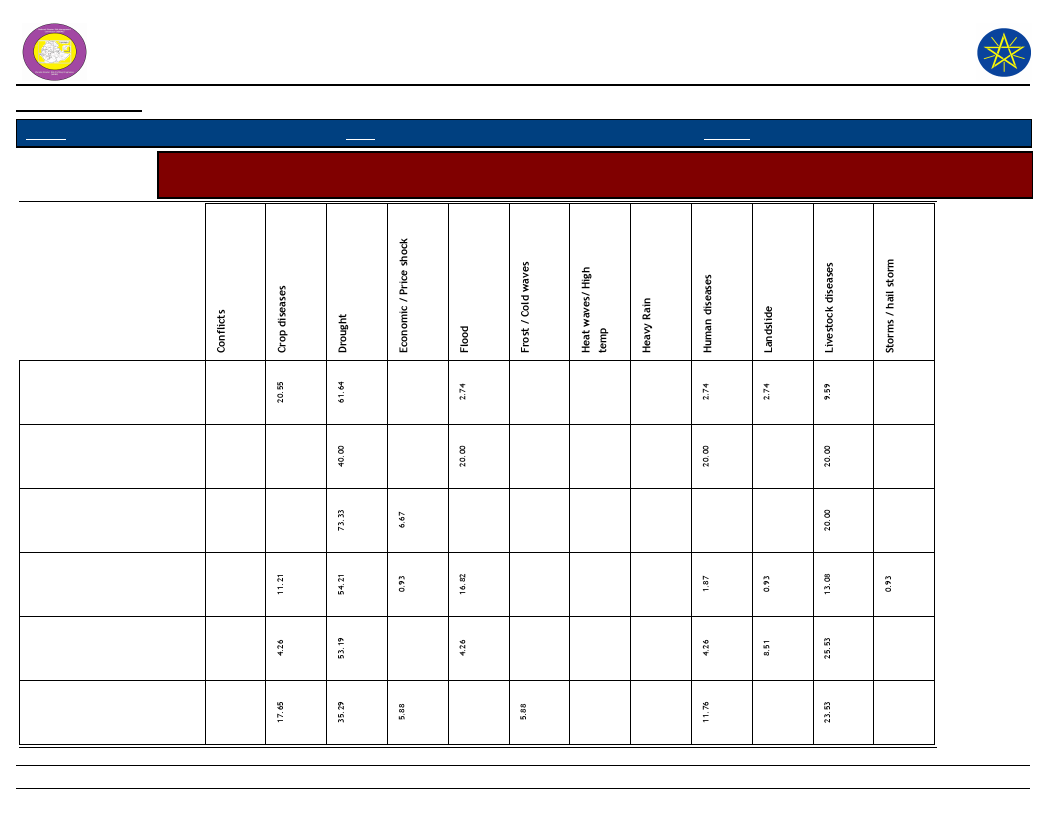
Wereda Disaster Risk
Profile
National Disaster Risk Management
Commission (NDRMC)
Data_Collected_Date
Region S.N.N.P
Zone
GAMO GOFA
Wereda MIRAB ABAYA
Tuesday, November 5, 2019
Selected Indicator
Capacity: Coping Strategies Adopted by Households - Secondary coping strategies adopted by households for
respective disasters
Rely on less preferred and
less expensive food
Restrict consumption by
adults in order for small
children to eat
Sale of non-productive
assets (Jewelry, clothing,
etc.)
Seek alternative or
additional jobs
Sell more livestock than
usual
Sending children of
household for work
229
Page 3 of 4

Wereda Disaster Risk
Profile
National Disaster Risk Management
Commission (NDRMC)
Data_Collected_Date
Region S.N.N.P
Zone
GAMO GOFA
Wereda MIRAB ABAYA
Tuesday, November 5, 2019
Selected Indicator
Capacity: Coping Strategies Adopted by Households - Secondary coping strategies adopted by households for
respective disasters
Short-term / seasonal labor
migration
230
Page 4 of 4
WDRP Indicators
Community
Perceptions and Suggestions
231
Wereda Disaster
Risk Profile
Data_Collected_Date
National Disaster Risk Management
Commission (NDRMC)
Tuesday, November 5, 2019
Region S.N.N.P
Zone
GAMO GOFA
Wereda MIRAB ABAYA
Selected Indicator
Kebele Name
Interventions: Community Perception on Mediums to Influence DRM Actors - Community perception on the
effectiveness of institutional channels to use to influence DRM actors
Institution_1
Process_Description
Institution_2 Process_Description
Institution_3
Process_Description
ALGAE
ANKOBER
DELBO
DOSHE
Agricultural issues
Agricultural Sector
issue
Agricultural issue
Agriculture sector
issue
Development agent
to local
administrative and
wereda agriculture
office, zone
agriculture office
Development agent
to local
administrative and
wereda agriculture
office, zone
agriculture office
Development agent
to local
administrative and
wereda agriculture
office, zone
agriculture office
Development agent
to local
administrative and
wereda agriculture
office, zone
agriculture office
Health issues
Developmental group,
kebele
administration,
wereda
administration
Police crime
issue
Kebele administration,
wereda administration
Health sector
issue
Women development,
local administrative,
wereda health office,
zone health office
Security issue
Kebele local
administration
commander, cluster
police station, wereda
security office
Health issue
Health extension of
kebele
Health sector
issue
Volunteer health
extension worker,
health post, wereda
health office, zone
health development,
region health office.
Security sector
issue
Kebele administration,
cluster police station,
wereda security office,
zone security
department, region.
232
Page 1 of 6

Wereda Disaster
Risk Profile
Data_Collected_Date
National Disaster Risk Management
Commission (NDRMC)
Tuesday, November 5, 2019
Region S.N.N.P
Zone
GAMO GOFA
Wereda MIRAB ABAYA
Selected Indicator
Kebele Name
Interventions: Community Perception on Mediums to Influence DRM Actors - Community perception on the
effectiveness of institutional channels to use to influence DRM actors
Institution_1
Process_Description
Institution_2 Process_Description
Institution_3
Process_Description
FARAOSA
FETELE
PURA
LAYO TERGA
Agricultural issue
Agriculture issue
Agricultural issue
Agricultural issue
Development agent
to local
administrative and
wereda agriculture
office, zone
agriculture office
Development agent
to local
administrative and
wereda agriculture
office, zone
agriculture office
Development agent
to local
administrative and
wereda agriculture
office, zone
agriculture office
Development agent
to local
administrative and
wereda agriculture
office, zone
agriculture office
Health issue
Health issue
From 1 to 5 group,
development group,
kebele
administration,
wereda
administration.
Inform to kebele
health extension to
prevent.
Health issue
The community
inform to health
extension in kebel
Health issue
To kebele
administrative then
to kebele health
extension to create
awareness about the
disaster
Security issue
Kebele administration,
wereda administration.
Clime issue
Inform kebele older,
police, kebele and of
beyond inform to
wereda.
Educational
issue
They inform to kebele
Educational
case
To kebele
administrative body
and education office
233
Page 2 of 6

Wereda Disaster
Risk Profile
Data_Collected_Date
National Disaster Risk Management
Commission (NDRMC)
Tuesday, November 5, 2019
Region S.N.N.P
Zone
GAMO GOFA
Wereda MIRAB ABAYA
Selected Indicator
Kebele Name
Interventions: Community Perception on Mediums to Influence DRM Actors - Community perception on the
effectiveness of institutional channels to use to influence DRM actors
Institution_1
Process_Description
Institution_2 Process_Description
Institution_3
Process_Description
MOLLE
MOREDA
KOLA BANENA
KOLA MULAT0
Agricultural issue
Agriculture issue
Agricultural issue
Agricultural issue
From 1 to 5 group,
developmental
agent, kebele
administration,
wereda
administration.
1 to 5 group,
developmental
agent, kebele
agriculture office,
wereda agricultural
office, zone
agriculture office.
One to five group,
development group,
kebele
administration and
wereda
administrator.
Inform
developmental
agent to kebele
administration to
wereda
administration.
Health issue
From 1 to 5 group,
health extension
worker, wereda
health office.
Crime
Kebele administration,
wereda administration.
Health issue
Health issue
Health issue
1 - 5 group, women
developmental group,
health extension
workers, Kebele
health post, wereda
health office, zone
health office
From one to five
group, development
group, kebele
administration and
wereda
administrator.
Kebele health
extension to kebele
administrtion to
wereda
administration.
Security issue
Crime issue
Crime issue
Kebele security
command, cluster
police station, wereda
security office, zone
security office.
Kebele Administration,
wereda administration.
Community to kebele
administration to
resolve the conflict by
elder and religious
group.
234
Page 3 of 6

Wereda Disaster
Risk Profile
Data_Collected_Date
National Disaster Risk Management
Commission (NDRMC)
Tuesday, November 5, 2019
Region S.N.N.P
Zone
GAMO GOFA
Wereda MIRAB ABAYA
Selected Indicator
Kebele Name
Interventions: Community Perception on Mediums to Influence DRM Actors - Community perception on the
effectiveness of institutional channels to use to influence DRM actors
Institution_1
Process_Description
Institution_2 Process_Description
Institution_3
Process_Description
KORGA GERAMO
UGAYO
UMO LANTE
Agriculture issue
1 to 5,
developmental
agent, kebele
agriculture, wereda
agriculture.
Agriculture issue
Development agent
to local
administrative and
wereda agriculture
office, zone
agriculture office
Agricultural issue
1 - 5 group,
developmental
agent, Kebele
agriculture office,
wereda agricultural
office, zone
agriculture office
Health issue
Health issue
Health issue
1 to 5, women
development group,
health extension
expert, wereda
health office, zone
health office.
Kebele health
extension to crate
awareness in the
community
concerning the
disaster prevention
recovery and cope.
1 - 5 group,
developmental group,
health extension
workers, kebele
health post, wereda
health office, zone
health office/
Security issue
Crime issue
Security issue
Kebele administration
commander, cluster
police, wereda security
office, zome security
department.
Kebele elders decide to
resolve the conflict and
then inform to kebele
administration
Kebele administration
commander, cluster
police station, wereda
police office, zone
police office.
235
Page 4 of 6

Wereda Disaster
Risk Profile
Data_Collected_Date
National Disaster Risk Management
Commission (NDRMC)
Tuesday, November 5, 2019
Region S.N.N.P
Zone
GAMO GOFA
Wereda MIRAB ABAYA
Selected Indicator
Interventions: Community Perception on Mediums to Influence DRM Actors - Community perception on the
effectiveness of institutional channels to use to influence DRM actors
Kebele Name
WANKE WAGEFO
WOYE BARENA
YAYEKE
Institution_1
Agriculture
Kebele
Administration
Agriculture sector
issue
Process_Description
Development agent
to local
administrative and
wereda agriculture
office, zone
agriculture office
1 to 5 association,
developmental
association, kebele
administration,
wereda , zone.
1 to 5,
developmental
agent, local
administrative,
wereda agriculture
office, zone
agriculture
development.
Institution_2
Health
Process_Description
The community to
health extension
worker then to the
kebele health office
then to the wereda
health office.
Institution_3
Security
Process_Description
Wen the issue of theh
community is about
security case thy go to
police of kebele, other
wise contact with
wereda.
Health Sector
issue
1 to 5 women group,
women development
group, health
extension expert,
wereda health office,
zone health
department.
Security Sector
issue
Kebele administration
commander, cluster
police station, wereda
security office, zone
security department.
236
Page 5 of 6
Wereda Disaster
Risk Profile
Data_Collected_Date
National Disaster Risk Management
Commission (NDRMC)
Tuesday, November 5, 2019
Region S.N.N.P
Zone
GAMO GOFA
Wereda MIRAB ABAYA
Selected Indicator
Interventions: Community Perception on Mediums to Influence DRM Actors - Community perception on the
effectiveness of institutional channels to use to influence DRM actors
Kebele Name
ZALA GUTESHA
ZALA BARANA
Institution_1
Agricultural issue
Process_Description
They inform to
kebele and
developmental
agents when they
can t respond well in
disaster mitigation
or prevention.
Agricultural issues
Community 1-5
development group,
kebele
developmental
agent, to kebele
agriculture office,
wereda agriculture
office
Institution_2
Health issue
Process_Description
They inform to kebele
administrative and
health extension of
kebele when they are
not respond well they
inform to the wereda
health office to
control the disaster.
Health issue
Community 1-5
women development
group, kebele health
post, wereda helth
office.
Institution_3
Crime issue
Education issue
Process_Description
They inform to kebele
administrative, local
elders and police in the
cluster to resolve the
conflict peace full
manner when they can
not solve and beyond
the community elders
they going to wereda
and so on.
community 1-5
development group,
kebele school director,
wereda education
office.
237
Page 6 of 6
Data_Collected_Date
Region S.N.N.P
Zone
GAMO GOFA
Tuesday, November 5, 2019
Wereda MIRAB ABAYA
Selected Indicator
Interventions: Community Perception on their Knowledge used in DRM Process -
Perception of the community on how their knowledge influences the priorities
and measures of DRM actors
KebeleName
Community_Suggestions
ALGAE
They are accepted
ANKOBER
They are accepted
DELBO
Good
DOSHE
They were accepted.
FARAOSA
They accepted
FETELE
PURA
Good
LAYO TERGA
Good
MOLLE
They are accepted.
MOREDA
They are accepted.
KOLA BANENA
They are accepted.
KOLA MULAT0
Good
KORGA GERAMO
They are accept.
UGAYO
Good
UMO LANTE
They are accepted.
WANKE WAGEFO
Good
WOYE BARENA
They are accepted.
YAYEKE
They are accept.
238
Page 1 of 2
Data_Collected_Date
Region S.N.N.P
Zone
GAMO GOFA
Tuesday, November 5, 2019
Wereda MIRAB ABAYA
Selected Indicator
Interventions: Community Perception on their Knowledge used in DRM Process -
Perception of the community on how their knowledge influences the priorities
and measures of DRM actors
KebeleName
Community_Suggestions
ZALA GUTESHA
Good.
ZALA BARANA
They are accepted
239
Page 2 of 2
Wereda Disaster Risk
Profile
National Disaster Risk Management
Commission (NDRMC)
Data_Collected_Date
Region
Zone
Wereda
Tuesday, November 5, 2019
Selected Indicator
Interventions: Suggestions to improve preparedness - Interventions suggested by the community to development
actors to improve preparedness in the area
KebeleName
Measure 1
Comment 1
Measure 2
Comment 2
Measure 3
Comment 3
240
Page 1 of 1
Wereda Disaster Risk
Profile
National Disaster Risk Management
Commission (NDRMC)
Data_Collected_Date
Region S.N.N.P
Zone GAMO GOFA
Wereda MIRAB ABAYA
Tuesday, November 5, 2019
Selected Indicator
Interventions: Suggestions to DRM Actors in the Area - Community suggested measures to DRM actors in the area
for effective DRM actions
Kebele Name
ALGAE
Measure 1
Pure water supply
Comment 1
ANKOBER
Infrastructure/road,
dam construction,
electricity, school/
DELBO
River dam
construction.
DOSHE
Alternative
irrigation system
Measure 2
High pressurized water
pump/generator
Sufficient veterinary
service with full
laboratory, drugs and
experts.
Livestock veterinary
service with full
laboratory instruments.
Highly pressurized
water pump.
Comment 2
FARAOSA
Irrigation supply.
Electric expansion.
Measure 3
Electric line
expansion
Comment 3
Disaster resistant
livestock breeds
River dam
construction,
pure water
supply/ spring
development.
FETELE
PURA
Irrigation channel
construction.
High pressured
water pump
generator.
Livestock clinic with all
laboratory materials.
Water dam
construction.
241
Resistance
livestock species.
Livestock
veterinary service
with full
laboratory
instrument.
Page 1 of 3
Wereda Disaster Risk
Profile
National Disaster Risk Management
Commission (NDRMC)
Data_Collected_Date
Region S.N.N.P
Zone GAMO GOFA
Wereda MIRAB ABAYA
Tuesday, November 5, 2019
Selected Indicator
Interventions: Suggestions to DRM Actors in the Area - Community suggested measures to DRM actors in the area
for effective DRM actions
Kebele Name
LAYO TERGA
Measure 1
Electric power
supply
Comment 1
Measure 2
Pure water supply
Comment 2
MOLLE
Pure water supply
construction.
MOREDA
Allocation of
sufficient budget
KOLA BANENA
Pure water supply
KOLA MULAT0
KORGA
GERAMO
UGAYO
Irrigation dam
construction
Infrastructure
development
High pressurized
water pump
generation.
UMO LANTE
Sufficient budget
allocation.
To prevent any
disaster
Extension of school
level.
Capacity building for
experts
High pressurized water
pump/generator.
High pressurized water
pump generator.
High pressurized water
pump
Community pond
construction.
To enhance
performance
Capacity building for
expert.
Measure 3
Genetically
modified
livestock
population,
Dam construction
for irrigation
purpose.
Infrastructure
expansion and
construction
Electric line
extension.
Community pond
construction.
Store
construction.
Livestock clinic
with full
laboratory
instrument.
Infrastructure
expansion.
Comment 3
242
Page 2 of 3
Wereda Disaster Risk
Profile
National Disaster Risk Management
Commission (NDRMC)
Data_Collected_Date
Region S.N.N.P
Zone GAMO GOFA
Wereda MIRAB ABAYA
Tuesday, November 5, 2019
Selected Indicator
Interventions: Suggestions to DRM Actors in the Area - Community suggested measures to DRM actors in the area
for effective DRM actions
Kebele Name
WANKE
WAGEFO
Measure 1
High pressurized
water pump
generator.
Comment 1
WOYE BARENA Electric power
YAYEKE
High pressurized
water pump supply.
ZALA GUTESHA Pure water supply.
ZALA BARANA
Installation of water
pump.
Measure 2
Irrigation structure
Different forest tree
plantation.
Pure water supply
extension.
Electric power supply.
Supplying pests and
disease resistant
seed/improved
varieties
Comment 2
To create different
job opportunities.
Measure 3
Livestock clinic
with full
laboratory
instrument.
Farmer
association
Health post
standard
improvement.
Genetically
modified
livestock breeds
for the
community
Infrastructure/Ele
ctric power,
school.../
Comment 3
243
Page 3 of 3

Wereda Disaster Risk
Profile
National Disaster Risk Management
Commission (NDRMC)
Data_Collected_Date
Region S.N.N.P
Zone GAMO GOFA
Tuesday, November 5, 2019
Wereda MIRAB ABAYA
Selected Indicator
Economic Vulnerability: Community Suggestions to Improve Economic Situation - Community suggested measures
to improve the economic situation of the area
KebeleName
Measure 1
Comment 1
Measure 2
Comment 2
Measure 3 Comment 3
ALGAE
ANKOBER
DELBO
DOSHE
FARAOSA
FETELE
Irrigation water supply
Fruit production
Animal fattening
Poultry production
Vegetable production,
onion, tomato, etc.
Poultry production
Maximization of
production
Market access is high.
To generate income
Good market access
Different livestock
breeds
Petty trade
Poultry production
Maximization
production of
animal.
High market
access
Fattening of oxen,
goat
Poultry production
Good market
access.
Animal fattening
Vegetable
production
Goat rearing
Animal
fattening
PURA
LAYO TERGA
MOLLE
Animal fattening and
poultry production
Growing disease and
drought resistant crops
like Enset
Irrigation water dam
construction
To generate income.
To escape drought season
Short maturing
crops
Planting improved
potato seeds
High disease
resistance
Intercrop
/relay
cropping
Vegetable
crops
244
Page 1 of 3

Wereda Disaster Risk
Profile
National Disaster Risk Management
Commission (NDRMC)
Data_Collected_Date
Region S.N.N.P
Zone GAMO GOFA
Tuesday, November 5, 2019
Wereda MIRAB ABAYA
Selected Indicator
Economic Vulnerability: Community Suggestions to Improve Economic Situation - Community suggested measures
to improve the economic situation of the area
KebeleName
Measure 1
Comment 1
Measure 2
Comment 2
Measure 3 Comment 3
MOREDA
KOLA BANENA
KOLA MULAT0
Vegetable production
Irrigation water supply
Banana production.
Maximization of
production.
High market access.
KORGA GERAMO
Vegetable production
UGAYO
Vegetable production.
To generate income.
UMO LANTE
Crop production
WANKE WAGEFO
WOYE BARENA
Animal fattening,
poultry production
Agricultural package
YAYEKE
Vegetable production
ZALA GUTESHA
Animal fattening
Irrigation land
Good market access.
To generate income.
Chat production
Animal
fattening
Market
access.
Vegetable
production .
Fruit production
Growing improved
and short period
crops
Petty trade
Vegetable
production
Hybrid breeding of
animals
Goat rearing
Poultry production
245
Good market
access.
To escape drought
season.
Good marketing
access.
Short season
crop
production.
Mineral
production
Poultry
production,
fattening
Animal
fattening
Use of short
season crops
Compost of
animal
Animal
fattening
Vegetable
production
High market
access.
Good access
to market
Page 2 of 3
Wereda Disaster Risk
Profile
National Disaster Risk Management
Commission (NDRMC)
Data_Collected_Date
Region S.N.N.P
Zone GAMO GOFA
Tuesday, November 5, 2019
Wereda MIRAB ABAYA
Selected Indicator
Economic Vulnerability: Community Suggestions to Improve Economic Situation - Community suggested measures
to improve the economic situation of the area
KebeleName
Measure 1
Comment 1
Measure 2
Comment 2
Measure 3 Comment 3
ZALA BARANA
Animal fattening
Vegetable
production
Plantation of
eucalyptus
246
Page 3 of 3

Wereda Disaster
Risk Profile
Data_Collected_Date
Region S.N.N.P
Zone GAMO GOFA
Selected Indicator
Community Awareness of Disaster Risk Management System and Actors
Kebele Name
ALGAE
Institution 1
Responsibility
Activity
Agriculture Office
Any agricultural service.
Supply agricultural inputs.
Institution 2
Responsibility
Activity
Health Office
Prevention of disease.
Awareness creation.
Institution 3
Responsibility
Activity
Kebele Name
Police
Security
Conflict resolution.
ANKOBER
Institution 1
Responsibility
Activity
Agricultural Office
To facilitate agricultural extension service.
Supplying of agricultural input, consulting service of agricultural practice.
Institution 2
Responsibility
Activity
Health Office
To facilitate health extension service.
Disease preventive activities.
Institution 3
Responsibility
Activity
Education Office
To make people literate.
Teaching of students.
National Disaster Risk
Management Comission (NDRMC)
Tuesday, November 5, 2019
Wereda MIRAB ABAYA
247
Page 1 of 10

Wereda Disaster
Risk Profile
Data_Collected_Date
Region S.N.N.P
Zone GAMO GOFA
Selected Indicator
Community Awareness of Disaster Risk Management System and Actors
Kebele Name
DELBO
Institution 1
Responsibility
Activity
Agriculture Office
All agricultural service.
Extension approach teaching, training, new technology introduce net.
Institution 2
Responsibility
Activity
Health Office
All health services.
Create awareness, prevent, disaster.
Institution 3
Responsibility
Activity
Kebele Name
Education Office
All educational service
Taching and learning, about courses and effects of hazards and disease.
DOSHE
Institution 1
Responsibility
Activity
Agriculture Office
Agricultural extension service.
Supply inputs, counseling of agriculture practice.
Institution 2
Responsibility
Activity
Health office
Health extension service.
Disease preventing service health package.
Institution 3
Responsibility
Activity
Education Office
Knowledge development.
Follow up the teaching and learning process.
National Disaster Risk
Management Comission (NDRMC)
Tuesday, November 5, 2019
Wereda MIRAB ABAYA
248
Page 2 of 10

Wereda Disaster
Risk Profile
Data_Collected_Date
Region S.N.N.P
Zone GAMO GOFA
Selected Indicator
Community Awareness of Disaster Risk Management System and Actors
Kebele Name
FARAOSA
Institution 1
Responsibility
Activity
Agriculture Office
any agricultural service.
To supply agricultural inputs.
Institution 2
Responsibility
Activity
Health Office
Prevention of disease.
Awareness creation.
Institution 3
Responsibility
Micro finance
Saving and credit service.
Activity
Kebele Name
FETELE
Institution 1
Responsibility
Activity
Agriculture Office
All agricultural activities.
Extension approach program.
Institution 2
Responsibility
Activity
Health Office
All health service.
Awareness creation.
Institution 3
Responsibility
Activity
Education Office
all education service
Teaching student, prevention recover and copping mechanism.
National Disaster Risk
Management Comission (NDRMC)
Tuesday, November 5, 2019
Wereda MIRAB ABAYA
249
Page 3 of 10

Wereda Disaster
Risk Profile
Data_Collected_Date
Region S.N.N.P
Zone GAMO GOFA
Selected Indicator
Community Awareness of Disaster Risk Management System and Actors
Kebele Name
KOLA BANENA
Institution 1
Responsibility
Activity
Agriculture Office
All agricultural
Extension approach teaching.
Institution 2
Responsibility
Activity
Health Office
Prevention of disease
Training.
Institution 3
Responsibility
Activity
Kebele Name
Police Office
Security
Conflict resolution.
KOLA MULAT0
Institution 1
Responsibility
Activity
Agriculture Office
All agriculture service.
Extension approach technique, training program.
Institution 2
Responsibility
Activity
Health Office
All health service.
Create awareness, training, sanitation.
Institution 3
Responsibility
Activity
Police
Crime mitigation.
Conflict resolution in the community, prevention.
National Disaster Risk
Management Comission (NDRMC)
Tuesday, November 5, 2019
Wereda MIRAB ABAYA
250
Page 4 of 10

Wereda Disaster
Risk Profile
Data_Collected_Date
Region S.N.N.P
Zone GAMO GOFA
Selected Indicator
Community Awareness of Disaster Risk Management System and Actors
Kebele Name
KORGA GERAMO
Institution 1
Responsibility
Activity
Agriculture Office
Agricultural extension service.
Supplying of agriculture inputs, extension service
Institution 2
Responsibility
Activity
Health Office
Health extension service
Disease preventive where served.
Institution 3
Responsibility
Activity
Kebele Name
Education Office
Illiterate people
Teaching of students.
LAYO TERGA
Institution 1
Responsibility
Activity
Agriculture Office
All agriculture activities
Institution 2
Responsibility
Activity
Health Office
All health activities.
Institution 3
Responsibility
Education Office
All educational activities.
Activity
National Disaster Risk
Management Comission (NDRMC)
Tuesday, November 5, 2019
Wereda MIRAB ABAYA
251
Page 5 of 10

Wereda Disaster
Risk Profile
Data_Collected_Date
Region S.N.N.P
Zone GAMO GOFA
Selected Indicator
Community Awareness of Disaster Risk Management System and Actors
Kebele Name
MOLLE
Institution 1
Responsibility
Activity
Agriculture Office
Any agricultural service.
Supply agricultural inputs.
Institution 2
Responsibility
Activity
Health Office
Prevention of disease.
Awareness creation.
Institution 3
Responsibility
Activity
Kebele Name
Police Office
Security
Conflict resolution.
MOREDA
Institution 1
Responsibility
Activity
Agriculture Office
Agricultural extension service.
Supply agriculture in outs.
Institution 2
Responsibility
Activity
Health Office
Health extension service.
Preventive action of disease.
Institution 3
Responsibility
Activity
Education Office
Literate
Awareness level increase.
National Disaster Risk
Management Comission (NDRMC)
Tuesday, November 5, 2019
Wereda MIRAB ABAYA
252
Page 6 of 10

Wereda Disaster
Risk Profile
Data_Collected_Date
Region S.N.N.P
Zone GAMO GOFA
Selected Indicator
Community Awareness of Disaster Risk Management System and Actors
Kebele Name
PURA
Institution 1
Responsibility
Activity
Agriculture Office
All agriculture service.
Extension approach teaching, create awareness.
Institution 2
Responsibility
Activity
Health Office
All health service
Create awareness, teach the community to prevent disease.
Institution 3
Responsibility
Activity
Kebele Name
Police Office
Conflict resolution
Crime mitigation training.
UGAYO
Institution 1
Responsibility
Activity
Agriculture Office
Extension approach teaching
Give training to community technology.
Institution 2
Responsibility
Activity
Health Office
All health activities.
Create awareness, medicine supply.
Institution 3
Responsibility
Activity
Police
All security activities.
Mitigation of crime, conflict resolution.
National Disaster Risk
Management Comission (NDRMC)
Tuesday, November 5, 2019
Wereda MIRAB ABAYA
253
Page 7 of 10
Wereda Disaster
Risk Profile
Data_Collected_Date
Region S.N.N.P
Zone GAMO GOFA
Selected Indicator
Community Awareness of Disaster Risk Management System and Actors
Kebele Name
UMO LANTE
Institution 1
Responsibility
Activity
Agriculture Office
Agricultural extension service.
Agriculture extension service, supporting of farmers.
Institution 2
Responsibility
Activity
Health Office
Health extension service
16 Health package service, disease prevention service.
Institution 3
Responsibility
Activity
Kebele Name
Education Office
Knowledge development.
Following up in attended student regular class.
WANKE WAGEFO
Institution 1
Responsibility
Activity
Agricultural Office
All agricultural service
Extension approach.
Institution 2
Responsibility
Activity
Health Office
All health service
Sanitation, awareness creation.
Institution 3
Responsibility
Activity
Education Office
Educational activities
Teaching of students.
National Disaster Risk
Management Comission (NDRMC)
Tuesday, November 5, 2019
Wereda MIRAB ABAYA
254
Page 8 of 10

Wereda Disaster
Risk Profile
Data_Collected_Date
Region S.N.N.P
Zone GAMO GOFA
Selected Indicator
Community Awareness of Disaster Risk Management System and Actors
Kebele Name
WOYE BARENA
Institution 1
Responsibility
Activity
Agriculture Office
All agriculture service
Supply of agriculture inputs.
Institution 2
Responsibility
Activity
Health Office
Health service
Institution 3
Responsibility
Cooperative
Increasing saving culture
Activity
Kebele Name
YAYEKE
Institution 1
Responsibility
Activity
Agricultural Office
Agricultural extension service.
Supplying of agriculture input, extension service/counseling of agri-farming.
Institution 2
Responsibility
Activity
Health Office
Health extension service.
Disease prevention activities were served.
Institution 3
Responsibility
Activity
Education Office
People tolerate.
Teaching of students.
National Disaster Risk
Management Comission (NDRMC)
Tuesday, November 5, 2019
Wereda MIRAB ABAYA
255
Page 9 of 10

Wereda Disaster
Risk Profile
Data_Collected_Date
Region S.N.N.P
Zone GAMO GOFA
Selected Indicator
Community Awareness of Disaster Risk Management System and Actors
Kebele Name
ZALA BARANA
Institution 1
Responsibility
Activity
Agriculture Office
To serve agricultural extension.
Production, system, conservation techniques.
Institution 2
Responsibility
Activity
Health Office
To serve the issues of health.
Health package/prevention disease activities.
Institution 3
Responsibility
Activity
Kebele Name
Education Office
To rise the awareness level.
Increasing the knowledge level.
ZALA GUTESHA
Institution 1
Responsibility
Activity
Agriculture Office
All agriculture service.
Teaching extension approach, training program.
Institution 2
Responsibility
Activity
Education Office
All educational service.
Teaching students about cause and effect of disasters.
Institution 3
Responsibility
Activity
Health Office
All health service.
Create awareness in preventing, recovering and copping disease.
National Disaster Risk
Management Comission (NDRMC)
Tuesday, November 5, 2019
Wereda MIRAB ABAYA
256
Page 10 of 10
Wereda Disaster
Risk Profile
National Disaster Risk Management
Commission (NDRMC)
Data_Collected_Date
Tuesday, November 5, 2019
Region S.N.N.P
Zone GAMO GOFA
Wereda MIRAB ABAYA
Selected Indicator
Community Perception of DRM System and Actors - Perception of the community on the effectiveness of DRM
system in helping them to prevent, cope and recover from disasters
KebeleName
Prevention
Coping
Recovery
Overall_Effectiveness
ALGAE
ANKOBER
DELBO
Effective
Effective
Effective
Effective
Effective
Effective
Effective
Effective
Effective
Funding/shortage of money,
scarcity of resource
Lack of budget, lack of
capacity, commitment to
work.
Effective
DOSHE
Effective
Effective
Effective
Lack of resource.
FARAOSA
FETELE
Effective
Good
Effective
Good
Effective
Good
Funding shortage, scarcity
of resource
Effective
PURA
Effective
Effective
Effective
Effective
LAYO TERGA
Good
Good
Good
Effective
MOLLE
MOREDA
KOLA BANENA
Effective
Effective
Effective
Effective
Effective
Effective
Effective
Effective
Effective
Funding/shortage of money,
scarcity of resources
Lack of budget, lack of
capacity
Effective
KOLA MULAT0
Good
Good
Good
Poor capacity at wereda and
kebele level
257
Page 1 of 2

Wereda Disaster
Risk Profile
National Disaster Risk Management
Commission (NDRMC)
Data_Collected_Date
Tuesday, November 5, 2019
Region S.N.N.P
Zone GAMO GOFA
Wereda MIRAB ABAYA
Selected Indicator
Community Perception of DRM System and Actors - Perception of the community on the effectiveness of DRM
system in helping them to prevent, cope and recover from disasters
KebeleName
Prevention
Coping
Recovery
Overall_Effectiveness
KORGA GERAMO
UGAYO
UMO LANTE
WANKE WAGEFO
Effective
Good
Effective
Good
Effective
Good
Effective
Good
Effective
Good
Effective
Good
Lack of budget, lack of
capacity and commitment
to work.
Lack of capacity at kebele
and wereda level
Poor capacity at wereda and
kebele level
Effective
WOYE BARENA
Effective
Effective
Effective
Lack of funding.
YAYEKE
Effective
Effective
Effective
Lack of budget.
ZALA GUTESHA
Good
Good
Good
Effective
ZALA BARANA
Effective
Effective
Effective
Lack of fund or resource
258
Page 2 of 2
Data_Collected_Date
Region S.N.N.P
Zone GAMO GOFA
Tuesday, November 5, 2019
Wereda MIRAB ABAYA
Selected Indicator
Major Public Interventions Desired - Percentage of households by type of
intervention desired
Major public interventions desired by the community
Degree of Importance for the community
Agricultural inputs (fertilizer, improved seeds, etc.)
1st
2nd
3rd
6.10
2.75
3.99
Better job
22.28
11.85
16.61
Cash transfers/social assistance
0.00
0.00
1.00
Cash-for-work activities (not employment)
1.59
0.83
4.32
Enhance access to schools / School feeding for children
2.39
25.62
9.30
Food-for-work activities
4.51
5.51
5.98
Fuel subsidies
0.00
0.28
0.33
Medical assistance / access to health facilities
0.00
1.65
1.00
Micro-credit programmes
3.18
12.67
6.31
Rental subsidies
1.06
6.61
1.66
School fees for children
1.33
1.65
5.32
Subsidized food
1.33
12.40
10.96
Subsidized health care
0.53
1.10
2.66
Supplementary feeding for women and young children
0.53
3.03
25.25
259
Page 1 of 2

Data_Collected_Date
Region S.N.N.P
Zone GAMO GOFA
Tuesday, November 5, 2019
Wereda MIRAB ABAYA
Selected Indicator
Major Public Interventions Desired - Percentage of households by type of
intervention desired
Major public interventions desired by the community
Degree of Importance for the community
Food aid
1st
2nd
3rd
55.17
14.05
5.32
260
Page 2 of 2
WDRP Indicators
Other Community Characteristics
261
Wereda Disaster
Risk Profile
Data_Collected_Date
Region S.N.N.P
Zone GAMO GOFA
Selected Indicator
Capacity: Community Based Organizations in the Wereda
Name_Of_Organization
Est._Year
Formal/Informal
Kebele Name ALGAE
Women saving and credit
cooperative
Beka saving and loans cooperative
2000
Formal
Formal
Bee keeping cooperative
199
Formal
Amole cooperative
2002
Formal
Fishing cooperative
1987
Formal
Kebele Name ANKOBER
Ankober Saving and Credit
Cooperative Association
Zeteat Construction Mineral
Cooperative
Vegetable and Fruit Cooperative
Association
Kebele Name DELBO
Credit and Saving Cooperative
Ekub
Edir
2004
2005
1997
1998
Formal
Formal
Formal
Formal
Informal
Informal
National Disaster Risk Management
Commission (NDRMC)
Tuesday, November 5, 2019
Wereda MIRAB ABAYA
Type of Members
Activity
All age group
All age group
All age group
All age group
All age group
Farmers
Youth
Farmers
House hold
Working group
all except children
Give loan and saving money.
Give loan and saving money.
Producing honey.
Selling soil to animal husbandry individual.
Selling the production of fish to the
customer.
Loan service to their member, to increase
the saving culture and community level.
For job opportunity, resource use for
construction service.
To make market linkage and product sold
by better price.
Save and give loan to their member.
To save money for seasonal disaster.
Religious case, social interaction.
262
Page 1 of 7
Wereda Disaster
Risk Profile
Data_Collected_Date
National Disaster Risk Management
Commission (NDRMC)
Tuesday, November 5, 2019
Region S.N.N.P
Selected Indicator
Zone GAMO GOFA
Capacity: Community Based Organizations in the Wereda
Name_Of_Organization
Kebele Name DOSHE
Equb
Est._Year
Formal/Informal
1980
Informal
Edir
1975
Informal
Pharis Saving and credit
Cooperative Association.
Kebele Name FARAOSA
Saving and Credit Cooperation
2005
1986
Formal
Formal
Edir
Informal
Ekub
Kebele Name
Ekub
FETELE
Informal
Informal
Wereda MIRAB ABAYA
Type of Members
Activity
Farmers
Farmers
Farmers
House hold.
All except children
Working group
Self help.
Self help.
Increasing saving culture and loan
activities.
Saving, credit and loan for members.
Religious case, helping each other.
Seasonal saving of money.
Edir
Saving and credit Association
Kebele Name KOLA BANENA
Saving and Credit Cooperation
Kebele Name KOLA MULAT0
Saving and Credit Cooperative
1998
1998
Informal
Formal
Formal
Formal
House hold
All group
House hold head
Saving money and give loan to members.
Saving and loans.
Saving money and loan service.
263
Page 2 of 7
Wereda Disaster
Risk Profile
Data_Collected_Date
Region S.N.N.P
Zone GAMO GOFA
Selected Indicator
Capacity: Community Based Organizations in the Wereda
Name_Of_Organization
Est._Year
Formal/Informal
Ekub
Informal
Edir
Kebele Name
Edir
KORGA GERAMO
Tenker Vegetable Production
Cooperative
Sand Production Cooperative
2007
2007
1998
Informal
Informal
Formal
Formal
Fana Saving Cooperation
Women Saving and Credit
Cooperative
Kebele Name LAYO TERGA
Saving and credit cooperative
Edir
2004
2001
2004
Formal
Formal
Formal
Informal
Edir
Kebele Name MOLLE
Informal
National Disaster Risk Management
Commission (NDRMC)
Tuesday, November 5, 2019
Wereda MIRAB ABAYA
Type of Members
Working groups
House hold
Adult gruop
Youth group
Youth group
Youth group
Women
Activity
Seasonal and short period time saving
money.
Helping each other.
For social interaction.
Vegetable production source of income.
Supply sand for construction, source of
income.
Save money and loan service.
Saving money and loan service.
House hold heads
All community
except children
House hold
Loan to their member and saving for future.
Seasonal saving.
Saving money for future and helping each
other.
264
Page 3 of 7
Wereda Disaster
Risk Profile
Data_Collected_Date
Region S.N.N.P
Zone GAMO GOFA
Selected Indicator
Capacity: Community Based Organizations in the Wereda
Name_Of_Organization
Est._Year
Formal/Informal
Vegetable and fruits cooperative
Saving and credit cooperative
Kebele Name MOREDA
Saving and credit cooperative
Ekub
Edir
Kebele Name
Edir
PURA
Ekub
2003
1987
Formal
Formal
Formal
Informal
Informal
Informal
Informal
Credit and saving cooperative
2004
Formal
Fishing cooperative
Kebele Name UGAYO
Saving and Credit Cooperative
1998
1998
Formal
Formal
Fetele Lemate cooperation
2007
Formal
National Disaster Risk Management
Commission (NDRMC)
Tuesday, November 5, 2019
Wereda MIRAB ABAYA
Type of Members
Farmers
Farmers
Activity
For better price, market linkage.
To increase saving culture.
Farmers
Farmers
Farmers
To increase saving culture and loan activity.
Self help, helping each other.
Self help.
House hold
All except children
House hold
Working group
Helping each other.
Seasonal saving of money to motivate the
community.
Give loan to their member, save money for
future use.
Catch high income and saving the benefit..
All age group except
children
Elders and youth
Saving money and give loan to their
members.
Distribution of agriculture inputs, factory
production.
265
Page 4 of 7
Wereda Disaster
Risk Profile
Data_Collected_Date
Region S.N.N.P
Zone GAMO GOFA
Selected Indicator
Capacity: Community Based Organizations in the Wereda
Name_Of_Organization
Est._Year
Formal/Informal
Sericulture production
cooperative
Edir
2003
Informal
Informal
Ekub
Kebele Name
Equb and Edir
UMO LANTE
1987, 1968
Informal
Informal
Fruit and Vegetable Basic General
Cooperative
1977
Formal
Umo Dicha Grain Marketing
Cooperative
2008
Formal
Baso Improve Seed Multiplication
Cooperative
Lama Dicha Saving and Credit
Cooperative
Kebele Name WANKE WAGEFO
Productive Cooperative
2007
2004
2004
Formal
Formal
Formal
National Disaster Risk Management
Commission (NDRMC)
Tuesday, November 5, 2019
Wereda MIRAB ABAYA
Type of Members
women
All age group except
children
All age group except
children
Activity
Sericulture production.
Helping each other.
Saving money for seasonal disaster.
All groups and
farmers
Farmers
Farmers
Farmers
Farmers
Helping each other better social
interaction.
They harvest their members banana
produce and sell at central market for
better price.
They harvest their members banana
produce and sell at central market for
better price.
To multiply seed and gain.
To increase the saving culture and to
decrement service.
Mixed
266
Page 5 of 7
Wereda Disaster
Risk Profile
Data_Collected_Date
Region S.N.N.P
Zone GAMO GOFA
Selected Indicator
Capacity: Community Based Organizations in the Wereda
Name_Of_Organization
Est._Year
Formal/Informal
Fruit and Vegetable Development
Saving and Credit Cooperative
2008
2003
Formal
Formal
Ekub
2001
Informal
Self help
Kebele Name WOYE BARENA
Waye Baren Irish Potatoes
Multiplication Association
Waye Barena Saving and Credit
Cooperative
Degaba Etfruit Cooperative
Kebele Name YAYEKE
Karkore Saving and Credit
Cooperative
Zebra Mining Construction
Association
Beruh Tesfa
Kebele Name ZALA BARANA
2002
2006
2008
1998
2005
2005
2005
Informal
Formal
Formal
Formal
Formal
Formal
Formal
National Disaster Risk Management
Commission (NDRMC)
Tuesday, November 5, 2019
Wereda MIRAB ABAYA
Type of Members
Mixed
All age group, except
children
Youth
Women
Activity
Reduce jobless.
Collecting money and give for members to
create job opportunity.
Save money and getting loan service for
members.
All groups
All groups
All groups
All groups
Youth
Youth
267
Page 6 of 7
Wereda Disaster
Risk Profile
Data_Collected_Date
Region S.N.N.P
Zone GAMO GOFA
Selected Indicator
Capacity: Community Based Organizations in the Wereda
Name_Of_Organization
Est._Year
Formal/Informal
Equb
Edir
Ediget Saving and Credit
Cooperative Association
Irish Potato Primary seed
multiplication Cooperative
Association
Kebele Name ZALA GUTESHA
Credit and Saving Cooperatives
2001
1999
2004
2005
1989
Informal
Informal
Formal
Formal
Formal
Ekub
Edir
Informal
Informal
National Disaster Risk Management
Commission (NDRMC)
Tuesday, November 5, 2019
Wereda MIRAB ABAYA
Type of Members
Farmers group
Farmers group
Farmers group
Farmers group
Elder, productive
group, women
productive group
All except children
Activity
Contribution of money.
Social interaction.
Save money and loan activity.
Member were supply potato seed for their
asssocition stored than during plantation
they sell farming production.
Credit or give loan for their members.
For seasonal purpose.
Helping each other at the disaster time.
268
Page 7 of 7
Data_Collected_Date
Region
Zone
Wereda
Tuesday, November 5, 2019
Selected Indicator
Supporting Agencies against Disasters - Percentage of households by supporting
institutions to handle or recover from disaster damages
Supporting Agencies Against Disasters
Response_Percentage
269
Page 1 of 1
Data_Collected_Date
Region S.N.N.P
Zone GAMO GOFA
Tuesday, November 5, 2019
Wereda MIRAB ABAYA
Selected Indicator
Types of support received by households during disasters
Type of Support Provided By Supporting Agencies
Response_Percentage
Emergency aid (food, water, shelter, etc.)
13.44
Capital for re-construction of house and property
5.90
Access to loan for re-construction
2.95
Access to capital or loan for adaptation/protection measures
48.52
Assets such as livestock replenishment
0.98
Other
27.87
NA
0.33
Type of Support Provided By Supporting Agencies
49
28
Access to capital or loan
for adaptation/protection
measures
Access to loan for
re-construction
Assets such as livestock
replenishment
Capital for
re-construction of house
and property
Emergency aid (food,
water, shelter, etc.)
NA
0
13
Other
6
1
3
270
Page 1 of 1
Wereda Disaster
Risk Profile
Data_Collected_Date
National Disaster Risk Management
Commission (NDRMC)
Tuesday, November 5, 2019
Region S.N.N.P
Zone GAMO GOFA
Wereda MIRAB ABAYA
Selected Indicator
Government Actors in the Field of Disaster Risk Management - Government actors and their activities in the field
of Disaster Risk Managements
Government Institution
Wereda Health Office
Activity
Description
Prevention
Awareness creation.
Activity
Description
Response
Vaccinating.
Activity
Description
Activity
Description
Adaptive measures
Rooting follow-up, data analyzing, rehabilitation.
Government Institution
Wereda Water Resource Development Office
Activity
Prevention
Description
Activity
Description
Following up of drinking water, organizing or water committee, irrigation committee, mineral controlling committee, awareness and
promotion.
Preparedness
Saving money for maintenance, regularly cleaning of local/modern/irrigation channel.
Activity
Description
Activity
Response
Fair irrigation water supply by prioritize according to crop failure budget allocate for damage scheme.
Adaptive measure
271
Page 1 of 2
Wereda Disaster
Risk Profile
Data_Collected_Date
National Disaster Risk Management
Commission (NDRMC)
Tuesday, November 5, 2019
Region S.N.N.P
Zone GAMO GOFA
Wereda MIRAB ABAYA
Selected Indicator
Government Actors in the Field of Disaster Risk Management - Government actors and their activities in the field
of Disaster Risk Managements
Description
By using purifying technique drinking water, awraeness creation the non functionality of schemes, aware about biomass fuel/magedo
kotabi/
Government Institution
Wereda Women and Children Office
Activity
Prevention
Description
Activity
Description
Women and children are the most vulnerable group of the community and must develop their awareness to prevent from disaster by
participating in income generation.
Preparedness
Saving food and money to mitigate hazard effect.
Activity
Description
Activity
Description
Preparedness
In all planning activities women and children issue has to be included to reduce risk.
Adaptive measure
Increase to awareness for community.
272
Page 2 of 2
Data_Collected_Date
Tuesday, November 5, 2019
Region S.N.N.P
Zone GAMO GOFA
Wereda MIRAB ABAYA
Selected
Indicator
Non-Government Actors in the Field of Disaster Risk Management - Non-government
actors and their activities in the field of Disaster Risk Management
Non Governmental Actors
in the Wereda
Activities
World Vision Ethiopia
Provision of vaccine and medicine.
Relief support.
UNICEF
IRC
NGOs
World Vision Ethiopia
Digging shallow well fitted with hand pump
Water scheme rehabilitation, capacity building support inputs/tools.
Capacity building, logistic and financial support
Capacity building, aid to vulnerable household, asset building and generate
income activities
273
Page 1 of 1
Wereda Disaster Risk
Profile
Data_Collected_Date
National Disaster Risk Management
Commission (NDRMC)
November 05, 2019
Region S.N.N.P
Selected Indicator:
Zone
GAMO GOFA
Interventions: Community Suggestions to Development Actors
Wereda MIRAB ABAYA
Kebele Name
Type Of Disaster 1
Early Warning Indicator
Preparedness Measure
ALGAE
Water logging
High rain fall in the high land.
To cultivate the land away from the lake.
Type Of Disaster 3
Early Warning Indicator
Preparedness Measure
Livestock disease
When animals not breash well after
feeding, when the bulls become silent.
Prepare cultural and medical medicine.
Type Of Disaster 2
Early Warning Indicator
Preparedness Measure
Drought
Wind direction from east to west.
Early ploughing the land.
Type Of Disaster 4
Early Warning Indicator
Preparedness Measure
Kebele Name
Type Of Disaster 1
Early Warning Indicator
Preparedness Measure
Type Of Disaster 2
Early Warning Indicator
Preparedness Measure
ANKOBER
Flood
High rain fall at high land, climate change.
Soil and water conservation, activities would have
taken.
Drought
Delay of rain, tender sound highly, erratic rain.
Saving of product and money.
Type Of Disaster 3
Early Warning Indicator
Preparedness Measure
Type Of Disaster 4
Early Warning Indicator
Preparedness Measure
Human disease
The weather condition is simply cloudy not
rainy.
Stand by to medication or traditional
treatment.
Livestock disease
Animal were not bussed
Preparing of medicine as well as
traditional.
274
Page 1 of 10

Region S.N.N.P
Selected Indicator:
Zone
GAMO GOFA
Interventions: Community Suggestions to Development Actors
Wereda MIRAB ABAYA
Kebele Name
Type Of Disaster 1
Early Warning Indicator
Preparedness Measure
Type Of Disaster 2
Early Warning Indicator
Preparedness Measure
DELBO
Drought
During in the coping the cotton show vigorous
growing.
They cultivate their land and shift crop calendar.
Flood
Cloudy in high land area.
Due different soil and water conservation activity.
Type Of Disaster 3
Early Warning Indicator
Preparedness Measure
Type Of Disaster 4
Early Warning Indicator
Preparedness Measure
Livestock disease
Isolation of the sick livestock from the
other.
Kebele Name
Type Of Disaster 1
Early Warning Indicator
Preparedness Measure
Type Of Disaster 2
Early Warning Indicator
Preparedness Measure
DOSHE
Drought
Birds can not make shelter measly, wind
direction, selling dwellers.
Saving products, buying grain and store it.
Livestock disease
Their physical is not normal.
Traditional treatment, un usual selling of animals.
Type Of Disaster 3
Early Warning Indicator
Preparedness Measure
Type Of Disaster 4
Early Warning Indicator
Preparedness Measure
275
Page 2 of 10

Region S.N.N.P
Selected Indicator:
Zone
GAMO GOFA
Interventions: Community Suggestions to Development Actors
Wereda MIRAB ABAYA
Kebele Name
Type Of Disaster 1
Early Warning Indicator
Preparedness Measure
FARAOSA
Drought
Rain fall on set late.
Saving production.
Type Of Disaster 3
Early Warning Indicator
Preparedness Measure
Erratic rain fall
Season shifting.
Early ploughing.
Type Of Disaster 2
Early Warning Indicator
Preparedness Measure
Livestock disease
When the time is harsh the animal movement.
Storage of fodder, hay, silage.
Type Of Disaster 4
Early Warning Indicator
Preparedness Measure
Kebele Name
Type Of Disaster 1
Early Warning Indicator
Preparedness Measure
Type Of Disaster 2
Early Warning Indicator
Preparedness Measure
FETELE
Drought
Donkey eat the cotton.
Save their product.
Livestock disease
When the livestock become silent often grazing.
Traditional medicine.
Type Of Disaster 3
Early Warning Indicator
Preparedness Measure
Type Of Disaster 4
Early Warning Indicator
Preparedness Measure
276
Page 3 of 10

Region S.N.N.P
Selected Indicator:
Zone
GAMO GOFA
Interventions: Community Suggestions to Development Actors
Wereda MIRAB ABAYA
Kebele Name
Type Of Disaster 1
Early Warning Indicator
Preparedness Measure
Type Of Disaster 2
Early Warning Indicator
Preparedness Measure
PURA
Drought
Lightening and wind direction from south to
north.
They delay crop cultivation/crop calendar.
Livestock disease
When bulls become silent after grazing.
Isolate the livestock and prepare traditional
medicines.
Type Of Disaster 3
Early Warning Indicator
Preparedness Measure
Type Of Disaster 4
Early Warning Indicator
Preparedness Measure
Flood
High temperature in the low land and river
water become warm.
They belief that rain will come so they do
different soil and water conservation
activities.
Kebele Name
Type Of Disaster 1
Early Warning Indicator
Preparedness Measure
Type Of Disaster 2
Early Warning Indicator
Preparedness Measure
LAYO TERGA
Drought
When the prepared food become more sweet.
They save different crop products and planting
enset.
Livestock disease
When they erect their ears, body hair etc.
They isolate the livestock and prepare traditional
medicine form weeds and leaves.
Type Of Disaster 3
Early Warning Indicator
Preparedness Measure
Type Of Disaster 4
Early Warning Indicator
Preparedness Measure
Crop disease
When the generate grossly in first grown
stage.
They also save their crop production in
store and bought from the market others.
Flood
High heating
Soil and water conservation activities.
277
Page 4 of 10

Region S.N.N.P
Selected Indicator:
Zone
GAMO GOFA
Interventions: Community Suggestions to Development Actors
Wereda MIRAB ABAYA
Kebele Name
Type Of Disaster 1
Early Warning Indicator
Preparedness Measure
MOLLE
Drought
Rain fall onset late, rest cloud from east to west.
Saving production
Type Of Disaster 3
Early Warning Indicator
Preparedness Measure
Flood
High rain fall in the high land.
Water conservation work.
Type Of Disaster 2
Early Warning Indicator
Preparedness Measure
Livestock disease
When the time is harsh the animal movement is
cool.
Storage of fodder, hay, silage.
Type Of Disaster 4
Early Warning Indicator
Preparedness Measure
Kebele Name
Type Of Disaster 1
Early Warning Indicator
Preparedness Measure
Type Of Disaster 2
Early Warning Indicator
Preparedness Measure
MOREDA
Drought
Delay of rain fall, erratic rain fall, windy air.
Saving of product, buying of grain and store
properly.
Crop disease and pest
The weather condition becomes could not but no
rain.
Preparing chemical, reporting to local
administration.
Type Of Disaster 3
Early Warning Indicator
Preparedness Measure
Type Of Disaster 4
Early Warning Indicator
Preparedness Measure
278
Page 5 of 10

Region S.N.N.P
Selected Indicator:
Zone
GAMO GOFA
Interventions: Community Suggestions to Development Actors
Wereda MIRAB ABAYA
Kebele Name
Type Of Disaster 1
Early Warning Indicator
KOLA BANENA
Drought
Early onset of rain fall.
Type Of Disaster 3
Early Warning Indicator
Preparedness Measure
Early preparation of cultivation land.
Preparedness Measure
Type Of Disaster 2
Early Warning Indicator
Preparedness Measure
Livestock disease
When livestock is silent after grazing at nigh.
They prepare isolate traditional medicine.
Type Of Disaster 4
Early Warning Indicator
Preparedness Measure
Kebele Name
Type Of Disaster 1
Early Warning Indicator
Preparedness Measure
Type Of Disaster 2
Early Warning Indicator
Preparedness Measure
KOLA MULAT0
Drought
When the number of rate increase in home.
Save the crop production on the store.
Livestock
When the cattle erect their ear to the direction of
lake.
Daly cultivation crop calendar.
Type Of Disaster 3
Early Warning Indicator
Preparedness Measure
Type Of Disaster 4
Early Warning Indicator
Preparedness Measure
279
Page 6 of 10

Region S.N.N.P
Selected Indicator:
Zone
GAMO GOFA
Interventions: Community Suggestions to Development Actors
Wereda MIRAB ABAYA
Kebele Name
Type Of Disaster 1
Early Warning Indicator
Preparedness Measure
KORGA GERAMO
Drought
Star direction at east, erratic rain fall, delay of
rain.
Saving of products.
Type Of Disaster 3
Early Warning Indicator
Preparedness Measure
Flood
High rain fall, climate change.
Soil and water conservation have taken.
Type Of Disaster 2
Early Warning Indicator
Preparedness Measure
Animal disease
Animal were not buzzed, breathing of animal is
not normal.
Preparing of medicine modern as well as local.
Type Of Disaster 4
Early Warning Indicator
Preparedness Measure
Human disease
Highly yield produced, the weather
condition is simply cloudy.
Traditional treatment and medical.
Kebele Name
Type Of Disaster 1
Early Warning Indicator
Preparedness Measure
Type Of Disaster 2
Early Warning Indicator
Preparedness Measure
UGAYO
Drought
When lighting sound become high, they believe
that no rain.
They change sowing period.
Livestock disease
When animal become silent after grazing.
They treat the livestock traditionally by grinding
different leave types.
Type Of Disaster 3
Early Warning Indicator
Preparedness Measure
Type Of Disaster 4
Early Warning Indicator
Preparedness Measure
280
Page 7 of 10

Region S.N.N.P
Selected Indicator:
Zone
GAMO GOFA
Interventions: Community Suggestions to Development Actors
Wereda MIRAB ABAYA
Kebele Name
Type Of Disaster 1
Early Warning Indicator
Preparedness Measure
UMO LANTE
Drought
Star direction/stays at east/, wind direction, wind
blows south west to north east, erratic rain fall,
Sdaavlliinagncperoodfurcatisn, fbaulyl.ing grain from market.
Type Of Disaster 3
Early Warning Indicator
Preparedness Measure
Type Of Disaster 2
Early Warning Indicator
Preparedness Measure
Flood
Highly rain at high land sand low land, continuous
rain happen.
Combine construction, soil and water
conservation activities.
Type Of Disaster 4
Early Warning Indicator
Preparedness Measure
Kebele Name
Type Of Disaster 1
Early Warning Indicator
Preparedness Measure
Type Of Disaster 2
Early Warning Indicator
Preparedness Measure
WANKE WAGEFO
Drought
Stars is not in waster direction, when birds shown
They save crop product, they late in sowing
seeds.
Livestock disease
When their cattle breath not normal at night after
grazing and become silent.
They prepare traditional medicine to their cow
and isolate from the healthy group.
Type Of Disaster 3
Early Warning Indicator
Preparedness Measure
Type Of Disaster 4
Early Warning Indicator
Preparedness Measure
Flood
Coldness in the high land area.
They aware to protect the community
from the flood disaster.
281
Page 8 of 10
Region S.N.N.P
Selected Indicator:
Zone
GAMO GOFA
Interventions: Community Suggestions to Development Actors
Wereda MIRAB ABAYA
Kebele Name
Type Of Disaster 1
Early Warning Indicator
Preparedness Measure
Type Of Disaster 2
Early Warning Indicator
Preparedness Measure
WOYE BARENA
Drought
Erratic rain fall, delay of rain fall.
Saving of product of money early mature crop
production.
Flood
High rain fall.
Conservation of soil of water.
Type Of Disaster 3
Early Warning Indicator
Preparedness Measure
Type Of Disaster 4
Early Warning Indicator
Preparedness Measure
Animal disease
They become silent after grazing.
Isolation of health animal from diseased
animal, traditional treatment.
Kebele Name
Type Of Disaster 1
Early Warning Indicator
Preparedness Measure
Type Of Disaster 2
Early Warning Indicator
Preparedness Measure
YAYEKE
Drought
Erratic rain fall, delay of rain fall, star direction.
Saving of produce, baying grain and store it.
Livestock disease
Animal were not bussed, breathing of animals is
not normal.
Preparing of medical and traditional treatment.
Type Of Disaster 3
Early Warning Indicator
Preparedness Measure
Type Of Disaster 4
Early Warning Indicator
Preparedness Measure
Flood
High rain fall at high land, climate change.
Soil and water conservation activities
were done.
Human disease
The weather condition is simply cloudy or
no rain.
Stand by for medical and traditional
treatment.
282
Page 9 of 10

Region S.N.N.P
Selected Indicator:
Zone
GAMO GOFA
Interventions: Community Suggestions to Development Actors
Wereda MIRAB ABAYA
Kebele Name
Type Of Disaster 1
Early Warning Indicator
ZALA GUTESHA
Drought
Lighting in eastern direction.
Type Of Disaster 3
Early Warning Indicator
Preparedness Measure
They can prepare for cultivation.
Preparedness Measure
Type Of Disaster 2
Early Warning Indicator
Preparedness Measure
Livestock disease
Their smooth, rumination, when the river warm.
There is rain.
Type Of Disaster 4
Early Warning Indicator
Preparedness Measure
Kebele Name
Type Of Disaster 1
Early Warning Indicator
Preparedness Measure
Type Of Disaster 2
Early Warning Indicator
Preparedness Measure
ZALA BARANA
Drought
Wind direction, looking stars.
Saving produce.
Crop pest and disease
Windy weather condition.
Buying chemical, reporting to wereda
developmental agent, rural development office.
Type Of Disaster 3
Early Warning Indicator
Preparedness Measure
Type Of Disaster 4
Early Warning Indicator
Preparedness Measure
283
Page 10 of 10

Wereda Disaster Risk
Profile
Data_Collected_Date
Region S.N.N.P
Zone
GAMO GOFA
National Disaster Risk Management
Commission (NDRMC)
Tuesday, November 5, 2019
Wereda MIRAB ABAYA
Selected Indicator
Wereda Strengths, weaknesses, opportunites and treats (SWOT) Analysis
Kebele Name
ALGAE
ANKOBER
DELBO
DOSHE
FARAOSA
Strength
- Crop production saving
for harsh time.
- Challenge facing
- Social interaction
- Mutualism
- Social interaction is very
high.
- Actively participate in
development issues.
- High social interaction.
- Active community
participation
- Cultural crime mitigation
- Cope to disaster specially
drought.
- Social interaction is high
strength full
- High social interaction
- Readiness
- Reactive and active
- Well planned
Weakness
- Lack of awareness.
- Lack of awareness.
- dependency.
- Lack of awareness
- Weak use of opportunities
in the area.
- Lack of awareness
- Deforestation
- Lack of awareness
- Illiteracy
Opportunity
- Transportation
- Telephone service
- Electric service
Threat
- Increment of lake Abaya
- Lack of fund.
- Road access.
- Health post.
- School.
- Market accessibility
- Road
- Electric power
- Governmental institution
- Cash crop
- God option to job opportunity
if they awarded.
- Electric line extension.
- Pure water access
- Road access
- Road
- Governmental on situation.
- Electric access
- Water supply
- Market inflection.
- Drought.
- Conflict /criminal/,
unemployment increment.
- Lack of good governance
- Market controlling
- Lack of fund
- Shortage of rain fall.
- Drought
- Economic hardship, lack
of fund.
- Out migration specially
youth.
- Drought
- Lack of sufficient
funding.
- Livestock disease
284
Page 1 of 5

Wereda Disaster Risk
Profile
Data_Collected_Date
Region S.N.N.P
Zone
GAMO GOFA
National Disaster Risk Management
Commission (NDRMC)
Tuesday, November 5, 2019
Wereda MIRAB ABAYA
Selected Indicator
Wereda Strengths, weaknesses, opportunites and treats (SWOT) Analysis
Kebele Name
FETELE
PURA
LAYO TERGA
MOLLE
MOREDA
Strength
- Active community
participation
- High social interaction
- Lack of awareness
- Active community
participation in
development activity
- Good conflict resolution
culture
- Receptiveness
- Active community
participation in
development activity.
- In meeting
- Out of crime
- Respective/high social
interaction.
- People actively
participate soil and water
conservation
- High social interaction.
- Mitigation measure taken
by community.
- Adaptive action taken by
community.
Weakness
- Lack of awareness
- Illiterate
- Lack of awareness
- Carelessness
- Lack of awareness
- Lack of plan to prevent
the disaster
- Deforestation
- Lack of awareness
- Dependency
Opportunity
- Road
- Pure water
- Road
- Electric power
- Pure water supply
- Presence of governmental
institution.
- Road
- Governmental institution
- Market access
- Road
- Topography of the land
- Road access
Threat
- Drought
- Livestock disease
- Lake increment cause
shortage of cultivation
land.
- Shortage of rain fall.
- Lack of water pump
supply
- Drought
- Crop disease
- Livestock disease
- Lack of funding
- Lack of funding.
- Soil erosion.
- Migration.
285
Page 2 of 5

Wereda Disaster Risk
Profile
Data_Collected_Date
Region S.N.N.P
Zone
GAMO GOFA
National Disaster Risk Management
Commission (NDRMC)
Tuesday, November 5, 2019
Wereda MIRAB ABAYA
Selected Indicator
Wereda Strengths, weaknesses, opportunites and treats (SWOT) Analysis
Kebele Name
KOLA BANENA
KOLA MULAT0
KORGA GERAMO
UGAYO
Strength
- Crop production for harsh
period.
- Change facing.
- Social interaction.
- Mutual respect
- Active community
participation soil and water
conservation.
- High social interaction
- Most of youth were made
association of work
strengthens.
- Area enclosed and keep
it by regulation
- Active participating/hard
working.
UMO LANTE
- Soil and water
conservation actively
participate
- High social interaction
- Cooperation have been
strength full
Weakness
- Lack of awareness.
- Lack of awareness
- Dependency
- Lack of awareness
- Illiteracy
- Youth are not active in
agriculture
- Lack of awareness
Opportunity
- Transportation.
- Telephone service.
- Electric power.
- Road
- Market access
- Environmental institution
- Lake Abaya
- Road access
- Minerals access
- Electric power
- Irrigation access, road
access.
- Pure water access
- Electric access
- Lake access
Threat
- Lack of funding.
- Lake increment.
- Sudden break of animal
disease.
- Flood
- Drought
- Animal disease
- Lack of fund.
- Conflict
- Lack of funding,
increased severity of
disasters, shortage of rain
- Land use policy, resource
conflict
- Increment of water
level of Lake Abaya
286
Page 3 of 5
Wereda Disaster Risk
Profile
Data_Collected_Date
Region S.N.N.P
Zone
GAMO GOFA
National Disaster Risk Management
Commission (NDRMC)
Tuesday, November 5, 2019
Wereda MIRAB ABAYA
Selected Indicator
Wereda Strengths, weaknesses, opportunites and treats (SWOT) Analysis
Kebele Name
WANKE WAGEFO
WOYE BARENA
YAYEKE
ZALA GUTESHA
Strength
- Actively community
participation, sharing of
resource, have cultural
conflict resolution rules
- Absence of robbers
protect the community from
the danger
- Hardworking
- Conflict resolutions
method
- Active participation of
community.
- High social interaction
- Sharing of work
- Social interaction
- Active participation in
watershed management.
- Sharing work group work
- Active in community
participation.
- Hard working.
- Mutual respect
Weakness
- Social problem
- Dependency
- Lack of awareness
- Lack of awareness, lack of
job opportunities in the
community.
- Lack of creativeness
Opportunity
- Accessibility of market
- Road
- Electric power
- Increment of governmental
institution
- Near health center.
- 1 - 5 association
- Road access.
- Road construction
- Telecom access
- Health post
- Road
- Environmental institution.
- Electric current supply.
- Pure water supply.
Threat
- Shortage of cultivation
land, increment of
population number
- Lack of sufficient
capacity to protect risk.
- Lack of rain fall
- Lack of funding.
- Lack of funding
- Drought due to climate
and weather change.
- Crop disease.
- Livestock disease.
- Soil erosion, lack of
funding, landslide
287
Page 4 of 5

Wereda Disaster Risk
Profile
Data_Collected_Date
Region S.N.N.P
Zone
GAMO GOFA
National Disaster Risk Management
Commission (NDRMC)
Tuesday, November 5, 2019
Wereda MIRAB ABAYA
Selected Indicator
Wereda Strengths, weaknesses, opportunites and treats (SWOT) Analysis
Kebele Name
ZALA BARANA
Strength
- High social interaction.
- Construction activities.
- Afforestation
- Cooperation
Weakness
- Lack of awareness.
- Dependency
Opportunity
- Road access.
- Health center access.
Threat
- Climate change
- Lack of funding.
- Drought
- Conflict
288
Page 5 of 5