


NATIONAL
DISASTER RISK MANAGEMENT COMMISSION
(NDRMC)
WEREDA DISASTER RISK PROFILE (WDRP)
REGION: SNNP
ZONE: SOUTH OMO
WEREDA: BENA TSEMAY
December, 2020
Addis Ababa

About the National Disaster Risk Management Commission (NDRMC)
The National Disaster Risk Management Commission (NDRMC) was reestablished in
December 2015 and recognized by an act of Council of Ministers (Regulation No.
363/2015) as an autonomous Federal Government office mandated to conduct
appropriate activities for the comprehensive implementation and realization of the
objectives of the National Disaster Risk Management Policy and Strategy and to
coordinate, monitor and provide appropriate support with respect to activities
carried out by the lead sector institutions.
Address: Kirkos Sub-city Behind Dembel City Center, Addis Ababa, Ethiopia.
P.O.Box: 5686
Tele: 0115524259/4272
Website: www.dppc.gov.et
© 2020 National Disaster Risk Management Commission. All rights reserved
Printed in Addis Ababa, Ethiopia.
Citation- This Document May be Cited as Follows:
National Disaster Risk Management Commission (2020), Bena Tsemay Woreda
Disaster Risk Profile, Addis Ababa, Ethiopia.

PREFACE
Ethiopia is well aware of the impact that disasters can have on the
development goals that we are rigorously pursuing through our
Growth and Transformation Plan II. With this recognition we started
a paradigm shift a few years ago, largely triggered by the revised
National Policy and Strategy on Disaster Risk Management.
To make the DRM programme implementation in the country well-informed, a
comprehensive information management system is required. We have been undertaking
a comprehensive risk assessment exercise under which Disaster Risk Profiles are being
prepared for each district and at sub-district levels in the country.
This Wereda Disaster Risk Profile establishes an extensive database on disaster risk
elements that will help decision makers at all levels to be better informed at community
and Wereda level about the characteristics of potential hazards, their potential
exposure, vulnerabilities of communities, capacities and that can also be an input for
Wereda Disaster Risk Reduction Plans and area specific early warning tools.
Wereda Disaster Risk Profiles developed are publically available here for the use of all
development partners and government sectors at all levels. Also, other data sources of
NDRMC, such as Desinventar, Livelihood Baseline and the Early Warning information will
be integrated and harmonized with this Information Management System.
Finally, we need to acknowledge the support of partners who have funded this
programme and we also look for the support of donors and all development partners in
order to achieve the ambitious indicators of this risk information and providing every
district with the disaster risk profile and their respective risk-informed plans.
H.E. Ato Mitiku Kassa
Commissioner
National Disaster Risk Management Commission (NDRMC)
The Federal Democratic Republic of Ethiopia (FDRE)

PREFACE
Woreda Disaster Risk Profiling (WDRP) is a government owned
programme undertaken by the National Disaster Risk
Management Commission (NDRMC) in collaboration with regional
DRM offices and development partners to provide baseline
information for disaster risk management practices and
activities in the country. The programme is designed by taking
into account the experiences gained from the implementation of pervious strategies
and actions like the Hygo Framework for Action (2000-2015) and the Sendai Framework
for Disaster Risk Reduction (2015-2030).
WDRP is composed of diversified indicators including hazard related issues, crop and
livestock production, landholding and environmental issues, human and livestock health
issues, education and social issues at wereda and kebele level. It provides basic and
detailed indicators with both quantitative and qualitative information which obtained
from both primary and secondary data sources.
Moreover, two pages summary of profiles is also prepared to help users easily
understand WDRP results for each wereda without going into detail for all indicators.
In addition to this booklet, developed profiles are uploaded on WDRP website
(http://profile.ndrmc.gov.et) to be viewed by all users; we encourage all DRM actors
at all levels to use this profile as baseline information for all DRM initiatives.
This WDRP booklet was produced through exemplary collaboration of all concerned
bodies and I would like to give my deepest gratitude to all who directly or indirectly
contribute for the success of the programme particularly for data enumerators and
supervisors, data encoders and profile development teams, consultants and advisors,
partner ministries and all DRM stakeholders.
Abraham Abebe
Director
Disaster Risk Reduction and Rehabilitation Directorate (DRRRD)
National Disaster Risk Management Commission (NDRMC)
Contents
No. Indicator Name
Page
General Information
I.
Preface
II.
Wereda Location in Ethiopian Map
III.
Methodology
IV.
Summary Profile
Hazard Related Characteristics
1
1
Biological Hazards of the Wereda
2
2
Geological Hazards of the Wereda
3
3
Hydro Metrological Hazards of the Wereda
4
4
Socio Economic Hazards of the Wereda
5
5
Technological Hazards of the Wereda
6
6
Disaster Characteristics By Kebele
7
7
Hazards: Conflict as an Issue
11
8
Hazard Situation During Last Disaster - Characteristics of most recent disaster that
affected the community
12
9
Frequency of Disaster Occurrence
13
10
Household Exposure to Hazards
14
11
Months of Occurrence of Frequent Disasters
15
12
Conflicts: Perception of households on conflict issues - Is conflict an issue in this
community?
16
13
Conflicts: Perception of households on conflict issues - Who do you turn to in case
of a conflict?
17
14
Losses from Disasters - Losses from all disasters (household response in %)
18
15
Losses from Disasters - Main Losses by Type of Disasters (household response in %) 19
16
Losses from Disasters - Secondary Losses by Type of Disasters (household response
in %)
22
17
Seasonal Calendar for Hazards, Activities and Income Level By Kebele
25
No. Indicator Name
Page
Infrastructure Access Characteristics
18
Physical Vulnerability: Access to Roads & Urban Centres - Households access to
road and urban centre
30
19
Physical Vulnerability: Access to Electricity - Households’ access and utilization of
electricity
31
20
Physical Vulnerability: Type of Dwelling Units - Households’ type of dwelling houses 32
Socio Demographic Characteristics
21
Economic Vulnerability: Level of Migration - Migration level and its characteristics
by Kebele
34
22
Economic Vulnerability: Household Migration - Household migration and reason for
migration
35
23
Economic Vulnerability: Household Migration - Disasters as a triggering factor for
migration (households response in %)
36
24
Demography: Population Trends and Ethnic Groups
37
25
Social Vulnerability: Household Demographic Characteristics - Demographic
characteristics of households
38
26
Social Vulnerability: Level of Educational Attainment - Education status of
household members
39
27
Social Vulnerability: Gender Parity - Gender parity in education level (7+ years)
and household heading
40
Environmental Characteristics
28
Environmental Situation: Environmental Problems - Major environmental problems
by Kebele
42
29
Environmental Situation: Deforestation - Observed changes over levels of
deforestation by the community and its problems
43
31
Environmental Situation: Natural Resources Availability - Natural resources
available and changes observed by the community
44
32
Environmental Situation: Rainfall & Temperature - Observed changes on rainfall
and temperature by the community over the last decade
46
33
Environmental Situation: Reasons for Environmental Changes
47
No. Indicator Name
Page
34
Environmental Situation: Soil Erosion - Observed changes on levels of soil erosion
by the community
48
Livelihood, Occupation and Source of food
38
Economic Vulnerability: Major Occupational Categories - Major categories of
occupation and percent of population engaged in the occupation by Kebele
50
39
Economic Vulnerability: Livelihoods - Households important sources of
livelihood (response in %)
51
40
Economic Vulnerability: Occupational Categories - Percent of population above 15
years age by occupation categories
54
41
Economic Vulnerability: Sources of Food - Households source for different food
items (response in %)
55
Crop Production
42
Hazards: Change in Crop Damages - Proportion of total crop damage (percentage
response by households)
58
43
Hazards: Change in Crop Damages - Major reasons for crop damage (percentage
response by households)
59
44
Hazards: Change in Crop Damages - Proportion of Damage for Major Crops
(percentage response by households)
60
43
Hazards: Change in Crop Damages - Reasons for Damage of Major Crops
(percentage response by households)
62
44
Agricultural Situation: Change in Crops Grown - Five major crops grown by
proportion of total cultivated land
64
45
Economic Vulnerability: Status of Agriculture - Methods of tillage, Irrigation and
other agricultural input utilization by households
65
46
Economic Vulnerability: Crops Grown - Number of crops grown by households
66
47
Economic Vulnerability: Crops Grown - Types of crops grown by households
67
48
Economic Vulnerability: Crops Grown - Proportion of households by amount of yield
of major crops (last year)
69
49
Economic Vulnerability: Crops Grown - Proportion of households by amount of yield
of major crops (Five years ago)
70
50
Environmental Situation: Land-Use other than crop production - Types of land use
other than crop production across Kebeles
72
Livestock Production
51
Agricultural Situation: Status of Livestock Disease - Change In Livestock Disease
Status By Kebele
74
No. Indicator Name
Page
52
Livestock Prevalent of Diseases & Veterinary Facility - Livestock Diseases
Prevalence
75
53
Livestock Prevalent of Diseases & Veterinary Facility - Evaluation of Access to
Veterinary Services and Livestock Drugs
76
54
Agricultural Situation: Livestock Diversity - Type of livestock and their economic
importance in the community
77
55
Economic Vulnerability: Livestock Ownership and Changes - Percentage of
households by number and type of livestock owned
78
56
Economic Vulnerability: Livestock Ownership and Changes - Households’ perception
on changes in livestock number in the last five years (response in %)
80
57
Economic Vulnerability: Livestock Ownership and Changes - Households
perception on changes in livestock number in the last five years (response in %)
81
58
Agriculture (Livestock): Pasture Availability - Households’ perception on access and
quality of pasture
83
59
Agriculture (Livestock): Pasture Availability - Households’ perception on
problematic months for pasture availability
84
60
Agriculture (Livestock): Water Availability - Households’ response on water
availability for livestock
85
61
Agriculture (Livestock): Water Availability - Households’ perception on problematic
months of water availability for livestock
86
62
Agriculture (Livestock): Water Availability - Sources of water for livestock
(households response in %)
87
Access to Markets and Credit
63
Economic Vulnerability: Proportion of Produce Sold and Market - Proportion of
crops and livestock sold from total production and markets
89
64
Economic Vulnerability: Kebele Access to Markets - Access to market by Kebele
90
65
Economic Vulnerability: Formal & Informal Transfers - Percentage of households
reporting received formal transfers
91
66
Economic Vulnerability: Formal & Informal Transfers - Percentage of households
reporting received Informal transfers
93
67
Capacity: Access to Credit Facilities - Households access to credit facilities
95
No. Indicator Name
Page
68
Capacity: Access to Credit Facilities - Percentage of households by major reasons
of borrowing money
96
69
Capacity: Access to Credit Facilities - Percentage of households by major sources
of credit
97
70
Capacity: Access to Credit Facilities - Percent of households with ability to raise
500 birr in one week
98
Health and Sanitation Characteristics
71
Household Access to Health Facilities - Where do patients go for health care?
100
72
Hazards: Health problems and changes over the last decade
101
73
Household Health Status - Households’ health condition and major health problems 102
74
Household Access to Sanitation - Percentage of households with access to different
kind of toilet facilities
103
75
Household Access to Drinking Water - Sources of drinking water for households
(response in %)
104
76
Household Access to Drinking Water - Households’ methods of treating drinking
water
105
77
Household Access to Drinking Water - Number of times households fetch water in a
week
106
78
Household Access to Drinking Water - Time taken per day to fetch water for
households
107
Coping Mechanisms and Preparedness Measures
79
Capacity: Community Preparedness against Sudden Onset Disasters
109
80
Capacity: Community Preparedness against Increase in Disaster Intensity
110
81
Capacity: Community Preparedness against Disasters
111
82
Hazard: Coping and recovering during last Disaster
112
83
Capacity: Type Community Participation
116
84
Capacity: Recovery from Losses from Disasters - Percentage of Households who
have managed to recover from losses of disasters
117
85
Capacity: Recovery from Losses from Disasters - Percentage of households
recovered from past disasters by type of Disasters
118
No. Indicator Name
Page
86
Capacity: Recovery from Losses from Disasters - Proportion of households
recovered by type of Losses
119
87
Capacity: Coping Options if More Resources Available - What coping strategy could
be adopted if more resource were available?
120
88
Capacity: Coping Strategies Adopted by Households - Percentage of households by
major type of coping strategies adopted (at least once)
121
89
Capacity: Coping Strategies Adopted by Households - Main coping strategies
adopted by households for respective disasters
123
90
Capacity: Coping Strategies Adopted by Households - Secondary coping strategies
adopted by households for respective disasters
130
91
Capacity: Coping Strategies Adopted by Households - Main coping strategies
adopted by households to recover from respective losses
133
92
Capacity: Coping Strategies Adopted by Households - Percentage of households
by frequency of main coping strategies adopted
137
93
Capacity: Alternative Livelihood Sources - Alternative livelihood sources suggested
by the community
139
Community Perception and Suggestions
94
Agricultural Situation: Access to Extension - Perception of the community on
Access to Agricultural extension Services
141
95
Agricultural Situation: Access to Inputs - Perception of the community on access
to improved agricultural inputs
142
96
Agricultural Situation: Water for irrigation - Access to water for irrigation in the
community
143
97
Agricultural Situation: Water Availability for Livestock - Water availability for
livestock in the community
144
No. Indicator Name
Page
98
Agricultural Situation: Water Availability for Livestock - Water availability for
livestock in the community
145
99
Economic Vulnerability: Change in Agricultural Situation - Households perception
on changes of crop type, size of cultivated area and crop yields
146
100
Economic Vulnerability: Change in Agricultural Situation - Households perception
on changes of crop type, size of cultivated area and crop yields
147
101
Environmental Situation: General Land Quality - Perceptions of the community
on changes in the general quality of land over a decade
148
Interventions: Community Perception on Mediums to Influence DRM Actors -
102
Community perception on the effectiveness of institutional channels to use to
149
influence DRM actors
Interventions: Community Perception on their Knowledge used in DRM Process -
103
Perception of the community on how their knowledge influences the priorities and 150
measures of DRM actors
104
Interventions: Suggestions to improve preparedness - Interventions suggested by
the community to development actors to improve preparedness in the area
151
105
Interventions: Suggestions to DRM Actors in the Area - Community suggested
measures to DRM actors in the area for effective DRM actions
153
106
Economic Vulnerability: Community Suggestions to Improve Economic Situation -
Community suggested measures to improve the economic situation of the area
154
107
Community Awareness of Disaster Risk Management System and Actors
155
Community Perception of DRM System and Actors - Perception of the community on
108
the effectiveness of DRM system in helping them to prevent, cope and recover
157
from disasters
109
Major Public Interventions Desired - Percentage of households by type of
intervention desired
158
Others
110
Capacity: Community Based Organizations in the Wereda
160
111
Supporting Agencies against Disasters - Percentage of households by supporting
institutions to handle or recover from disaster damages
161
No. Indicator Name
Page
112
Types of support received by households during disasters
162
113
Government Actors in the Field of Disaster Risk Management - Government actors
and their activities in the field of Disaster Risk Managements
163
114
Non-Government Actors in the Field of Disaster Risk Management - Non-government
actors and their activities in the field of Disaster Risk Management
164
115
Wereda SWOT Analysis
165
Supplementary Information from Secondary Sources
116
Wereda Livelihood Zone Information
166
117
Wereda General Information
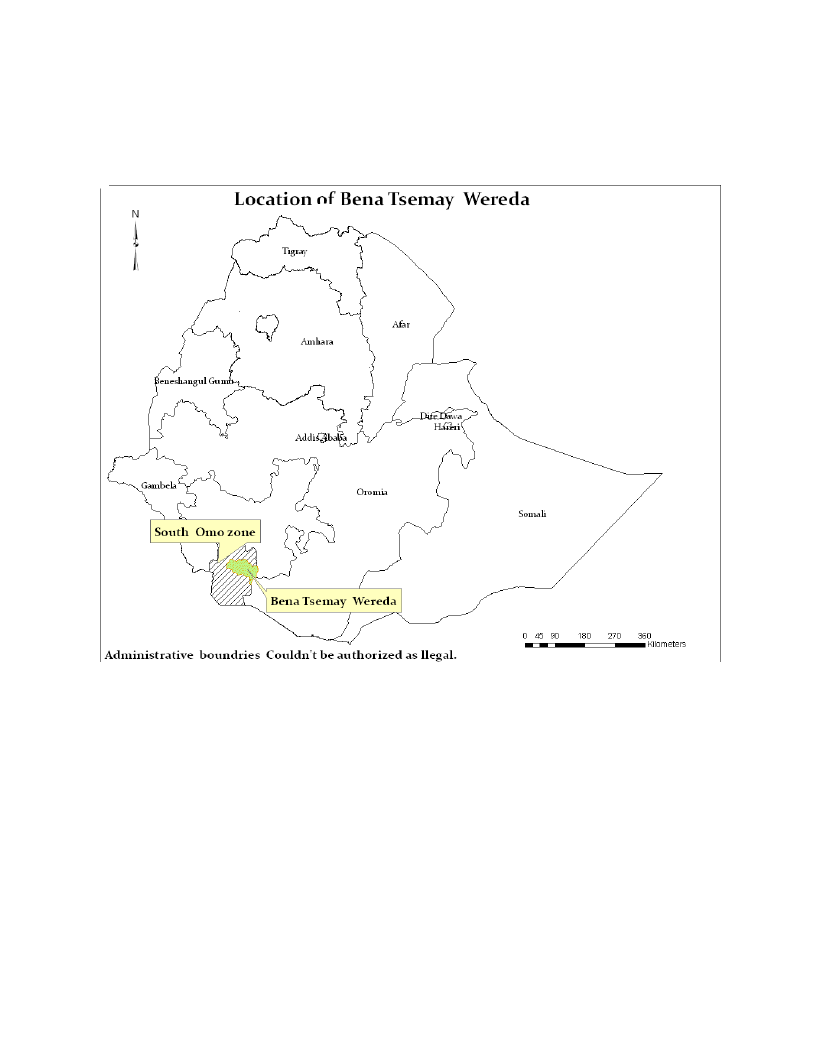
WEREDA LOCATON

METHODOLOGY
WDRP Content :
• Comprehensive information on disaster risk components
(Hazards, Vulnerability and Capacity)
• Multi-sectoral and multi-hazard information.
Research Approach:
• Mixed Approach
• Both quantitative and qualitative information
Data Sources:
• Primary Data:
Household Questionnaires: statistically significant number
(around 400 households).
Focus Groups Discussions: One per kebele
Key Informant Interviews: with major woreda level government
and non-government DRM actors
Problem Tree Analyses : to see the cause and effect of disasters
• Secondary Data:
collected relevant to WDRP indicators:
LIU, SERA Project, Risk baseline, other ministries…
Sampling Technique:
• Multistage cluster sampling
• Both Probability and Non-probability sampling
Methods of Analysis:
• Descriptive Statistics
• Textual Analysis
• Cispro and SPSS
• Automate WDRP software

WEREDA
SUMMARY DISASTER RISK PROFILE
INFORMATION
Wereda Disaster Risk Profiling Programme: SNNP
Disaster Risk Profile: Bena Tsemay Wereda
SUMMARY OF WEREDA PROFILE
LIVELIHOOD ZONE SUMMARY
Southern Agro-Pastoral Livelihood Zone
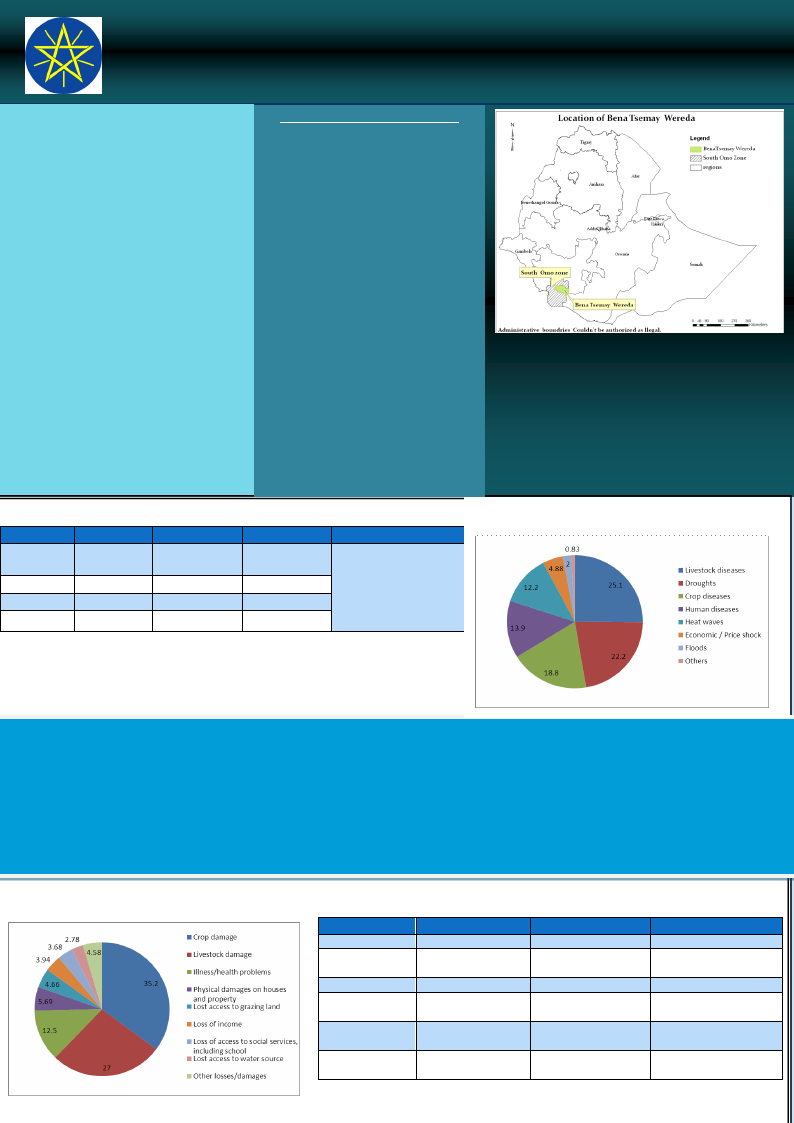
Drought is the major disaster risk in Bena
(SAP) LZ
Tsemay Wereda followed by livestock diseases
and crop pests/diseases, together affecting the
livelihood of 2/3rd of the population. Human
diseases (mainly malaria), floods (due to
overflow of rivers) and heat waves are also
This zone covers a flat lowland terrain
which was traditionally a grazing ground
and settled agriculture is a recent
phenomenon. The crops grown are
sorghum, maize, and some teff for sale. But
among the hazards indicated in the area. there is still a main dependence upon
Deforestation is the major environmental livestock and their products.
problems in the area followed by soil erosion.
However, good land quality and availability of South Omo Pastoral Livelihood Zone
rivers have been reported in the area which can
(SOP) LZ
be used for crop production.
This is a semi-arid rangeland zone in the
basin of the Omo River, and its low and
In this wereda, controlling deforestation, erratic rainfall has rendered it food
developing water sources and encouraging crop
production through supply of improved crop
varieties (cash crops and short maturing crops)
are the major interventions required. Improving
access to markets, veterinary services and other
infrastructures are also desired.
insecure. The main livestock species reared
in this livelihood zones include goats, cattle
and sheep. Although the economy is based
on livestock, there is some cultivation of
sorghum and maize on the valley bottom,
using both rainfall and irrigation. Despite
great disparities in wealth, the livelihood
patterns of all households are very similar.
MAJOR DISASTERS REPORTED IN WEREDA
Kebele
Chali
Beffo
Olo
Disaster 1
Crop pest
Drought
Drought
Disaster 2
Shortage of
pure water
Animal disease
Animal disease
Disaster 3
Human disease
Human disease
Human disease
Shaba
Drought
Animal disease Human disease
LIU Info
SAP LZ:
Drought; livestock diseases
and malaria
SOP LZ:
Drought; livestock
diseases; malaria and
market shocks
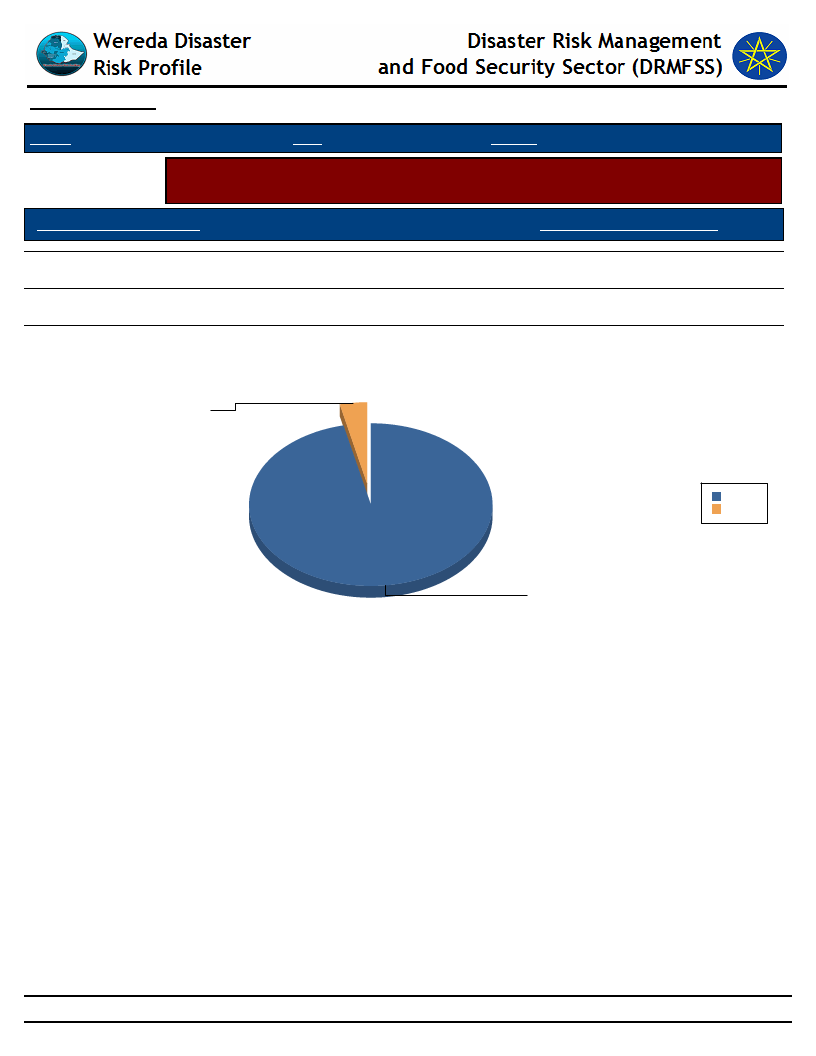
Proportion of households by major disasters suffered in the
last five years
SHORT NARRATIVE ON MAJOR DISASTERS:
Drought is one of the chronic hazards in the wereda, which results in crop failure, increased staple food prices, reduced livestock production
and reduced livestock prices (due to poor body condition). It also causes lack of water and pasture for livestock which enforce the pastoralist
community to migrate to other areas in search of pasture and water. Trypanasomiasis is the most frequent livestock disease reported by
about 88% of the households surveyed followed by Contagious Caprine Pleuropneumonia (CCPP), liverfluke and anthrax. However, the
damage of these diseases on livestock has been reported decreasing over the last decade. On the other hand, deforestation and poor saving
habit are the major weaknesses of the community in the Wereda. Poor sanitation, lack of vaccination, malnutrition and poverty are the main
causes of health problems such as malaria, chronic fever and diahhrea.
Proportion of households by type of disaster losses
Disasters
Livestock diseases
Drought
EFFECT OF DISASTERS
Loss 1
Livestock damage
Crop damage
Loss 2
Livestock damage
Crop diseases
Human diseases
Heat waves
Economic/Price
shocks
crop damage
Illness
Crop damage
Loss of access to
social services
Loss of access to social
services
Loss of access to water
sources
Physical damage on
household and property
Loss 3
Physical damage on
household and property
Physical damage on
household and property
Loss of income
Wereda Disaster Risk Profiling Programme: SNNPR
Disaster Risk Profile: Bena Tsemay Wereda
HOUSEHOLD AND COMMUNITY
VVUULLNNEERRAABBIILLIITTYY
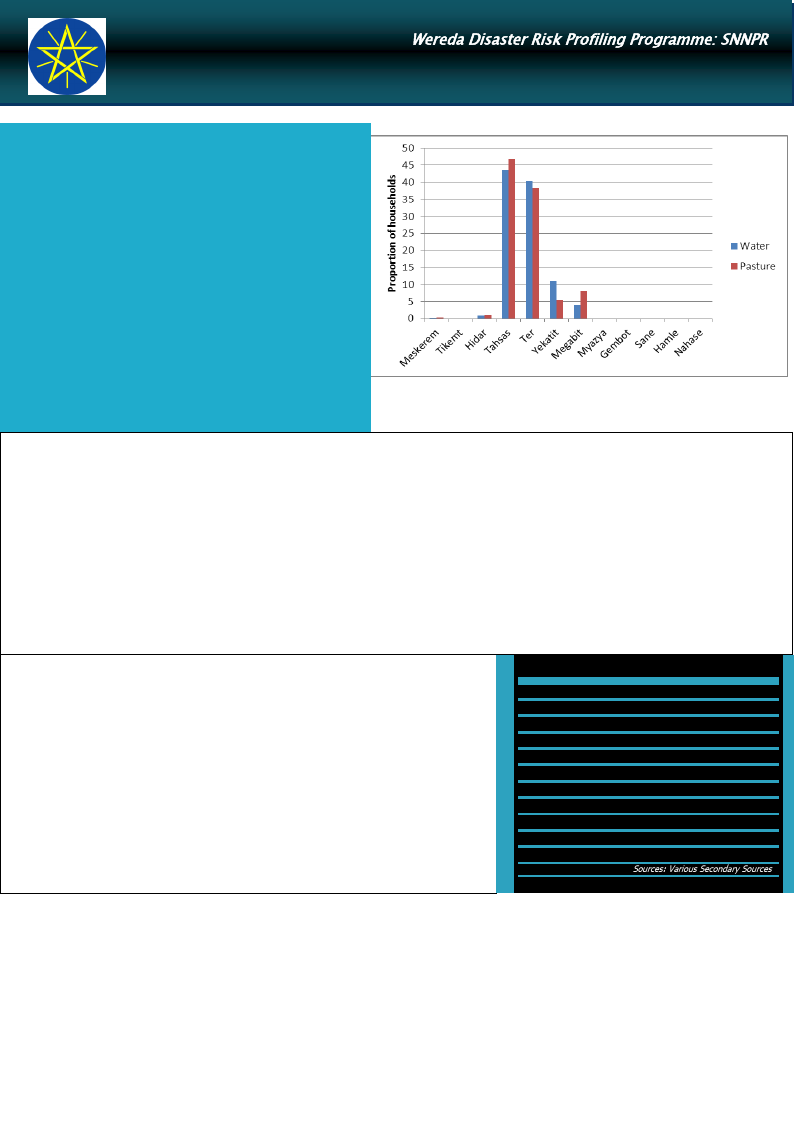
Livestock rearing is the main livelihood activity followed by crop
production and bee keeping. December and January (Tahsas and Tir)
are the most problematic months in terms of water and pasture
availability for livestock. Poor access to veterinary facilities is additional
constraint in livestock production of the area.
Most Problematic Months for Pasture & Water Availability for Livestock
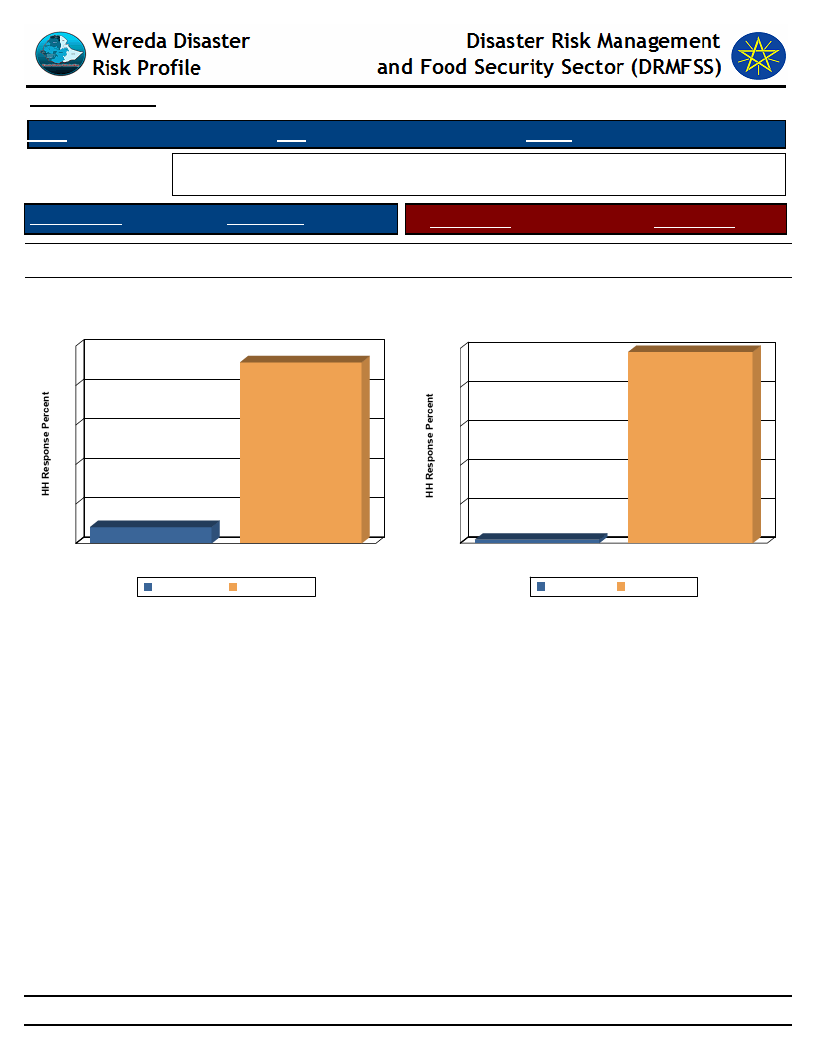
Bena Tsemay Wereda is reported to be highly exposed to hazards. From
the total households surveyed, 68% of the households received formal
transfer in the form of food aid indicating their weak capacity to
withstand disasters by their own. Poor working and saving habits,
poor farming practices and heavy dependence on livestock rearing are
the major weaknesses of the community contributing towards their
vulnerability to disasters. Moreover, malaria is the most problematic
disease in the area followed by diarrhea which affects the health of the
community throughout the year.
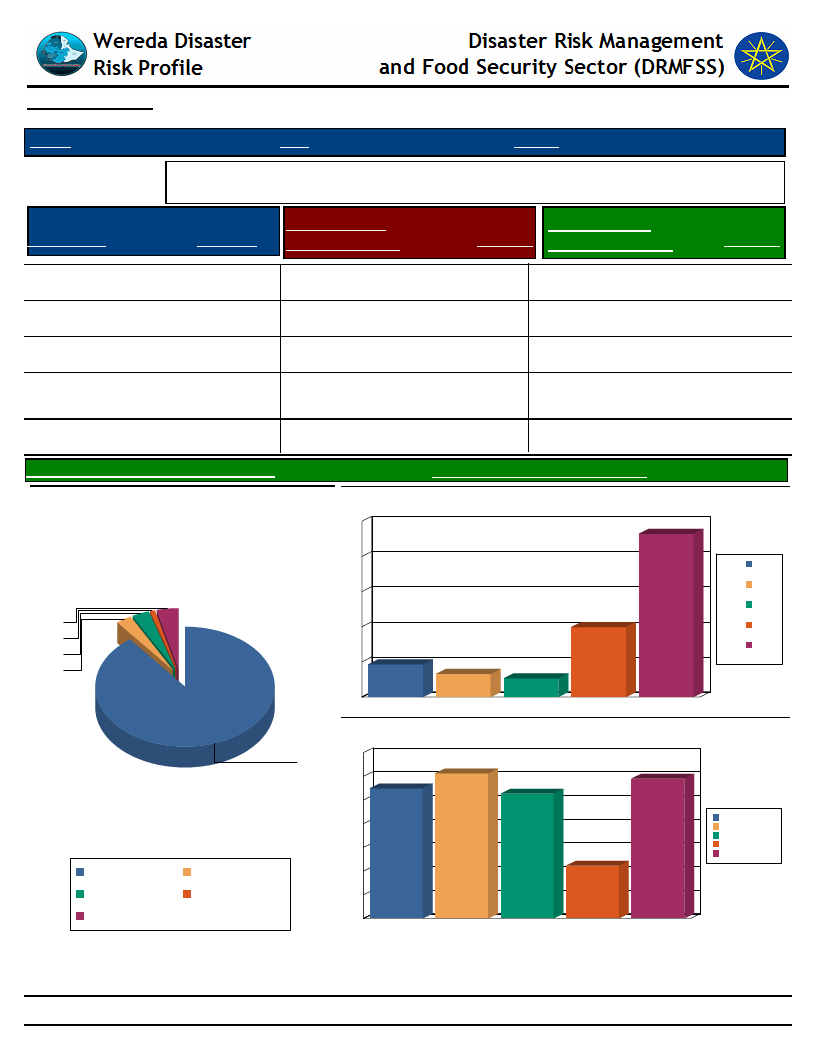
Accessibility:
Road and urban centres: About 90% of the households reported to have no road leading to their house. Average time taken to reach the nearest paved
road is more than one and half an hour. On the other hand, average time taken by households to reach the nearest urban center is 4 hours and 30
minutes.
Access to electricity is nil where no household is neither located in the community with electricity nor connected to electric power.
Poor housing condition has been reported in the area.
Access to market is generally poor, where most communities are far away from market centers. Besides, poor access to road and transport services
contributes towards marketing problems in the area.
More than 70% of the households surveyed reported poor access to veterinary facility and livestock drugs.
Access to drinking water: about 63% of the households obtain drinking water either from rivers or ponds.
Access to sanitation: 59% of the households reported to have no toilet facility, while another 40% of the households use outdoor latrine.
Access to agricultural inputs: No household is reported using fertilizers, pesticides and improved variety of seeds in crop production.
Level of Awareness and Institutional Development
The general literacy level of the Wereda is very low, where, of the total population above 7
years of age, only 7% of them are literate out of which 78% did not complete first grade level.
With regard to gender parity in education, the number of female students dominates below first
grade level. However, the number of male students dominates the corresponding female
students at all higher education levels starting from Primary School. This implies the majority of
females discontinue their education even before completing first grade and many of the
remaining females dropout as the level of education gets higher.
On the other hand, awareness of the community on disaster risk management system and
actors seem to very poor. There are various associations such as women and youth associations
which are engaged in different activities including helping each other during disasters. Presence
of FAO and other local NGOs is additional capacity in the area.
InfoBits:
Population
Sex ratio
Urban Population
Mean Altitude
Mean Slope
: 55590 (2007)
: 979 F/1000 M
: 2008 (2007)
: 1013.37 m
: 12.99%
Measles caseload
PLWHA on ART
Under-five children eligible
for supplementary feeding
: 1 (2004-2009)
:
:
Sources: Various Secondary Sources
Community Capacity to Cope
Selling more livestock than usual, borrowing of food or cash and seeking alternative or additional jobs are major coping strategies adopted by
households during disasters.
In case of availability of more resources, households opted for other coping strategies such as adaptation of economic activities to hazards season and
storage of food and other necessities
Good land quality is available in the area, which can be used for livelihood diversification towards crop production
Social cooperation is very strong in this area both during good and bad times.
About 95% of the households managed to recover from the disasters they faced which implies their strong resilience capacity.
Livestock and crop diversity: cattle, goat and sheep are the major types of livestock reared by households, while maize, sorghum, millet, teff and
sesame are the major crops grown.
WDRP Indicators
Hazard Related Characteristics
1
Wereda Disaster
Risk Profile
Disaster Risk Management
and Food Security Sector (DRMFSS)
Data_Collected_Date
Wednesday, December 3, 2014
Region S.N.N.P
Zone
SOUTH OMO
Wereda
BENA TSEMAY
Selected Indicator
Biological Hazards of the Wereda
Hazard_Name
Hazard_Sub_Type
• Trypanasomiasis
• Contagious Caprine
Pleuropneumonia (CCPP)
• Liverfluke
• Anthrax
Hazard_Sub_Type
Crop pests
Cause_Of_Hazard
Animal Disease
Micro-organism ,
Drought ,
Unknown micro organism
Crop pests
Poor management of crop field,
High rain fall
Hazard_Sub_Type
• Malaria
• Diarrhea
• Chronic fever
Human Disease
Poor sanitation,
Lack of vaccination,
Unseasonal rain fall,
Drought,
Malnutrition ,
Poverty
Effects_Of_Hazard
Death of animal,
Loss of income,
Loss of asset
Crop damage,
Loss of income,
Poverty
Death of house hold members,
Illness/health problems,
Loss of assets,
Economic crisis
Page 1 of 1
2
Wereda Disaster
Risk Profile
Disaster Risk Management
and Food Security Sector (DRMFSS)
Data_Collected_Date
Wednesday, December 3, 2014
Region S.N.N.P
Zone
SOUTH OMO
Wereda
BENA TSEMAY
Selected Indicator
Geological Hazards of the Wereda
Hazard_Name
Hazard_Sub_Type
No Geological Hazards
Cause_Of_Hazard
Geological Hazards
Effects_Of_Hazard
Page 1 of 1
3

Wereda Disaster
Risk Profile
Disaster Risk Management
and Food Security Sector (DRMFSS)
Data_Collected_Date
Wednesday, December 3, 2014
Region S.N.N.P
Zone
SOUTH OMO
Wereda
BENA TSEMAY
Selected Indicator
Hydro Metrological Hazards of the Wereda
Hazard_Name
Hazard_Sub_Type
Drought
Cause_Of_Hazard
Hydro-Meteorological Hazards
Climate change ,scarcity rain fall, high
temperature, dry wind
Effects_Of_Hazard
Crop loss, shortage of animal feed, death
of animal, hunger, loss of asset, loss of
income.
Page 1 of 1
4

Wereda Disaster
Risk Profile
Disaster Risk Management
and Food Security Sector (DRMFSS)
Data_Collected_Date
Wednesday, December 3, 2014
Region S.N.N.P
Zone
SOUTH OMO
Wereda
BENA TSEMAY
Selected Indicator
Socio Economic Hazards of the Wereda
Hazard_Name
Hazard_Sub_Type
Shortage of pure water
Cause_Of_Hazard
Social Hazards
Deforestation, drying of springs,
absence of hand pump in the area.
Effects_Of_Hazard
Illness/health problem, exposed to water
born disease, poor sanitation of
households
Page 1 of 1
5

Wereda Disaster
Risk Profile
Disaster Risk Management
and Food Security Sector (DRMFSS)
Data_Collected_Date
Wednesday, December 3, 2014
Region S.N.N.P
Zone
SOUTH OMO
Wereda
BENA TSEMAY
Selected Indicator
Technological Hazards of the Wereda
Hazard_Name
Cause_Of_Hazard
Hazard_Sub_Type
Technological Hazards
No Technological Hazards
Effects_Of_Hazard
Page 1 of 1
6

Wereda Disaster
Risk Profile
Data_Collected_Date
Region S.N.N.P
Zone SOUTH OMO
Selected Indictor: Disaster Characteristics By Kebele
Kebele Name
Disaster_Type
Common Period
Year Occured
BEFO
Droughts
Animal Disease
Drought
January,
June
1998;1999;
2000;2001;2002
Climate
change,
scarcity of rain
fall, high
temperatu
April to June
and September
to October
1998;1999;2
000;2001;20
02
1997;1999;2
000
Animal Disease
September to
November,&
March to June
1995;1996;2
000
Disaster Risk Management
and Food Security Sector (DRMFSS)
Wednesday, December 3, 2014
Wereda BENA TSEMAY
Worst_Year
Trends of
Effects
2000
Decreased
Root Causes Effects
Vulnerability
Climate
change,
scarcity of
rain fall, high
temperature
Crop loss,
shortage
of animal
feed,
death of
animal,
hunger
Coping
Strategy
Selling
livestock,
eating wild
fruits and
leaves,
drinking
cattle blood
2000
2000
Decreased
Decreased
Poor
sanitation,
mosquito
Death of
animal,
loss of
income,
loss of
asset
Illness/he
alth
problem,
death of
house
hold
member
Poor
personal and
environment
al sanitation
By buying
drugs from
private
/governmen
t drug
stores,
using
traditional
medicine
By using
traditional
medicine,
going to
health
post/health
centre
7
Page 1 of 4
Wereda Disaster
Risk Profile
Data_Collected_Date
Region S.N.N.P
Zone SOUTH OMO
Selected Indictor: Disaster Characteristics By Kebele
Kebele Name
Disaster_Type
Common Period
Year Occured
CHALI
Animal Disease
July and August
2000;2002
Droughts
December and
January
Droughts
August,
September and
October
1999;2000;2
002
Disaster Risk Management
and Food Security Sector (DRMFSS)
Wednesday, December 3, 2014
Wereda BENA TSEMAY
Worst_Year
Trends of
Effects
2000
Decreased
2002
Increased
2002
Decreased
Root Causes Effects
Vulnerability
Poor
management
of crop field,
high rain fall
Deforestation
Poor
sanitation,
lack of
vaccine,
unseasonal
rain fall
Crop
damage,
loss of
income,
poverty
Severe
shortage
of water,
illness/he
alth
problem,
exposed
to water
born
disease
Death of
household
members,
illness/he
alth
problems
Lack of hand
pump water
Coping
Strategy
By using
traditional
prevention
method
By drinking
pond water
or dirty
water, by
fetching
water from
nearby
kebele
By using
traditional
medicine,
by getting
treatment
from
private
/governmen
tal clinic
8
Page 2 of 4
Wereda Disaster
Risk Profile
Data_Collected_Date
Region S.N.N.P
Zone SOUTH OMO
Selected Indictor: Disaster Characteristics By Kebele
Kebele Name
Disaster_Type
Common Period
Year Occured
OLU
Droughts
November up
1997;1999;2
to June
000;2001
Animal Disease
Human diseases
January to
February and
May to July
January to
March and
August to
September
1999;2000
1996;1997;2
000
Disaster Risk Management
and Food Security Sector (DRMFSS)
Wednesday, December 3, 2014
Wereda BENA TSEMAY
Worst_Year
2000
Trends of
Effects
Decreased
2000
Decreased
2000
Decreased
Root Causes Effects
Vulnerability
Erratic rain
fall, dry
wind, high
temperature
Drought
Drought,
seasonal rain
fall
Severe
shortage
of water,
death of
animal,
loss of
asset, loss
of income
Death of
animal,
loss of
income
Loss of
asset,
economic
crises,
poverty
Coping
Strategy
Selling
livestock to
buy food
item,
migration
Selling
livestock to
buy
medicine
Use
traditional
medicine,
sell small
animals to
get medical
service
from health
centre
9
Page 3 of 4

Wereda Disaster
Risk Profile
Disaster Risk Management
and Food Security Sector (DRMFSS)
Data_Collected_Date
Wednesday, December 3, 2014
Region S.N.N.P
Zone SOUTH OMO
Wereda BENA TSEMAY
Selected Indictor: Disaster Characteristics By Kebele
Kebele Name
SHABA
Disaster_Type
Droughts
Common Period
January to
June
Year Occured
1997;1999;2
000;2001
Worst_Year
2000
Trends of
Effects
Decreased
Root Causes Effects
Vulnerability
Erratic rain
fall, dry
wind, high
temperature
Severe
shortage
of water,
death of
animal,
loss of
asset, loss
of income
Deforestatio
n, over
grazing land
Animal Disease
September to
November &
March to May
2000;2001;2
002
2000
Decreased
Drought,
internal and
external
parasite
Death of
livestock,
loss of
income,
poverty
Common
grazing land
Human diseases
After rainy
season
September and
February
1999;2000;2
001
1999
Decreased
IMPORTANT: The years and months mentoned in this report are according to Ethiopian Calendar (EC).
Malnutrition,
poverty, poor
sanitation
Death of
human,
loss of
asset
Poor
sanitation
Coping
Strategy
Selling
livestock to
buy food
items from
nearby
market,
eating wild
leaves and
fruits
Buying
drugs from
Clinic and
give
treatment
to the
livestock
Getting
medicine
from health
centre
10
Page 4 of 4
Wereda Disaster
Risk Profile
Data_Collected_Date
Region S.N.N.P
Zone SOUTH OMO
Selected Indictor: Hazards: Conflict as an Issue
KebeleName
CHALI
BEFO
Description_Of_Conflict
There is conflict over land
No conflict
OLU
There is conflict over land and resource
OLU
No conflict
Disaster Risk Management
and Food Security Sector
Wednesday, December 3, 2014
Wereda BENA TSEMAY
Change_In_Last_Decade
Main_Causes_Of_Conflict
No change cc
No change
11
Page 1 of 1
Wereda Disaster
Risk Profile
Disaster Risk Management
and Food Security Sector (DRMFSS)
Data_Collected_Date
Wednesday, December 3, 2014
Region S.N.N.P
Zone
SOUTH OMO
Wereda
BENA TSEMAY
Selected Indicator: Hazard Situation During Last Disaster - Characteristics of most recent disasters that affected the community
KebeleName
Types of Disasters
Hazard_Description
Effect_Of_Disaster
Most_Severly_Affected
Reason
CHALI
BEFO
OLU
SHELELUKA
Human disease
(measles)
Drought
Drought
Drought
The disease happened in the form of
outbreak and it mainly attacked
children
It affects the kebele for 4 months
It creates massive loss both in animal
and crop
It brings massive effect on the life of
the community and attacks the whole
kebele for 6 months
Death of children,
illness/health problem
and malnutrition
Drying of water
sources ,crop failure,
hunger and death of
livestock
Poverty, hunger
Death of animal, crop
failure, loss of asset
and loss of income
Children
The poor, women,
children and elders
The poor, women,
children and elders
The poor, women,
children
Children
Low capacity to
resist drought
Low capacity to
resist drought
Low capacity to
resist drought
12
Page 1 of 1
Wereda Disaster
Risk Profile
Data_Collected_Date
Disaster Risk Management
and Food Security Sector (DRMFSS)
Wednesday, December 3, 2014
Region S.N.N.P
Zone SOUTH OMO
Selected Indictor: Frequency of Disaster Occurrence
Wereda BENA TSEMAY
Conflicts
Crop diseases
Droughts
Economic / Price shock
Floods
Frost / Cold waves
Heat waves/ High temp
Heavy Rain
Human diseases
Landslides
Livestock diseases
Road Accident
25.00
3.00
27.00
46.00
31.00
6.00
7.00
17.00
28.00
10.00
2.00
24.00
10.00
25.00
25.00
63.00
16.00
10.00
20.00
27.00
20.00
39.00
47.00
50.00
17.00
29.00
35.00
60.00
100.00
18.00
80.00
45.00
100.00
21.00
100.00
13
Page 1 of 1
Wereda Disaster
Risk Profile
Data_Collected_Date
Disaster Risk Management
and Food Security Sector (DRMFSS)
Wednesday, December 3, 2014
Region
S.N.N.P
Zone
SOUTH OMO
Selected Indictor:
Household Exposure to Hazards
Wereda
BENA TSEMAY
Disaster Type
Droughts
Floods
Landslides
General_Exposure
22.40
2.26
0.04
Last_Five_Years_Exposure
22.20
2.00
0.04
Crop diseases
Livestock diseases
Human diseases
Storms / Cyclone/hail storm
Heavy Rain
Heat waves/ High temp
Conflicts
18.50
23.10
15.60
0.04
0.25
13.00
0.33
18.80
25.10
13.90
0.22
0.04
12.20
0.18
Economic / Price shock
Forest Fires
Road Accident
4.10
4.88
0.08
0.04
0.29
0.31
14
Page 1 of 1
Wereda Disaster
Risk Profile
Data_Collected_Date
Region S.N.N.P
Selected Indictor:
Zone SOUTH OMO
Months of Occurrence of Frequent Disasters
Disaster Risk Management
and Food Security Sector
Wednesday, December 3, 2014
Wereda BENA TSEMAY
Conflicts
Crop diseases
Droughts
Economic / Price shock
Floods
Heat waves/ High temp
Heavy Rain
Human diseases
Landslides
Livestock diseases
50.00
50.00
32.80
0.76
4.80
6.82
5.81
8.59
2.78
15.00
15.70
2.02
3.28
1.52
16.50
11.03
13.70
36.50
0.24
1.68
7.70
9.83
1.44
0.24
1.20
3.95
11.84
5.26
9.21
1.32
5.30
5.26
1.32
1.32
55.30
61.50
2.56
7.69
7.69
10.00
2.56
5.13
2.56
7.81
8.20
18.80
39.80
0.78
1.95
7.40
13.30
0.78
1.17
25.00
75.00
20.30
2.95
4.43
5.90
4.06
5.54
7.38
10.00
31.40
3.32
2.58
2.21
100.00
13.90
1.98
11.11
16.70
20.60
0.40
5.36
13.00
9.52
5.75
1.19
0.99
15
Page 1 of 1
Wereda Disaster
Risk Profile
Disaster Risk Management
and Food Security Sector (DRMFSS)
Data_Collected_Date
Wednesday, December 3, 2014
Region S.N.N.P
Zone SOUTH OMO
Wereda BENA TSEMAY
Selected Indictor:
Conflicts: Perception of households on conflict issues - Is conflict an issue in this
community?
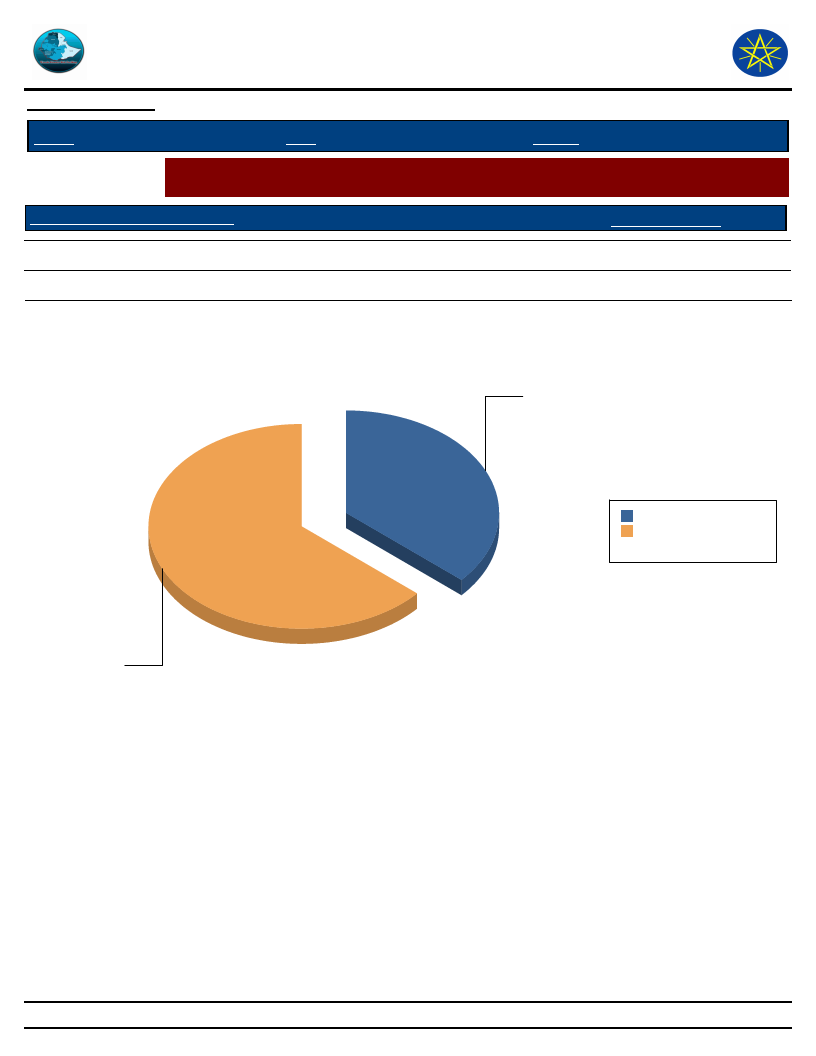
Is Conflict an Issue in Community?
Response_Percent
1 Yes
2 No
36.40
63.60
Is Conflict an Issue in Community?
1 Yes
36.4
2 No
63.6
1 Yes 36.4 36.4%
2 No 63.6 63.6%
Total: 100 100.0%
16
Page 1 of 1
Wereda Disaster
Risk Profile
Data_Collected_Date
Disaster Risk Management
and Food Security Sector (DRMFSS)
Wednesday, December 3, 2014
Region S.N.N.P
Zone SOUTH OMO
Wereda BENA TSEMAY
Selected Indictor:
Conflicts: Perception of households on conflict issues - Who To Turn To in case of
Conflict?
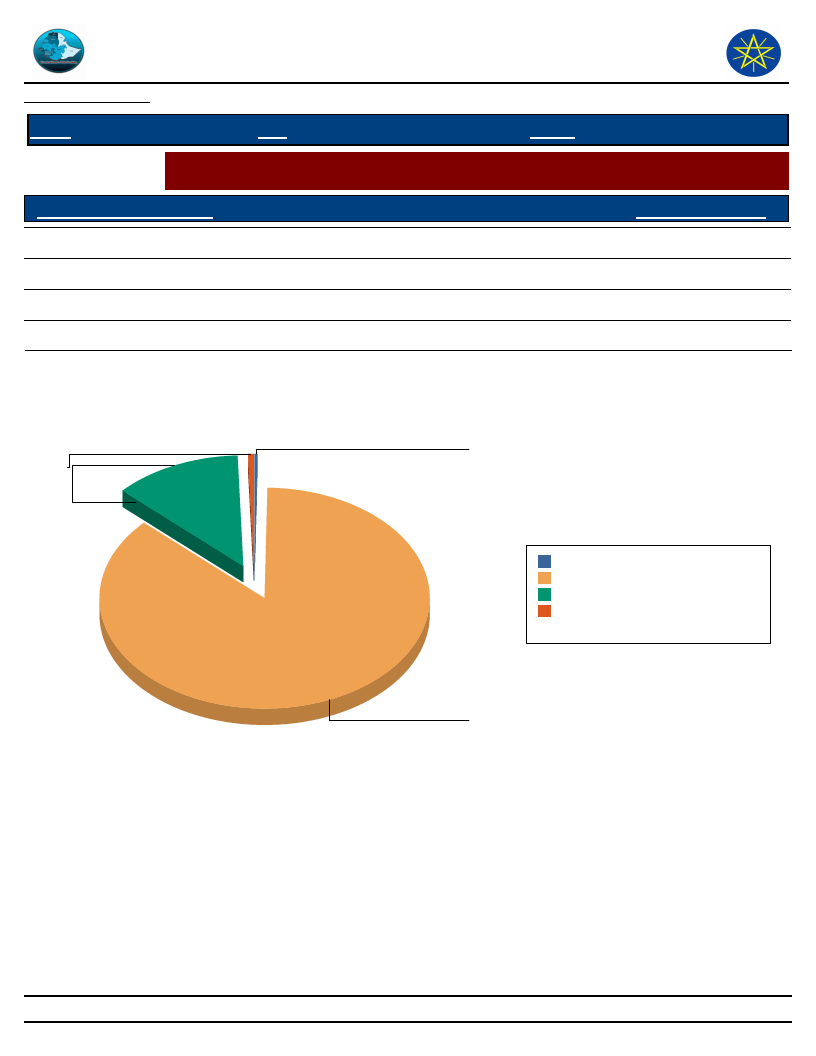
Who To Turn During Conflict?
Response_Percentage
Family members
12.50
Elders
86.60
Amakaris
0.30
Other
0.60
Who To Turn During Conflict?
Other
1
Family members
13
Amakaris
0
Amakaris
0 0.3%
Elders
87 86.6%
Family members 13 12.5%
Other
1 0.6%
Total:
100 100.0%
Elders
87
17
Page 1 of 1

Wereda Disaster
Risk Profile
Data_Collected_Date
Disaster Risk Management
and Food Security Sector (DRMFSS)
Wednesday, December 3, 2014
Region S.N.N.P
Selected Indictor:
Type of Loss
Zone SOUTH OMO
Wereda BENA TSEMAY
Losses from Disasters - Losses from all disasters (household response in %)
Main_Loss_Percent
Secondary_Loss_Percent
Crop damage
Livestock damage
Illness/health problems
Physical damages on houses and property
Lost access to grazing land
Loss of income
Loss of access to social services, including school
Lost access to water source
Loss of savings
Death of household members
Had to flee/change residence area
Other losses/damages
35.20
27.00
12.50
5.69
4.66
3.94
3.68
2.78
1.75
1.17
1.03
0.63
7.03
10.00
4.14
3.61
7.37
45.40
10.80
4.14
4.14
1.01
0.58
1.69
18
Page 1 of 1
Wereda Disaster
Risk Profile
Data_Collected_Date
Disaster Risk Management
and Food Security Sector (DRMFSS)
Wednesday, December 3, 2014
Region S.N.N.P
Selected Indictor:
Type of Loss
Zone SOUTH OMO
Wereda BENA TSEMAY
Losses from Disasters - Main Losses by Type of Disasters (household response in %)
Type of Disasters which mainly caused Listed Losses
Crop damage
Death of household
members
Had to flee/change
residence area
Illness/health problems
Livestock damage
19
Page 1 of 3
Wereda Disaster
Risk Profile
Data_Collected_Date
Disaster Risk Management
and Food Security Sector (DRMFSS)
Wednesday, December 3, 2014
Region S.N.N.P
Selected Indictor:
Type of Loss
Zone SOUTH OMO
Wereda BENA TSEMAY
Losses from Disasters - Main Losses by Type of Disasters (household response in %)
Type of Disasters which mainly caused Listed Losses
Loss of access to social
services, including
school
Loss of income
Loss of savings
Lost access to grazing
land
Lost access to water
source
20
Page 2 of 3
Wereda Disaster
Risk Profile
Data_Collected_Date
Disaster Risk Management
and Food Security Sector (DRMFSS)
Wednesday, December 3, 2014
Region S.N.N.P
Selected Indictor:
Type of Loss
Zone SOUTH OMO
Wereda BENA TSEMAY
Losses from Disasters - Main Losses by Type of Disasters (household response in %)
Type of Disasters which mainly caused Listed Losses
Other losses/damages
Physical damages on
houses and property
21
Page 3 of 3

Wereda Disaster
Risk Profile
Data_Collected_Date
Disaster Risk Management
and Food Security Sector (DRMFSS)
Wednesday, December 3, 2014
Region S.N.N.P
Zone SOUTH OMO
Wereda BENA TSEMAY
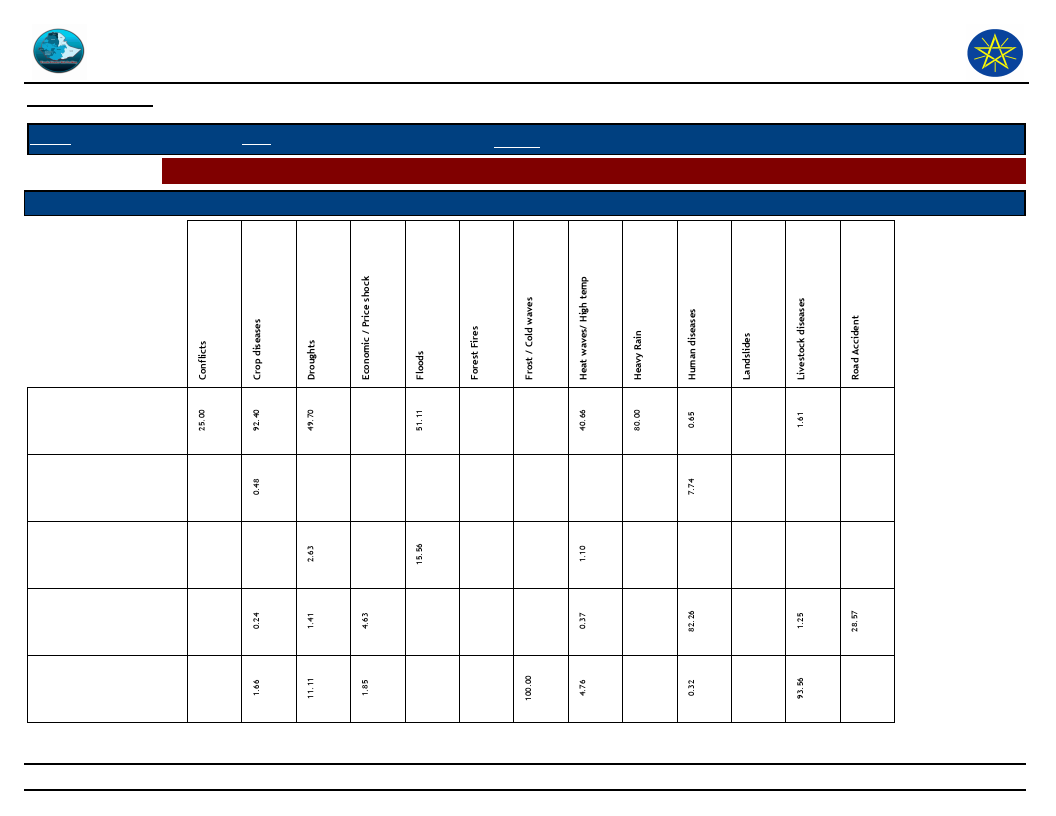
Selected Indictor: Losses from Disasters - Secondary Losses by Type of Disasters (household response in %)
Type of Loss
Type of Disasters which caused Listed Secondary Losses
Crop damage
Death of household
members
Had to flee/change
residence area
Illness/health problems
Livestock damage
4.85
15.81
2.02
14.29
1.02
2.02
0.43
21.43
25.00
9.40
3.03
11.90
25.00
2.04
28.42
4.04
4.76
100.00
22
16.60
1.28
21.28
0.95
14.29
3.06
1.14
100.00
10.20
1.71
Page 1 of 3
Wereda Disaster
Risk Profile
Data_Collected_Date
Disaster Risk Management
and Food Security Sector (DRMFSS)
Wednesday, December 3, 2014
Region S.N.N.P
Zone SOUTH OMO
Wereda BENA TSEMAY
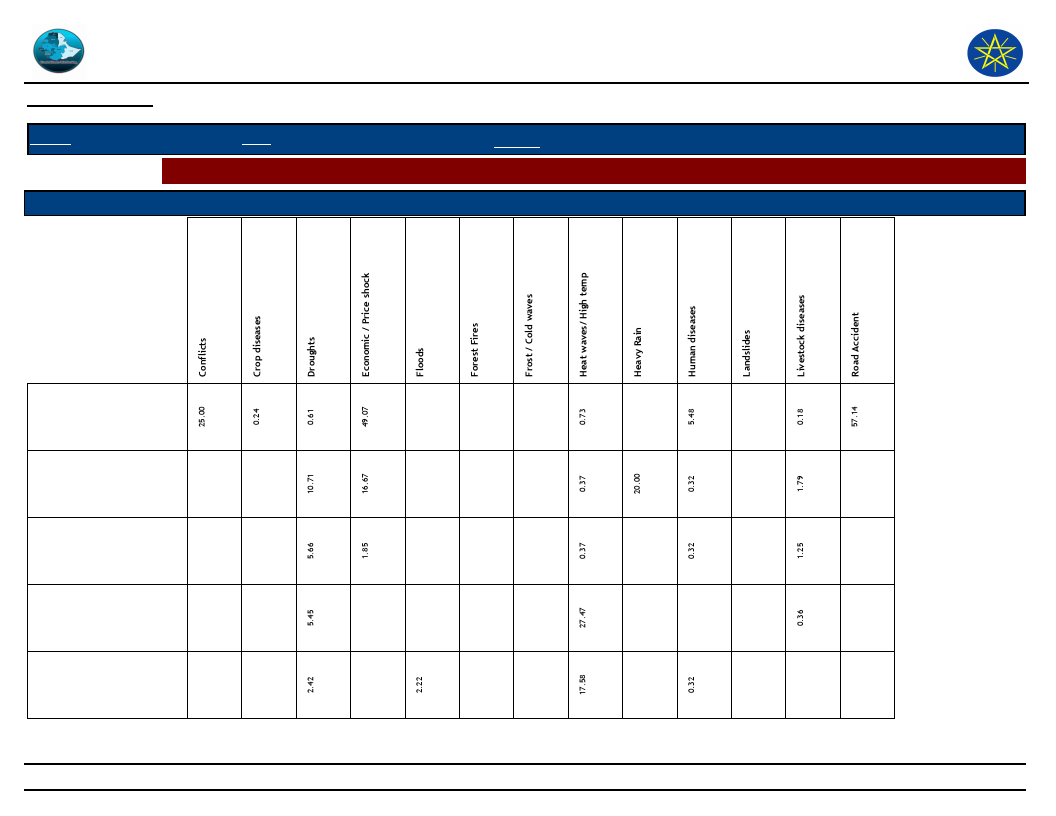
Selected Indictor: Losses from Disasters - Secondary Losses by Type of Disasters (household response in %)
Type of Loss
Type of Disasters which caused Listed Secondary Losses
Loss of access to social
services, including school
Loss of income
Loss of savings
Lost access to grazing land
Lost access to water source
3.83
1.71
13.13
76.79
11.54
11.11
35.71
3.57
6.62
1.53
15.81
1.01
2.38
1.79
5.98
42.86
100.00
1.28
100.00
31.63
6.46
24.68
0.34
20.43
23
11.76
75.90
2.09
2.28
0.57
Page 2 of 3

Wereda Disaster
Risk Profile
Data_Collected_Date
Disaster Risk Management
and Food Security Sector (DRMFSS)
Wednesday, December 3, 2014
Region S.N.N.P
Zone SOUTH OMO
Wereda BENA TSEMAY
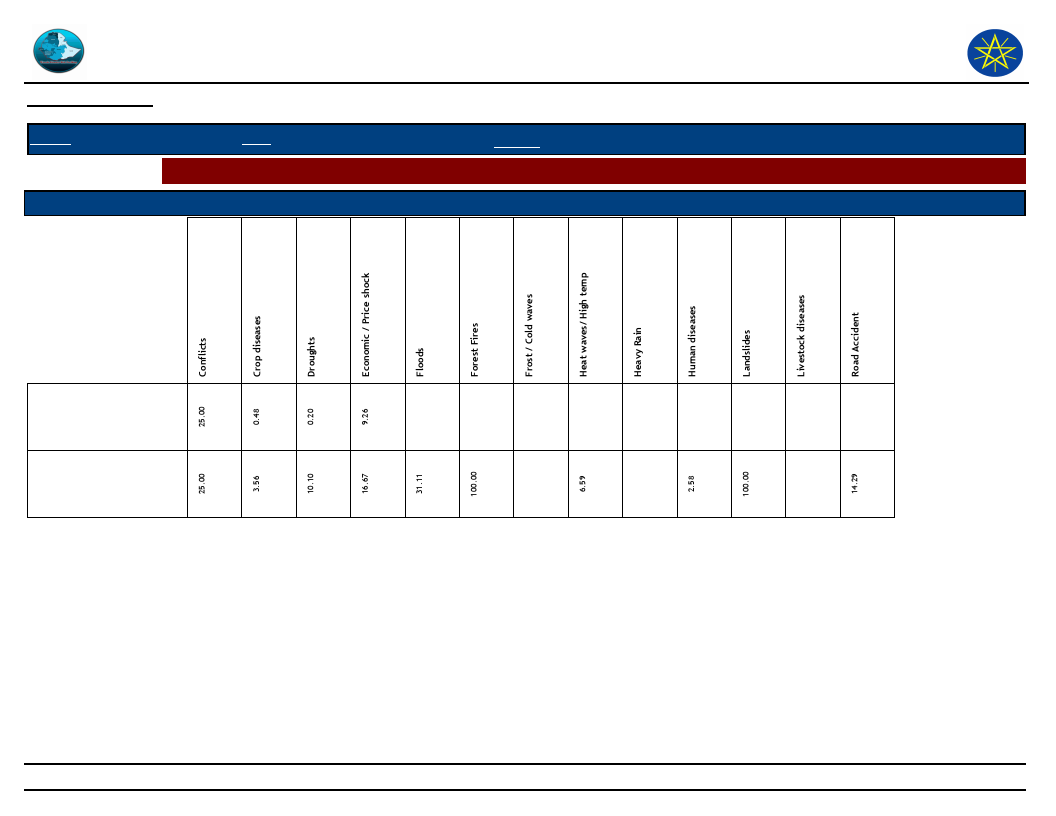
Selected Indictor: Losses from Disasters - Secondary Losses by Type of Disasters (household response in %)
Type of Loss
Type of Disasters which caused Listed Secondary Losses
Other losses/damages
Physical damages on houses
and property
25.00
1.28
0.21
6.06
2.38
25.00
3.32
3.63
14.14
7.14
1.70
2.38
0.76
85.71
1.28
3.06
2.85
24
Page 3 of 3

Wereda Disaster
Risk Profile
Data_Collected_Date
Disaster Risk Management and
Food Security Sector (DRMFSS)
Wednesday, December 3, 2014
Region S.N.N.P
Zone SOUTH OMO
Wereda BENA TSEMAY
Selected Indictor: Seasonal Calendar for Hazards, Activities and Income Level By Kebele
Month of Hazard
Kebele
BEFO
Major_Problems /Disasters
Hazard Severity
Rank
Agricultural_Activities
Income
Level Rank
January
Shortage of pasture, drought and water problem
1
February
Drought ,shortage of pasture
Crop sowing
March
Drought
Crop sowing
April
Drought
Weeding, livestock products
May
Drought ,shortage of pasture and water
2
Livestock products
June
Drought
Harvesting, livestock products
July
Harvesting
August
September
October
November
Drought
December
Drought, shortage of pasture and water
3
NOTE: Hazard Severity Rank helps prioritize the more severe hazards that have occurred in the months of disaster occurrence, 3 being the worst and 1
the least severe hazards.
25
Page 1 of 5
Wereda Disaster
Risk Profile
Data_Collected_Date
Disaster Risk Management and
Food Security Sector (DRMFSS)
Wednesday, December 3, 2014
Region S.N.N.P
Zone SOUTH OMO
Wereda BENA TSEMAY
Selected Indictor: Seasonal Calendar for Hazards, Activities and Income Level By Kebele
Month of Hazard
Kebele
CHALI
Major_Problems /Disasters
Hazard Severity
Rank
Agricultural_Activities
Income
Level Rank
January
Crop sowing
1st
February
Crop sowing
10th
March
Crop pest
Crop sowing
9th
April
Shortage of water
Livestock products
4th
May
Shortage of water
June
Harvesting
3rd
July
Crop sowing and harvesting
2nd
August
crop sowing
8th
September
October
Crop pest and human disease
Livestock products
7th
November
Crop pest
Livestock products
6th
December
Shortage of water
Harvesting
5th
NOTE: Hazard Severity Rank helps prioritize the more severe hazards that have occurred in the months of disaster occurrence, 3 being the worst and 1
the least severe hazards.
26
Page 2 of 5

Wereda Disaster
Risk Profile
Data_Collected_Date
Disaster Risk Management and
Food Security Sector (DRMFSS)
Wednesday, December 3, 2014
Region S.N.N.P
Zone SOUTH OMO
Wereda BENA TSEMAY
Selected Indictor:
Month of Hazard
Kebele
OLU
Seasonal Calendar for Hazards, Activities and Income Level By Kebele
Major_Problems /Disasters
Hazard Severity
Rank
Agricultural_Activities
Income
Level Rank
January
Animal disease, drought, shortage of pasture and water
Crop sowing
6th
February
Animal disease
Crop sowing and livestock product
4th
March
Human disease and animal disease
Weeding, livestock products
3rd
April
Weeding
5th
May
Animal disease
Harvesting, livestock
2nd
June
Harvesting, livestock products
1st
July
Livestock products
7th
August
Livestock products
8th
September
Livestock products
9th
October
Shortage of pasture and water
November
Shortage of pasture and water, drought
December
Shortage of pasture and water, drought
NOTE: Hazard Severity Rank helps prioritize the more severe hazards that have occurred in the months of disaster occurrence, 3 being the worst and 1
the least severe hazards.
27
Page 3 of 5

Wereda Disaster
Risk Profile
Data_Collected_Date
Disaster Risk Management and
Food Security Sector (DRMFSS)
Wednesday, December 3, 2014
Region S.N.N.P
Zone SOUTH OMO
Wereda BENA TSEMAY
Selected Indictor: Seasonal Calendar for Hazards, Activities and Income Level By Kebele
Month of Hazard
Kebele
SHABA
Major_Problems /Disasters
Hazard Severity
Rank
Agricultural_Activities
Income
Level Rank
January
Drought, shortage of pasture and water
1
February
Human disease and drought
2
Crop sowing, livestock product
7th
March
Drought, animal disease
Crop sowing, livestock product
6th
April
Drought
Weeding, livestock product
3rd
May
drought, animal disease and shortage of water
3
Weeding
5th
June
Drought
Harvesting ,livestock product
2nd
July
Harvesting ,livestock product
1st
August
Livestock product
4th
September
Animal disease
Livestock product
11th
October
Animal disease
Livestock product
8th
November
Livestock product
9th
December
Livestock product
10th
NOTE: Hazard Severity Rank helps prioritize the more severe hazards that have occurred in the months of disaster occurrence, 3 being the worst and 1
the least severe hazards.
28
Page 4 of 5
WDRP Indicators
Infrastructure Access Characteristics
29
Data_Collected_Date
Wednesday, December 3, 2014
Region S.N.N.P
Selected Indicator
Type of Road
Yes, paved
Zone SOUTH OMO
Wereda BENA TSEMAY
Physical Vulnerability: Access to Roads & Urban Centres - Households access to
road and urban centre
Response
Time to Nearest
Paved Road (Mins.)
Time To Nearest
Response Urban Center (Mins.)
4.02 Less than 30 min
46.40 Less than 1 hr
Yes, partly paved road
0.80 30 – 60 min
19.90 1 - 2 hrs
Yes, gravel road
2.89 1 – 2 hrs
9.31 2 - 4 hrs
Yes, dirt road (difficult
for car)
No, no road
2.73 2 – 3 hrs
89.40 3 – 4 hrs
6.58 4 - 6 hrs
5.30 More than 6 hrs
Response
8.89
21.96
24.50
21.05
23.59
Avg Time To Nearest Urban Center(Mins.)
Type of Road
4
1
3
3
89
No, no road
Yes, gravel road
Yes, paved
Yes, dirt road (difficult
for car)
Yes, partly paved road
267.40 Avg_Time_To_Nearest_Paved_Road
95.19
Time to reach the nearest paved road from the HH
50
46
40
30
20
10
9
0
1 – 2 hrs
7
2 – 3 hrs
5
3 – 4 hrs
1 – 2 hrs
2 – 3 hrs
3 – 4 hrs
20
30 – 60 min
Less than 30 min
30 – 60 min
Less than 30 min
Time to reach nearest urban center from the HH
28
25
24
24
22
21
20
1 - 2 hrs
16
2 - 4 hrs
4 - 6 hrs
12
Less than 1 hr
More than 6 hrs
9
8
4
0
1 - 2 hrs
2 - 4 hrs
4 - 6 hrs
Less than 1 hr
More than 6 hrs
30
Page 1 of 1
Data_Collected_Date
Wednesday, December 3, 2014
Region S.N.N.P
Selected Indicator
Zone SOUTH OMO
Wereda BENA TSEMAY
Physical Vulnerability: Access to Electricity - Households access and utilization of
electricity
Household_Located_In_Electricity
0.20
Household_Connected_To Electricity
0.00
31
Page 1 of 1
Data_Collected_Date
Wednesday, December 3, 2014
Region S.N.N.P
Selected Indicator
Floor Structure
Zone SOUTH OMO
Wereda BENA TSEMAY
Physical Vulnerability: Type of Dwelling Units - Households type of dwelling
houses
HH Response
Type of Floor
HH Response
Tin house
8.30
Concrete
1.80
Wood and mud
91.70
Non-Concrete
98.20
Floor Structure
100
92
80
Type of Floor
100
98
80
60
60
40
40
20
8
0
Tin house
Wood and mud
Floor Structure
Tin house
Wood and mud
20
2
0
Concrete
Non-Concrete
Type of Floor
Concrete
Non-Concrete
32
Page 1 of 1
WDRP Indicators
Socio Demographic Characteristics
33
Wereda Disaster
Risk Profile
Data_Collected_Date
Disaster Risk Management and Food
Security Sector (DRMFSS)
Wednesday, December 3, 2014
Region S.N.N.P
Selected Indicator
Kebele Name
BEFO
OLU
Zone SOUTH OMO
Wereda BENA TSEMAY
Economic Vulnerability: Level of Migration - Migration level and its characteristics by Kebele
Approx_No. Age_Group
Sex
Migration_Period
Migration Trend
Migration_Reason
Destination
The whole
family
All age group
Both
male
Both
male
Decreased
Decreased
Economic hardship
and food insecurity
Search for grazing
land, water and food
for household
Better area
To river side
34
Page 1 of 1
Wereda Disaster
Risk Profile
Data_Collected_Date
Region S.N.N.P
Disaster Risk Management
and Food Security Sector (DRMFSS)
Wednesday, December 3, 2014
Zone
SOUTH OMO
Wereda BENA TSEMAY
Selected Indicator
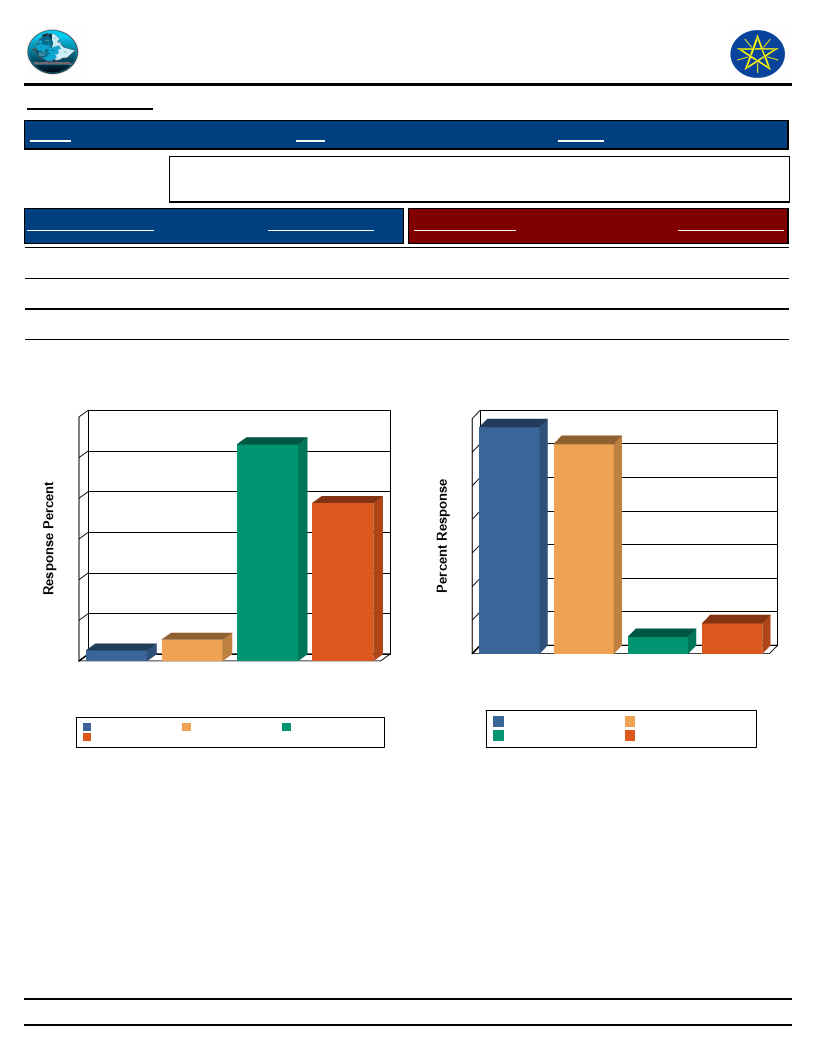
Economic Vulnerability: Household Migration - Household migration and reason
for migration
Duration of Migration
Response Percent
Migration Reason
Response Percent
Less than 2 weeks
Two weeks – month
A month – 3 months
3 – 6 months
53.28
38.86
5.24
2.62
Family reasons
Looking for work
Working elsewhere
In grazing camp
33.70
2.51
4.52
31.20
Duration of Migration
60
53
50
40
39
30
20
10
5
3
0
3–6
A month – 3 Less than 2 Two weeks
months
months
weeks
– month
Duration of Migration
3 – 6 months
Two weeks – month
A month – 3 months
Less than 2 weeks
Migration Reason
35
34
31
30
25
20
15
10
5
5
3
0
Family
reasons
In grazing Looking for
camp
work
Migration Reason
Working
elsewhere
Family reasons
Looking for work
In grazing camp
Working elsewhere
35
Page 1 of 1
Data_Collected_Date
Wednesday, December 3, 2014
Region S.N.N.P
Zone SOUTH OMO
Wereda BENA TSEMAY
Selected Indicator
Economic Vulnerability: Household Migration - Disasters as a triggering factor for
migration (households response in %)
Is Migration Due to Hazard?
HH Response - Due To Hazard
No
96.30
Yes
3.70
Is Migration Due to Hazard?
Yes
3.7
No
Yes
No
96.3
36
Page 1 of 1
Data_Collected_Date
Region S.N.N.P
Zone SOUTH OMO
Wereda
Selected Indicator
Demography: Population Trends and Ethnic Groups
Kebele Name
Population Change Trend
Population Change Reasons
Wednesday, December 3, 2014
BENA TSEMAY
Ethnic_Groups
CHALI
BEFO
OLU
SHABA
Increased
Increased
Increased
Increased
In-migration and more children
More children
More children
More children
Bena
Tsemay
Bena
37
Page 1 of 1

Data_Collected_Date
Wednesday, December 3, 2014
Region S.N.N.P
Zone
SOUTH OMO
Wereda BENA TSEMAY
Selected Indicator
Social Vulnerability: Household Demographic Characteristics - Demographic
characteristics of households
Demographic Indicator
Indicator_Value Comments
Average household size
7
Sex ratio
943 Number of females per 1000 males
Child sex ratio (under 14 yrs)
952 Number of females per 1000 males
Adult sex ratio (18 & Above yrs)
990 Number of females per 1000 males
Dependency ratio ([(0-14)+(64+)] / (15-64)
yrs)
1
Number of dependants per one economically
active person in the family
38
Page 1 of 1
Wereda Disaster
Risk Profile
Disaster Risk Management and Food
Security Sector (DRMFSS)
Data_Collected_Date
Wednesday, December 3, 2014
Region S.N.N.P
Zone
SOUTH OMO
Wereda BENA TSEMAY
Selected Indicator
Social Vulnerability: Level of Educational Attainment - Education status of household members
General Awareness
Percentage Educational Level
Percentage
Read and understand text - Easily
5.40
From Proportion of population (7+) - Less than 1st grade
78.30
Read and understand text - with difficulty
5.00
From Proportion of population (7+) - Primary (1-6)
18.50
Can write letters - easily
4.50
From Proportion of population (7+) - Secondary (7-12)
2.48
Can write letters - easily
General Literacy Rate
Proportion of literate population (7+) to total 7+
population
3.60
From Proportion of population (7+) - Diploma
Percentage
7.30
Adult Literacy Rate
Proportion of literate population (15+) to total 15+
population
0.04
Percentage
6.80
39
Page 1 of 1

Data_Collected_Date
Wednesday, December 3, 2014
Region S.N.N.P
Selected Indicator
Zone SOUTH OMO
Wereda BENA TSEMAY
Social Vulnerability: Gender Parity - Gender parity in education level (7+ years)
and household heading
Educational Level
From Proportion of population (7+) - Less than 1st grade
Male_Percent
48.70
Female_Percent
51.30
From Proportion of population (7+) - Primary (1-6)
64.60
35.40
From Proportion of population (7+) - Secondary (7-12)
62.10
37.90
From Proportion of population (7+) - Diploma
100.00
0.00
University Degree And Above
61.10
38.90
Male Head of HH
90.40
Female Head of HH
9.60
40
Page 1 of 1
WDRP Indicators
Environmental Characteristics
41
Data_Collected_Date
Wednesday, December 3, 2014
Region S.N.N.P
Zone SOUTH OMO
Wereda BENA TSEMAY
Selected Indicator
Environmental Situation: Environmental Problems - Major environmental
problems by Kebele
KebeleName
Problem_1
Problem_2
Problem_3
Problem4
CHALI
Deforestation
BEFO
Soil erosion
OLU
Deforestation
SHABA
Deforestation
Soil erosion
42
Page 1 of 1

Data_Collected_Date
Wednesday, December 3, 2014
Region S.N.N.P
Selected Indicator
KebeleName
Zone SOUTH OMO
Wereda BENA TSEMAY
Environmental Situation: Deforestation - Observed changes over levels of
deforestation by the community and its problems
Changes_Observed
Problems_Due_To_Changes
CHALI
OLU
SHABA
Increased
Increased
Increased
Scarcity of rain fall, high temperature
Scarcity of rain fall
Scarcity of rain fall
43
Page 1 of 1

Wereda Disaster
Risk Profile
Data_Collected_Date
Disaster Risk Management
and Food Security Sector (DRMFSS)
Wednesday, December 3, 2014
Region S.N.N.P
Zone SOUTH OMO
Wereda
BENA TSEMAY
Selected Indicator
Environmental Situation: Natural Resources Availability - Natural resources available and changes observed by
the community
KebeleName
CHALI
Resources_1
Land
Resources_3
Observed_Change_1
Most of the land is cultivated
Observed_Change_3
Problems_Changes_1
Shortage of grazing land
Problems_Changes_3
Resources_2
Observed_Change_2
Problems_Changes_2
Forest
Deforestation
Scarcity of rain fall
Resources_4
Observed_Change_4
Problems_Changes_4
KebeleName
BEFO
Resources_1
Land
Observed_Change_1
Problems_Changes_1
Resources_2
Observed_Change_2
Problems_Changes_2
Forest
Resources_3
Observed_Change_3
Problems_Changes_3
Resources_4
Observed_Change_4
Problems_Changes_4
44
Page 1 of 2
Wereda Disaster
Risk Profile
Data_Collected_Date
Disaster Risk Management
and Food Security Sector (DRMFSS)
Wednesday, December 3, 2014
Region S.N.N.P
Zone SOUTH OMO
Wereda
BENA TSEMAY
Selected Indicator
KebeleName
Environmental Situation: Natural Resources Availability - Natural resources available and changes observed by
the community
OLU
Resources_1
Land
Resources_3
Forest
Observed_Change_1
Observed_Change_3
Deforestation
Problems_Changes_1
Problems_Changes_3
Scarcity of rain fall
Resources_2
Observed_Change_2
Problems_Changes_2
Water
Decreased
Shortage of water
Resources_4
Observed_Change_4
Problems_Changes_4
KebeleName
SHABA
Resources_1
Land
Observed_Change_1
Most of the land is cultivated
Problems_Changes_1
Shortage of grazing land
Resources_2
Observed_Change_2
Problems_Changes_2
Forest
Deforestation
Scarcity of rain fall
Resources_3
Observed_Change_3
Problems_Changes_3
Resources_4
Observed_Change_4
Problems_Changes_4
45
Page 2 of 2
Wereda Disaster
Risk Profile
Data_Collected_Date
Disaster Risk Management
and Food Security Sector (DRMFSS)
Wednesday, December 3, 2014
Region S.N.N.P
Selected Indicator
Zone SOUTH OMO
Wereda BENA TSEMAY
Environmental Situation: Rainfall & Temperature - Observed changes on rainfall and temperature by the
community over the last decade
Rainfall
Temperature
Kebele Name
CHALI
BEFO
OLU
SHABA
Changes Observed Problems
Decreased
Decreased
Shortage of pasture, shortage of
water
Crop failure, drought
Decreased
Crop failure, shortage of pasture
Decreased
Drought, shortage of pasture
Changes Observed
Problems
Increased
Crop failure, drying of water
Increased
Increased
Increased
Drying of water source
Drying of ponds
Drying of water source, crop failure
46
Page 1 of 1

Data_Collected_Date
Wednesday, December 3, 2014
Region S.N.N.P
Zone SOUTH OMO
Wereda BENA TSEMAY
Selected Indicator
KebeleName
Environmental Situation: Reasons for Environmental Changes
Reason_For_Environmental_Changes
CHALI
The main cause for environmental change is deforestation
OLU
The main cause for environmental change is deforestation
SHABA
The main cause for environmental change is deforestation and over grazing
47
Page 1 of 1
Data_Collected_Date
Wednesday, December 3, 2014
Region S.N.N.P
Zone SOUTH OMO
Wereda BENA TSEMAY
Selected Indicator
KebeleName
Environmental Situation: Soil Erosion - Observed changes on levels of soil erosion
by the community
Changes_Observed
Problems_Observed
BEFO
Increased
Destruction of road
SHABA
Increased
Destruction of road and death of livestock
48
Page 1 of 1
WDRP Indicators
Livelihood, Occupation and Source
of Food Characteristics
49
Wereda Disaster
Risk Profile
Data_Collected_Date
Disaster Risk Management and Food
Security Sector (DRMFSS)
Wednesday, December 3, 2014
Region S.N.N.P
Zone
SOUTH OMO
Wereda BENA TSEMAY
Selected Indicator
Economic Vulnerability: Major Occupational Categories - Major categories of occupation and percent of population
engaged in the occupation by Kebele
Occupational Categories and Percent of Population engaged within these occupational categories
Percent (%) of Population
KebeleName
Occupation 1
Population Occupation 2
Population Occupation 3
Population Occupation 4
Population
CHALI
Crop production
98% Animal production
95%
Honey production
25%
Petty trade
5%
BEFO
Animal production
>80% Tobacco production
45%
Honey production
10%
OLU
Animal production
95% Crop production
60%
Bee keeping
20%
SHABA
Animal production
97% Crop production
25%
Honey production
20%
50
Page 1 of 1
Data_Collected_Date
Wednesday, December 3, 2014
Region S.N.N.P
Zone SOUTH OMO
Wereda BENA TSEMAY
Selected Indicator
Economic Vulnerability: Livelihoods - Households important sources of
livelihood (response in %)
Type of Livelihood Activity
Order of Importnce
Agricultural laborer
1st
2nd
3rd
0.16
0.00
0.00
Buying and selling livestock (cattle, sheep, goats, camels)
0.82
3.20
6.91
Carpenter, Furniture-maker, or Metal-worker
0.00
0.36
0.22
Daily laborer
0.16
0.00
0.22
Henna (decoration)
0.16
0.00
0.00
Making jewellery
0.00
0.18
0.00
Making traditional utensils or farm tools
0.33
0.00
0.65
Others
0.00
0.18
1.94
Pottery
0.00
0.18
0.22
Rearing & selling animals (camels, cattle, sheep, goats)
68.10
14.90
5.83
Salaried job
0.99
0.71
0.22
Sale_Of_Natural_Products - Charcoal
0.16
0.36
0.43
Sale_Of_Natural_Products - Construction materials (sand, grass,
wooden poles, etc.)
51
0.16
0.18
0.22
Page 1 of 3

Data_Collected_Date
Wednesday, December 3, 2014
Region S.N.N.P
Zone SOUTH OMO
Wereda BENA TSEMAY
Selected Indicator
Economic Vulnerability: Livelihoods - Households important sources of
livelihood (response in %)
Type of Livelihood Activity
Order of Importnce
1st
2nd
3rd
Sale_Of_Natural_Products - Firewood
0.33
0.36
1.08
Sale_Of_Natural_Products - Wild fruits
0.00
0.18
0.00
Selling Cereal food crops (sorghum, maize, wheat, barley)
22.80
8.53
7.13
Selling Chat / Khat
0.00
0.18
1.08
Selling cooked food
0.36
0.00
0.22
Selling dairy products (milk, butter, ghee, cheese)
0.99
21.30
23.50
Selling eggs (from own chickens) Beekeeping (selling honey,
3.78
44.20
42.50
Selling Fruits (mango, papaya, banana, orange, lemon, etc.)
0.99
1.24
2.81
Selling meat (from own livestock)
0.00
0.36
0.00
Selling Oil seeds (sesame, sunflower)
0.00
0.53
0.22
Selling Other foods (sugar, flour, coffee, etc.)
0.00
0.36
0.00
Selling Root crops (Irish potato, sweet potato)
0.00
0.71
1.08
Selling Vegetables (onion, tomato, cabbage, pumpkin, etc.)
0.00
1.24
3.46
52
Page 2 of 3
Data_Collected_Date
Wednesday, December 3, 2014
Region S.N.N.P
Zone SOUTH OMO
Wereda BENA TSEMAY
Selected Indicator
Economic Vulnerability: Livelihoods - Households important sources of
livelihood (response in %)
Type of Livelihood Activity
Order of Importnce
1st
2nd
3rd
Water-carrier, Porter
0.00
0.18
0.00
53
Page 3 of 3
Data_Collected_Date
Wednesday, December 3, 2014
Region S.N.N.P
Zone SOUTH OMO
Wereda BENA TSEMAY
Selected Indicator
Economic Vulnerability: Occupational Categories - Percent of population
above 15 years age by occupation categories
Type of Livelihood Activity
Main Occupation
Secondary Occupation
1 Below school age children
10 Craftsman
11 Shopkeeper and Petty trade
12 Home-maker (housewife)
13 Salaried
15 Physically disabled
2 Student
3 Unemployed & seeking work
4 Neither studying nor working nor seeking work
5 Retired/ Old
6 Cultivator
7 Agricultural labourer
8 Livestock rearing
9 Non-agricultural labour
None
1st Occupation
0.07
0.54
1.43
36.40
0.61
0.07
4.69
0.14
0.20
1.22
19.90
0.07
34.40
0.27
0.00
2nd Occupation
0.00
0.13
1.08
3.03
5.19
0.27
0.07
0.34
0.00
0.47
0.20
61.40
0.00
21.60
6.14
54
Page 1 of 1
Wereda Disaster
Risk Profile
Data_Collected_Date
Disaster Risk Management
and Food Security Sector (DRMFSS)
Wednesday, December 3, 2014
Region S.N.N.P
Zone SOUTH OMO
Wereda BENA TSEMAY
Economic Vulnerability: Sources of Food - Households source for different food items (response in %)
Selected Indictor:
Source of Food
Types of Food Item
Begging
0.20
Borrowed
4.90
Casual labor
4.90
0.80
Free meals/Food assistance
1.60
1.20
0.50
Gathering catching
1.60
23.70
8.00
Gifts from friends/neighbors
12.50
5.60
4.10
0.80
0.50
55
Page 1 of 2
Wereda Disaster
Risk Profile
Data_Collected_Date
Disaster Risk Management
and Food Security Sector (DRMFSS)
Wednesday, December 3, 2014
Region S.N.N.P
Zone SOUTH OMO
Wereda BENA TSEMAY
Economic Vulnerability: Sources of Food - Households source for different food items (response in %)
Selected Indictor:
Source of Food
Types of Food Item
Own cultivation/production
Purchase from roadside
vendor/tuck shop
Purchase subsidized food
from Kebele shop
Purchases from main shop
12.50
83.90
88.90
65.50
61.80
96.40
91.50
55.60
84.20
80.00
45.20
93.00
37.50
1.60
9.70
11.40
2.40
2.50
11.10
8.20
8.00
2.80
10.50
5.60
3.30
37.50
0.80
1.10
11.40
1.20
3.10
33.30
3.30
4.00
22.60
4.20
56
Page 2 of 2
WDRP Indicators
Crop Production Characteristics
57
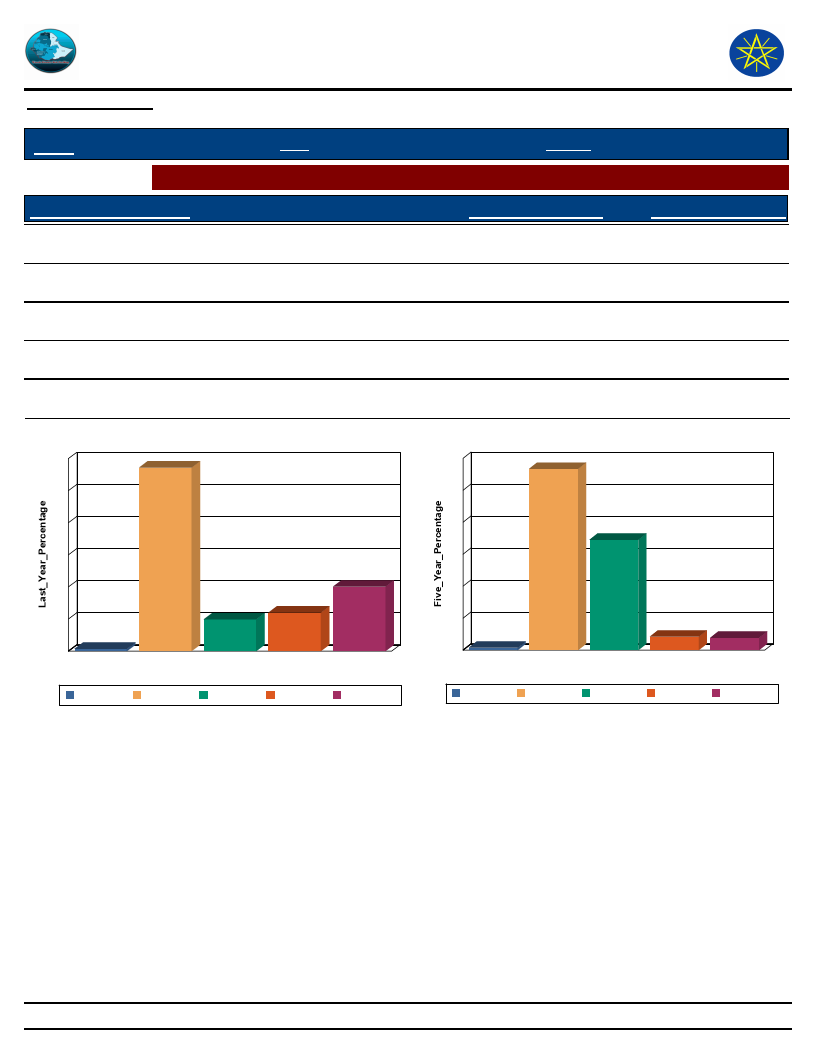
Wereda Disaster
Risk Profile
Data_Collected_Date
Disaster Risk Management
and Food Security Sector (DRMFSS)
Wednesday, December 3, 2014
Region S.N.N.P
Zone SOUTH OMO
Wereda BENA TSEMAY
Selected Indictor: Hazards: Change in Crop Damages - Proportion of Total Crop Damage
Extent of Crop Damage (%)
0%
Last_Year_Percentage
0.71
Five_Year_Percentage
0.73
1 - 25 %
57.20
56.70
26 - 50 %
9.89
34.50
51 - 75 %
12.00
4.20
76 - 100 %
20.10
3.84
Extent of Crop Damage Last_Year
60
57
50
40
30
20
10
1
0
0%
0%
20
12
10
1 - 25 %
26 - 50 %
51 - 75 %
Extent of Crop Damage
1 - 25 %
26 - 50 %
51 - 75 %
76 - 100 %
76 - 100 %
Extent of Crop Damage Five Years Ago
60
57
50
40
35
30
20
10
1
0
0%
0%
4
4
1 - 25 %
26 - 50 % 51 - 75 %
Extent of Crop Damage
76 - 100 %
1 - 25 %
26 - 50 %
51 - 75 %
76 - 100 %
58
Page 1 of 1
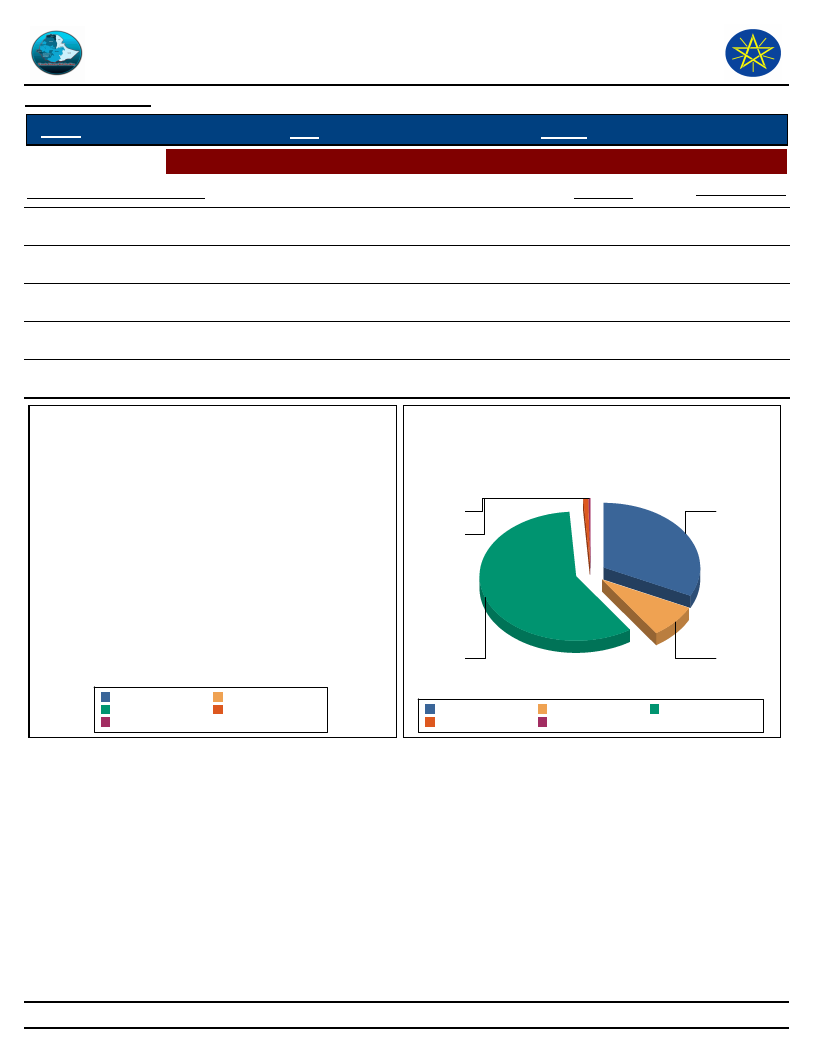
Wereda Disaster
Risk Profile
Data_Collected_Date
Disaster Risk Management
and Food Security Sector (DRMFSS)
Wednesday, December 3, 2014
Region S.N.N.P
Zone SOUTH OMO
Wereda BENA TSEMAY
Selected Indictor: Hazards: Change in Crop Damages - Major reasons for crop damage
Major Reason of Crop Damage
Last_Year
Five_Year_Ago
1 Pests / Termite
0.00
32.30
2 Drought
0.00
8.11
3 Flood
0.00
58.30
4 Frost/ Cold wave
0.00
0.72
5 Others (specify)
0.00
0.40
Major Reason of Crop Damage -
Last Year
Major Reason of Crop Damage -
Five Years Ago
5 Others
(specify)
4 Frost/ Cold
wave
1 Pests /
Termite
1 Pests / Termite
3 Flood
5 Others (specify)
2 Drought
4 Frost/ Cold wave
3 Flood
2 Drought
1 Pests / Termite
4 Frost/ Cold wave
2 Drought
5 Others (specify)
3 Flood
59
Page 1 of 1
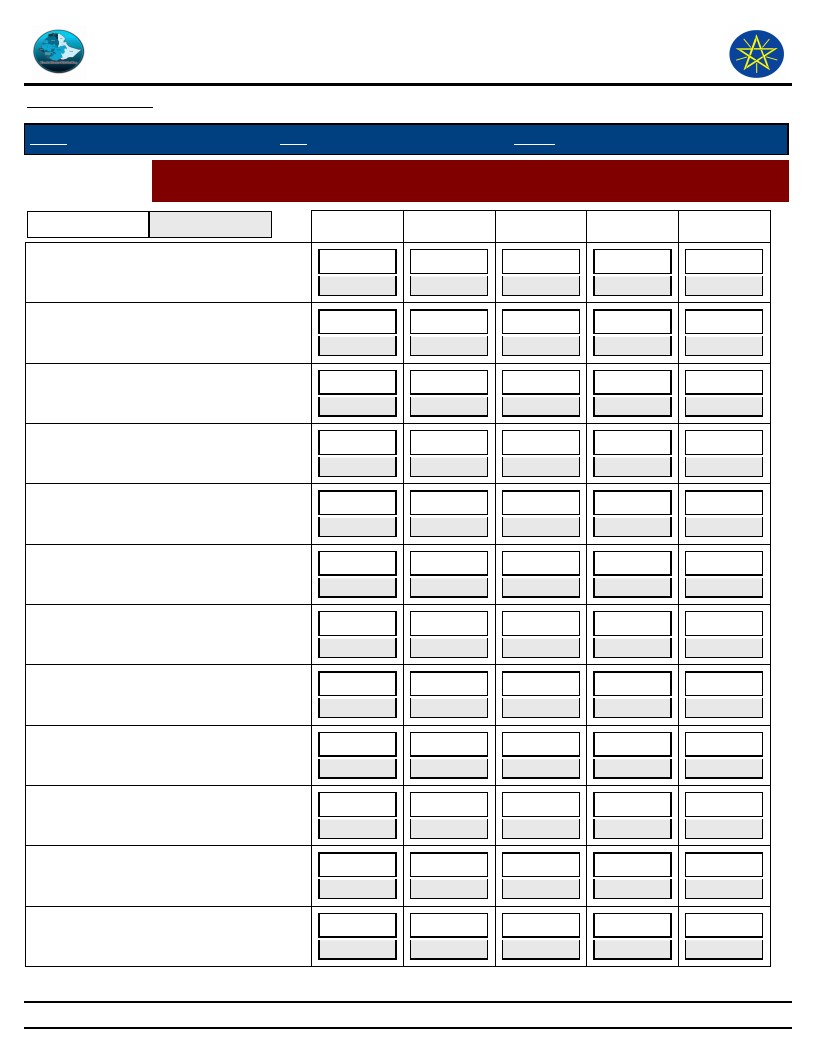
Wereda Disaster
Risk Profile
Data_Collected_Date
Disaster Risk Management
and Food Security Sector (DRMFSS)
Wednesday, December 3, 2014
Region S.N.N.P
Zone SOUTH OMO
Wereda BENA TSEMAY
Selected Indictor:
Hazards: Change in Crop Damages - Proportion of Damage for Major Crops
(percentage response by households)
Last Year
Five Years Ago
0%
1 - 25 %
26 - 50 %
51 - 75 %
76 - 100 %
1 Teff
0.00
40.00
0.00
20.00
40.00
0.00
75.80
21.00
1.61
1.61
10 Lentils
0.00
0.00
0.00
0.00
0.00
0.00
100.00
0.00
0.00
0.00
11 Other pulses
0.00
66.70
3.70
7.41
22.20
2.17
41.30
43.50
8.70
4.35
15 Sunflower
33.30
0.00
0.00
66.67
0.00
0.00
78.60
21.40
0.00
0.00
16 Sesame
0.00
60.00
10.00
0.00
30.00
0.00
27.60
72.40
0.00
0.00
17 Other oilseed
0.00
0.00
0.00
0.00
0.00
0.00
100.00
0.00
0.00
0.00
18 Vegetables
0.00
0.00
0.00
0.00
0.00
0.00
100.00
0.00
0.00
0.00
19 Root & tubers
0.00
100.00
0.00
0.00
0.00
0.00
100.00
0.00
0.00
0.00
25 Other cash crop
0.00
66.70
33.33
0.00
0.00
0.00
33.30
66.70
0.00
0.00
4 Maize
1.03
58.80
14.40
12.37
13.40
0.99
54.60
36.70
3.47
4.22
5 Sorghum
0.00
53.30
9.52
13.33
23.80
0.48
59.20
31.30
5.49
3.58
6 Millet
0.00
78.90
5.26
0.00
15.80
0.00
59.60
34.00
0.00
6.38
60
Page 1 of 2
Wereda Disaster
Risk Profile
Data_Collected_Date
Disaster Risk Management
and Food Security Sector (DRMFSS)
Wednesday, December 3, 2014
Region S.N.N.P
Zone SOUTH OMO
Wereda BENA TSEMAY
Selected Indictor:
Hazards: Change in Crop Damages - Proportion of Damage for Major Crops
(percentage response by households)
0%
1 - 25 %
26 - 50 %
51 - 75 %
8 Beans
0.00
16.70
16.70
16.67
0.00
100.00
0.00
0.00
76 - 100 %
50.00
0.00
61
Page 2 of 2
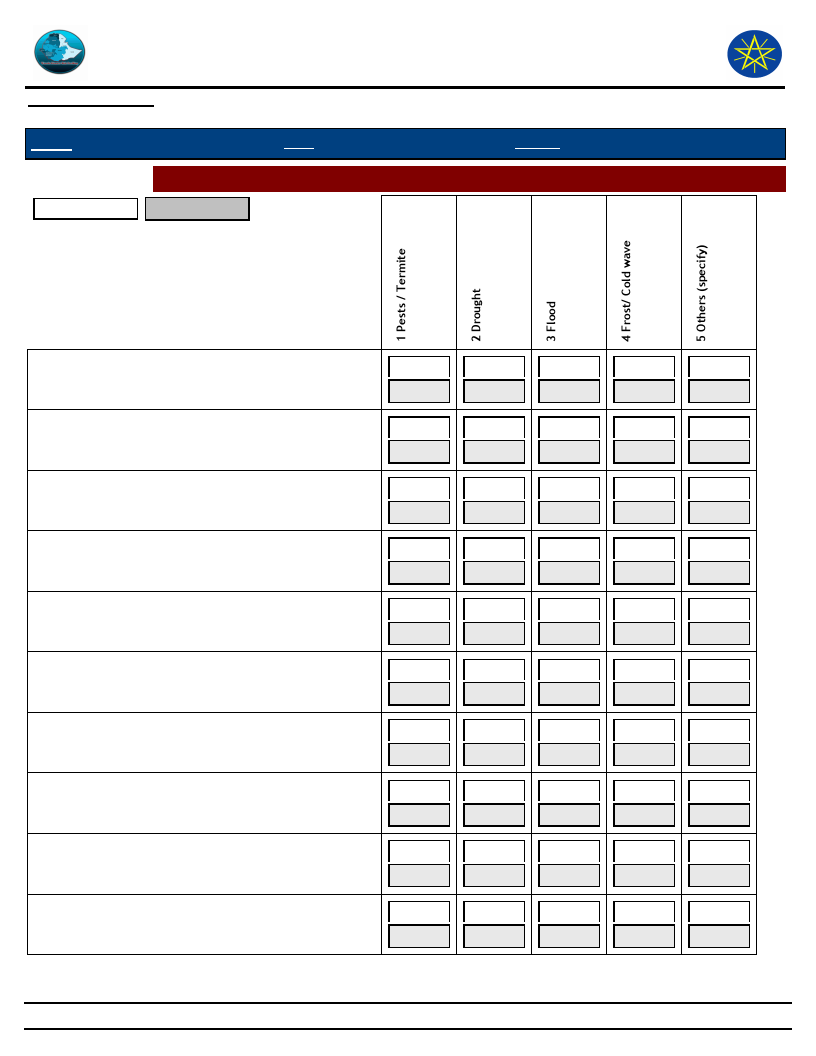
Wereda Disaster
Risk Profile
Data_Collected_Date
Disaster Risk Management
and Food Security Sector (DRMFSS)
Wednesday, December 3, 2014
Region S.N.N.P
Zone SOUTH OMO
Wereda BENA TSEMAY
Selected Indictor: Hazards: Change in Crop Damages - Reasons for Damage of Major Crops
Last Year
Five Years Ago
1 Teff
10 Lentils
11 Other pulses
12 Neug
15 Sunflower
16 Sesame
18 Vegetables
19 Root & tubers
25 Other cash crop
3 Wheat
0.00
0.00
0.00
0.00
0.00
21.30
33.30
40.00
2.67
2.67
0.00
0.00
0.00
0.00
0.00
0.00
0.00
100.00
0.00
0.00
0.00
0.00
0.00
0.00
0.00
34.30
8.82
55.90
0.98
0.00
0.00
0.00
0.00
0.00
0.00
0.00
100.00
0.00
0.00
0.00
0.00
0.00
0.00
0.00
0.00
46.20
15.40
38.50
0.00
0.00
0.00
0.00
0.00
0.00
0.00
12.10
0.00
87.90
0.00
0.00
0.00
0.00
0.00
0.00
0.00
0.00
0.00
100.00
0.00
0.00
0.00
0.00
0.00
0.00
0.00
20.00
0.00
80.00
0.00
0.00
0.00
0.00
0.00
0.00
0.00
33.30
0.00
66.70
0.00
0.00
0.00
0.00
0.00
0.00
0.00
100.00
8.24
66.60
0.43
0.22
62
Page 1 of 2
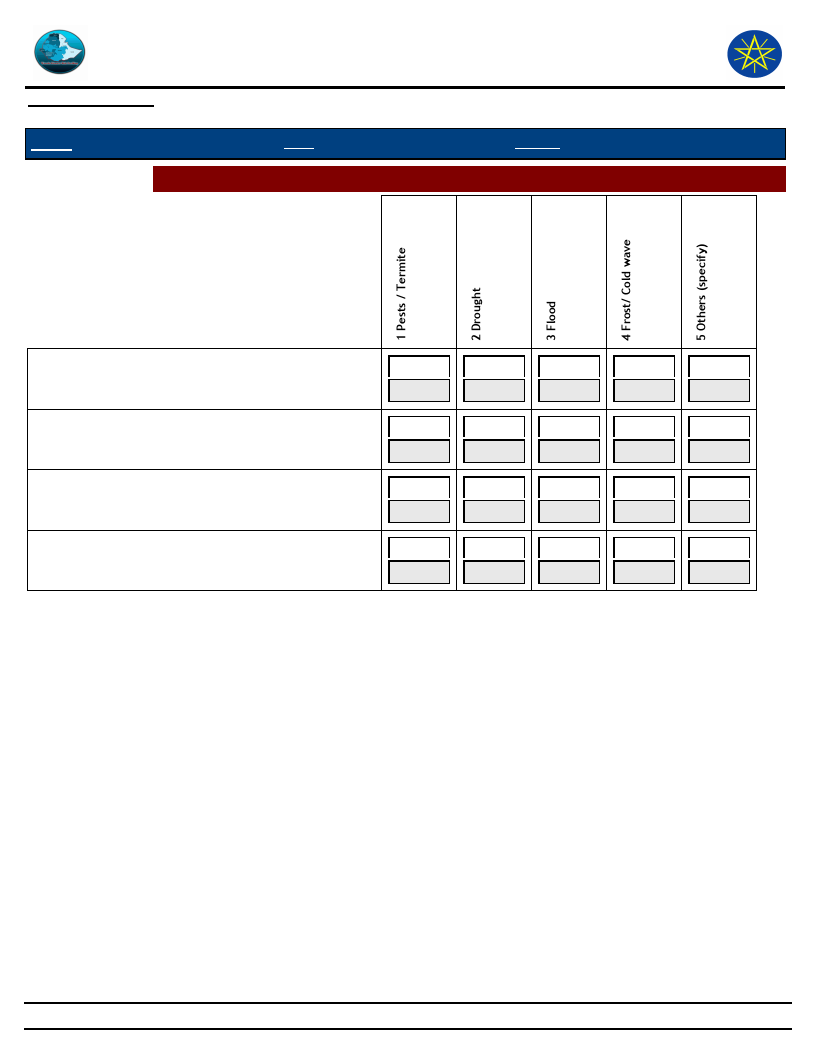
Wereda Disaster
Risk Profile
Data_Collected_Date
Disaster Risk Management
and Food Security Sector (DRMFSS)
Wednesday, December 3, 2014
Region S.N.N.P
Zone SOUTH OMO
Wereda BENA TSEMAY
Selected Indictor: Hazards: Change in Crop Damages - Reasons for Damage of Major Crops
5 Sorghum
6 Millet
7 Other grain (specify)
8 Beans
0.00
0.00
0.00
0.00
0.00
44.10
3.93
51.10
0.41
0.21
0.00
0.00
0.00
0.00
0.00
17.90
12.50
64.30
3.57
1.79
0.00
0.00
0.00
0.00
0.00
10.00
0.00
90.00
0.00
0.00
0.00
0.00
0.00
0.00
0.00
75.00
25.00
0.00
0.00
0.00
63
Page 2 of 2
Wereda Disaster
Risk Profile
Data_Collected_Date
Disaster Risk Management and Food
Security Sector (DRMFSS)
Wednesday, December 3, 2014
Region
S.N.N.P
Zone
SOUTH OMO
Wereda
BENA TSEMAY
Selected Indictor:
Agricultural Situation: Change in Crops Grown - Five major crops grown by proportion of total cultivated land
Kebele Name
CHALI
Major Crops
4 Maize
Main Season
Belg
Present
Cropped Area
Five_Years_Ago
1264 ha
Reason_For_Change
5 Sorghum
Belg
640 ha
1 Teff
Belg
116 ha
Haricot Bean
Belg
106 ha
15 Sunflower
Belg
64 ha
BEFO
5 Sorghum
Belg
95 ha
4 Maize
Belg
87.5 ha
OLU
4 Maize
Belg
25 ha
5 Sorghum
Belg
50 ha
Haricot Bean
Belg
15 ha
64
Page 1 of 1
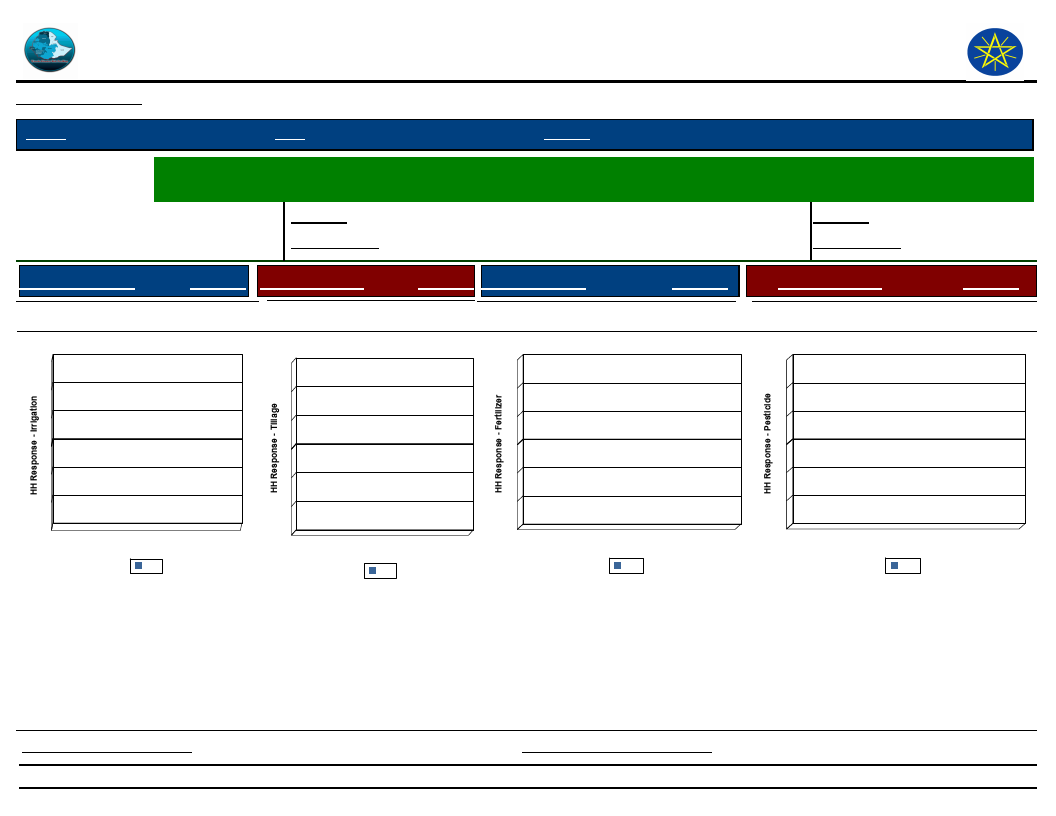
Wereda Disaster
Risk Profile
Data_Collected_Date
Disaster Risk Management
and Food Security Sector (DRMFSS)
Wednesday, December 3, 2014
Region S.N.N.P
Zone SOUTH OMO
Wereda BENA TSEMAY
Selected Indictor:
Economic Vulnerability: Status of Agriculture - Methods of tillage, Irrigation and other agricultural input utilization
by households
Percentage of
Last Year
3.75
Irrigated Area
Five Years Ago
1.77
Percentage of households
with irrigated area
Last Year
Five Years Ago
10.80
10.28
Source of Irrigation
Response Method of Tillage
Response Type of Fertilizer
Response
Type of Pesticide
Response
Source of Irrigation
6
4
2
0
-2
-4
-6
Source of Irrigation
Method of Tillage
6
4
2
0
-2
-4
-6
Method of Tillage
Type of Fertilizer
6
4
2
0
-2
-4
-6
Type of Fertilizer
Type of Pesticide
6
4
2
0
-2
-4
-6
Type of Pesticide
Proportion_Improved_Seeds
0.00
Proportion_Agriculture_Service
65
0.00
Page 1 of 1
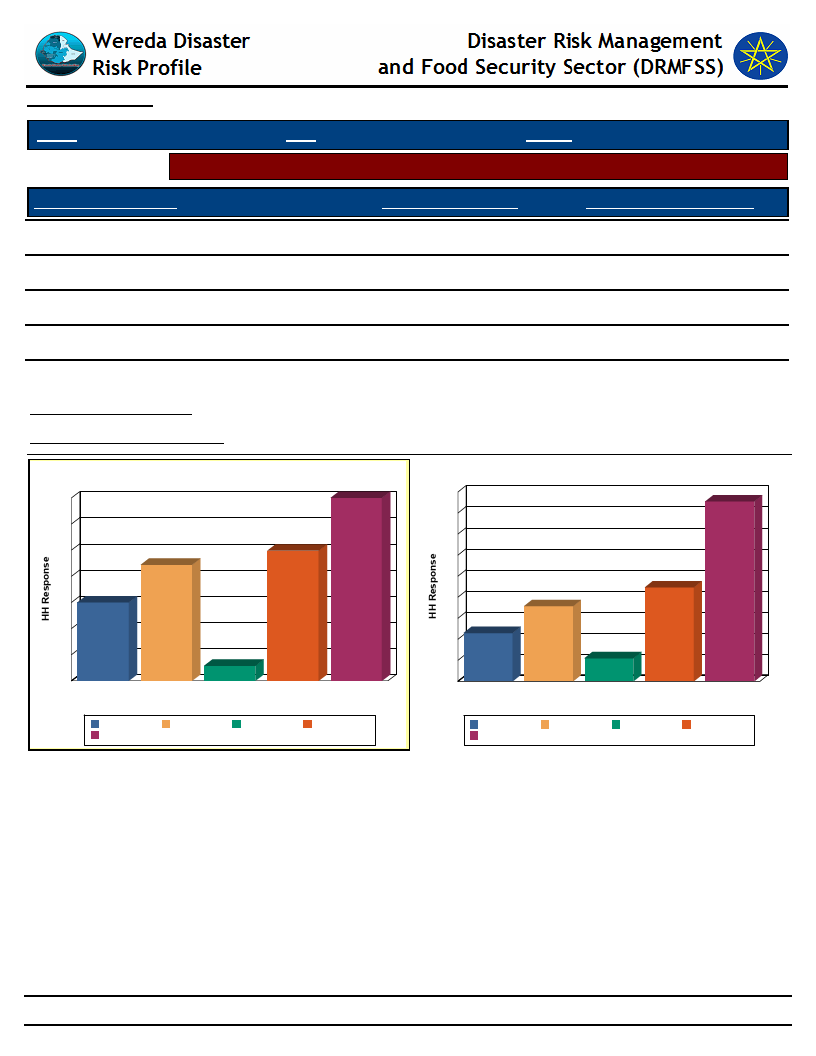
Data_Collected_Date
Wednesday, December 3, 2014
Region S.N.N.P
Zone SOUTH OMO
Wereda BENA TSEMAY
Selected Indicator
Economic Vulnerability: Crops Grown - Number of crops grown by households
Number of Crops Grown
One type
Crops Grown Last Year
2.87
Crops Grown Five Years Ago
5.49
Two types
35.00
42.75
Three types
24.90
22.33
Four types
22.20
17.86
Five types
15.00
11.49
Avg Crops Grown Last Year
Avg Crops Grown Five Years Ago
3.11
2.87
Number of Crops Grown Last Year
35
35
30
25
25
22
20
15
15
10
5
3
0
Five types
Four types One type Three types
Number of Crops Grown
Two types
Five types
Two types
Four types
One type
Three types
Number of Crops Grown five years ago
45
43
40
35
30
25
22
20
18
15
11
10
5
5
0
Five types
Four types One type Three types Two types
Number of Crops Grown
Five types
Two types
Four types
One type
Three types
66
Page 1 of 1
Data_Collected_Date
Region S.N.N.P
Zone SOUTH OMO
Wednesday, December 3, 2014
Wereda BENA TSEMAY
Selected Indicator
Economic Vulnerability: Crops Grown - Types of crops grown by households
Major Crop Type
1 Teff
Type of Crops Grown
Last Year
5.23
Type of Crops Grown
Five Years Ago
6.48
4 Maize
35.10
36.40
3 Wheat
0.00
0.07
5 Sorghum
33.40
37.40
6 Millet
5.65
5.28
7 Other grain (specify)
0.90
0.80
8 Beans
0.60
0.33
10 Lentils
0.18
0.07
11 Other pulses
10.00
8.42
12 Neug
0.00
0.07
13 Groundnut
0.06
0.00
15 Sunflower
1.08
1.00
16 Sesame
3.67
2.40
18 Vegetables
0.30
0.07
19 Root & tubers
1.68
0.47
21 Fruits
0.06
0.00
22 Coffee
0.12
0.00
24 Chat
0.06
0.00
25 Other cash crop
1.80
0.67
67
Page 1 of 2
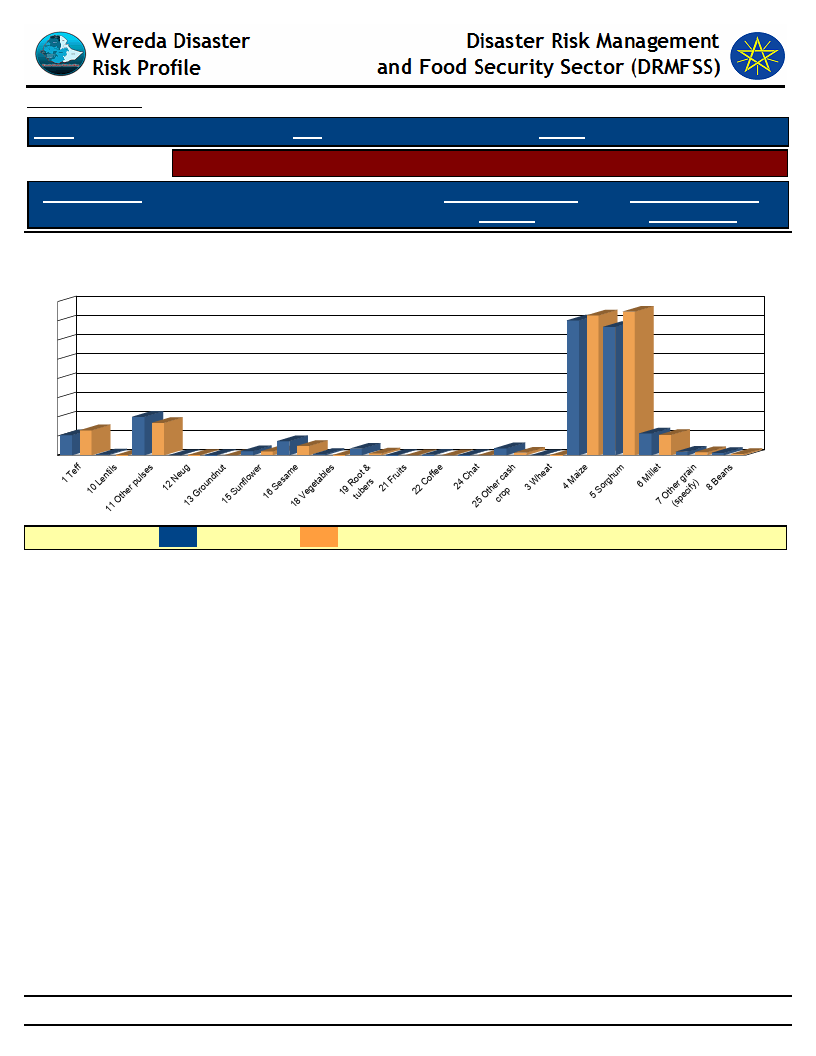
Data_Collected_Date
Region S.N.N.P
Selected Indicator
Major Crop Type
Zone SOUTH OMO
Wednesday, December 3, 2014
Wereda BENA TSEMAY
Economic Vulnerability: Crops Grown - Types of crops grown by households
Type of Crops Grown
Last Year
Type of Crops Grown
Five Years Ago
Types of Crops Grown - Percent Responses of HHs for Last Year as compared to
Five Years Ago
40
36
37
35
35
33
30
25
20
15
10
10
8
56
5
00
0
00
01
4
1
2
0
2
0
00
00
00
2
0
10
0
0
65
1 11 0
LEGEND :
Last year
Five Years Ago
68
Page 2 of 2

Wereda Disaster
Risk Profile
Disaster Risk Management
and Food Security Sector (DRMFSS)
Data_Collected_Date
Region S.N.N.P
Zone SOUTH OMO
Wednesday, December 3, 2014
Wereda BENA TSEMAY
Selected Indictor:
Economic Vulnerability: Crops Grown - Proportion of households by amount of
yield of major crops (last year)
1 Teff
10 Lentils
11 Other pulses
13 Groundnut
15 Sunflower
16 Sesame
17 Other oilseed
18 Vegetables
19 Root & tubers
21 Fruits
22 Coffee
25 Other cash crop
3 Wheat
4 Maize
5 Sorghum
6 Millet
7 Other grain (specify)
8 Beans
64.60
33.30
53.50
29.40
48.30
8.86
26.60
66.70
0.63
45.90
100.00
70.60
51.70
40.70
100.00
20.00
37.00
100.00
100.00
1.39
37.10
0.60
35.66
25.30
49.50
0.58
23.42
26.50
47.10
2.30
50.60
66.70
20.00
13.30
12.50
87.50
69
Page 1 of 1
Wereda Disaster
Risk Profile
Disaster Risk Management
and Food Security Sector (DRMFSS)
Data_Collected_Date
Region S.N.N.P
Zone SOUTH OMO
Wednesday, December 3, 2014
Wereda BENA TSEMAY
Selected Indictor:
Economic Vulnerability: Crops Grown - Proportion of households by amount of
yield of major crops (Five Years Ago)
Types of Major Crops
Category of Yield used to be obtained five years ago
1 Teff
10 Lentils
11 Other pulses
13 Groundnut
15 Sunflower
16 Sesame
17 Other oilseed
18 Vegetables
19 Root & tubers
21 Fruits
22 Coffee
25 Other cash crop
3 Wheat
4 Maize
5 Sorghum
60.00
100.00
28.00
46.70
11.40
28.60
13.33
26.70
0.85
71.20
53.30
88.60
100.00
100.00
28.60
30.00
10.00
60.00
0.20
1.01
51.80
0.20
21.66
25.10
0.38
59.20
0.38
13.08
26.90
70
Page 1 of 2
Wereda Disaster
Risk Profile
Disaster Risk Management
and Food Security Sector (DRMFSS)
Data_Collected_Date
Region S.N.N.P
Zone SOUTH OMO
Wednesday, December 3, 2014
Wereda BENA TSEMAY
Selected Indictor:
Economic Vulnerability: Crops Grown - Proportion of households by amount of
yield of major crops (Five Years Ago)
Types of Major Crops
Category of Yield used to be obtained five years ago
6 Millet
7 Other grain (specify)
8 Beans
41.30
100.00
20.00
2.67
56.00
80.00
71
Page 2 of 2
Wereda Disaster
Risk Profile
Data_Collected_Date
Region S.N.N.P
Zone SOUTH OMO
Disaster Risk Management and Food
Security Sector (DRMFSS)
Wednesday, December 3, 2014
Wereda BENA TSEMAY
Selected Indicator
Kebele Name
Environmental Situation: Land-Use other than crop production - Types of land use other than crop production
across Kebeles
Landuse_1
Comments_1
Landuse_2
Comments_2
Landuse_3
Comments_3
CHALI
Grazing land
1200 ha
Forest
612 ha
Bushes and shrubs
1137 ha
BEFO
Grazing land
3088 ha
Forest
1889 ha
OLU
Grazing land
Bushes and shrubs
Forest
SHABA
Grazing land
4116 ha
Forest
207.9 ha
72
Page 1 of 1
WDRP Indicators
Livestock Production Characteristics
73
Wereda Disaster
Risk Profile
Disaster Risk Management
and Food Security Sector (DRMFSS)
Data_Collected_Date
Wednesday, December 3, 2014
Region S.N.N.P
Zone SOUTH OMO
Wereda BENA TSEMAY
Selected Indictor:
Kebele Name
Agricultural Situation: Status of Livestock Disease - Change in Livestock Disease
Status
Current_Level
Change_Over_Last_Decade
Comment
CHALI
It slightly decreased
Decreased
BEFO
It slightly decreased
Decreased
OLU
It slightly decreased
Decreased
SHABA
It slightly decreased
Decreased
74
Page 1 of 1
Wereda Disaster
Risk Profile
Data_Collected_Date
Disaster Risk Management
and Food Security Sector (DRMFSS)
Wednesday, December 3, 2014
Region S.N.N.P
Zone SOUTH OMO
Wereda BENA TSEMAY
Selected Indictor: Livestock Diseases Prevalece
Type of livestock diseases affected households in the last five years (households reporting in %)
African horse disease
1st
2nd
3rd
0.80
Anthrax affecting cattle
2.57
65.40
0.16
Black leg
0.16
11.10
41.20
CBPP
0.16
0.97
Contagious Caprine PLeuropneumonia (CCPP)
5.30
11.40
23.30
Faciolosis
0.64
3.86
5.67
Foot and mouth disease
0.48
6.32
Heart water
0.16
Internal & External Parasites (Tick, mange, helminthiasis, fasci
1.29
5.51
Liverfluke (Sheep and cattle)
3.21
3.38
2.27
Lumpy Skin Disease (LSD)
0.16
Lymphangitis
0.16
Newcasle disease (Chicken)
1.61
13.00
No Disease
0.32
PPR
0.49
Tick born diseases
0.16
0.49
Trypanosomiasis
88.10
0.16
75
Page 1 of 1
Wereda
Disaster Risk
Data_Collected_Date
Disaster Risk Management
and Food Security Sector
Wednesday, December 3, 2014
Region S.N.N.P
Selected Indictor:
Level of Access
Excellent
Zone SOUTH OMO
Wereda BENA TSEMAY
Evaluation of Access to Veternary Services and Livestock Drugs
Households’ evaluation on access to drugs and veterinary services
Veternary Service
0.80
Livestock_Drugs
0.48
Good
9.79
10.10
Adequate
18.50
18.50
Poor
61.00
61.10
Very poor
9.95
9.81
Level of Access to Veternary Services
19
10
1
10
Access Level of Livestock Drugs
19
10
0
10
61
Adequate Excellent
Good
Poor
Very poor
61
Adequate Excellent
Good
Poor
Very poor
76
Page 1 of 1
Data_Collected_Date
Wednesday, December 3, 2014
Region S.N.N.P
Zone SOUTH OMO
Wereda BENA TSEMAY
Selected Indictor:
Agricultural Situation: Livestock Diversity - Type of livestock and their economic
importance in the community
KebeleName
CHALI
Type of Livestock
Cattle
Avg_Num_Per_HH
10.00
Economic_Importance_Rank
Goats
4.00
Sheep
2.00
BEFO
Cattle
16.00
Goats
13.00
Sheep
4.00
OLU
Cattle
10.00
Goats
12.00
Sheep
6.00
SHABA
Cattle
13.00
Goats
11.00
Sheep
4.00
77
Page 1 of 1
Wereda Disaster
Risk Profile
Data_Collected_Date
Disaster Risk Management
and Food Security Sector (DRMFSS)
Wednesday, December 3, 2014
Region S.N.N.P
Zone SOUTH OMO
Wereda BENA TSEMAY
Selected Indictor:
Economic Vulnerability: Livestock Ownership and Changes - Percentage of households by number and type of
livestock owned
1–5
11 – 50
51 – 100
6 – 10
None
Bee keeping
31.80
30.80
11.20
23.40
2.80
Camels: Female
6.70
2.20
91.10
Camels: Male
2.30
2.30
95.30
Camels: Young Female
8.70
2.20
89.10
Camels: Young Male
4.70
95.30
Cattle: Female
1.70
33.00
63.20
0.60
2.60
Cattle: Male bulls
0.20
24.60
52.50
0.80
11.30
Cattle: Mature Female
42.00
24.70
0.70
31.80
0.70
Cattle: Mature Male
65.30
7.40
0.40
26.20
0.70
Cattle: under 1 year
2.40
30.60
63.60
1.00
1.50
Donkeys
17.10
27.70
34.10
2.10
10.60
Goats
0.40
11.30
64.30
0.40
23.50
78
Page 1 of 2
Wereda Disaster
Risk Profile
Data_Collected_Date
Disaster Risk Management
and Food Security Sector (DRMFSS)
Wednesday, December 3, 2014
Region S.N.N.P
Zone SOUTH OMO
Wereda BENA TSEMAY
Selected Indictor:
Economic Vulnerability: Livestock Ownership and Changes - Percentage of households by number and type of
livestock owned
1–5
11 – 50
51 – 100
6 – 10
None
Poultry
1.30
3.80
81.00
2.30
11.60
Sheep
0.80
14.70
62.40
1.10
21.10
79
Page 2 of 2
Wereda Disaster
Risk Profile
Data_Collected_Date
Disaster Risk Management
and Food Security Sector (DRMFSS)
Wednesday, December 3, 2014
Region S.N.N.P
Zone SOUTH OMO
Wereda BENA TSEMAY
Selected Indicator
Economic Vulnerability: Livestock Ownership and Changes - Households
perception on changes in livestock number in the last five years (response in %)
Type of Livestock Owned
Changes Observed By Households
Camels: Female
Decreased
Increased
Remained the Same
50.00
Camels: Young Female
25.00
Camels: Young Male
100.00
Cattle: Female
80.00
4.60
15.40
Cattle: Male bulls
63.70
11.60
24.60
Cattle: Mature Female
83.10
7.30
9.60
Cattle: Mature Male
80.50
Cattle: under 1 year
20.40
62.40
17.20
Goats
37.00
34.60
28.40
Horses
18.90
47.40
33.80
Poultry
28.40
36.40
35.20
Sheep
69.30
26.00
4.70
80
Page 1 of 3

Wereda Disaster
Risk Profile
Data_Collected_Date
Disaster Risk Management
and Food Security Sector (DRMFSS)
Wednesday, December 3, 2014
Region S.N.N.P
Zone SOUTH OMO
Wereda BENA TSEMAY
Selected Indicator
Economic Vulnerability: Livestock Ownership and Changes - Households
perception on changes in livestock number in the last five years (response in %)
Type of Livestock Owned
Reason for Decrease in Livestock Number
Camels: Female
Camels: Young
Female
Camels: Young
Male
Cattle: Female
Cattle: Male bulls
Cattle: Mature
Female
Cattle: Mature
Male
81
Page 2 of 3
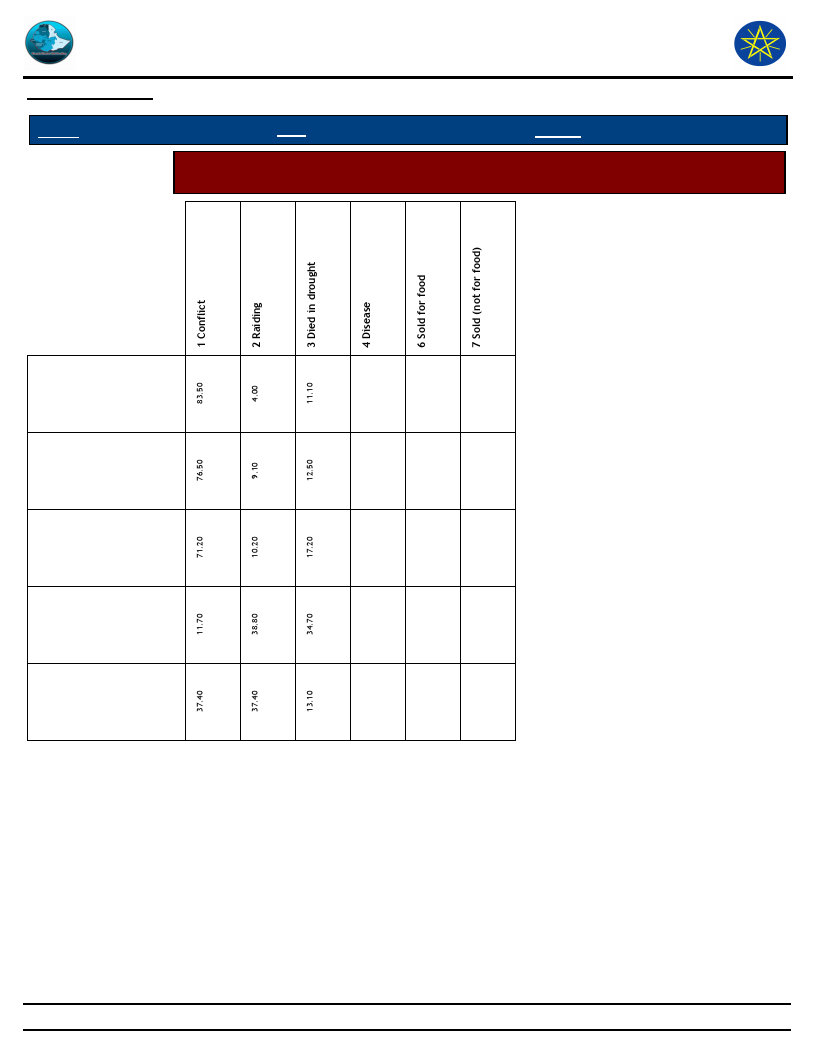
Wereda Disaster
Risk Profile
Data_Collected_Date
Disaster Risk Management
and Food Security Sector (DRMFSS)
Wednesday, December 3, 2014
Region S.N.N.P
Zone SOUTH OMO
Wereda BENA TSEMAY
Selected Indicator
Economic Vulnerability: Livestock Ownership and Changes - Households
perception on changes in livestock number in the last five years (response in %)
Cattle: under 1
year
Goats
Horses
Poultry
Sheep
82
Page 3 of 3
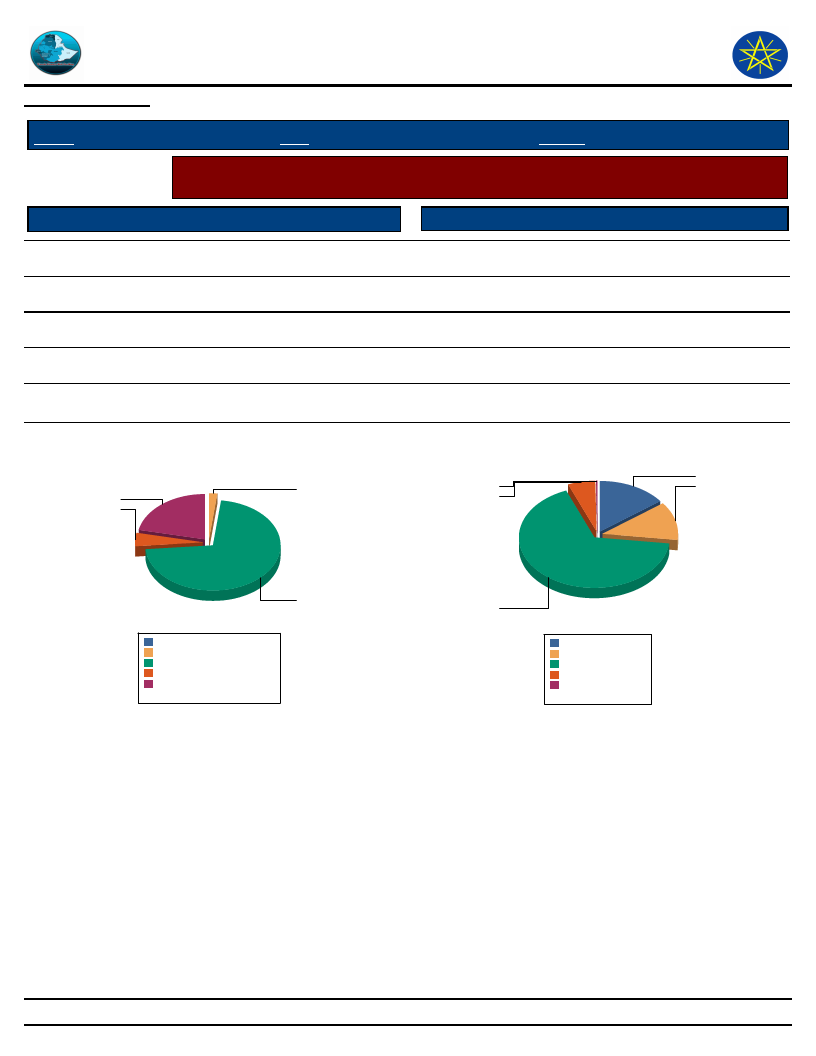
Wereda Disaster
Risk Profile
Data_Collected_Date
Disaster Risk Management
and Food Security Sector (DRMFSS)
Wednesday, December 3, 2014
Region S.N.N.P
Selected Indicator
Access to Pasture
Zone SOUTH OMO
Wereda BENA TSEMAY
Agriculture (Livestock): Pasture Availability - Households perception on access
and quality of pasture
Response Percent
Quality of Pasture
Response Percent
Regularly available
4.68
Excellent
0.32
Occasionally
71.60
Good
12.30
Seldom available
21.80
Adequate
14.70
Never available
1.94
Poor
66.80
----
0.00
Very poor
5.83
Household responses to Access to Pasture for
Livestock
1.9
21.8
4.7
Household responses to Quality of Pasture
14.7
0.3
12.3
5.8
71.6
----
Never available
Occasionally
Regularly available
0.0%
1.9%
71.6%
4.7%
Seldom available 21.8%
Total:
100.0%
66.8
Adequate 14.7%
Good
12.3%
Poor
66.8%
Very poor 5.8%
Excellent 0.3%
Total:
100.0%
83
Page 1 of 1
Data_Collected_Date
Wednesday, December 3, 2014
Region S.N.N.P
Zone SOUTH OMO
Wereda BENA TSEMAY
Selected Indicator
Agriculture (Livestock): Pasture Availability - Households perception on
problematic months for pasture availability
Problematic Months
Order of Severity
Ginbot
Hidar
Meazea
Megabit
Meskerem
Tahsas
Tir
Yekatit
1st
0.97
8.08
0.32
46.80
38.40
5.33
2nd
1.94
6.96
49.80
41.30
3rd
0.16
0.16
1.96
15.03
20.75
9.80
52.12
84
Page 1 of 1
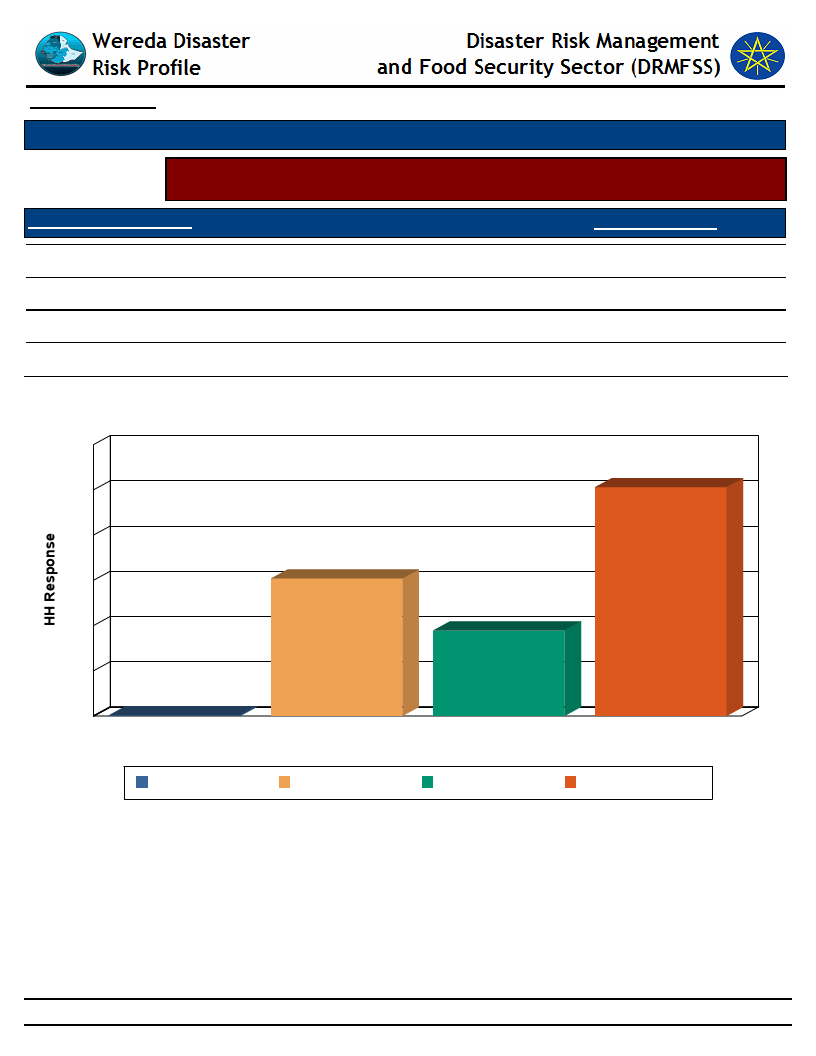
Data_Collected_Date
Wednesday, December 3, 2014
Selected Indicator
Agriculture (Livestock): Water Availability - Households response on water
availability for livestock
Access to Water - Livestock
Household Response
Regularly available
Occasionally
Seldom available
Never available
18.90
30.40
50.60
0.17
Household Access to Water for Livestock
60
51
50
40
30
30
20
19
10
0
0
Never available
Never available
Occasionally
Regularly available
Access to Water - Livestock
Occasionally
Regularly available
Seldom available
Seldom available
85
Page 1 of 1
Data_Collected_Date
Wednesday, December 3, 2014
Region S.N.N.P
Zone SOUTH OMO
Wereda BENA TSEMAY
Selected Indicator
Agriculture (Livestock): Water Availability - Households perception on
problematic months for water availability for Livestock
Problematic Months
Order of Severity
Ginbot
Hidar
Meazea
Megabit
Meskerem
Sene
Tahsas
Tikimt
Tir
Yekatit
1st
0.90
3.97
0.18
43.50
40.40
11.00
2nd
0.18
0.18
2.35
7.78
51.20
38.30
3rd
0.18
0.37
2.20
15.41
0.18
26.06
0.18
49.17
86
Page 1 of 1
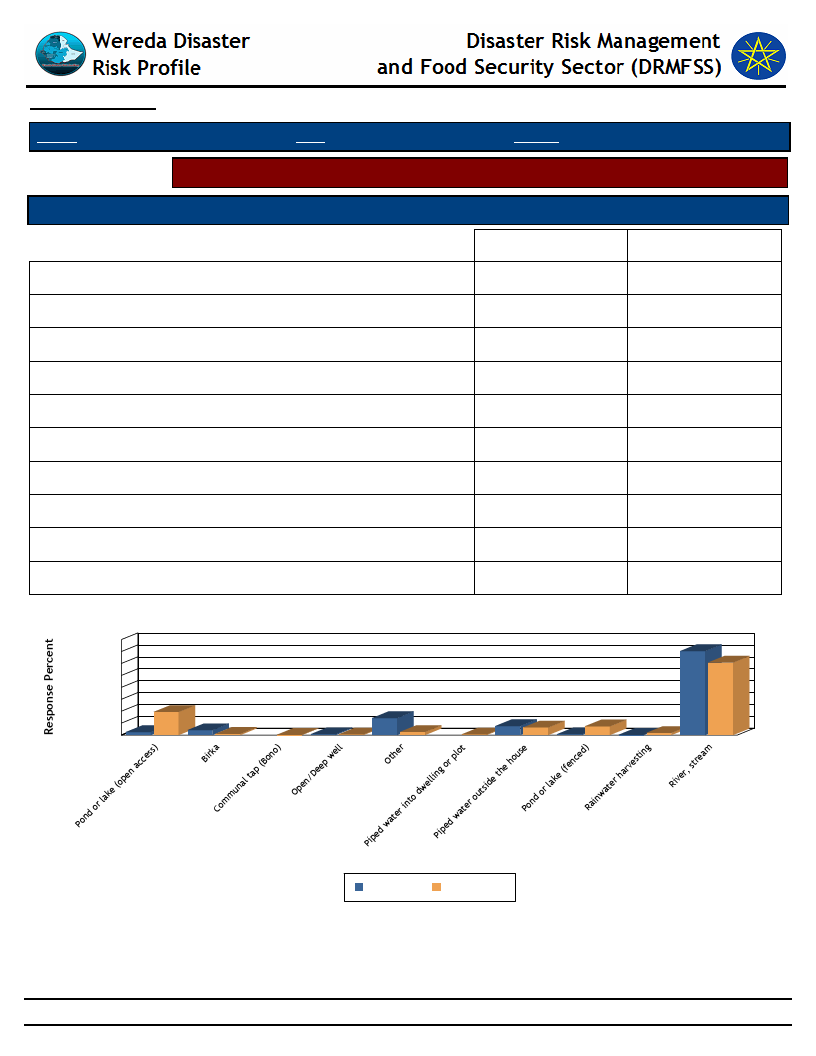
Data_Collected_Date
Wednesday, December 3, 2014
Region S.N.N.P
Zone SOUTH OMO
Wereda BENA TSEMAY
Selected Indicator
Sources of water for livestock (households response in %)
Type of Livestock Owned
Pond or lake (open access)
Birka
Communal tap (Bono)
Open/Deep well
Other
Piped water into dwelling or plot
Piped water outside the house
Pond or lake (fenced)
Rainwater harvesting
River, stream
Changes Observed By Households
Dry Season
2.45
4.08
0.65
14.20
7.52
0.65
0.16
70.30
Wet Season
19.30
0.97
0.16
0.49
2.59
0.49
6.31
7.28
1.78
60.70
Household Responses to Type of Water Source and Season for Livestock
80
70
60
50
40
30
19
20
10 2
0
41
14
0
10
3
86
7
0
1
02
70
61
Type of Water Source & Season
Dry Season
Wet Season
87
Page 1 of 1
WDRP Indicators
Access to Market and Credit
88
Wereda Disaster
Risk Profile
Disaster Risk Management
and Food Security Sector (DRMFSS)
Data_Collected_Date
Wednesday, December 3, 2014
Region S.N.N.P
Zone SOUTH OMO
Wereda BENA TSEMAY
Selected Indictor:
KebeleName
CHALI
BEFO
OLU
SHABA
Economic Vulnerability: Proportion of Produce Sold and Market - Proportion of crops and livestock sold from total
production and markets
Market_For_Crops
Market_For_Livestock_Produce
Percent
Livestock_Sold
Total_% Comments
Sold
Kako market
Kako market
Crop=50%
,
This community sell both crop and
livestock products in Kako market
.
Crop produced is
not sold
Woito and Keyafer market
Animal=1 Crop produced is not sold instead
0%
used for family consumption
Crop produced is
not sold
Woito and Keyafer market
animal=1 Crop produced is not sold instead
5%
used for family consumption
Crop produced is
not sold
Keyafer market
Animal=1 Crop produced is not sold instead
5%
used for family consumption
89
Page 1 of 1
Data_Collected_Date
Wednesday, December 3, 2014
Region S.N.N.P
Zone SOUTH OMO
Wereda BENA TSEMAY
Selected Indicator
Economic Vulnerability: Kebele Access to Markets - Access to market by Kebele
Kebele Name
CHALI
BEFO
OLU
SHABA
Market_Access_Comments
There is good access to market
The community is located far away from market area and access to market is poor
There is good access to market
The community is far away from Keyafer market and they travel long distance to arrive in
Keyafer market
90
Page 1 of 1

Data_Collected_Date
Wednesday, December 3, 2014
Region S.N.N.P
Zone SOUTH OMO
Wereda BENA TSEMAY
Selected Indicator
Economic Vulnerability: Formal & Informal Transfers - Percentage of households
reporting received formal transfers
Type of Formal Transfer
Food aid
HH Response Type of Informal Transfer
Formal
68.00 Remittances (from relative living elsewhere)
HH Response
0.20
Cash-for-Work project
16.70 Zakaat
1.00
Faffa
0.60 Cash loan (no interest)
7.20
Free cash
0.20 Food or grain gift
0.50
Seeds
0.50 Grain loan (no interest)
0.30
Seed gift
2.60
Seed loan
5.40
Free use of pack animals (camels or donkeys)
0.60
Restocking of poorer relatives
0.30
1.90
Sacrifice made to feed the poor
1.90
Cash or kind gift to married daughters when they visit
0.30
parents or relatives
Gift of livestock to newly-weds
0.60
Donation or loan of milking animals to a relative or
0.50
friend
Dowry given to bride’s parents
0.50
Donations of cash or animals to disaster stricken
0.20
people
91
Page 1 of 2
Data_Collected_Date
Wednesday, December 3, 2014
Region S.N.N.P
Zone SOUTH OMO
Wereda BENA TSEMAY
Selected Indicator
Economic Vulnerability: Formal & Informal Transfers - Percentage of households
reporting received formal transfers
Type of Formal Transfer
HH Response Type of Informal Transfer
Formal
Type of Formal Transfer Received By Households
HH Response
16.7
0.5
0.6
0.2
0.0%
Cash-for-Work project 19.4%
Faffa
0.7%
Food aid
79.1%
Free cash
0.2%
Seeds
0.6%
Total:
100.0%
68
92
Page 2 of 2
Data_Collected_Date
Wednesday, December 3, 2014
Region S.N.N.P
Zone SOUTH OMO
Wereda BENA TSEMAY
Selected Indicator
Economic Vulnerability: Formal & Informal Transfers - Percentage of households
reporting received Informal transfers
Type of Formal Transfer
Food aid
HH Response Type of Informal Transfer
Formal
68.00 Remittances (from relative living elsewhere)
HH Response
0.20
Cash-for-Work project
16.70 Zakaat
1.00
Faffa
0.60 Cash loan (no interest)
7.20
Free cash
0.20 Food or grain gift
0.50
Seeds
0.50 Grain loan (no interest)
0.30
Seed gift
2.60
Seed loan
5.40
Free use of pack animals (camels or donkeys)
0.60
Restocking of poorer relatives
0.30
1.90
Sacrifice made to feed the poor
1.90
Cash or kind gift to married daughters when they visit
0.30
parents or relatives
Gift of livestock to newly-weds
0.60
Donation or loan of milking animals to a relative or
0.50
friend
Dowry given to bride’s parents
0.50
Donations of cash or animals to disaster stricken people
0.20
93
Page 1 of 2

Data_Collected_Date
Wednesday, December 3, 2014
Region S.N.N.P
Zone SOUTH OMO
Wereda BENA TSEMAY
Selected Indicator
Economic Vulnerability: Formal & Informal Transfers - Percentage of households
reporting received Informal transfers
Type of Formal Transfer
HH Response Type of Informal Transfer
Formal
Type of Informal Transfer Received By Households
HH Response
17
1
1
0
0.0%
Cash-for-Work project 19.4%
Faffa
0.7%
Food aid
79.1%
Free cash
0.2%
Seeds
0.6%
Total:
100.0%
68
94
Page 2 of 2
Data_Collected_Date
Wednesday, December 3, 2014
Region S.N.N.P
Selected Indicator
Zone SOUTH OMO
Wereda BENA TSEMAY
Capacity: Access to Credit Facilities - Households access to credit facilities
Type of Access To Credit Facilities
Households with membership in any credit /micro finance society (%)
Households who borrowed any money in the last one year (%)
Households who tried to borrow 1-2
Households who tried to borrow 3-4
Households who managed to get credit 1-2
Households who managed to get credit 3-4
Indicator_Value
6.40
11.60
97.10
2.90
97.00
3.00
Average No. of HHs Tried to get Credit
Average No. HHs Managed to get Credit
1.14
1.14
95
Page 1 of 1

Data_Collected_Date
Wednesday, December 3, 2014
Region S.N.N.P
Zone SOUTH OMO
Wereda BENA TSEMAY
Selected Indicator
Capacity: Access to Credit Facilities - Percentage of households by major reasons
of borrowing money
Type of Borrowing Reason
Degree of Importance of the Borrowing Reasons - HH Respones
Buy agricultural input
Buy food
Buy or rent land
Others (specify)
Pay for education
Pay for health care
Pay for social event
1st
Important
4.69
37.50
1.56
10.90
40.60
4.69
2nd
Important
14.29
19.05
4.76
4.76
4.76
47.62
4.76
3rd
Important
33.33
11.11
11.11
22.22
22.22
96
Page 1 of 1
Data_Collected_Date
Wednesday, December 3, 2014
Region S.N.N.P
Zone SOUTH OMO
Wereda BENA TSEMAY
Selected Indicator
Capacity: Access to Credit Facilities - Percentage of households by major sources
of credit
Major Sources of Credit for Households
Degree of Importance of the Credit Source
Bank/formal lending institution
1st
Important
5.56
2nd
Important
6.25
3rd
Important
Friends/relatives
55.60
18.75
12.50
Help associations (Edir)
7.41
50.00
Local shops / moneylenders
1.85
6.25
12.50
Neighbors
24.10
56.25
12.50
Others (specify)
5.56
6.25
12.50
97
Page 1 of 1
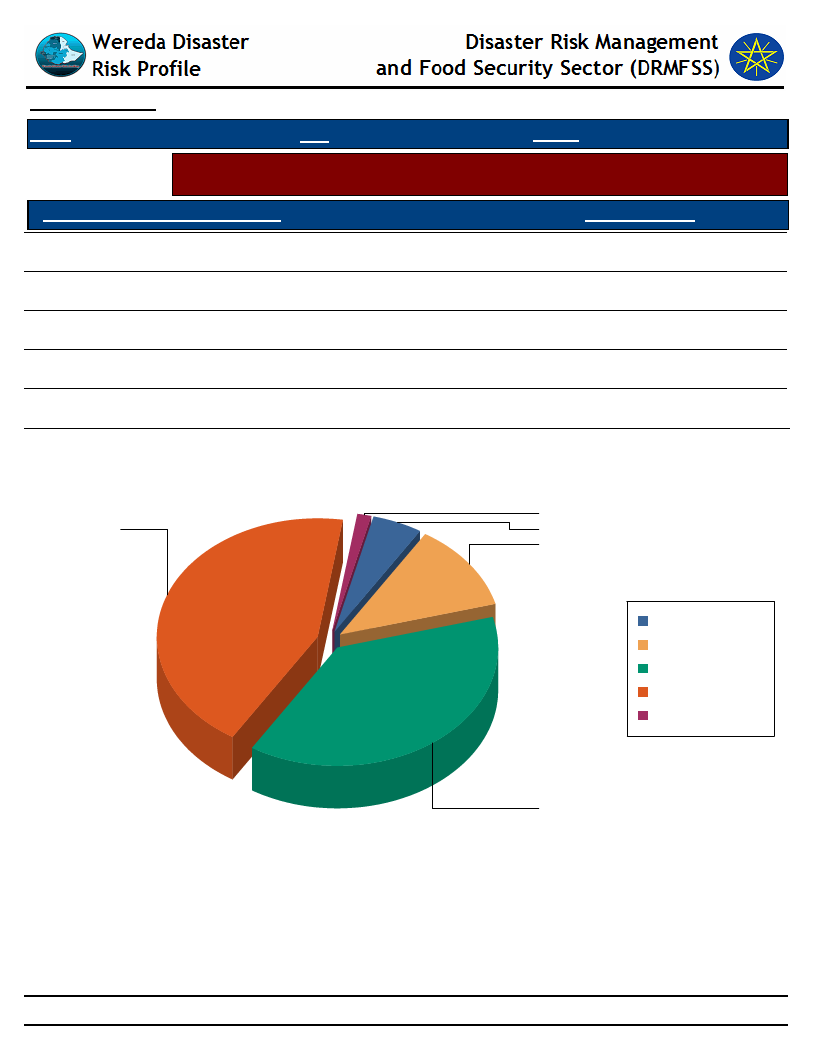
Data_Collected_Date
Wednesday, December 3, 2014
Region S.N.N.P
Zone SOUTH OMO
Wereda BENA TSEMAY
Selected Indicator
Capacity: Access to Credit Facilities - Percent of households with ability to raise
500 birr in one week
HH Ability To Raise 500 Br in One Week
Response_Percent
Yes, we would use our savings
43.60
Yes, by borrowing money
38.10
Yes, with some help from others
1.33
Perhaps, but I doubt it
12.00
No, it would be impossible
4.99
Households' Ability To Raise 500 Br in One Week
1
44
5
12
No, it would be
impossible
Perhaps, but I doubt it
Yes, by borrowing
money
Yes, we would use our
savings
Yes, with some help
from others
38
98
Page 1 of 1
WDRP Indicators
Health and Sanitation
Characteristics
99
Data_Collected_Date
Wednesday, December 3, 2014
Region S.N.N.P
Zone SOUTH OMO
Wereda BENA TSEMAY
Selected Indicator
Household Access to Health Facilities - Where do patients go for health care?
Constraints to adequate healthcare
Where do Patients Go for Healthcare
HH Response Constraints to Adequate Health Car
HH Responses
Did not get Health Care
Central Hospital
0.97
No money for treatment costs
3.22
Not aware about any health facility
25.00
75.00
Where Do Patients go for Health care?
Constraints to Adequate Health Care
25
1
Central Hospital
76.8%
Did not get Health Care 23.2%
Total:
100.0%
3
75
No money for treatment costs
25.0%
Not aware about any health facility 75.0%
Total:
100.0%
100
Page 1 of 1
Data_Collected_Date
Wednesday, December 3, 2014
Region S.N.N.P
Selected Indicator
Zone SOUTH OMO
Wereda BENA TSEMAY
Hazards: Health problems and changes over the last decade
Kebele Name
Health_Problems
Changes_In_Last_Decade
CHALI
BEFO
OLU
SHABA
The common seasonal diseases are Malaria, common cold
and Diarrhea
The common seasonal diseases are Malaria and Diarrhea
Diarrhea , pneumonia and malaria are common
Common seasonal diseases are Diarrhea and common cold
There is improvement
There is improvement
101
Page 1 of 1
Wereda Disaster
Risk Profile
Data_Collected_Date
Region S.N.N.P
Zone SOUTH OMO
Disaster Risk Management and Food
Security Sector (DRMFSS)
Wednesday, December 3, 2014
Wereda BENA TSEMAY
Selected Indicator
Household Health Status - Households health condition and major health problems
Health Condition
HH Response Population Sickness
HH Response Children Sickness
HH Response
Good health
81.0
Malaria
18.0
Chronic fever
1.0
Health Condition of the Community
40
35
30
25
20
15
10
5
0
40
35
30
81.2
25
20
15
10
5
Good health 100.0%
0
Total:
100.0%
28
Chronic fever
27
Chronic fever
38.0 Malaria
28.0 Chronic fever
11.0 Diarrhea
Population Sickness in the Community
38
Population Sickness
Malaria
Children Sickness in the Community
38
22
Diarrhea
Children Sickness
Malaria
38.0
27.0
22.0
Chronic fever
Malaria
Chronic fever
Diarrhea
Malaria
102
Page 1 of 1
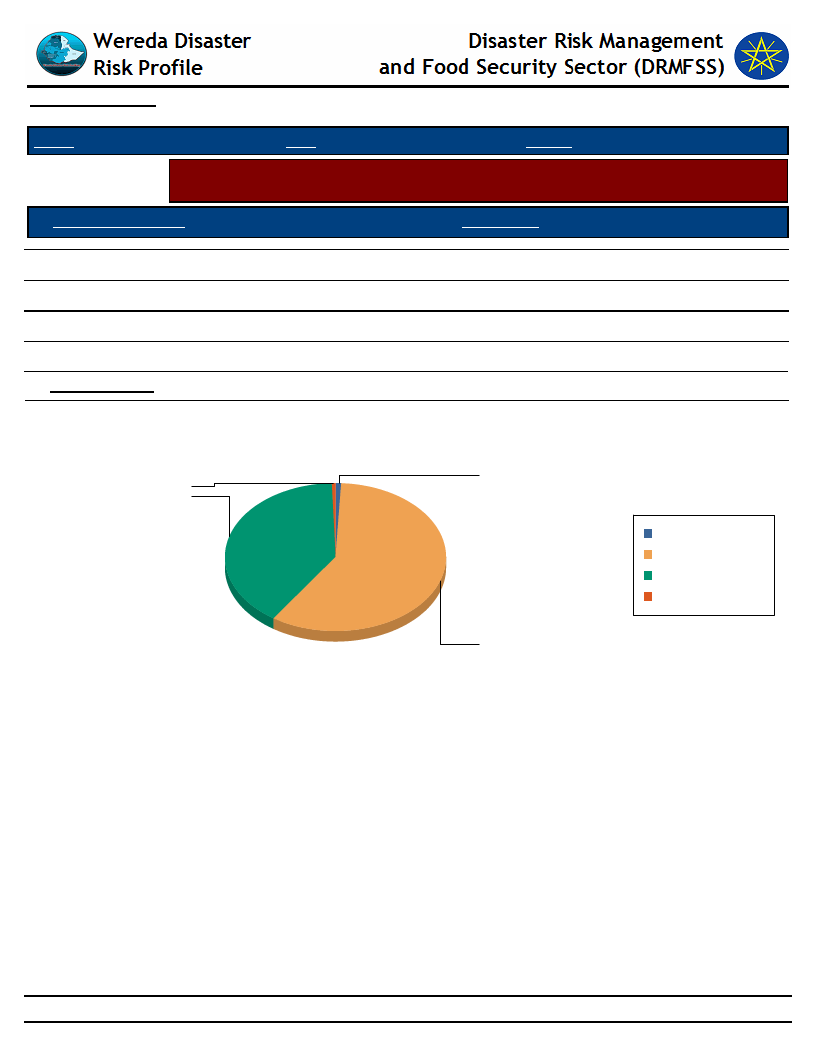
Data_Collected_Date
Wednesday, December 3, 2014
Region S.N.N.P
Zone SOUTH OMO
Wereda BENA TSEMAY
Selected Indicator
Household Access to Sanitation - Percentage of households with access to
different kind of toilet facilities
Type of Toilet Facility
HH Response
Modern water closet
Ventilated, build in latrine
Outdoors latrine/hole on plot
No facilities/Open Space
HH Sharing Toilet
0.96
0.64
39.80
58.60
4.50
Household Responses to the type of toilet facilities in the community
0.6
39.8
1.0
Modern water closet
No facilities/Open Space
Outdoors latrine/hole on
plot
Ventilated, build in latrine
58.6
103
Page 1 of 1
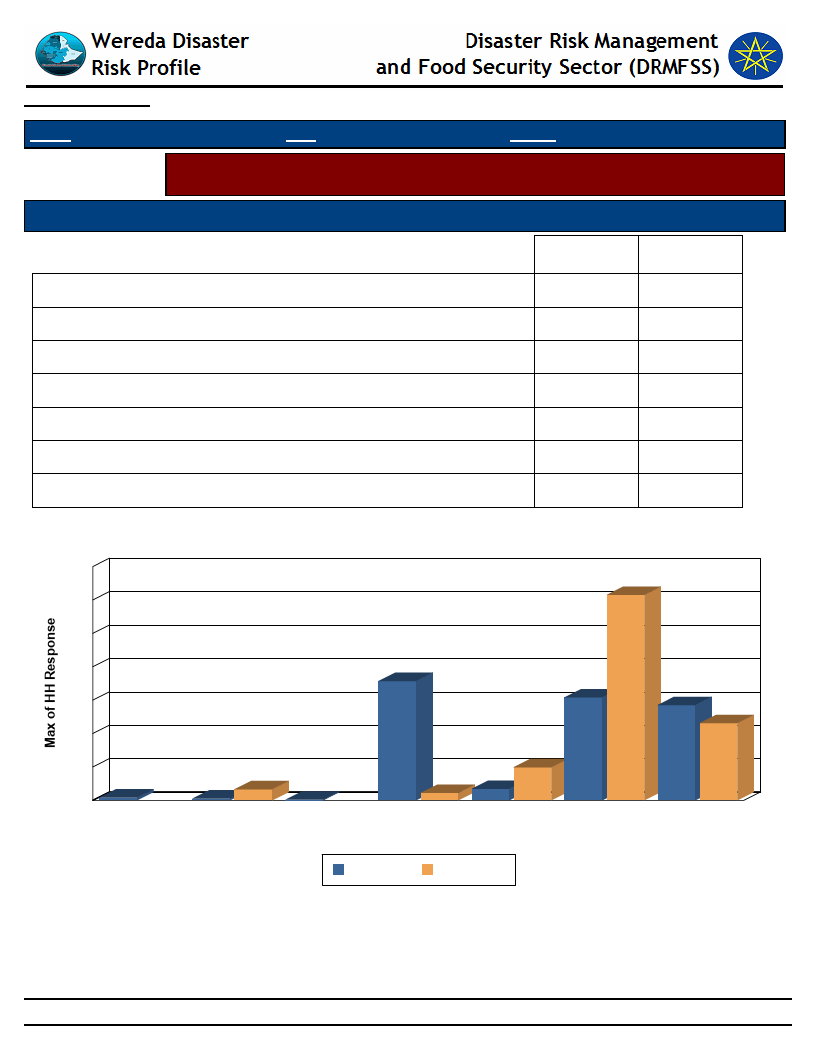
Data_Collected_Date
Wednesday, December 3, 2014
Region S.N.N.P
Zone SOUTH OMO
Wereda BENA TSEMAY
Selected Indicator
Household Access to Drinking Water - Sources of drinking water for households
(response in %)
Sources of drinking water for Households
Priority of the Water Source
Main
Secondary
Communal tap (Bono)
Open well
Piped water into dwelling or plot
Piped water outside the house
Pond or lake (fenced)
Pond or lake (open access)
River, stream
0.85
0.51
0.17
35.70
3.42
30.80
28.50
0.00
3.30
0.00
2.20
9.89
61.50
23.10
Source of Drinking Water & Type of Source
70
62
60
50
40
30
20
10
1
0
Communal tap
(Bono)
3
1
Open well
36
31
29
23
0
Piped water
into dwelling or
plot
2
Piped water
outside the
house
10
3
Pond or lake Pond or lake River, stream
(fenced)
(open access)
Main
Secondary
104
Page 1 of 1
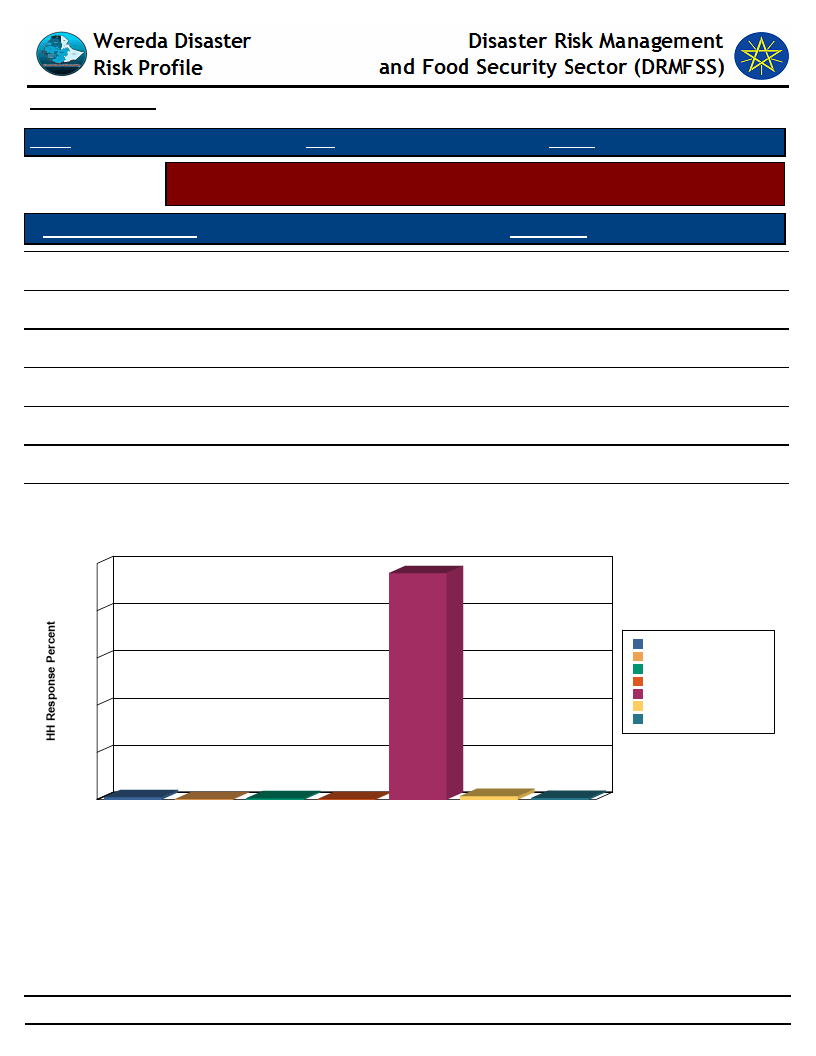
Data_Collected_Date
Wednesday, December 3, 2014
Region S.N.N.P
Zone SOUTH OMO
Wereda BENA TSEMAY
Selected Indicator
Household Access to Drinking Water - Households methods of treating drinking
water
Method of Treating Water
HH Response
Boil
0.97
Water Guard
0.65
Use filter
1.46
Other chemicals
0.16
Other Method (specify)
95.90
None
0.49
DK
0.16
Method of Treating Water by Households
100
96
80
60
40
20
1
0
Boil
0
0
0
1
1
DK
None
Other Other Method Use filter Water Guard
chemicals
(specify)
Water Treatment Method
Boil
DK
None
Other chemicals
Other Method (specify)
Use filter
Water Guard
105
Page 1 of 1
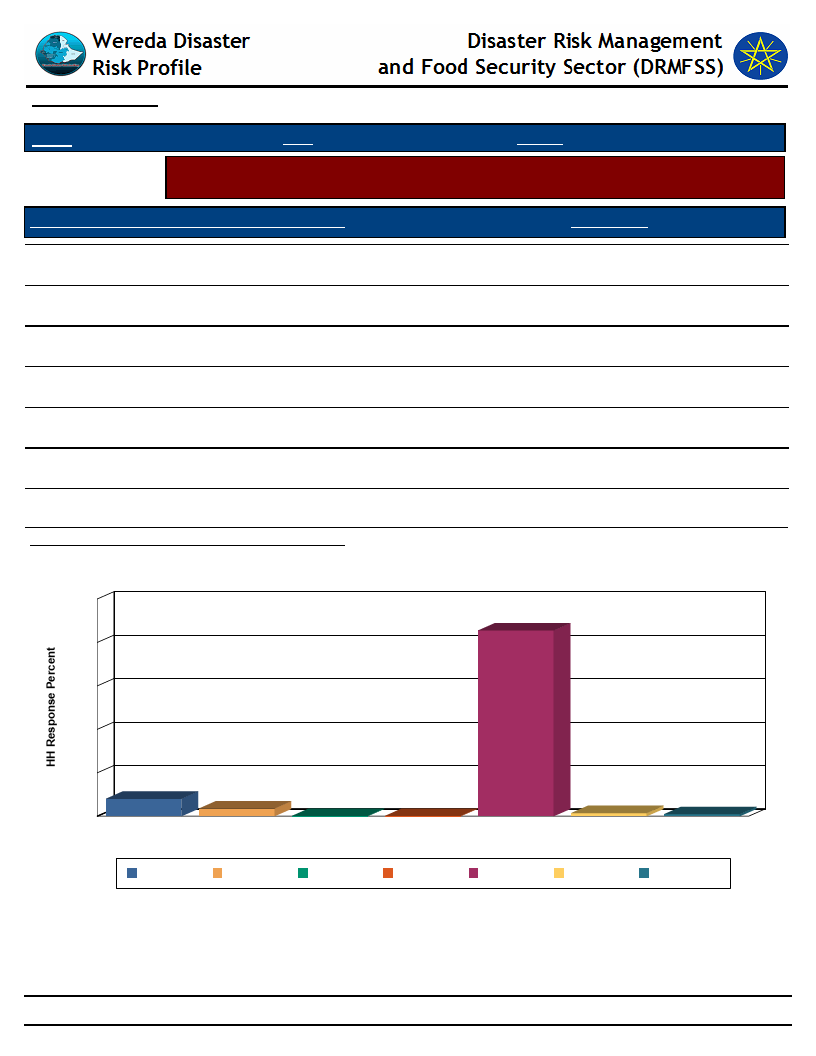
Data_Collected_Date
Wednesday, December 3, 2014
Region S.N.N.P
Zone SOUTH OMO
Wereda BENA TSEMAY
Selected Indicator
Household Access to Drinking Water - Number of times households fetch water in
a week
Number of Times Households Fetch Water in a Week
HH Response
Once
0.16
Twice
0.96
Three times
1.45
Four times
3.54
Five times
8.04
Six times
85.50
Seven times
Average Number of Times HH Fetch Water Per Week
Number of Times HH Fetch Water in a Week
100
86
80
0.16
6.74
60
40
20
8
0
Five times
4
Four times
0
0
Once
Seven times
Six times
Number of Times HH Fetch Water in a Week
1
Three times
1
Twice
Five times
Four times
Once
Seven times
Six times
Three times
Twice
106
Page 1 of 1
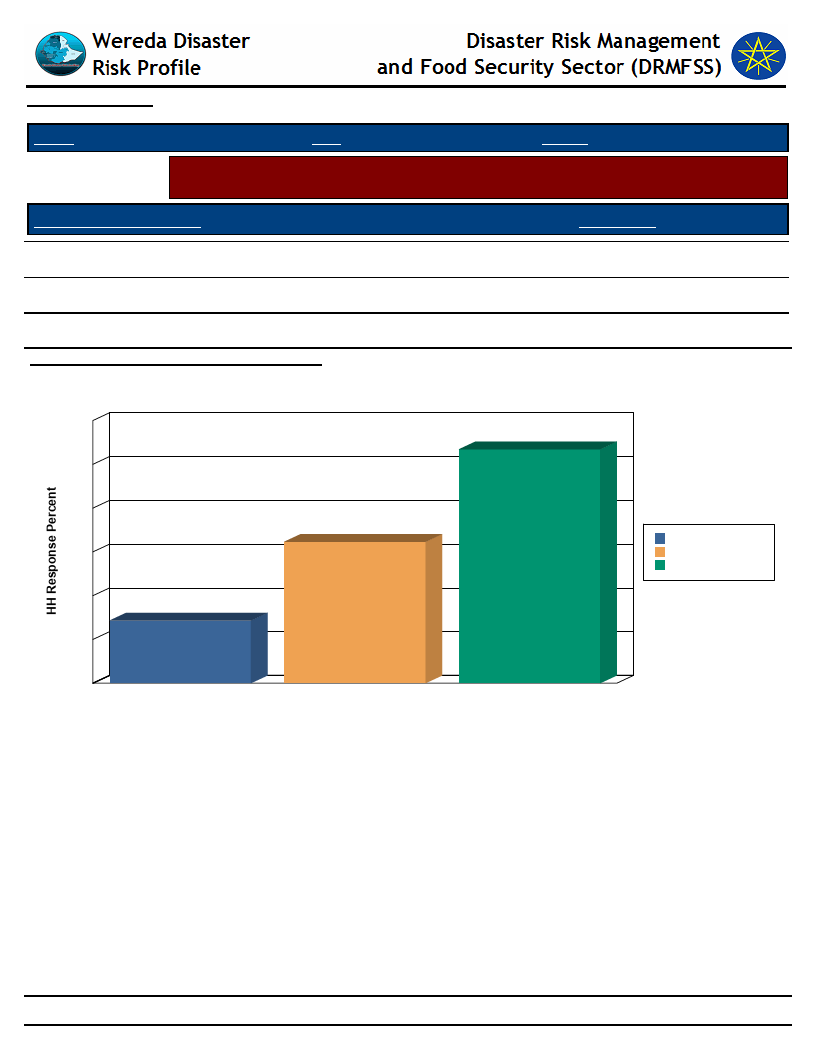
Data_Collected_Date
Wednesday, December 3, 2014
Region S.N.N.P
Zone SOUTH OMO
Wereda BENA TSEMAY
Selected Indicator
Household Access to Drinking Water - Time taken per day to fetch water for
households
Time Taken To Fetch Water
HH Response
Less than 30 min
53.40
30 min - 1 hr
32.30
1 hr and Above
Average Number of Times Taken To Fetch Water
14.30
42.99
Time Taken To Fetch Water for the HH
60
53
50
40
32
30
20
14
10
1 hr and Above
30 min - 1 hr
Less than 30 min
0
1 hr and Above
30 min - 1 hr
Less than 30 min
Time Taken To Fetch Water
107
Page 1 of 1
WDRP Indicators
Coping Mechanisms and
Preparedness
108

Wereda Disaster
Risk Profile
Data_Collected_Date
Disaster Risk Management and Food
Security Sector (DRMFSS)
Wednesday, December 3, 2014
Region S.N.N.P
Selected Indicator
Zone SOUTH OMO
Wereda BENA TSEMAY
Capacity: Community Preparedness against Sudden Onset Disasters
KebeleName
Precaution_1
Comment_1
Precaution_2
Comment_2
Precaution_3
Comment_3
CHALI
BEFO
OLU
SHABA
Storage rather than
sale of crop surplus
Selling livestock and
buying food grain
Sell weak animal
which have no
capacity to resist the
disaster
Storage of feed for
pregnant and
lactating livestock
Shortage of food is
one of the big
problems during the
time of disaster
To reduce the effect
of disaster on
livestock and to
build capacity of
household to resist
the disaster
Weak animals are
highly vulnerable
compared to the
strong ones
To avoid shortage of
feed
Reduce number of
meals eaten in a
day
Selling tobacco and
buying crops for
food
Migrate animals to
better places
Buying food and
other necessities
It helps to build
adaptation during
the time of drought
This measure brings
income to the
household and fulfil
food gap at time of
disaster
Store feeds for
pregnant, weak
and lactating
livestock
Depositing
animal feed for
pregnant and
lactating
livestock
It is the best way to
reduce the effect
of the disaster
109
Page 1 of 1
Wereda Disaster
Risk Profile
Disaster Risk Management and Food
Security Sector (DRMFSS)
Data_Collected_Date
Wednesday, December 3, 2014
Region S.N.N.P
Zone SOUTH OMO
Wereda BENA TSEMAY
Selected Indicator
Capacity: Community Preparedness against Increase in Disaster Intensity
KebeleName
Precaution_1
Comment_1
Precaution_2
Comment_2
Precaution_3
Comment_3
CHALI
BEFO
OLU
SHABA
Migration
Migration
Migrant to better
places
Migrant to better
places
110
Page 1 of 1
Wereda Disaster
Risk Profile
Disaster Risk Management and Food
Security Sector (DRMFSS)
Data_Collected_Date
Wednesday, December 3, 2014
Region S.N.N.P
Zone
SOUTH OMO
Wereda BENA TSEMAY
Selected Indicator
Capacity: Community Preparedness against Disasters
Kebele Name
Precaution 1
Comment 1
Precaution 2
Comment 2
Precaution 3
Comment 3
CHALI
BEFO
Plantation of fruit
and trees around
the field and home
It provides dual
purpose
(environmental
conservation and
income generation)
OLU
SHABA
Cultivating drought
resistant crop
varieties
Cultivating drought
resistant crop
varieties
To mitigate drought
effect
To mitigate drought
effect
111
Page 1 of 1

Wereda Disaster
Risk Profile
Data_Collected_Date
Region S.N.N.P
Selected Indicator
Kebele Name
Type of Disaster(s)
Zone
SOUTH OMO
Hazard: Coping and recovering during last Disaster
CHALI
Human disease (measles)
Coping_Strategy
Going to health post /health centre, private clinic
Disaster Risk Management and Food
Security Sector (DRMFSS)
Wednesday, December 3, 2014
Wereda BENA TSEMAY
Description
These measures have good impact on coping
Recovery_Strategy
Providing cow milk and foods to the children
Description
These measures are good for recovery
Community
Participation_Ways
Description
The community help each other by bringing the patient to health post
Those activities are common in the area
112
Page 1 of 4

Wereda Disaster
Risk Profile
Data_Collected_Date
Region S.N.N.P
Selected Indicator
Kebele Name
Type of Disaster(s)
Zone
SOUTH OMO
Hazard: Coping and recovering during last Disaster
BEFO
Drought
Coping_Strategy
Selling livestock, collection of wild foods
Description
These measures have good impact on coping
Recovery_Strategy
Borrowing food or cash from friends or relatives
Description
These measures are good for recovery
Community
Participation_Ways
Description
There is culture of sharing resource for those who do not have
Disaster Risk Management and Food
Security Sector (DRMFSS)
Wednesday, December 3, 2014
Wereda BENA TSEMAY
113
Page 2 of 4

Wereda Disaster
Risk Profile
Data_Collected_Date
Region S.N.N.P
Selected Indicator
Kebele Name
Type of Disaster(s)
Zone
SOUTH OMO
Hazard: Coping and recovering during last Disaster
OLU
Drought
Disaster Risk Management and Food
Security Sector (DRMFSS)
Wednesday, December 3, 2014
Wereda BENA TSEMAY
Coping_Strategy
Decreasing daily food intake, selling small animals like goat and sheep
Description
These measures have good impact on coping
Recovery_Strategy
Getting credit from nearby friends or relatives, selling the remaining animals
Description
These measures are good for recovery
Community
Participation_Ways
Description
During the incident the rich share their resources in the form of credit or free, after the incident the one who have
capacity help the one who have no capacity by providing crops and small animals
Such type of cooperation is highly important for the survival of the community
114
Page 3 of 4

Wereda Disaster
Risk Profile
Data_Collected_Date
Region S.N.N.P
Selected Indicator
Kebele Name
Type of Disaster(s)
Zone
SOUTH OMO
Hazard: Coping and recovering during last Disaster
SHABA
Drought
Coping_Strategy
Selling livestock, eating wild fruits/leaves
Description
These measures have good impact on coping
Recovery_Strategy
Borrowing money or other things
Description
These measures are good for recovery
Community
Participation_Ways
Description
There is culture of sharing resource for those who do not have
This is common in the area
Disaster Risk Management and Food
Security Sector (DRMFSS)
Wednesday, December 3, 2014
Wereda BENA TSEMAY
115
Page 4 of 4
Data_Collected_Date
Region S.N.N.P
Zone SOUTH OMO
Selected Indicator
Capacity: Type Community Participation
Kebele Name
Levels_Comm_Participation
CHALI
OLU
SHABA
The level of cooperation is very good both in
good and bad time
The level of cooperation is very good both in
good and bad time
The level of cooperation is very good both in
good and bad time
Wednesday, December 3, 2014
Wereda BENA TSEMAY
Changes_In_Last_Decade
No change
No change
116
Page 1 of 1
Data_Collected_Date
Wednesday, December 3, 2014
Region S.N.N.P
Selected Indicator
Zone
SOUTH OMO
Wereda BENA TSEMAY
Capacity: Recovery from Losses from Disasters - Percentage of Households who
have managed to recover from losses of disasters
Percentage of households who have managed to recover from losses of disasters
Comments
94.50 %
117
Page 1 of 1
Data_Collected_Date
Region S.N.N.P
Zone SOUTH OMO
Wednesday, December 3, 2014
Wereda BENA TSEMAY
Selected Indicator
Type of Disaster
Capacity: Recovery from Losses from Disasters - Percentage of households
recovered from past disasters by type of Disasters
Recovered Percentage
Droughts
Floods
Landslides
Crop diseases
Livestock diseases
Human diseases
Heavy Rain
Frost / Cold waves
Heat waves/ High temp
Conflicts
Economic / Price shock
22.80
2.01
0.05
19.80
25.70
14.00
0.19
0.05
12.10
0.14
3.16
118
Page 1 of 1
Data_Collected_Date
Wednesday, December 3, 2014
Region S.N.N.P
Zone SOUTH OMO
Wereda BENA TSEMAY
Selected Indictor:
Capacity: Recovery from Losses from Disasters - Proportion of households
recovered by type of Losses
Type of Loss
Physical damages on houses and property
Percentage
5.68
Crop damage
36.60
Livestock damage
27.80
Death of household members
1.20
Illness/health problems
12.30
Loss of access to social services, including school
2.16
Loss of income
3.70
Loss of savings
1.83
Lost access to grazing land
4.23
Lost access to water source
2.74
Had to flee/change residence area
1.11
Other losses/damages
0.67
119
Page 1 of 1
Data_Collected_Date
Region S.N.N.P
Zone SOUTH OMO
Wednesday, December 3, 2014
Wereda BENA TSEMAY
Selected Indicator
Capacity: Coping Options if More Resources Available - What coping strategy
could be adopted if more resource were available?
Coping Strategy To Be Adopted
Response (%)
Adaptation of economic activities to hazards season (e.g. cropping cycle, short term
crops, etc.)
Storage of food and other necessities
62.90
31.10
Physical protection of buildings and property
5.81
120
Page 1 of 1
Data_Collected_Date
Wednesday, December 3, 2014
Region S.N.N.P
Zone SOUTH OMO
Wereda BENA TSEMAY
Selected Indictor:
Capacity: Coping Strategies Adopted by Households - Percentage of households by
major type of coping strategies adopted (at least once)
Coping Strategy Adopted
Main Strategy
Secondary Strategy
Reduced expenditure on non-essential items (beer, cigarettes,
clothes, meat, etc.)
Sell more livestock than usual
1.33
35.40
0.49
14.40
Borrowing of food or cash (including purchasing food on credit)
20.30
15.20
Sale of productive assets (land, farm implements, vehicle, etc.)
0.06
1.39
Sending children of household for work
1.33
0.07
Reduced expenditure on health and education (including taking
children out of school)
Reduced expenditure on productive inputs (fertilizer, seeds,
livestock drugs, etc.)
Short-term / seasonal labor migration
0.06
0.00
0.11
0.00
0.72
0.97
Seek alternative or additional jobs
11.30
15.50
Collection of wild food
3.94
9.36
Rely on less preferred and less expensive food
6.82
10.80
Restrict consumption by adults in order for small children to eat
0.33
1.53
Begging for money or for food
0.22
0.00
Reduce number of meals eaten in a day
3.71
7.91
Skip entire day without eating
0.11
0.14
121
Page 1 of 2

Data_Collected_Date
Wednesday, December 3, 2014
Region S.N.N.P
Zone SOUTH OMO
Wereda BENA TSEMAY
Selected Indictor:
Capacity: Coping Strategies Adopted by Households - Percentage of households by
major type of coping strategies adopted (at least once)
Coping Strategy Adopted
Main Strategy
Secondary Strategy
Limit portion size at meals
3.60
10.90
Consumption rather than sale of crop surplus
4.38
2.43
Increased working hours
2.94
6.73
Long-term / permanent migration (including distress migration)
2.61
1.53
Sale of non-productive assets (jewellery, clothing, etc.)
0.67
0.69
122
Page 2 of 2
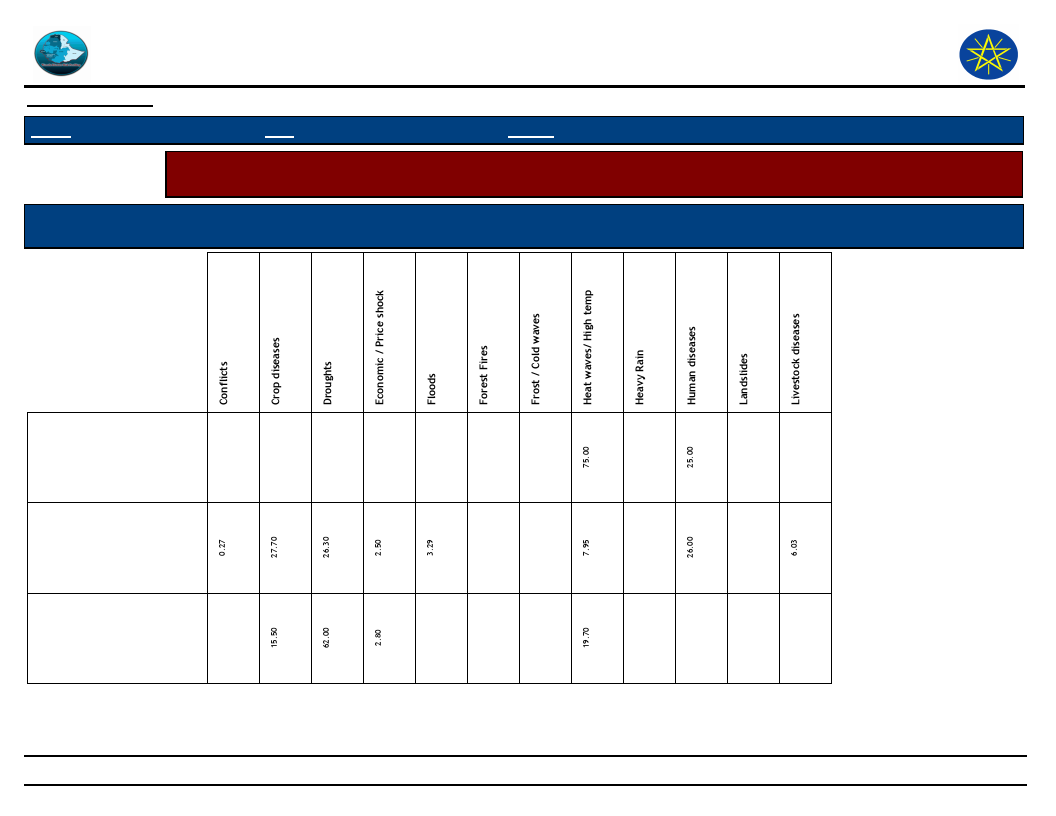
Wereda Disaster
Risk Profile
Data_Collected_Date
Region S.N.N.P
Zone
SOUTH OMO
Disaster Risk Management and Food
Security Sector (DRMFSS)
Wednesday, December 3, 2014
Wereda BENA TSEMAY
Selected Indicator
Capacity: Coping Strategies Adopted by Households - Main coping strategies adopted by households for respective
disasters
Coping Strtegies Adopted
Types of disaters for which HHs in the community adopt the listed
Coping Strtegies
Begging for money or for
food
Borrowing of food or cash
(including purchasing food
on credit)
Collection of wild food
123
Page 1 of 7
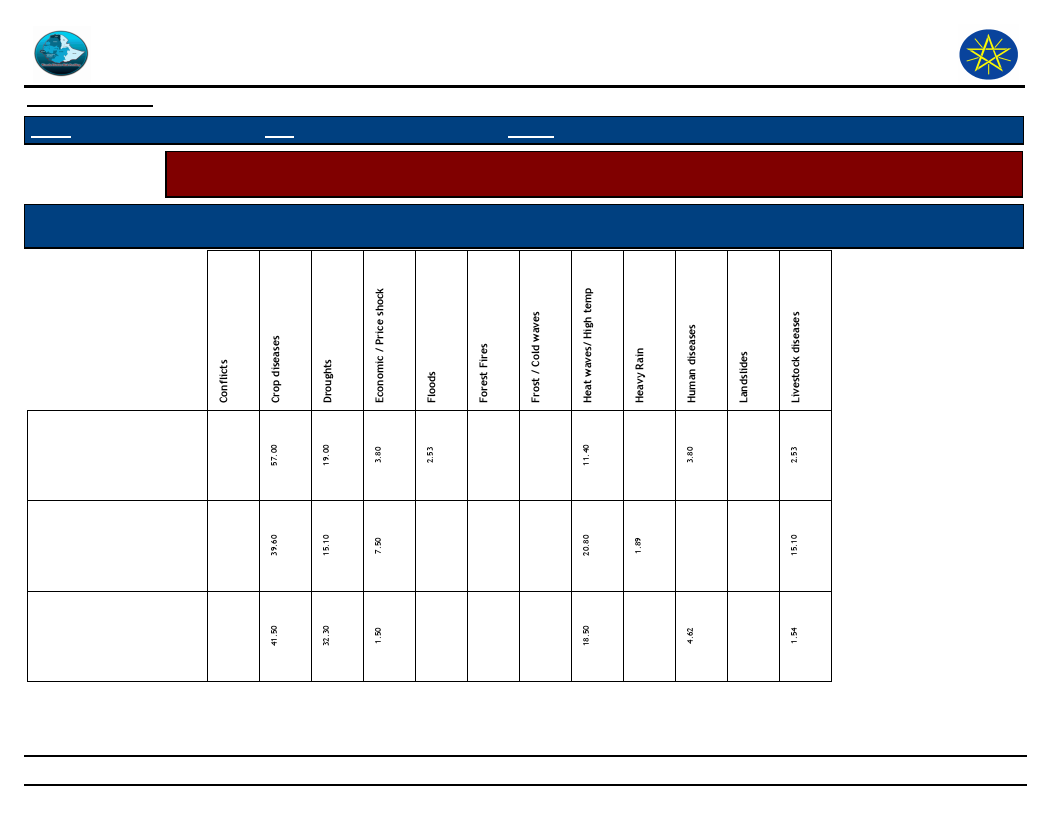
Wereda Disaster
Risk Profile
Data_Collected_Date
Region S.N.N.P
Zone
SOUTH OMO
Disaster Risk Management and Food
Security Sector (DRMFSS)
Wednesday, December 3, 2014
Wereda BENA TSEMAY
Selected Indicator
Capacity: Coping Strategies Adopted by Households - Main coping strategies adopted by households for respective
disasters
Coping Strtegies Adopted
Types of disaters for which HHs in the community adopt the listed
Coping Strtegies
Consumption rather than
sale of crop surplus
Increased working hours
Limit portion size at meals
124
Page 2 of 7
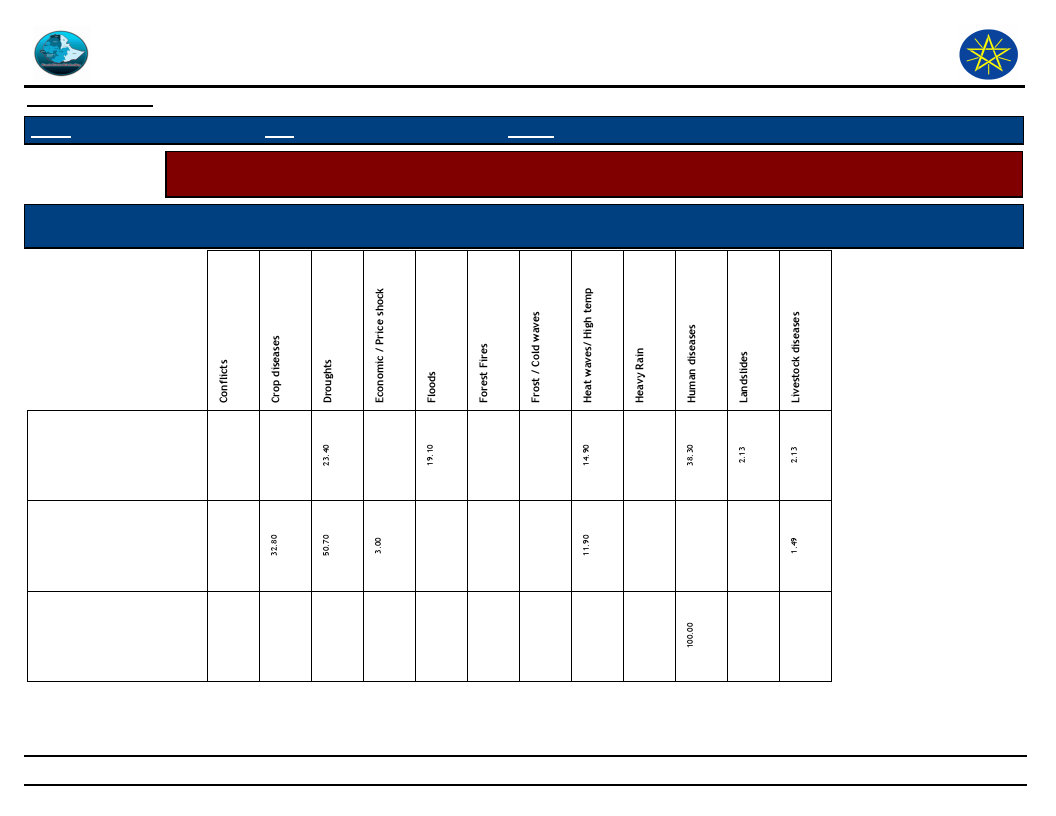
Wereda Disaster
Risk Profile
Data_Collected_Date
Region S.N.N.P
Zone
SOUTH OMO
Disaster Risk Management and Food
Security Sector (DRMFSS)
Wednesday, December 3, 2014
Wereda BENA TSEMAY
Selected Indicator
Capacity: Coping Strategies Adopted by Households - Main coping strategies adopted by households for respective
disasters
Coping Strtegies Adopted
Types of disaters for which HHs in the community adopt the listed
Coping Strtegies
Long-term / permanent
migration (including
distress migration)
Reduce number of meals
eaten in a day
Reduced expenditure on
health and education
125
Page 3 of 7
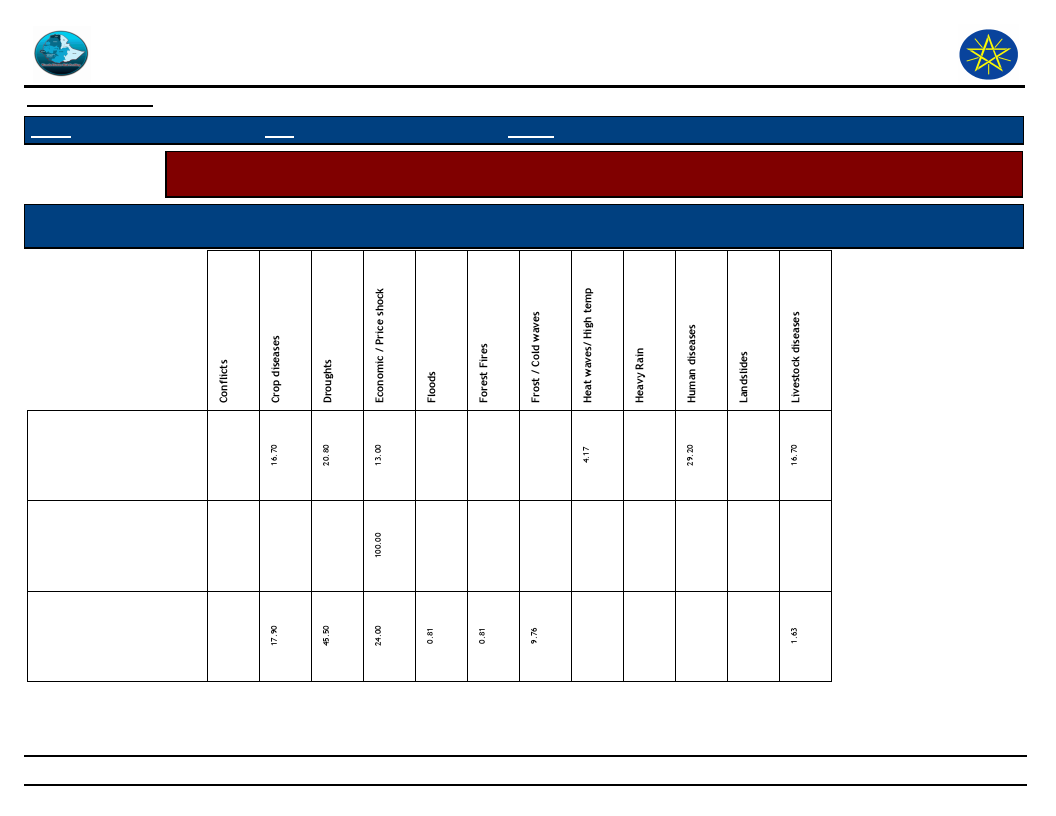
Wereda Disaster
Risk Profile
Data_Collected_Date
Region S.N.N.P
Zone
SOUTH OMO
Disaster Risk Management and Food
Security Sector (DRMFSS)
Wednesday, December 3, 2014
Wereda BENA TSEMAY
Selected Indicator
Capacity: Coping Strategies Adopted by Households - Main coping strategies adopted by households for respective
disasters
Coping Strtegies Adopted
Types of disaters for which HHs in the community adopt the listed
Coping Strtegies
Reduced expenditure on
non-essential items (beer,
cigarettes, etc)
Reduced expenditure on
productive inputs
(fertilizer, seeds, etc)
Rely on less preferred and
less expensive food
126
Page 4 of 7

Wereda Disaster
Risk Profile
Data_Collected_Date
Region S.N.N.P
Zone
SOUTH OMO
Disaster Risk Management and Food
Security Sector (DRMFSS)
Wednesday, December 3, 2014
Wereda BENA TSEMAY
Selected Indicator
Capacity: Coping Strategies Adopted by Households - Main coping strategies adopted by households for respective
disasters
Coping Strtegies Adopted
Types of disaters for which HHs in the community adopt the listed
Coping Strtegies
Restrict consumption by
adults in order for small
children
Sale of productive assets
(land, farm implements,
vehicle, etc)
Seek alternative or
additional jobs
127
Page 5 of 7

Wereda Disaster
Risk Profile
Data_Collected_Date
Region S.N.N.P
Zone
SOUTH OMO
Disaster Risk Management and Food
Security Sector (DRMFSS)
Wednesday, December 3, 2014
Wereda BENA TSEMAY
Selected Indicator
Capacity: Coping Strategies Adopted by Households - Main coping strategies adopted by households for respective
disasters
Coping Strtegies Adopted
Types of disaters for which HHs in the community adopt the listed
Coping Strtegies
Sell more livestock than
usual
Sending children of
household for work
Short-term / seasonal
labor migration
128
Page 6 of 7
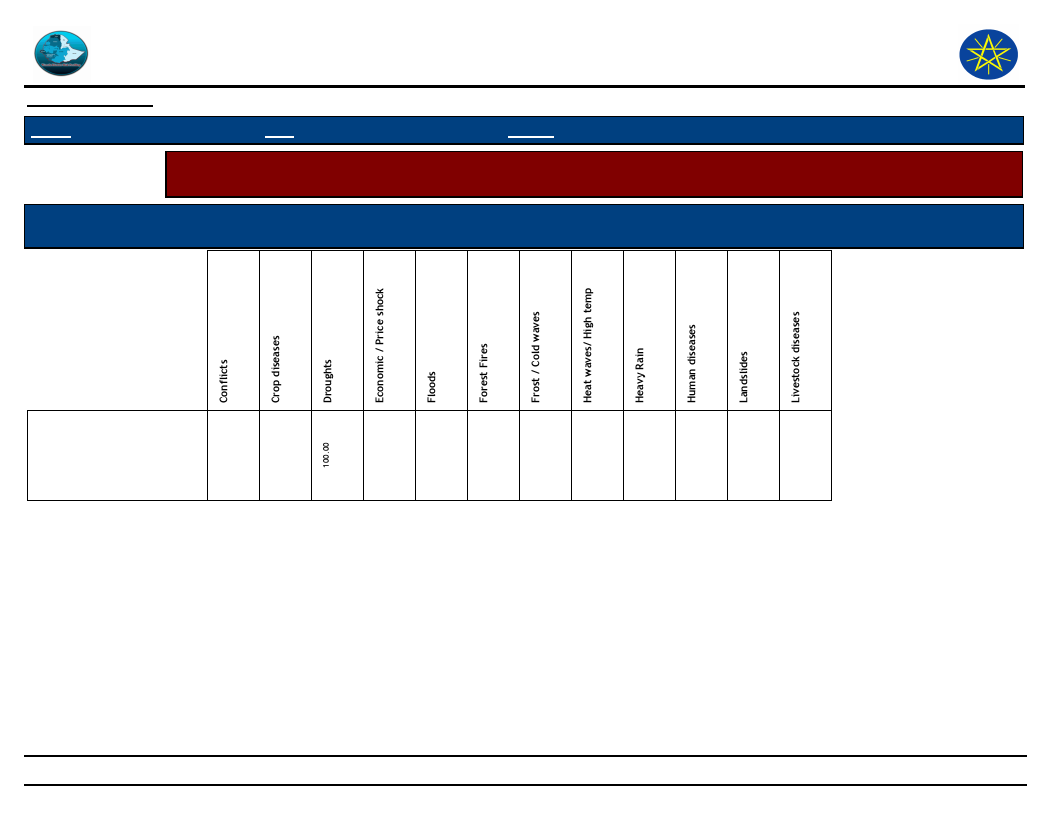
Wereda Disaster
Risk Profile
Data_Collected_Date
Region S.N.N.P
Zone
SOUTH OMO
Disaster Risk Management and Food
Security Sector (DRMFSS)
Wednesday, December 3, 2014
Wereda BENA TSEMAY
Selected Indicator
Capacity: Coping Strategies Adopted by Households - Main coping strategies adopted by households for respective
disasters
Coping Strtegies Adopted
Types of disaters for which HHs in the community adopt the listed
Coping Strtegies
Skip entire day without
eating
129
Page 7 of 7
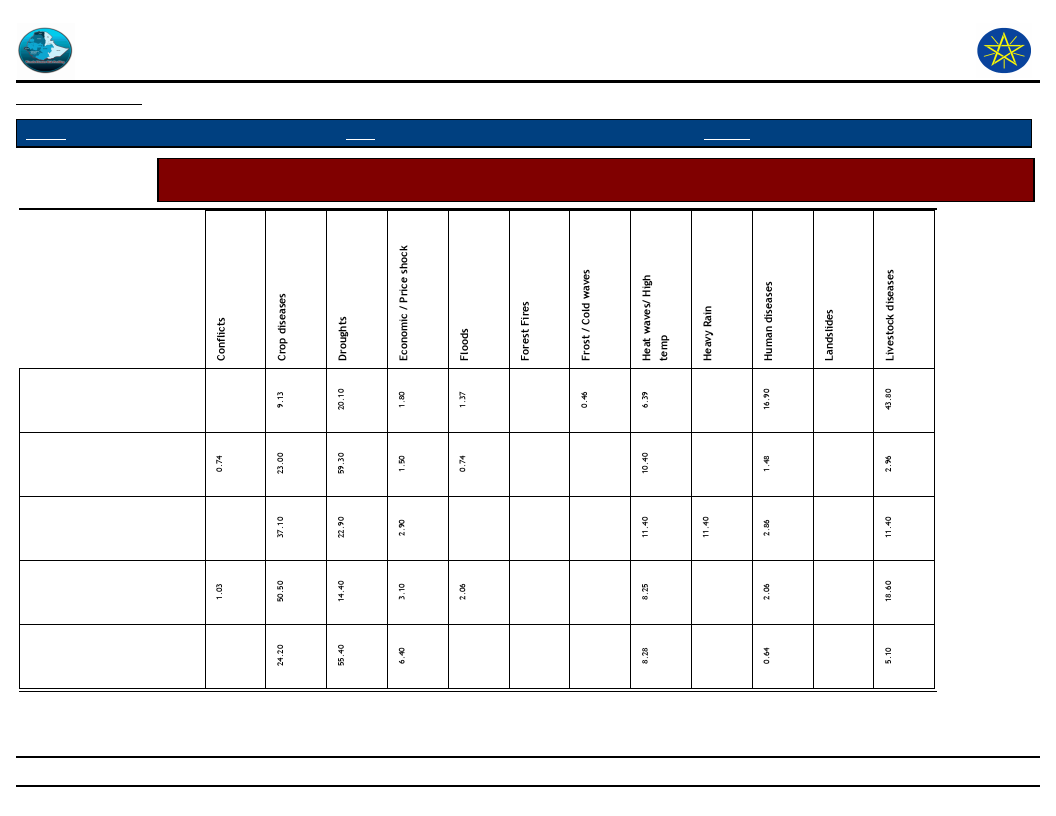
Wereda Disaster
Risk Profile
Data_Collected_Date
Disaster Risk Management and Food
Security Sector (DRMFSS)
Wednesday, December 3, 2014
Region S.N.N.P
Zone
SOUTH OMO
Wereda BENA TSEMAY
Selected Indicator
Capacity: Coping Strategies Adopted by Households - Secondary coping strategies adopted by households for
respective disasters
Borrowing of food or cash
(including purchasing food
on credit)
Collection of wild food
Consumption rather than
sale of crop surplus
Increased working hours
Limit portion size at meals
130
Page 1 of 3

Wereda Disaster
Risk Profile
Data_Collected_Date
Disaster Risk Management and Food
Security Sector (DRMFSS)
Wednesday, December 3, 2014
Region S.N.N.P
Zone
SOUTH OMO
Wereda BENA TSEMAY
Selected Indicator
Capacity: Coping Strategies Adopted by Households - Secondary coping strategies adopted by households for
respective disasters
Long-term / permanent
migration (including
distress migration)
Reduce number of meals
eaten in a day
Reduced expenditure on
non-essential items (beer,
cigarettes, etc)
Reduced expenditure on
productive inputs
(fertilizer, seeds, etc)
Rely on less preferred and
less expensive food
Restrict consumption by
adults in order for small
children
131
Page 2 of 3
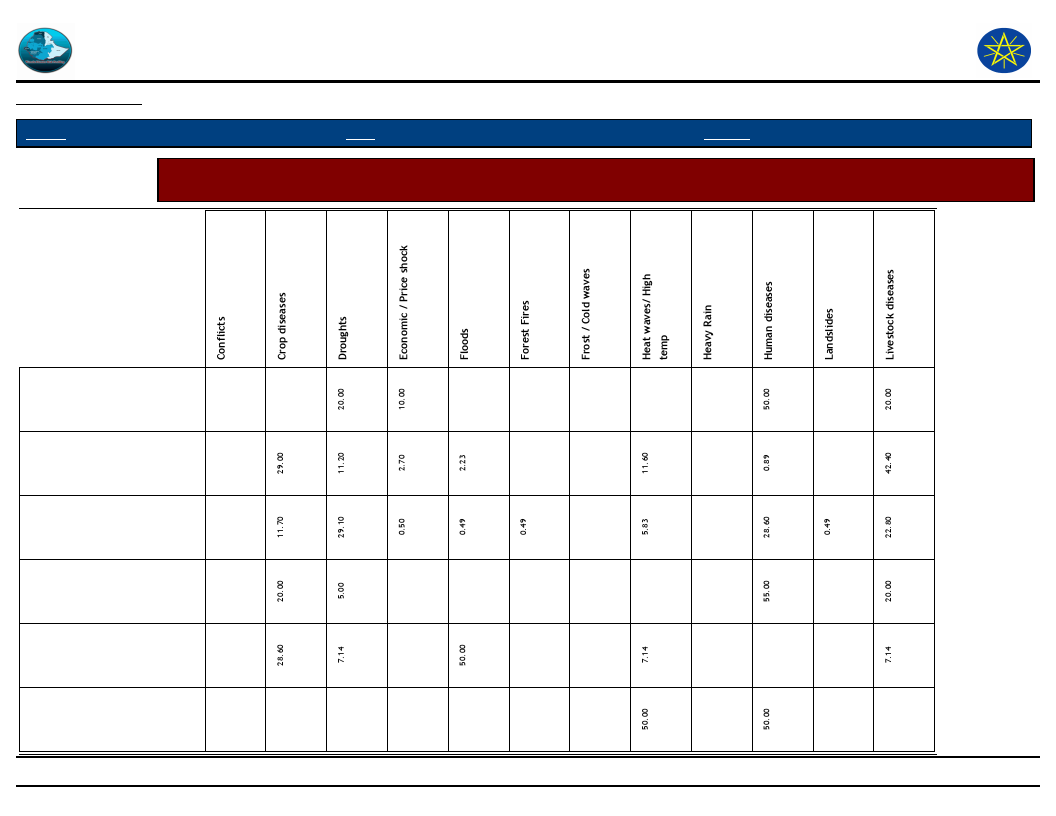
Wereda Disaster
Risk Profile
Data_Collected_Date
Disaster Risk Management and Food
Security Sector (DRMFSS)
Wednesday, December 3, 2014
Region S.N.N.P
Zone
SOUTH OMO
Wereda BENA TSEMAY
Selected Indicator
Capacity: Coping Strategies Adopted by Households - Secondary coping strategies adopted by households for
respective disasters
Sale of non-productive
assets (jewellery, clothing,
etc.)
Seek alternative or
additional jobs
Sell more livestock than
usual
Sending children of
household for work
Short-term / seasonal labor
migration
Skip entire day without
eating
132
Page 3 of 3
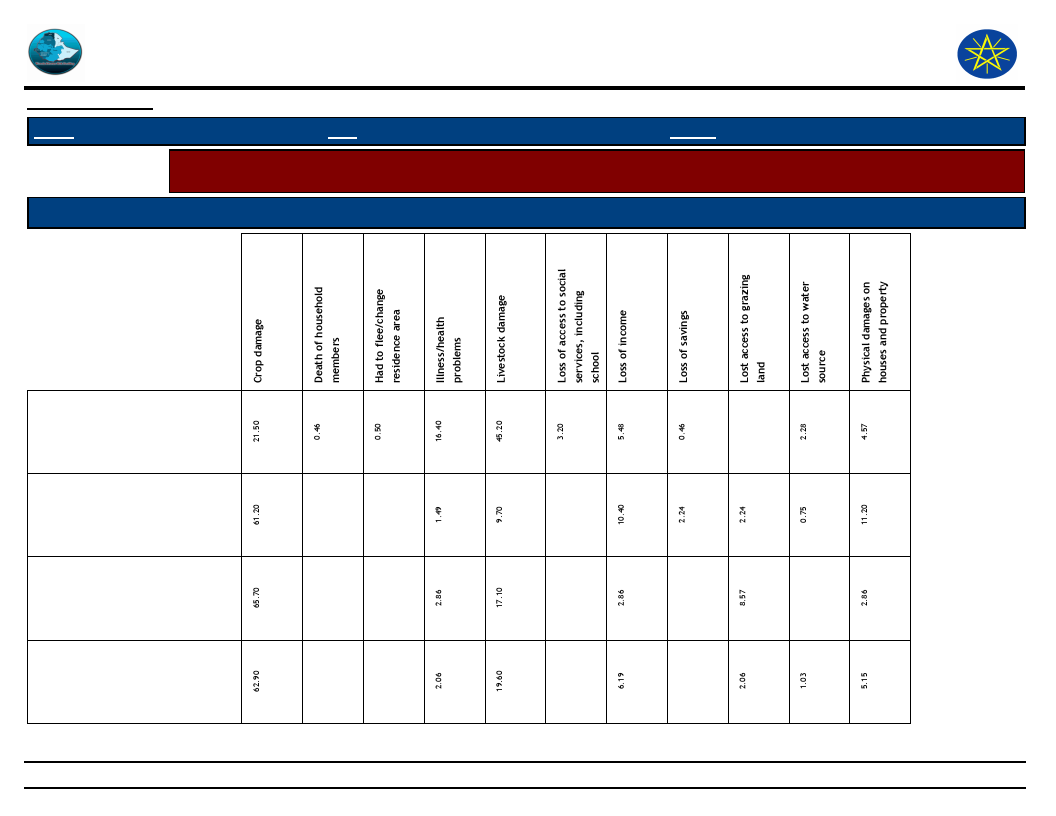
Wereda Disaster
Risk Profile
Disaster Risk Management and
Food Security Sector (DRMFSS)
Data_Collected_Date
Region S.N.N.P
Zone SOUTH OMO
Wereda BENA TSEMAY
Wednesday, December 3, 2014
Selected Indicator
Capacity: Coping Strategies Adopted by Households - Main coping strategies adopted by households to recover
from respective losses
Type of Coping Strategy Adopted
Type of Loss
Borrowing of food or cash
(including purchasing food on
credit)
Collection of wild food
Consumption rather than sale
of crop surplus
Increased working hours
133
Page 1 of 4

Wereda Disaster
Risk Profile
Disaster Risk Management and
Food Security Sector (DRMFSS)
Data_Collected_Date
Region S.N.N.P
Zone SOUTH OMO
Wereda BENA TSEMAY
Wednesday, December 3, 2014
Selected Indicator
Capacity: Coping Strategies Adopted by Households - Main coping strategies adopted by households to recover
from respective losses
Type of Coping Strategy Adopted
Type of Loss
Limit portion size at meals
Long-term / permanent
migration (including distress
migration of whole families)
Reduce number of meals eaten
in a day
Reduced expenditure on
non-essential items (beer,
cigarettes, clothes, meat, etc.)
134
Page 2 of 4
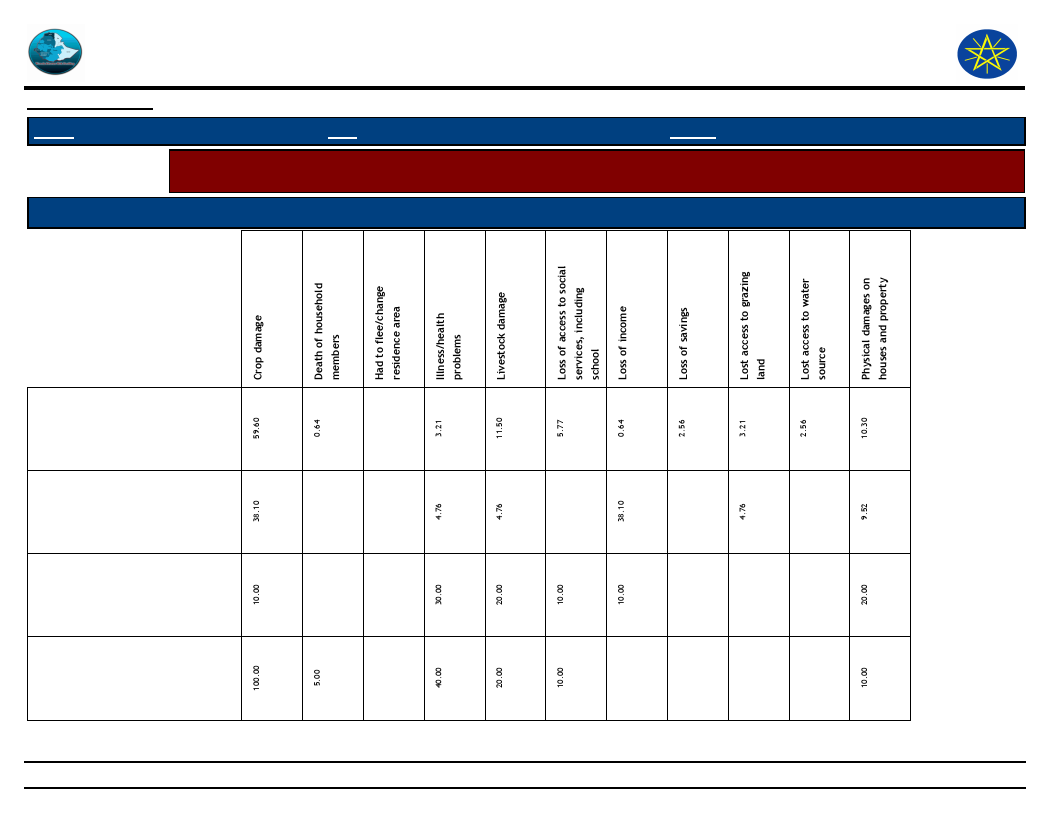
Wereda Disaster
Risk Profile
Disaster Risk Management and
Food Security Sector (DRMFSS)
Data_Collected_Date
Region S.N.N.P
Zone SOUTH OMO
Wereda BENA TSEMAY
Wednesday, December 3, 2014
Selected Indicator
Capacity: Coping Strategies Adopted by Households - Main coping strategies adopted by households to recover
from respective losses
Type of Coping Strategy Adopted
Type of Loss
Rely on less preferred and less
expensive food
Restrict consumption by adults
in order for small children to
eat
Sale of non-productive assets
(Jewelry, clothing, etc.)
Sale of productive assets (land,
farm implements, vehicle, etc.)
135
Page 3 of 4
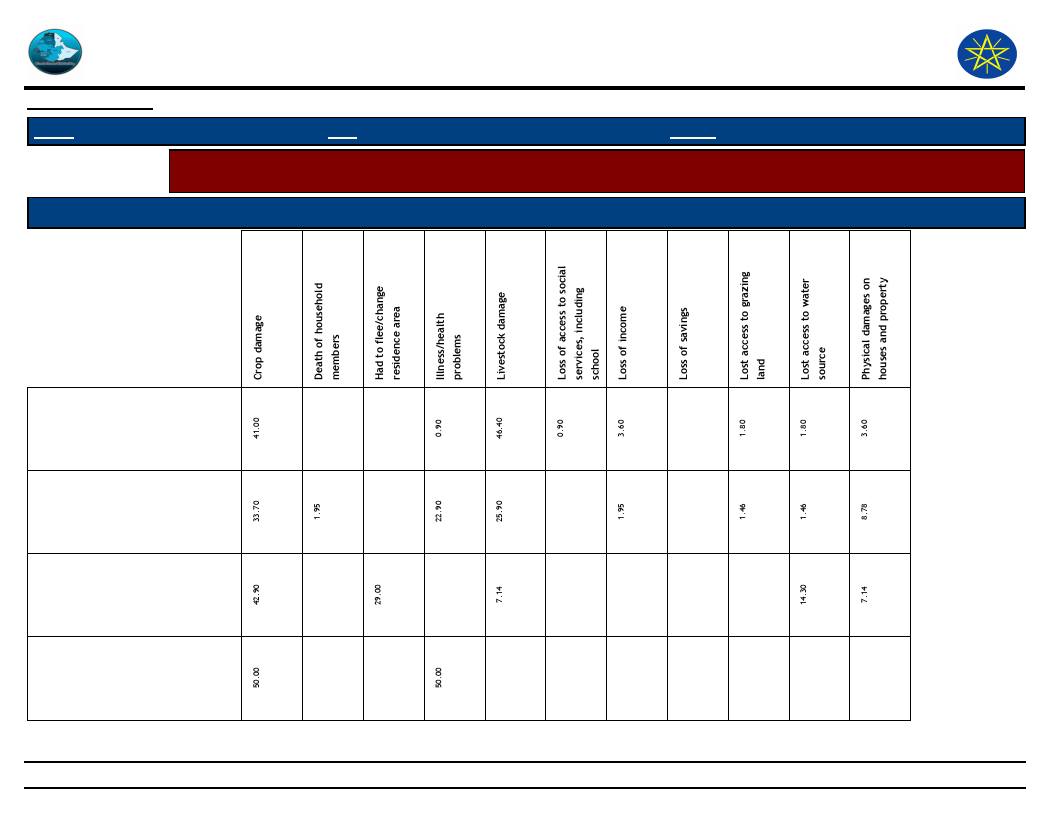
Wereda Disaster
Risk Profile
Disaster Risk Management and
Food Security Sector (DRMFSS)
Data_Collected_Date
Region S.N.N.P
Zone SOUTH OMO
Wereda BENA TSEMAY
Wednesday, December 3, 2014
Selected Indicator
Capacity: Coping Strategies Adopted by Households - Main coping strategies adopted by households to recover
from respective losses
Type of Coping Strategy Adopted
Type of Loss
Seek alternative or additional
jobs
Sell more livestock than usual
Short-term / seasonal labor
migration
Skip entire day without eating
136
Page 4 of 4
Data_Collected_Date
Wednesday, December 3, 2014
Region S.N.N.P
Selected Indicator
Zone SOUTH OMO
Wereda BENA TSEMAY
Capacity: Coping Strategies Adopted by Households - Percentage of households by
frequency of main coping strategies adopted
Type of Coping Strategy Adopted
Frequency of Adoption
Begging for money or for food
Borrowing of food or cash (including purchasing
food on credit)
Collection of wild food
Consumption rather than sale of crop surplus
Increased working hours
Limit portion size at meals
Long-term / permanent migration (including
distress migration)
Reduce number of meals eaten in a day
Reduced expenditure on health and education
Reduced expenditure on non-essential items
(beer, cigarettes, etc)
Reduced expenditure on productive inputs
(fertilizer, seeds, etc)
Rely on less preferred and less expensive food
50.00
50.00
0.28
0.83
86.20
12.70
12.70
36.60
50.70
1.27
59.50
39.20
18.90
9.43
71.70
4.62
36.90
15.40
43.10
2.13
78.70
19.10
38.80
1.49
59.70
100.00
4.17
66.70
29.20
100.00
10.70
20.70
68.60
137
Page 1 of 2
Data_Collected_Date
Wednesday, December 3, 2014
Region S.N.N.P
Selected Indicator
Zone SOUTH OMO
Wereda BENA TSEMAY
Capacity: Coping Strategies Adopted by Households - Percentage of households by
frequency of main coping strategies adopted
Type of Coping Strategy Adopted
Frequency of Adoption
Restrict consumption by adults in order for small
children
Sale of non-productive assets (jewellery, clothing,
etc.)
Sale of productive assets (land, farm implements,
vehicle, etc)
Seek alternative or additional jobs
Sell more livestock than usual
Sending children of household for work
Short-term / seasonal labor migration
Skip entire day without eating
33.30
16.70
50.00
8.33
75.00
16.70
100.00
0.49
16.30
17.70
65.50
0.16
1.11
76.50
22.30
4.17
8.33
87.50
16.70
66.70
16.70
50.00
50.00
138
Page 2 of 2
Wereda Disaster
Risk Profile
Data_Collected_Date
Disaster Risk Management and Food
Security Sector (DRMFSS)
Wednesday, December 3, 2014
Region S.N.N.P
Selected Indicator
Zone SOUTH OMO
Wereda BENA TSEMAY
Capacity: Alternative Livelihood Sources - Alternative livelihood sources suggested by the community
Kebele Name
Work_Option_1
Comment_1
Work_Option_2
Comment_2
Work_Option_3
Comment_3
CHALI
BEFO
OLU
SHABA
We have no
option
We have no
option
We have no
option
We have no
option
139
Page 1 of 1
WDRP Indicators
Community
Perceptions and Suggestions
140
Data_Collected_Date
Wednesday, December 3, 2014
Region S.N.N.P
Selected Indictor:
KebeleName
Zone SOUTH OMO
Wereda BENA TSEMAY
Agricultural Situation: Access to Extension - Perception of the community on
Access to Agricultural extension Services
Current_Level
Change_In_Last_Decade
Comments
CHALI
BEFO
OLU
SHABA
There is access to
agricultural extension
There is access to
agricultural extension
There is access to
agricultural extension
There is access to
agricultural extension
Improved
Improved
Improved
Improved
Farming activity increased
Farming activity increased
Farming activity increased
Farming activity increased
141
Page 1 of 1
Data_Collected_Date
Wednesday, December 3, 2014
Region S.N.N.P
Selected Indictor:
KebeleName
CHALI
BEFO
OLU
SHABA
Zone SOUTH OMO
Wereda BENA TSEMAY
Agricultural Situation: Access to Inputs - Perception of the community on access
to improved agricultural inputs
Current_Level
Change_In_Last_Decade
Comments
There is access
No access
No access
No access
Improved
No change
No change
No change
Increase in production
Crop production somewhat
improved
142
Page 1 of 1

Data_Collected_Date
Wednesday, December 3, 2014
Region S.N.N.P
Zone SOUTH OMO
Wereda BENA TSEMAY
Selected Indictor:
KebeleName
Agricultural Situation: Water for irrigation - Access to water for irrigation in the
community
Current_Level
Change_In_Last_Decade
Comments
CHALI
BEFO
OLU
SHABA
No access
No access
No access
No access
No change
No change
No change
No change
143
Page 1 of 1
Data_Collected_Date
Wednesday, December 3, 2014
Region S.N.N.P
Zone SOUTH OMO
Wereda BENA TSEMAY
Selected Indictor:
Agricultural Situation: Water Availability for Livestock - Water availability for
livestock in the community
KebeleName
Current_Level
Change_In_Last_Decade
Comments
CHALI
No access
No change
BEFO
No access
No change
OLU
No access
No change
SHABA
No access
No change
144
Page 1 of 1
Data_Collected_Date
Wednesday, December 3, 2014
Region S.N.N.P
Selected Indictor:
Kebele Name
Zone SOUTH OMO
Wereda BENA TSEMAY
Agricultural Situation: Soil Fertility - Perception of the community on soil fertility
and its change over time
Current_Level
Change_In_Last_Decade
Comments
CHALI
Good
SHABA
Good
145
Page 1 of 1
Data_Collected_Date
Wednesday, December 3, 2014
Region S.N.N.P
Selected Indictor:
Zone SOUTH OMO
Wereda BENA TSEMAY
Economic Vulnerability: Change in Agricultural Situation - Households perception
on changes of crop type, size of cultivated area and crop yields
Proportion of households reporting change in crops grown
Adequate fertilizer
100.00
%
1st
2nd
3rd
0.55
0.80
1.33
Adequate irrigation available
2.73
0.80
0.00
Adequate rainfall
62.80
11.20
4.00
Insufficient fertilizer
0.55
4.00
0.00
Insufficient irrigation available
0.55
0.00
2.67
Less rainfall
11.50
0.00
0.00
More pest resistant crop
0.55
6.40
17.30
More yielding crop
18.60
56.00
16.00
Proportion of households reporting change in size of area cultivated
100.00 %
Addition of area
1st
2nd
3rd
19.40
46.80
30.80
Adequate irrigation available
2.33
0.49
1.54
Adequate rainfall
55.00
8.37
7.69
insafficient irrigation available
0.78
0.00
0.00
Insufficient rainfall
5.81
1.48
0.00
Landslides
0.78
2.96
1.54
more yielding crop
6.98
34.00
49.20
Salinity problem
0.78
0.00
0.00
146
Page 1 of 2

Data_Collected_Date
Wednesday, December 3, 2014
Region S.N.N.P
Selected Indictor:
Zone SOUTH OMO
Wereda BENA TSEMAY
Economic Vulnerability: Change in Agricultural Situation - Households perception
on changes of crop type, size of cultivated area and crop yields
Proportion of households reporting change in crop yield
99.80
%
1st
2nd
3rd
Adequate fertilizer
0.00
4.53
4.88
Adequate irrigation available
2.96
0.00
0.00
Adequate rainfall
76.10
11.10
12.20
Better yielding crop
10.00
75.70
29.30
Improved variety of seeds
0.23
4.94
4.94
Insufficient fertilizer
0.46
3.29
2.44
Insufficient irrigation available
0.46
0.00
2.44
Insufficient rainfall
9.79
0.41
0.00
147
Page 2 of 2
Data_Collected_Date
Wednesday, December 3, 2014
Region S.N.N.P
Selected Indicator
Zone SOUTH OMO
Wereda BENA TSEMAY
Environmental Situation: General Land Quality - Perceptions of the community
on changes in the general quality of land over a decade
KebeleName
Current_Situation
Change_Last_Decade
Comment
CHALI
Partially good
BEFO
It has good quality
OLU
Good quality
No change
SHABA
The soil has good quality
No change
148
Page 1 of 1
Wereda Disaster
Risk Profile
Data_Collected_Date
Disaster Risk Management and Food
Security Sector (DRMFSS)
Wednesday, December 3, 2014
Region S.N.N.P
Zone
SOUTH OMO
Wereda BENA TSEMAY
Selected Indicator
Kebele Name
Interventions: Community Perception on Mediums to Influence DRM Actors - Community perception on the
effectiveness of institutional channels to use to influence DRM actors
Institution_1
Process_Description
Institution_2 Process_Description
Institution_3
Process_Description
CHALI
OLU
Sending letter
Formal meeting
Directly writing to
the concerned body
We have meeting at
wereda level to
discuss our problems
with administration
Sending letter
Directly writing to the
concerned body
149
Page 1 of 1
Data_Collected_Date
Region S.N.N.P
Zone
SOUTH OMO
Wednesday, December 3, 2014
Wereda BENA TSEMAY
Selected Indicator
Interventions: Community Perception on their Knowledge used in DRM Process -
Perception of the community on how their knowledge influences the priorities
and measures of DRM actors
KebeleName
Community_Suggestions
CHALI
BEFO
SHABA
We always tell our problem to government or NGOs but no one gives answer to our
problem
We do not feel that our knowledge and suggestion would affect government
decision
We always tell our problem to government or NGOs but no one gives answer to our
problem
150
Page 1 of 1
Wereda Disaster
Risk Profile
Data_Collected_Date
Region S.N.N.P
Zone SOUTH OMO
Disaster Risk Management
and Food Security Sector (DRMFSS)
Wednesday, December 3, 2014
Wereda BENA TSEMAY
Selected Indicator
Interventions: Suggestions to improve preparedness - Interventions suggested by the community to development
actors to improve preparedness in the area
KebeleName
Measure 1
Comment 1
Measure 2
Comment 2
Measure 3
Comment 3
CHALI
BEFO
OLU
Supply drinking water to
the community
There is a problem of pure
drinking water
Construction of road and
houses for experts
There is problem of road
and houses
Construction of irrigation
channel from Woito river
Water problem for
cultivation of crops
Conservation of
natural forest
Construction of
animal health post
and supply adequate
drugs and vaccine
We have shortage of
drinking water;
therefore we need
treated water which
comes from Woito
river
The area highly
exposed to
deforestation
Animal diseases
are common in
the area
There are no hand
pumps in the area
Human and
animal
disease
prevention
area
Both human
and animal
disease highly
affects the
life of
community
Developmen
t of water
source like
hand pumps
,ponds and
roof
catchment
Absence of
water source
Constructio
n of animal
health
centre and
health post
to prevent
animal and
human
disease
These are the
two major
problems
151
Page 1 of 2
Wereda Disaster
Risk Profile
Data_Collected_Date
Region S.N.N.P
Zone SOUTH OMO
Disaster Risk Management
and Food Security Sector (DRMFSS)
Wednesday, December 3, 2014
Wereda BENA TSEMAY
Selected Indicator
Interventions: Suggestions to improve preparedness - Interventions suggested by the community to development
actors to improve preparedness in the area
KebeleName
SHABA
Measure 1
Animal and human
prevention area
Comment 1
These are the common
problem of that area
Measure 2
Conservation of
natural resource in
the mountains area
Comment 2
There is high rate
of deforestation in
the area
Measure 3
Comment 3
Developmen
t of water
source like
hand pumps
,ponds and
water
catchment
Shortage of
water in the
area
152
Page 2 of 2
Wereda Disaster
Risk Profile
Data_Collected_Date
Disaster Risk Management and
Food Security Sector (DRMFSS)
Wednesday, December 3, 2014
Region S.N.N.P
Zone SOUTH OMO
Wereda BENA TSEMAY
Selected Indicator
Interventions: Suggestions to DRM Actors in the Area - Community suggested measures to DRM actors in the area
for effective DRM actions
Kebele Name Measure 1
Comment 1
Measure 2
Comment 2
Measure 3
CHALI
BEFO
OLU
SHABA
Awareness creation
on disaster
prevention
Capacity building
Establish early
warning system at
kebele level
Most of the
community are
illiterate and
lacks knowledge
about disaster
There is lack of
awareness
Absence of early
warning system
Establishing strong
early warning system
at kebele level
There is no early
warning system at
kebele
Capacity building to
prevent and deal with
disaster
Capacity building
Poor awareness
of the community
and expert
Establishing strong
early warning system
at kebele level
Absence of early
warning system
Supply safe
drinking water
and drugs for
community
Absence of early
warning system
There is lack of
awareness in the
community and
lack of knowledge
in the experts
There is no early
warning at kebele
level
Human and
animal disease
prevention and
control area
Development
work like
construction of
irrigation canal
and hand pump to
solve water
problem
Development of
water source
Comment 3
There is a
shortage of safe
drinking water
and drugs for
health post
It is the main
problem in this
community
The area
continuously
affected by
drought and
shortage of
water
Shortage of
water both for
human and
animal
153
Page 1 of 1
Wereda Disaster
Risk Profile
Data_Collected_Date
Region S.N.N.P
Zone SOUTH OMO
Disaster Risk Management and Food
Security Sector (DRMFSS)
Wednesday, December 3, 2014
Wereda BENA TSEMAY
Selected Indicator
Economic Vulnerability: Community Suggestions to Improve Economic Situation - Community suggested measures
to improve the economic situation of the area
KebeleName
Measure 1
Comment 1
Measure 2
Comment 2
Measure 3 Comment 3
CHALI
BEFO
OLU
SHABA
Supply of improved cash
crops
Drought resistant and
hybrid animal species
Development of water
source
The area has a potential
There is absence of
drinking water
Animal fatting
Strong cooperative
union
Establishing strong
cooperative union
Drought resistant
crop species like
sorghum
Introducing hybrid
animal species
Market problem
Animal fatting Good income
source
Animal fatting
Scarcity of rain fall
Area enclose
for grazing
land
Animal and
human
disease
prevention
and control
area
Pasture
shortage
154
Page 1 of 1
Wereda Disaster
Risk Profile
Data_Collected_Date
Disaster Risk Management and
Food Security Sector (DRMFSS)
Wednesday, December 3, 2014
Region S.N.N.P
Zone SOUTH OMO
Selected Indicator
Community Awareness of Disaster Risk Management System and Actors
Kebele Name
Institution 1 Responsibility
Activity Institution 2 Responsibility
Wereda BENA TSEMAY
Activity
Institution 3 Responsibility Activity
CHALI
BEFO
Health
extension
worker
Keeping the
health of
community
Health
extension
worker
Keeping the
health of
community
Teaching
,preventio
n and first
aid
treatment
Agricultural
expert
Improve the
livelihood of the
community
Teaching
,preventio
n and first
aid
treatment
Agricultural
expert
Improve the
livelihood of the
community
Teach,
demonstrat
e, prepare
weekly and
monthly
report and
distribute
composite
seed
Teach,
demonstrat
e, prepare
weekly and
monthly
report and
distribute
composite
seed
155
Page 1 of 2

Wereda Disaster
Risk Profile
Data_Collected_Date
Disaster Risk Management and
Food Security Sector (DRMFSS)
Wednesday, December 3, 2014
Region S.N.N.P
Zone SOUTH OMO
Selected Indicator
Community Awareness of Disaster Risk Management System and Actors
Kebele Name
OLU
Institution 1 Responsibility
Health
extension
worker
Keeping the
health of
community
Activity Institution 2
Teaching
,preventio
n and first
aid
treatment
Agricultural
expert
Responsibility
Improve the
livelihood of the
community
SHABA
Health
extension
worker
Keeping the
health of
community
Teaching
,preventio
n and first
aid
treatment
Agricultural
expert
Improve the
livelihood of the
community
Wereda BENA TSEMAY
Activity
Institution 3
Teach,
demonstrat
e, prepare
weekly and
monthly
report and
distribute
composite
seed
Teach,
demonstrat
e, prepare
weekly and
monthly
report and
distribute
composite
seed
Responsibility
Activity
156
Page 2 of 2
Wereda Disaster
Risk Profile
Data_Collected_Date
Disaster Risk Management and Food
Security Sector (DRMFSS)
Wednesday, December 3, 2014
Region S.N.N.P
Selected Indicator
Zone SOUTH OMO
Wereda BENA TSEMAY
Community Perception of DRM System and Actors - Perception of the community on the effectiveness of DRM
system in helping them to prevent, cope and recover from disasters
KebeleName
CHALI
BEFO
OLU
Prevention
They are partially effective
Coping
They are partially effective
They are partially effective
They are partially effective
They are partially effective
They are partially effective
Recovery
They are partially
effective
They are partially
effective
SHABA
They are partially effective
They are partially effective
Overall_Effectiveness
Shortage of skilled man
power, shortage of
logistics, absence of strong
early warning system
Lack of logistics, lack of
skilled man power, absence
of early warning system
Problem of skilled man
power, problem of
logistics, shortage of
resource (budget), absence
of training
Shortage of skilled man
power, lack of logistics,
absence of strong early
warning system
157
Page 1 of 1
Data_Collected_Date
Wednesday, December 3, 2014
Region S.N.N.P
Zone SOUTH OMO
Wereda BENA TSEMAY
Selected Indicator
Major Public Interventions Desired - Percentage of households by type of
intervention desired
Major public interventions desired by the community
Degree of Importance for the community
Better job
1st
2nd
3rd
8.81
6.42
5.89
Cash transfers/social assistance
4.65
7.70
4.71
Cash-for-work activities (not employment)
17.30
12.00
13.10
Food aid
26.80
8.19
6.06
Food-for-work activities
5.13
4.65
10.60
Medical assistance / access to health facilities
3.37
12.20
23.10
Micro-credit programmes
16.20
21.70
9.76
Other
0.16
0.48
0.34
Rental subsidies
0.32
0.00
0.17
School feeding for children
6.73
3.69
2.36
Subsidized food
3.53
1.77
0.34
Subsidized health care
4.97
12.00
18.90
Supplementary feeding for women and young children
2.08
8.99
4.55
158
Page 1 of 1
WDRP Indicators
Other Community Characteristics
159

Wereda Disaster
Risk Profile
Data_Collected_Date
Disaster Risk Management and Food
Security Sector (DRMFSS)
Wednesday, December 3, 2014
Region S.N.N.P
Selected Indicator
Kebele Name
Zone SOUTH OMO
Capacity: Community Based Organizations in the Wereda
Name_Of_Organization
Est._Year
Formal/Informal
Wereda BENA TSEMAY
Type of Members
Activity
BEFO
OLU
SHABA
Women association
Youth association
Women association
Youth association
Youth association
Women association
2000
1999
2000
2000
2000
1999
Formal
Formal
Informal
Informal
Informal
Informal
women
Both male and
female
women
Both male and
female
Both female and
male
Women
Selling local alcohol called
tella
Trading animals and coffee
Selling local alcohol called
tella
Development work in the
kebele
Petty trade like selling tella
160
Page 1 of 1
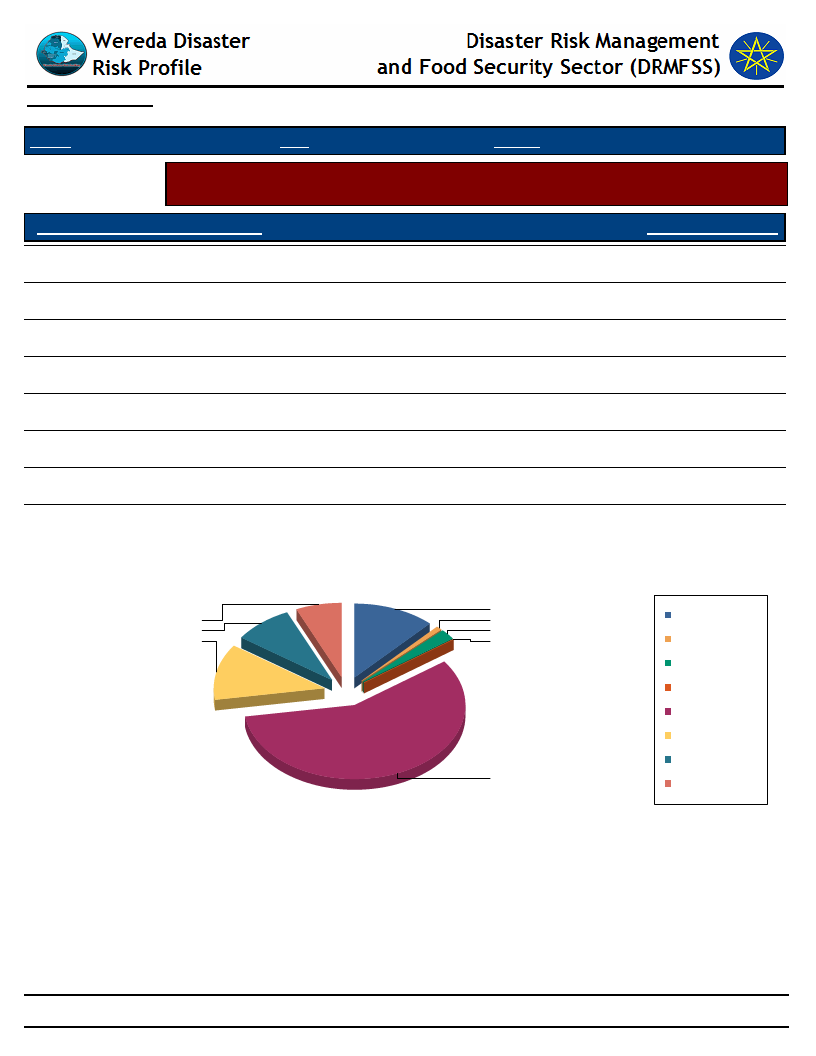
Data_Collected_Date
Wednesday, December 3, 2014
Region S.N.N.P
Zone SOUTH OMO
Wereda BENA TSEMAY
Selected Indicator
Supporting Agencies against Disasters - Percentage of households by supporting
institutions to handle or recover from disaster damages
Supporting Agencies Against Disasters
Response_Percentage
National or local authorities
12.20
International NGOs (e.g. UN organizations, ICRC, etc.)
57.40
Family members in the same community
12.00
Friends and neighbors in the same community
2.20
Family members outside the community
0.68
Friends and neighbors outside the community
0.17
Support via contacts working for the authorities
6.60
Support via contacts working for NGOs
8.80
Supporting Agencies Against Disasters
6.6
8.8
12.2
12
0.7
2.2
0.2
57.4
Family members in the
same community
Family members outside
the community
Friends and neighbors in
the same community
Friends and neighbors
outside the community
International NGOs (e.g.
UN organizations, ICRC,
etc.)
National or local
authorities
Support via contacts
working for NGOs
Support via contacts
working for the
authorities
161
Page 1 of 1
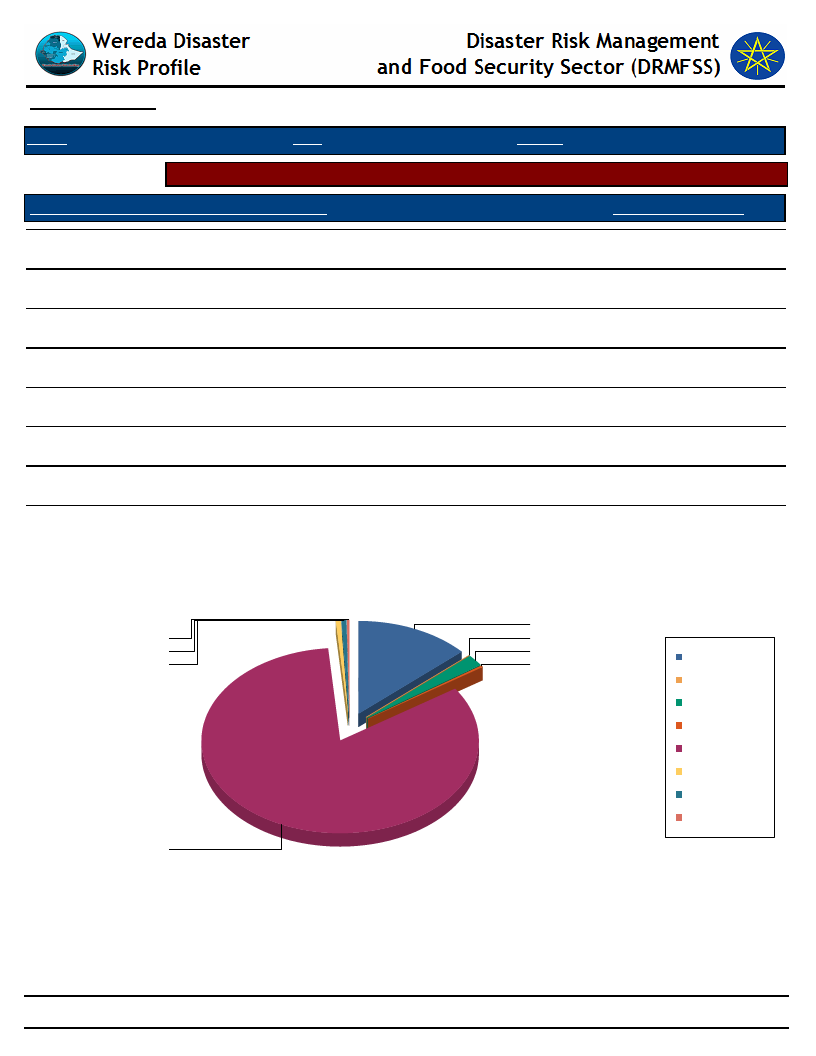
Data_Collected_Date
Wednesday, December 3, 2014
Region S.N.N.P
Zone SOUTH OMO
Wereda BENA TSEMAY
Selected Indicator
Types of support received by households during disasters
Type of Support Provided By Supporting Agencies
Response_Percentage
Emergency aid (food, water, shelter, etc.)
82.90
Capital for re-construction of house and property
1.84
New house
0.74
Access to loan for re-construction
0.18
Access to capital or loan for adaptation/protection measures
13.20
Other
0.18
DK
0.18
NA
0.55
Type of Support Provided By Supporting Agencies
13
0
0
1
2
Access to capital or loan
for adaptation/protection
1
0
measures
Access to loan for
re-construction
Capital for
re-construction of house
and property
DK
Emergency aid (food,
water, shelter, etc.)
NA
New house
Other
83
162
Page 1 of 1
Wereda Disaster
Risk Profile
Data_Collected_Date
Disaster Risk Management and
Food Security Sector (DRMFSS)
Wednesday, December 3, 2014
Region S.N.N.P
Zone SOUTH OMO
Wereda BENA TSEMAY
Selected Indicator
Government Actors in the Field of Disaster Risk Management - Government actors and their activities in the field
of Disaster Risk Managements
Government Institution
Activity
Description
Activity
Description Activity
Description Activity Description
Agriculture Office
Water Resource
Development Office
Health Office
Make assessment
Make assessment
Health education
and community
mobilizing
To minimize the
effect of the
disaster
Prepare and
compile report
Identifying the
problem related
with water and
prioritizing the
most
problematic
kebeles
Construction of
water source
like hand pump
Creating
awareness about
the negative
effects of the
disasters and
ways of disease
transmission
Vaccination
163
Compile early
warning
reports from
each kebele
and report to
the Wereda
Based on the
result of the
assessment,
interventions
are taken in
collaboration
with others in
the most
problematic
kebele
This is given
mainly to
develop the
immunity of
individuals
against
different
disease
Sending
compiled
report and
the result of
the
assessment to
concerned
bodies
Maintaining
broken hand
pumps and
plumps
Treatment
This helps
to take
preventive
measures
before the
disaster
occurs
By
monitoring
and when
the
community
reports
damage
Giving
treatment
(drugs and
needles)
Page 1 of 1
Data_Collected_Date
Region S.N.N.P
Zone SOUTH OMO
Wednesday, December 3, 2014
Wereda BENA TSEMAY
Selected Indicator
Non-Government Actors in the Field of Disaster Risk Management -
Non-government actors and their activities in the field of Disaster Risk
Management
Non Governmental Actors
in the Wereda
Activities
FAO
Compensates seeds and providing budget and logistics for monitoring
local NGOS
Transportation, logistic and financial support
164
Page 1 of 1

Wereda Disaster
Risk Profile
Data_Collected_Date
Region S.N.N.P
Zone
SOUTH OMO
Disaster Risk Management
and Food Security Sector (DRMFSS)
Wednesday, December 3, 2014
Wereda BENA TSEMAY
Selected Indicator
Wereda Strengths, weaknesses, opportunites and treats (SWOT) Analysis
Kebele Name
Strength
Weakness
Opportunity
Threat
CHALI
BEFO
OLU
SHABA
Produce crops
They rear livestock
They rear animal/livestock
They cultivate crops and
tobacco
They have high social
interaction
They cultivate crops
They rear animal
They cultivate crops
They have high social
interaction
They rear livestock
They destroy natural forest
Poor saving habit
Time wastage on
unproductive activity
The absence of saving
practice
Poor acceptance of new
technology
Poor working habit
Poor saving habit
Poor saving habit
Misuse of natural resource
The presence of road
The presence of health
extension worker
The presence of health
extension worker
The presence of agricultural
expert
Good government policy
regarding pastoralist
Presence of health extension
worker
Presence of agricultural expert
The presence of health
extension worker
Deforestation
Crop pests
Absence of good road
Outbreak of unknown
disease
Outbreak of unknown
disease
Deforestation
Deforestation
Animal disease
165
Page 1 of 1
SNNPR Livelihood Zone Reports
Bennatsamay Woreda
South Omo Administrative Zone
Southern Agro-Pastoral Livelihood Zone
This zone covers a flat lowland terrain which was traditionally a grazing ground - settled
agriculture is a recent phenomenon. The crops grown are sorghum, maize, and some teff for
sale. But there is still a main dependence upon livestock: own crops amount to around 40% of
household food consumption, but crops sales are very low, and livestock and livestock products
bring in by far the bulk of cash. This is a low rainfall area at the best of times, and erratic rains
and periodic drought in recent years have affected both crop production and the condition of
livestock. In the future, without an extension of irrigation greater dependence on agriculture is
likely to mean greater food insecurity.
N
W
E
S
South Omo Pastoral Livelihood Zone
This is a semi-arid rangeland zone in the basin of the Omo
River, and its low and erratic rainfall has rendered it food
insecure. The Hamar are the largest of five pastoral groups
who inhabit the area. Wealth is particularly gauged by cattle
ownership: the better-off households have up to 70 cattle and
up to about 200 smallstock, while the poor have not more than
5 cattle and 25 smallstock. Although the economy is based on
livestock, there is some cultivation of sorghum and maize on
the valley bottom, using both rainfall and irrigation. Despite
great disparities in wealth, the livelihood patterns of all
households are very similar. Extreme distance from main
regional markets renders selling prices low and imported grain
prices high.
Note: This map shows both
Bennatsamay and Hamer
woredas, which used to form
one woreda,Hamer Bena.
Contents
Map & livelihood zone description
Population by livelihood zone
Livelihood zone profiles
Key parameters for monitoring
Non-food sector summaries
166
SNNPR Livelihood Profile
Population by Livelihood Zone and Kebele (2005)
Woreda:
Zone:
Bennatsamay
South Omo
Woreda population
36,792
Livelihood Zone:
South Omo Pastoral LZ
LZ Population:
Population by Kebele:
Alo
Ansunda
Aufie
Aymale
Bafo
Bura
Dankola Lage
Duma
Enchete
Erurie
Gesema
Gunae
Livelihood Zone:
Livelihood Zone:
Southern Agro-Pastoral Livelihood
Zone
12,363 LZ Population:
24,429 LZ Population:
Population by Kebele:
Population by Kebele:
1,285 Alduba
3,099
1,632 Arego
2,462
779 Boree
2,640
988 Chily
2,082
1,338 Desshishi
741
740 Goldeya
3,509
682 Kako
3,496
1,289 Mekecha
1,376
688 Selie
766
887 Shaba
2,289
1,221 Shela
1,970
834
Note: The 2005 woreda population is that estimated by the Central Statistical Authority. The list of
kebeles in the woreda was taken from the 1994 census and each kebele's 2005 population
calculated by multiplying the 1994 census figure by the increase in total woreda population since
1994. Information from the 1994 census was used in preference to other sources of information
since this represents the main offical source of population data for the woreda. Difficulties were
encountered due to changes in woreda and kebele boundaries since 1994. A number of woredas
have been split since 1994. For as many of these as possible, kebeles existing in 1994 were
divided between the newly formed woredas, based upon information obtained at regional and/or
woreda level. Where kebeles have been renamed or split since 1994, woreda officials were
asked to assign the old 1994 kebele to one or other livelihood zone in the woreda. It was
sometimes not possible to locate a kebele (e.g. because woreda officials did not recognize the
name or did not include the kebele in their list). In these cases a 'not assigned' category has been
included in the population analysis.
167
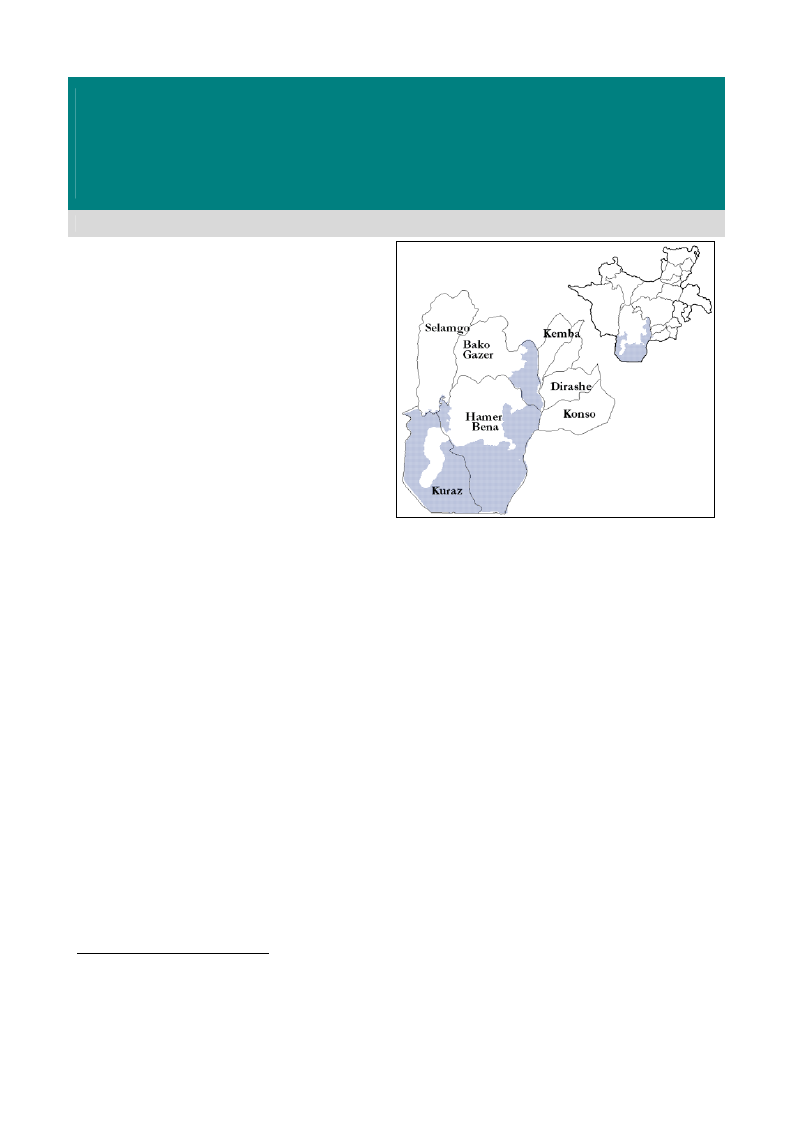
SNNPR Livelihood Profile
South Omo Pastoral Livelihood Zone
August 20051
Zone Description
The South Omo Pastoral Livelihood Zone is a remote,
livestock-dependent area, inhabited by five tribes: the
Hamer, Mali, Benna, Tsamay, and Erbore. The zone is
found in the basin of the Rift Valley, bordered to the east
and west by the Kuttume Mountains. It stretches
through parts of four neighboring woredas of South Omo
Administrative Zone: Bakogazar, Bannatsamay, Hamer
and Kuraz. The zone is crossed by the Waito River and
numerous dry seasonal rivers that originate in the
Kuttume Mountains and drain down to the valley basin
in the wet season.
This livelihood zone is distinguished by its bereha
(semi-arid rangeland) climate, with low and erratic
annual rainfall, low altitudes and warm temperatures.
Temperatures range from 16 C0 in the coolest months of
the year (April – early June) to 30 Co in the hottest
months (January – late March). The soils are
predominantly sandy in the valley basin. The soil texture grows increasingly stony towards the mountains, gradually
gaining slope and leaving pastoral farming in the valley basin. The vegetation is a complex mix of acacia trees, bushes
and shrubs that are common in lowland areas of Ethiopia (including Somali and Afar Regions).
The mountains surrounding this livelihood zone have dangerous slopes and this renders them of little use for grazing
purposes, particularly for large ruminants, and also limits farming to the valley plains. The rainfall shed from the
mountains provides seasonal gravity irrigation to crops in the valley basin. However, although currently small, an
increasing number of gullies can threaten future production if left uncurbed. As the number and the depth of these
gullies grow, they tend to drain out water that previously would have been spread widely, resulting in moisture stress
for crops and pasture.
The livelihood zone is sparsely populated. Most villages are located at the foot of the mountains in relatively elevated
positions in order to minimize exposure to malaria, the main killer disease in the livelihood zone.
The main rainfall and production season stretches from March to June. Although the rains are normally characterized by
poor intensity and erratic distribution, they enable pastoral households to grow small quantities of sorghum and maize.2
The showers that occur in September – November are important only for the regeneration of browse for goats (not for
crop production and grazing).
The main livestock species reared in this livelihood zone are goats, cattle and sheep, in that order of importance.
Donkeys are used as pack animals, providing transportation in rural areas. A traditional and extensive livestock rearing
system is practiced in the livelihood zone.
The main food sources for households in this livelihood zone are market purchase, livestock products (milk, meat and
blood) and own crops. Various varieties of wild foods are also consumed, both in normal and bad years, across all
months of the year. Livestock and livestock product sales generate the bulk of cash income, supplemented by honey
sales. Cash crop production and casual work are relatively unknown cash income sources in this livelihood zone.
Migration patterns are different in normal years and bad years. In normal years, livestock movements start in early July
and livestock generally stay near their areas of origin. In bad years, however, they migrate to different grazing areas
1Fieldwork for the current profile was undertaken in August 2005. The information presented refers to April 2003-March 2004 (EC
Miazia 1995 to Megabit 1996), a below average year by local standards (i.e. a year of below average production and rural food
security, when judged in the context of recent years). Provided there are no fundamental and rapid shifts in the economy, the
information in this profile is expected to remain valid for approximately five years (i.e. until 2010).
2 A small number of Hamer woreda pastoralists grow crops twice a year: once during the rainfed season that is common throughout
the livelihood zone and again along the banks of the Waito River later in the year using flood recession cultivation.
168

2
both inside and outside the zone livelihood zone, including towards the Waito River, Mago National Park and areas
near Borana. During such years, migration often starts before the end of the usual rainy season months.
The causes of acute food insecurity in this livelihood zone include drought and market shocks. The latter tend to occur
when there is crop failure in the neighboring agricultural and agro-pastoral livelihood zones, which results in increased
cereal prices for pastoralists. A number of human diseases (including malaria, respiratory infections and water-borne
diseases) and livestock diseases (including trypanosomiasis, pasteurolosis, blackleg and anthrax) also periodically cause
problems in this livelihood zone, reducing labor availability at household level and livestock production.
Markets
Market access is generally poor in this livelihood zone, characterized by poor and thinly distributed roads, a lack of
transportation and market information, and long distances to major markets. As a result, the prices of the goods that
households sell tend to be low and the prices of the goods that they purchase tend to be high.
The main markets in the livelihood zone are located at Dimeka, Key-Afer and Beraile. While the first two are woreda
towns, the third is at kebele level. There are also important markets outside the livelihood zone, particularly in Jinka
and Kakko. These weekly markets act as outlets for livestock sales and inlets for the purchase of food and essential
non-food items for pastoralists. Kebele-level markets, in contrast, serve more of a social function than an economic
one, acting as a place for people to gather (usually with drinks they have brought themselves), socialise and share
information. The purchase and exchange of cereals, livestock and livestock products at these small markets is limited.
There are three main trade routes for livestock. The first trade route for both cattle and goats originates in Key-Afer and
travels through Konso and Arba Minch, sometimes reaching Nazareth and Addis. The second route was developed
more recently and involves exporting cattle from Key-Afer through Konso to Moyale. The final trade route starts at Key
Afer, passes through Jinka, and ends in Goffa.
Butter and honey are important income sources for pastoralists. These are marketed through Key-Afer to Jinka. Poor
processing and handling during production result in quality problems and extremely low prices.
Imported items, such as sorghum, maize and essential non-food commodities, are supplied from Jinka market through
Key-Afer. The cereals originate from the South Omo Farming Livelihood Zone (in Gazar and Gelila woredas) and
from Arba Minch, particularly in bad years. Coffee husks (shuforo) are another major expense for all households and
they are supplied from Hagare Mariam in Oromiya Region.
A barter exchange system (livestock for cereals) is widely practiced in the livelihood zone, increasing in application
during bad years and worsening the terms of trade for pastoralists. This is a reflection of the poorly developed market
in the area.
The poor state of road infrastructure (only dry-weather roads), combined with scarce transport services, leads to
extreme fluctuations in prices seasonally. Particularly during the hunger season, pastoralists face high prices for cereals
and obtain low prices for their livestock and livestock products. The absence of large-scale traders of local origin to
facilitate the inflow of basic staple cereals and the outflow of livestock and livestock products is an important
constraint. Even the district-level traders that are locally considered to be large-scale lack financial capital and storage
facilities.
South Omo Pastoral Livelihood Zone
169
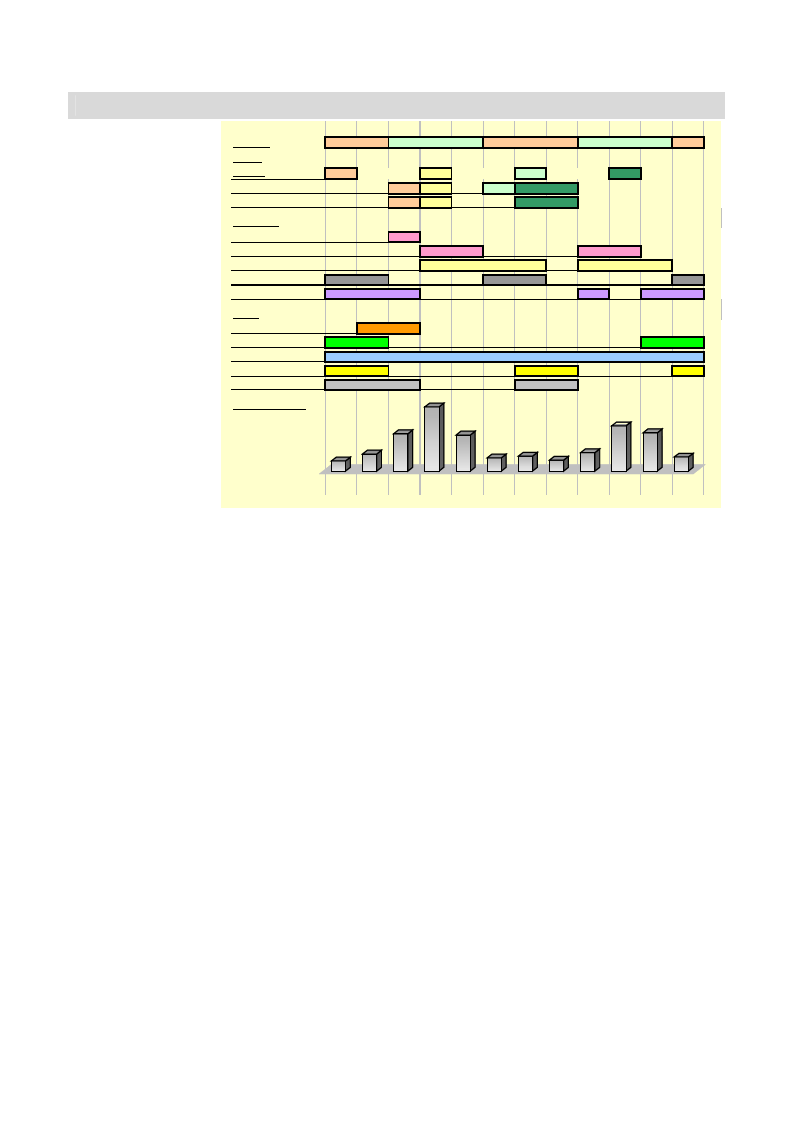
3
Seasonal Calendar
The heaviest rains of the
year usually occur in
April – May, with some
showers in June to mark
the end of the season.
The performance of
these rains determines
the success of both
livestock and crop
production for the year.
The September –
November rains are
usually less intense and
poorly distributed. They
are therefore less
important and crops are
not planted in this
period. However, they
are important for the
regeneration of livestock
feed, particularly browse
for goats, the dominant
livestock species in this
livelihood zone.
Seasons
Crops
Legend
Maize
Sorghum
Livestock
Cattle births
Shoat births
Milk production
Livestock migration
Livestock sales
Other
Hunger season
Food purchases
Wild foods
Honey harvest
Malaria / diarrhoea
Rainfall Pattern
Jan Feb Mar Apr May Jun Jul Aug Sep Oct Nov Dec
Main rains
Minor rains
land prep.
planting
cons. green
harvest
Jan Feb Mar Apr May Jun Jul Aug Sep Oct Nov Dec
The main calving period
is in March, at the start
Source of rainfall data: National Meteorological Service Agency (NMSA) Data Archives (long-term average).
of the main rains. Milk production generally begins in early April and continues consistently to the first month of the
short dry season, when it declines. Production levels rise again during the September – November rains. Goats and
sheep are born in two main periods: those that were conceived during the main rains are born during the following
minor rains and vice versa. When the rains are adequate, livestock do not migrate far from the home settlements.
During drought years, however, they migrate to the Waito River, Mago National Park and areas closer to Borana,
usually during December – February and June – July.
Land preparation for crops occurs in March, with planting of maize and sorghum in the following month. There is no
inter-cropping and plow oxen are used for preparing the land for planting. The green maize harvest starts in June and
the dry harvest of both crops occurs in July – August. The dry harvest of maize is usually small because much of the
crop is eaten green and because it is planted in smaller quantities.
The hunger or ‘lean’ period of the year is determined by the timing of livestock production rather than by crop
production and occurs in the months leading up to the main rains, when food for both humans and livestock is in short
supply. Households tend to purchase food in the months leading up to this period, with income from the sale of
livestock. Although livestock are sold throughout the year, the main period for livestock sales is November – February,
with January – February being the most important period for sales. Sales decline in March because prices tend to be
low, both because of the oversupply of the previous months and because livestock body condition is poor at the end of
the long dry season. Many pastoralists also sell livestock in September, but these are market-driven sales rather than
need-driven, because demand and prices are high throughout Ethiopia at that time of year (due to the Meskel festival).
Wild food consumption occurs throughout the year, with households gathering and consuming various wild leaves,
seeds and fruits. Honey is harvested during the dry seasons and particularly in July – August and December – February.
Malaria is the most problematic human disease in this livelihood zone and can occur throughout the year. However,
although mosquitoes breed during the wet season, the disease peaks during the dry seasons. Diarrhoea also peaks
during the dry seasons, when sanitation and personal hygiene deteriorate due to reduced access to water.
South Omo Pastoral Livelihood Zone
170
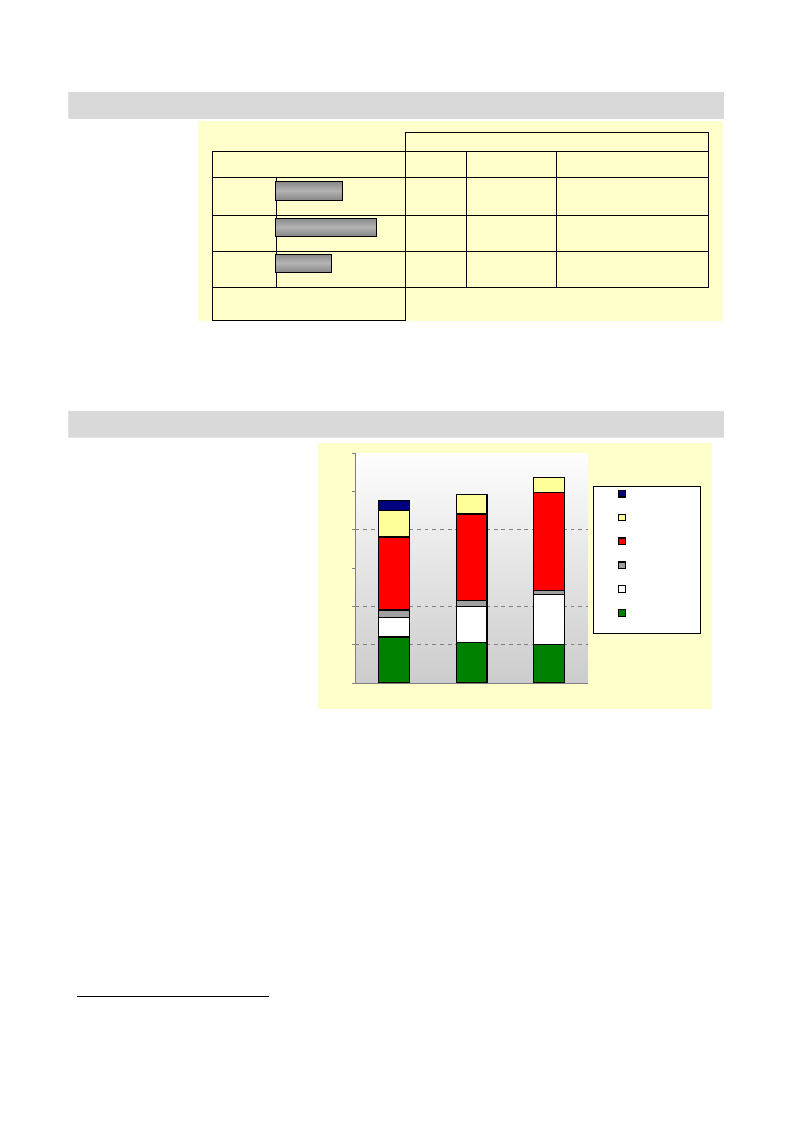
4
Wealth Breakdown
Wealth in the South
Omo Pastoral
Livelihood Zone is
determined by
livestock holdings,
particularly goat and
cattle holdings.
Other factors, such
as the area of land
that a household
owns and cultivates,
are secondary to
this.
Poor
Middle
Better-off
0%
2%0%of populati4o0n%
Wealth Group Information
HH size Land area cultivated
Livestock
4-6
6-8
8-10
60%
0.25 - 0.75 ha
0.5 - 1 ha
0.75 - 1.25 ha
1-5 cattle (including 0-2 plow oxen),
4-20 goats, 0-6 sheep
6-20 cattle (including 2-4 plow
oxen), 30-50 goats, 5-30 sheep, 0-1
donkey
30-70 cattle, 50-150 goats, 15-45
sheep, ~5 donkeys
The basic household asset and insurance against food shortages in this livelihood zone is livestock. Poor households
are caught in a cycle that leaves them with small herds that provide little protection from food insecurity when hazards
strike. If a few satisfactory years occur in succession (unusual in recent years), herd growth occurs. However,
increased livestock mortality during drought, combined with increased livestock sales to finance essential food and non-
food items, depletes the herd again and offsets the small gains made during good years.
Sources of Food – A below average year (2003-04)
The graph presents the sources of food for
households in the South Omo Pastoral
Livelihood Zone for the period April 2003
– March 2004, which was a below average
year. April represented the start of the
consumption year because that was when
milk production during the main rainy
season started, marking the end of the
annual hunger season.
Unusually, the contribution of own crop
production decreased slightly with wealth
in the reference year. This was partly
because household sizes increase
significantly with wealth and partly
because middle and better off households
spent more time tending their livestock
than their crops, whereas the poor had
more time for this activity. The main
(indeed the only) crops were sorghum and
maize.3
120%
100%
80%
60%
40%
20%
gifts
food aid
purchase
wild food
livestock
products
crops
0%
Poor
Middle
Better off
Food access is expressed as a percentage of minimum food requirements, taken as
an average food energy intake of 2100 kcals per person per day.
The contribution of livestock products (milk, butter, meat and blood) increased with wealth and was large compared to
many livelihood zones in SNNPR, as one would expect when comparing a pastoral zone with mixed farming zones.
The percentage of food purchase was large and fairly similar across wealth groups. The main foods purchased were
sorghum and maize.
All households received food aid in the reference year and collected and consumed wild foods, mainly wild green
leaves, seeds and fruits. In addition, poor households received gifts of cereals from better off households.
3 There is some variation in the importance of these two crops. For the Hamer and Tsamay pastoralists, sorghum is the most
important crop and maize is less important, mostly consumed green. In contrast, for the Benna pastoralists, maize is more important
that sorghum.
South Omo Pastoral Livelihood Zone
171
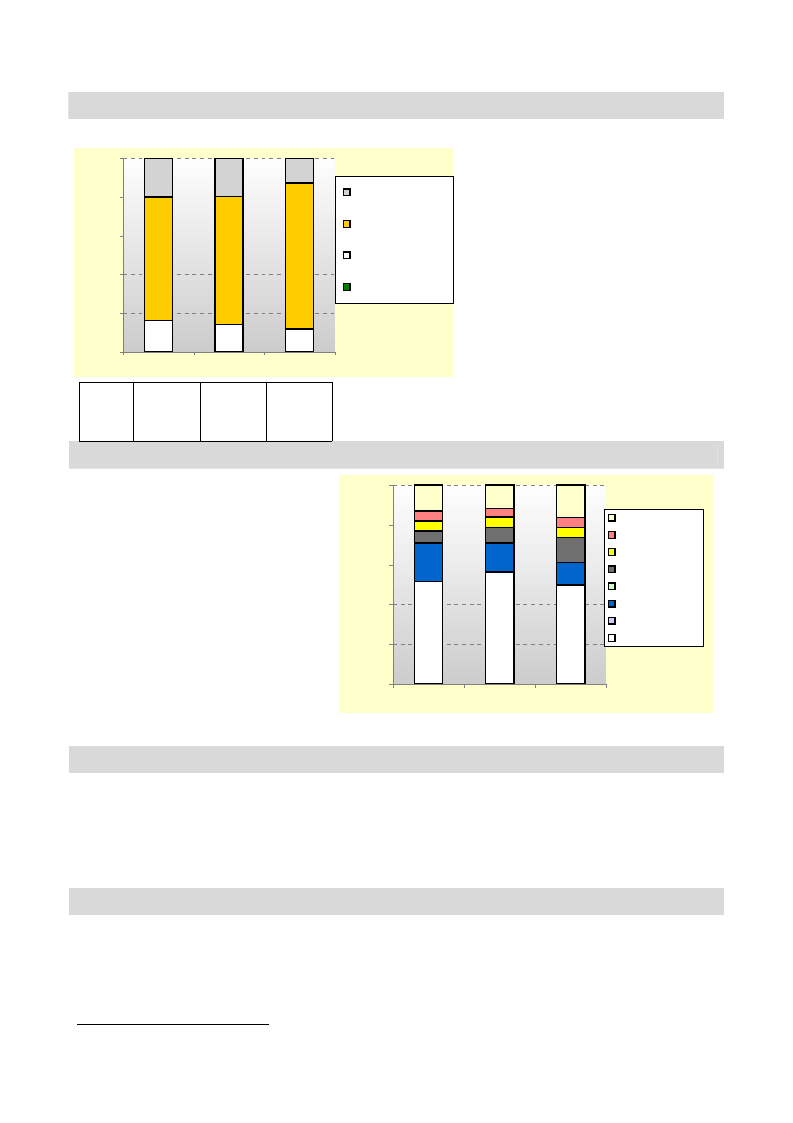
5
Sources of Cash – A below average year (2003-04)
The graph provides a breakdown of annual cash income according to income
source.
100%
80%
60%
40%
20%
honey sales
livestock sales
l/stock prod. sales
crop sales
0%
Poor
Middle
Better off
The graph presents the sources of cash
income for households in different wealth
groups for the period April 2003 – March
2004. Households in all wealth groups
obtained most of their cash income from
livestock sales. Better off households
typically sold two cattle and middle
households sold one in the reference year.
Poor households try to avoid selling cattle,
but typically sell one every two years (unless
the situation is desperate). The number of
shoats (sheep and goats) sold was much
higher than this. Livestock prices are
generally low in this livelihood zone
compared to other pastoralist areas of
Ethiopia, particularly compared to Somali
Region.
Annual
income
(ETB)
750-
1250
1250-
1750
2000-
3000
Supplementary income sources in the
reference year for all wealth groups were
butter (livestock product) and honey sales.4
Expenditure Patterns – A below average year (2003-04)
The graph presents expenditure patterns for
the period April 2003 – March 2004.
Although expenditure on each category as a
proportion of total spending was reasonably
similar across the wealth groups, the absolute
amounts spent on each category increased
with wealth.
The category ‘household items’ included
large quantities of coffee and small quantities
of salt and soap. ‘Other’ included tax, social
obligations, ceremonies, savings and
investment in livestock. The category ‘social
services’ included spending on health only.
Very few children attended school in this
livelihood zone in the reference year.
Expenditure on clothes was low compared to
other livelihood zones in SNNPR.
100%
80%
60%
40%
20%
other
clothes
social services
inputs
water
HH items
non-staple food
staple food
0%
Poor
Middle Better off
The graph provides a breakdown of total cash expenditure according to category
of expenditure.
Hazards
The main periodic hazard that affects the zone is drought, which results in crop failure, increased staple food prices,
reduced livestock production and reduced livestock prices (due to poor body condition). Livestock diseases (including
trypanosomiasis, pasteurolosis, blackleg and anthrax) are a chronic hazard, leading the complaints of farmers in all
areas of the livelihood zone. Malaria during the rainy season is another chronic hazard that affects health and labor
availability at household level. Market shocks are a periodic problem, primarily caused by crop failure in the
neighboring agricultural and agro-pastoral livelihood zones, which results in increased cereal prices for pastoralists
independent of conditions in the pastoralist livelihood zone.
Response Strategies
Households in this livelihood zone have a number of strategies to respond to hazards, particularly to drought. The first
priority during drought is the survival of livestock, so household members migrate with their animals in pursuit of
better water and pasture conditions (primarily towards the Mago and Waito Rivers and to areas near Borana). The main
strategy for obtaining cash to purchase food is increased livestock sales. Obviously, wealthier households are in a
better position to exploit this strategy since they own more livestock. All households also have the option of reducing
non-essential expenditure on items such as coffee and clothes in order to spend more money on staple food.
4 It is worth noting that honey production is higher in the Mali pastoralist area than in other parts of the livelihood zone.
South Omo Pastoral Livelihood Zone
172
6
However, expenditure on such items is already quite minimal in this livelihood zone so this is a limited strategy.
Households consume more wild foods, meat and blood during bad years. The increased consumption of meat occurs
because slaughter is increased (usually of animals that are suffering from the drought conditions), and animals that have
died are also consumed in this area (which is dangerous if they have died from anthrax). In addition, more animals are
bled during bad years in an effort to make up for reduced milk production. Finally, poor households seek out increased
gifts of food and cash from better off households.
Indicators of Imminent Crisis
S eason M onth Indicator
R ainy
season
D ry
season
R ainy
season
D ry
season
A p ril
M ay
June
J u ly
Aug
Sept
Oct
Nov
Dec
Jan
Feb
M ar
S ignificant delay or failure of m ain rains
E arly cessation or poor distribution and intensity of m ain rains
D elayed or failed green m aize harvest
P oor sorghum and m aize dry harvests and honey harvest in July - A ugust
S evere outbreak of m alaria in July - A ugust
S ignificant delay or failure of m inor rains
E arly cessation or poor distribution and intensity of m inor rains
E arly m igration of livestock to distant areas indicates unfavourable food security situation
E xtensive livestock m igration to distant areas during D ecem ber - F ebruary
U nusually high prices for cereals during D ecem ber - F ebruary
A bnorm ally high supply of livestock to m arket and low livestock prices in D ec - F ebruary
Increased livestock m ortality and unusually low calving rate
The graphic presents the likely sequence of indicators in the lead up to a severe food crisis. There is a wide range of key
indicators for the zone, including those related to rainfall, livestock production and mortality, livestock migration,
staple food and livestock prices, the timing and quantity of harvests, and malaria outbreaks.
South Omo Pastoral Livelihood Zone
173
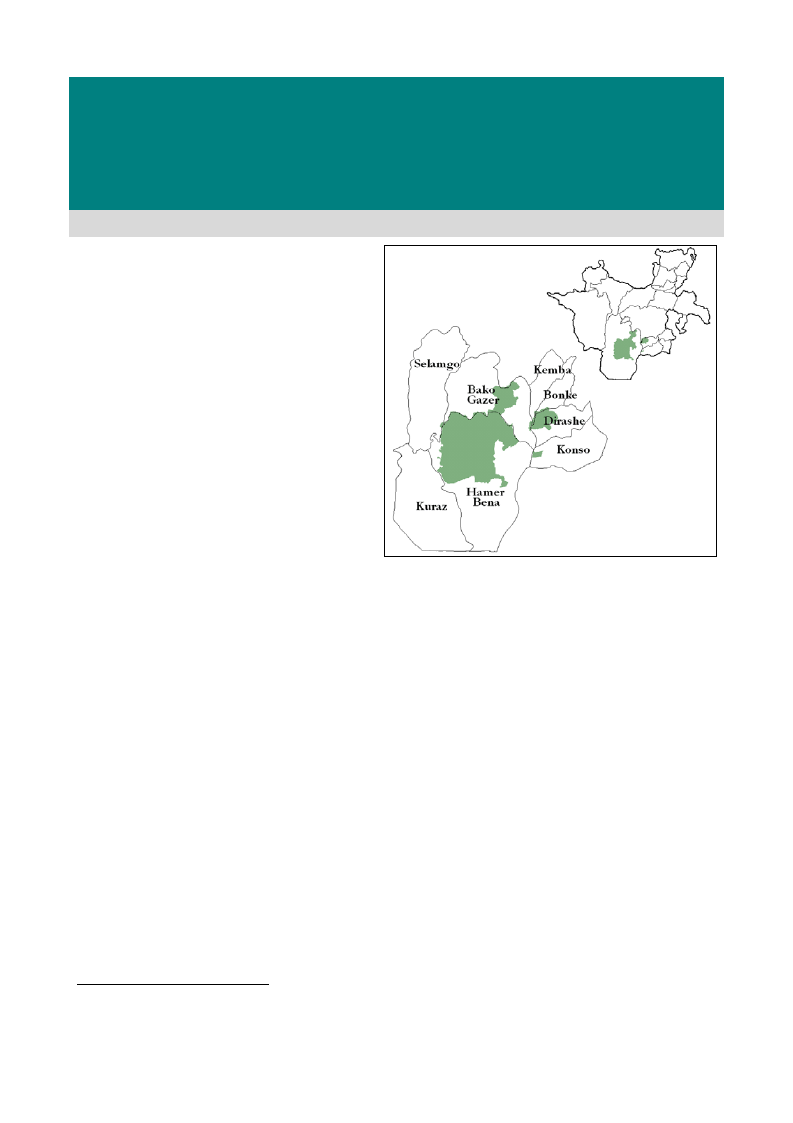
SNNPR Livelihood Profile
Southern Agro-Pastoral Livelihood Zone
June 20051
Zone Description
The most distinctive features of the Southern Agro-
Pastoral Livelihood Zone are the significant livestock
holdings of the average household and the extent of
good grazing land. While livestock and livestock
products are relatively plentiful, agricultural
production is limited compared to other livelihood
zones in SNNPR. This is mainly because sedentary
farming is a relatively recent practice for the area.
Though there is good agricultural potential if water
access were developed, the area’s greatest sustainable
potential seems to be through continued livestock-
focused development.
The livelihood zone covers a large, flat lowland area
with extensive bush and shrub cover, and patches of
acacia forest in some areas. The latter allows for the
collection of both gum and honey. The main rains fall
from February to May (the belg) and there is a second
short rainy season from September to October. The
population density is low.
Crop production, livestock production and food purchase all contribute significantly to meeting food consumption
needs in this area. In addition to their importance as a source milk, butter and meat, livestock are the main source of
cash income in the livelihood zone. The middle and better off wealth groups have relatively large livestock holdings,
most of which are cattle and goats. Sheep are also common in some parts of this livelihood zone. Cattle herds are
normally divided between the homestead and the traditional grazing areas or forra. Most livestock are kept in the
forra, though households also keep some milking cows, goats, sheep, and a donkey near their home. Livestock
migration is common when there is scarcity of pasture and water, as well as when there is epidemic livestock disease.
These migrations are generally confined to the woreda, given the often difficult relations between peoples from
different woredas, e.g. between Bako Gazer (the Mali people) and Bena Tsemay.
Crop production is entirely rainfed, except in a small number of communities living near to the Weyto river (e.g. in
Konso), which practice irrigation. Crops are grown only during the belg season. The main crops are sorghum and
maize, and these are mainly for home consumption rather than sale. Middle and better off households cultivate their
land using plow oxen, whereas the poor cultivate mainly by hand. Crop production is minimal when the rains fail, and
people rely heavily on livestock to meet their income and food needs in bad years. One advantage of growing crops is
that even if there is no harvest, crop residues can be fed to livestock. This can be especially important in a drought year.
The main constraint to accessing food and income in this livelihood zone is recurrent drought and/or inconsistent rains.
These affect all types of production in this livelihood zone. When rains are poor, there is less pasture and fodder,
resulting in poor physical condition of livestock and lowered value. There is also less food production from crops,
forcing people to sell more livestock and limiting herd growth. Low crop production results in increased food prices,
which have a particularly serious effect on people living in this livelihood zone as they rely heavily on the market.
Drought or inconsistent rains also cause decreased milk and butter production from livestock, and contribute to
increased risk of livestock disease.
Infrastructure in the livelihood zone is poor, and the main roads linking the area to outside markets (especially Arba
Minch) become impassable during the rains. This affects the prices of both livestock (for sale) and staple foods (for
purchase).
1Field work for the current profile was undertaken in April, May, and June of 2005. The information presented refers to June 2003-
May 2004 (EC Sene 1995 to Genbot 1996), a roughly average year by local standards (i.e. a year of average production and rural
food security, when judged in the context of recent years). Provided there are no fundamental and rapid shifts in the economy, the
information in this profile is expected to remain valid for approximately five years (i.e. until 2010).
174
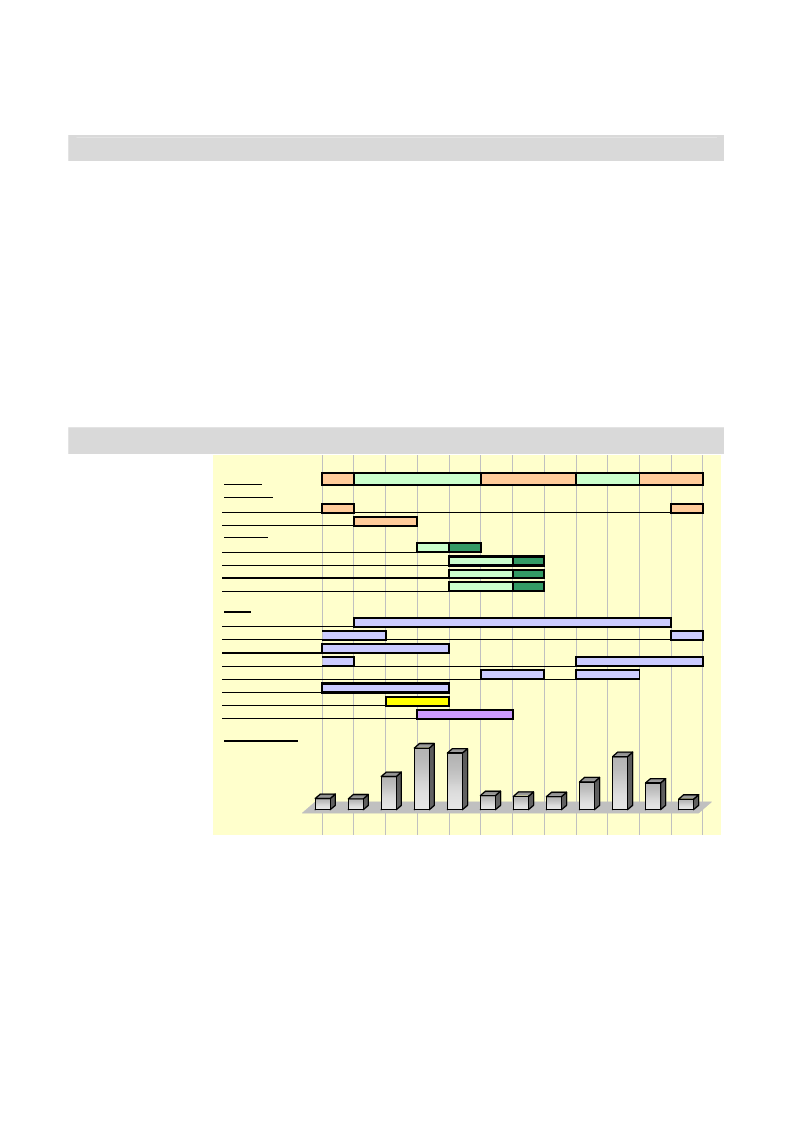
2
Water access is a little worse than in neighboring crop-producing livelihood zones as there is less rainfall during the
meher season. Within the livelihood zone there is access to at least 2 rivers that flow all year, plus a number of seasonal
rivers that flow during the wet season.
Markets
Most markets are to be found at woreda level, with only one village level market within the livelihood zone. The main
woreda markets are located in Demeka, Key Afer, and Jinka. Jinka, the main market for the region, supplies maize and
sorghum to Bako Gazer woreda and to other woreda markets in the livelihood zone.
The main types of livestock sold out of the livelihood zone are oxen and goats. These are transported from Demeka
and Key Afer to Jinka, and from Key Afer to Konso and Arba Minch. Butter, honey, and incense are also produced and
sold in significant quantities, mainly in woreda markets and for local consumption. Butter prices in this livelihood zone
are very low relative to the rest of SNNPR. This is mainly due to the reportedly low quality of the butter and limited
access to markets outside the livelihood zone.
People’s access to woreda towns markets is relatively good, but the flow of goods from outside the livelihood zone to
these markets is often interrupted by the belg rains. At this time of year the access roads to Arba Minch are often
flooded, affecting both the availability and price of goods. The rainy season coincides with the hunger season, further
increasing prices.
Few traders are active in the livelihood zone. Some traders travel from the agricultural areas of Jinka into parts of the
livelihood zone to exchange heifers for oxen through barter, as the agro-pastoralists prefer heifers for milk production
and agriculturalists prefer oxen for plowing. Additionally, there is the practice of trading three cattle to obtain one gun.
Seasonal Calendar
The livelihood zone
has one main rainy
season from February-
May (belg in Amharic)
Seasons
Belg Crops
Land Preparation
Planting
Jan Feb Mar Apr May Jun Jul Aug Sep Oct Nov Dec
Dry
Belg
Kremt
Dry
and a season of
Harvesting :
secondary rains in
September-October.
Cows in the livelihood
zone tend to give birth
Haricot beans
Maize
Sorghum
Millet
green
green
green
green
once every two years,
typically in February,
and then lactate for
approximately 10
months. Milk
Other
Cows' milk production
Livestock migration
Livestock sales
Gum collection
Honey production
production is therefore Food purchase
lowest in the dry
season months of
Hunger Season
Malaria
December and January
when water and
Rainfall Pattern
grazing are in shortest
supply. Milking cows
are generally kept
close to the homestead,
while dry animals are
kept in traditional
grazing areas or forra.
Jan Feb Mar Apr May Jun Jul Aug Sep Oct Nov Dec
Source of rainfall data: National Meteorological Service Agency (NMSA) Data Archives (long-term average).
In a typical year December to February are the months of seasonal migration, when cattle from the homestead are
joined with those in the forra and all animals move in search of dry season grazing. Goats and sheep tend to be kept
closer to home. Goats are milked in some but not all communities in the livelihood zone, but the contribution to total
food energy consumption at household level in minimal.
Crops are planted at the start of the belg rains. Maize and haricot beans are generally intercropped, and sorghum, millet
are also grown. Small amounts of teff (mainly for sale) are planted by some communities. Rains falling in September
and October are essential for re-generating pasture and browse for livestock and water for both human and animal use
but are inadequate for crop production.
The hunger season and staple food prices peak in the months running up to the start of the green maize harvest in May.
These are the main months for selling livestock, since this is the primary source of cash income for the livelihood zone.
Southern Agro-Pastoral Livelihood Zone
175
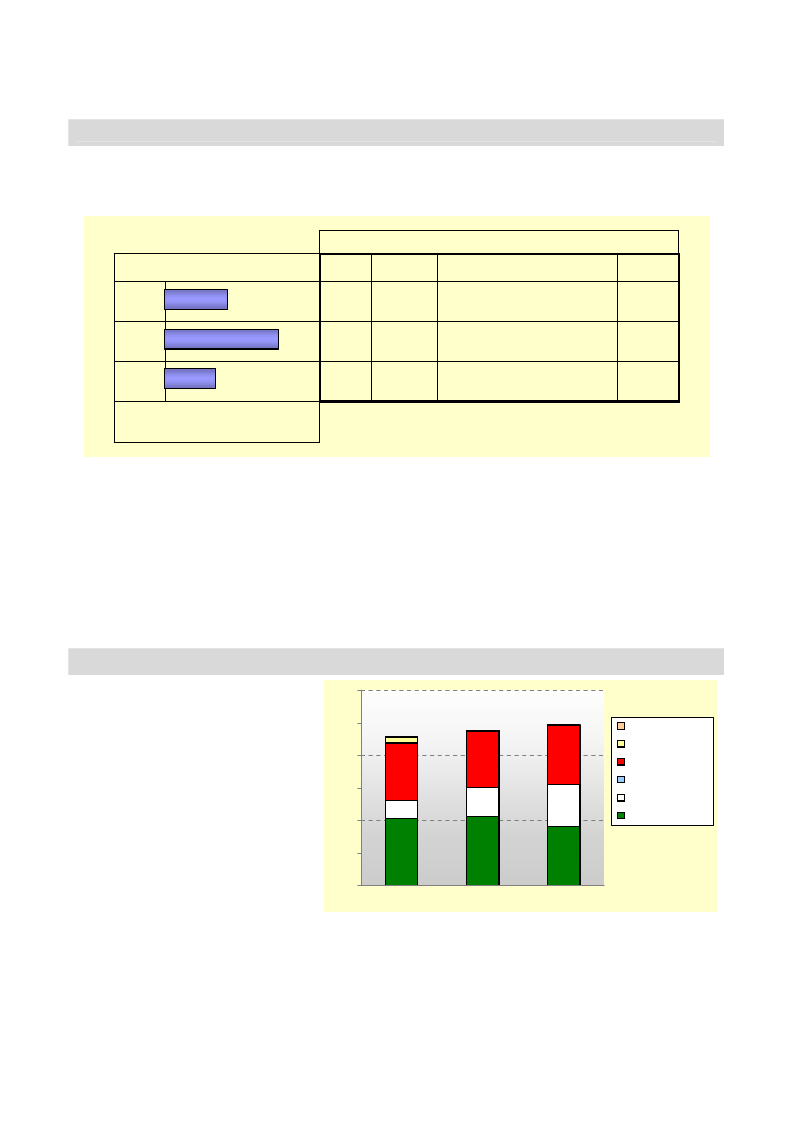
3
Malaria is worst following the belg rains (from April through June), when there are stagnant pools of water for young
mosquitoes to hatch.
Wealth Breakdown
Livestock holdings are the main determinant of wealth in the livelihood zone. All types of livestock are important, but
cattle are especially significant since they are a source of milk and butter as well as significant cash income from
livestock sales. The loaning of oxen and/or milking cows from better off to poor households (yerbee in Amharic) is
quite common in the livelihood zone. When a cow is given by a better off person to a poor household, the traditional
Poor
Middle
Better-off
0%
2%0%of populati4o0n%
Wealth Group Information
HH size
Land area
cultivated
Livestock
Bee hives
4-6
0.25-0.5 ha
0-2 oxen, 3-5 cattle plus 2-4 loaned,
5-15 goats, 0-4 sheep
2-5
7-9
0.5-1 ha
3-4 oxen, 15-25 cattle, 15-25 goats,
5-15 sheep, 0-2 donkeys
4-6
8-12
1-1.5 ha
5-7 oxen, 30-60 cattle, 30-80 goats,
20-30 sheep, 2-4 donkeys
7-9
60%
practice is to name the animal after its original owner. Poor households can use the milk and butter from these cows,
they can sell the offspring in a bad year and they can use the oxen for plowing.
Landholdings are not considered an indicator of wealth in the livelihood zone, as land is abundant and available.
Cultivation is however limited by the number of oxen owned and the available labor. Better off households are on
average twice as large as poorer households and therefore have more available labor. All wealth groups grow the same
types of crops, and all keep hives and produce honey, a important source of cash income for the livelihood zone.
The main constraint for the poor in this livelihood zone is a lack of livestock and the difficulty they face in building up
their herds when faced with repeated droughts. A lack of oxen means that the poor are not always able to prepare and
plant their land on time, so that their harvests are often lower than they might be. Additionally, they are often forced to
sell off this key asset in order to buy food, especially during frequent years of drought.
Sources of Food – An average year (2003-04)
The bar chart shows how different food
sources contributed to the average yearly
diet for each wealth group in an average
year (June 2003–May 2004).
Overall, the better off were able to secure
almost all of their minimum food needs in
an average year, while the poor and middle
groups consumed from 90%-95% of their
minimum requirements.
Two things are noteworthy. Firstly, the
similar pattern of food access for all three
wealth groups. Secondly, the relative
absence of food aid from the picture (food
aid contributed 0%-5% of food needs for
the poor, and none for either the middle or
the better off).
Crops contributed a similar percentage to
120%
100%
80%
60%
40%
gifts
food aid
purchase
payment in kind
livestock prod.
crops
20%
0%
Poor
Middle
Better off
In the graph, food access is expressed as a percentage of minimum food
requirements, taken as an average food energy intake of 2100 kcals per
person per day.
Southern Agro-Pastoral Livelihood Zone
176
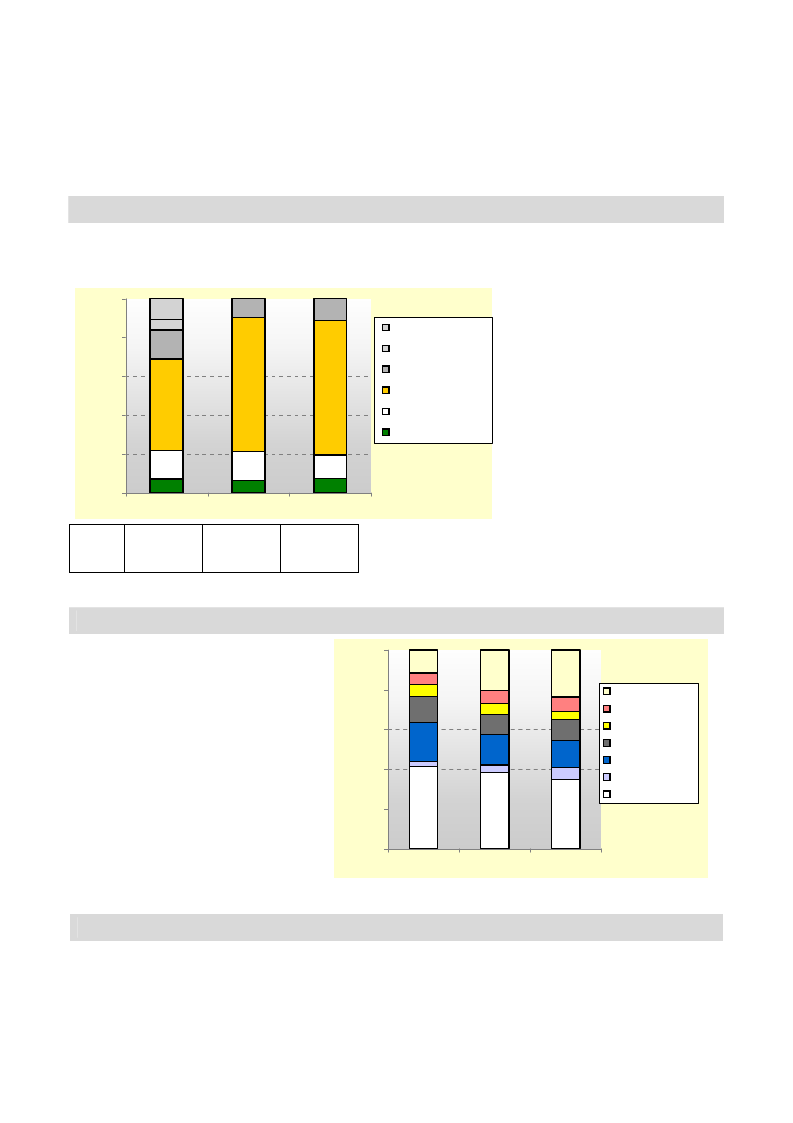
4
food needs for all three wealth groups. This is mainly because the higher production of the middle and better off is
shared between more household members than in the case of the poor (i.e. crop production increases in proportion to
household size). The same is not true of livestock production, since per capita livestock holdings increase with wealth
(even taking loan arrangements between the poor and better off into account).
The category “livestock products” in the graphic includes milk, butter, and meat from goats and cattle. Cow’s meat
consumed in this livelihood zone is almost exclusively from dying animals, as it is culturally frowned upon to kill cattle
except in extreme circumstances. Blood is also consumed by people in the livelihood zone, mixed with milk.
Sources of Cash – An average year (2003-04)
This bar graph shows the various sources of income for each wealth group in the livelihood zone in 2003-04.
The graph provides a breakdown of total cash income according to income
source.
100%
80%
60%
40%
20%
other
petty trade
honey sales
livestock sales
l/stock prod. sales
crop sales
There are obvious differences in total
income but, somewhat unexpectedly,
per capita income was relatively similar
for all three wealth groups (i.e. the
lower absolute income of the poor was
almost completely offset by their
smaller household size). This suggests
that the standard of living is similar for
all wealth groups in an average year.
However, the ability to cope with
shocks to production is very different
due to significant differences in
livestock holdings among the wealth
groups.
0%
Poor
Middle
Better off
Sale of livestock was the single most
important source of income for all three
wealth groups. Butter and honey were
Annual
income
(ETB)
1,000-
1,200
1,600-
2,000
2,000-
3,000
the next most important, followed by
limited crop sales (sorghum, maize and
teff). The poor also derived small
amounts of income from petty trade (i.e. sale of alcoholic drinks) and ‘other’, in this case sale of incense, wood and
pots. There is no tradition of paid or communal labor in the livelihood zone.
Expenditure Patterns – An average year (2003-04)
The graph on the right presents the
expenditure patterns of different wealth
groups in the livelihood zone in 2003-04.
Patterns of expenditure are similar for all
three wealth groups, other than a progressive
increase in expenditure on ‘other’ as wealth
increases. This is largely a reflection of the
similar standard of living for each wealth
group (see sources of cash section).
‘HH (household) items’ includes salt, soap,
and kerosene, ‘other’ includes tax, social
obligations and ceremonies, and ‘social
services’ includes spending on health and
education. The main “inputs” for this
livelihood zone are livestock drugs and some
purchase of tools.
Hazards
100%
80%
60%
40%
20%
other
clothes
social serv.
inputs
HH items
non-staple food
staple food
0%
Poor
Middle Better off
The graph provides a breakdown of total cash expenditure according to
category of expenditure.
For the past five years, drought and irregular rainfall have been recurring problems for the livelihood zone. This has
the effect of reducing the availability of water and grazing, negatively affecting the productivity, health and
marketability of the livestock that are central to local livelihoods. Drought and irregular rainfall also have the effect of
reducing crop production.
The most common livestock disease in this area, trypanosomiasis, has recently been targeted by NGOs and the
Southern Agro-Pastoral Livelihood Zone
177
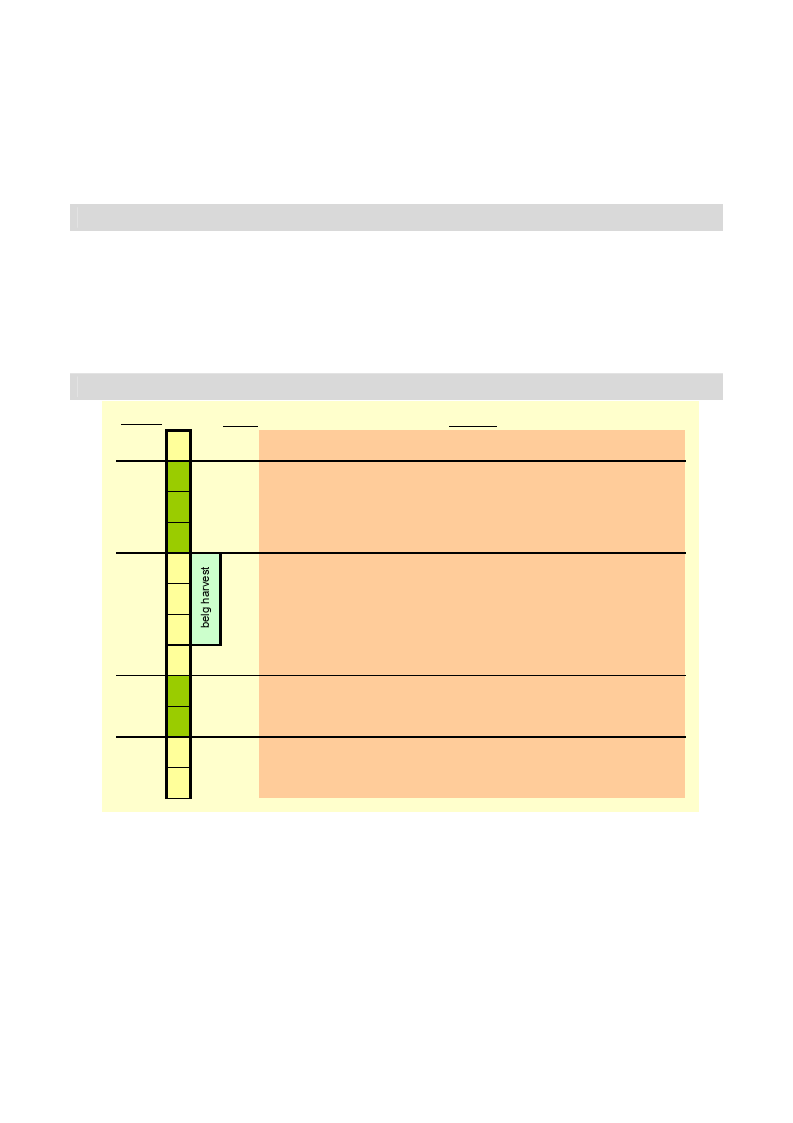
5
government through a program of assistance which may reduce its effects in both the short and long-term.
Malaria is endemic to the livelihood zone and is a major problem affecting labor availability at household level. Labor
is required both for crop production and to care for livestock.
Resettlement may pose a threat to local livelihoods in the future. There are currently plans for resettling people from
Konso to areas around Mago Park, which may affect access to key grazing areas for people from Bena Tsemay woreda.
The same grazing areas are also used by people from Hamer woreda during severe drought years, as well as for human
migration during especially bad years.
Response Strategies
An increase in the sale of livestock is the most common and effective response to drought in the livelihood zone, and
is used by all wealth groups. The income derived from livestock sales is used to purchase staple foods. People in the
livelihood zone also slaughter more animals and increase the consumption of blood from cattle during bad years.
This helps offset the loss of milk caused by drought. An increase in gifts of livestock to poor households is also
common in bad years.
Although possibly effective in the short term, increasing the sale and slaughter of livestock can also mean stagnant or
declining herd sizes. For the middle and better off this is not a grave problem given their relatively large herd sizes.
For the poor, however, it is a significant barrier to the achievement of increased wealth and longer-term food security.
Indicators of Imminent Crisis
Season
Dry
Season
Belg
rains
Dry
Season
Month
Indicator
Jan Lack of water and fodder; Unusual livestock migration
Feb Lack of water and fodder; Unusual livestock migration
Low availability of milk
Mar Rains do not start until March; Delayed planting: Unusual increase in food prices
Stunted crop growth (late March); Low availability of milk
Apr Erratic and un even distribution of rainfall; Crop pest infestation
Severe outbreak of malaria (Apr-June)
May Poor appearance of crops
Unusually high sales of livestock (May onwards)
Jun
Jul
Aug
Kremt
rains
Sep Poor rains
Oct Poor rains; low availability of milk
Dry
Season
Nov Lack of water and fodder
Dec Lack of water and fodder; Unusual livestock migration
The above chart illustrates the main indicators of developing crisis in the livelihood zone, beginning with a failure of
the belg rains in March. These rains should start in February, bringing about an improvement in grazing and milk
production. A delay of the rains until March is the first sign of a potential drought developing. A late start to the rains
(i.e. March or later) delays planting, which means that green consumption will begin a month or so later than usual,
leading to a prolonged hunger season this year, and possible food shortages the next. If by mid- to late March, standing
crops are stunted, this indicates below average and/or late crop production. This also contributes to market price
increases starting from that time. Erratic and uneven distribution of rains in March and/or April will create favorable
conditions for pest infestation, another factor contributing to poor harvests.
Sometimes the belg rains are sufficient to produce enough fodder for the year. Poor belg rains followed by poor rains
in September and October will compound the problem of insufficient fodder leading to unusual patterns of livestock
migration from December-February.
Southern Agro-Pastoral Livelihood Zone
178
SNNPR Livelihood Profile
Key Parameters for Monitoring Livelihoods at Woreda Level
Woreda:
Zone:
Bennatsamay
South Omo
LIVELIHOOD ZONES IN THE WOREDA
LZ code
Livelihood Zone
SOP
South Omo Pastoral LZ
SAP
Southern Agro-Pastoral Livelihood Zone
CROPS
A: MAIN CROPS GROWN, BY LIVELIHOOD ZONE
1= major crop for the LZ, 2 = minor crop
Importance for woreda Crop
SOP
SAP
1 Major
sorghum
1
1
2 Major
maize
1
3
4
5
6
7
8
9
10
11
12
B: MAIN CROPS SOLD, BY LIVELIHOOD ZONE
1= major source of cash income for the LZ, 2 = minor source
Importance for woreda Crop
SOP
SAP
1
2
3
4
5
6
7
LIVESTOCK - MAIN TYPES SOLD, BY LIVELIHOOD ZONE
1= major source of cash income for the LZ
Importance for woreda Livestock type
SOP
SAP
1 Major
cattle
1
1
2 Major
goats
1
1
3 Major
fattened oxen
1
4 Major
sheep
1
OTHER SOURCES OF CASH INCOME
1= major source of cash income for the LZ
Importance for woreda Source of cash income
SOP
SAP
1 Major
butter sales
1
1
2 Major
honey
1
3
4
5
6
Note: A Key parameter is defined as a source that contributes significantly to total food/cash income, so that
a reducton in access to that source may have a significant effect on total income. A major source is one that
contributes 10% or more to minimum annual food energy needs for two or more wealth groups (either
directly as food or if used to purchase food). A minor source contributes 5%-10% to annual food needs.
179

Summary of non-food baseline information: Bennatsamay Woreda
Livestock production
Main diseases (and their seasonality):
- Trypanosomiasis (all year but especially during the
rainy season)
- CBPP (all year but especially during the rainy season)
- CCPP(all year but especially during the rainy season)
- Dermatitis (all year but especially during the rainy
season)
Woreda services:
o Periodic vaccinations for CCPP, anthrax, CBPP
and Blackleg
o 6 Livestock Extension Officers at the community
level
Water sources
Overview:
o There is seasonal shortage of water in the kolla
altitude zone
Rivers:
o Major: Bezo, Maki, Neri, Useno and Kako
o Minor: Abinet, Konti, Poshti, Sukesi, Welshet
Reservoirs:
o n/a
Deep wells:
o in Jinka
Shallow wells
o n/a
Developed springs:
o Saka Springs (Toita town)
o Zomba Springs (Gazer town)
Seasonal Pools
o Gongode
Human health
Main diseases:
o Malaria ( September-December)
o Helminthiasis (once every two years)
o Upper Respiratory Tract Infection (UPTI)
o Diarrhoea (not seasonal)
o Gastritis (not seasonal)
Vaccinations
o In 1996, vaccinations were given against BCG
(982), DPT3 (831), Tetanus Toxoid (TT) (496)
and Measles (466)
Woreda services:
o 8 health workers in the woreda town
o 20 health workers at the community level
o 8 health posts
o 1 health centre at the woreda town and 1 at the
community level
Nutrition
o December to June are months of seasonal food
shortage in an average year
o Early weaning, poverty and food taboos contribute
to malnutrition in the area
180