


NATIONAL
DISASTER RISK MANAGEMENT COMMISSION
(NDRMC)
WOREDA DISASTER RISK PROFILE (WDRP)
REGION: S.N.N.P
ZONE: GEDIO
WEREDA: WENAGO
December, 2020
Addis Ababa

About the National Disaster Risk Management Commission (NDRMC)
The National Disaster Risk Management Commission (NDRMC) was reestablished in
December 2015 and recognized by an act of Council of Ministers (Regulation No.
363/2015) as an autonomous Federal Government office mandated to conduct
appropriate activities for the comprehensive implementation and realization of the
objectives of the National Disaster Risk Management Policy and Strategy and to
coordinate, monitor and provide appropriate support with respect to activities
carried out by the lead sector institutions.
Address: Kirkos Sub-city Behind Dembel City Center, Addis Ababa, Ethiopia.
P.O.Box: 5686
Tele: 0115524259/4272
Website: www.dppc.gov.et
© 2020 National Disaster Risk Management Commission. All rights reserved
Printed in Addis Ababa, Ethiopia.
Citation- This Document May be Cited as Follows:
National Disaster Risk Management Commission (2020), Wenago Woreda Disaster
Risk Profile, Addis Ababa, Ethiopia.

PREFACE
Ethiopia is well aware of the impact that disasters can have on the
development goals that we are rigorously pursuing through our
Growth and Transformation Plan II. With this recognition we started
a paradigm shift a few years ago, largely triggered by the revised
National Policy and Strategy on Disaster Risk Management.
To make the DRM programme implementation in the country well-informed, a
comprehensive information management system is required. We have been undertaking
a comprehensive risk assessment exercise under which Disaster Risk Profiles are being
prepared for each district and at sub-district levels in the country.
This Wereda Disaster Risk Profile establishes an extensive database on disaster risk
elements that will help decision makers at all levels to be better informed at community
and Wereda level about the characteristics of potential hazards, their potential
exposure, vulnerabilities of communities, capacities and that can also be an input for
Wereda Disaster Risk Reduction Plans and area specific early warning tools.
Wereda Disaster Risk Profiles developed are publically available here for the use of all
development partners and government sectors at all levels. Also, other data sources of
NDRMC, such as Desinventar, Livelihood Baseline and the Early Warning information will
be integrated and harmonized with this Information Management System.
Finally, we need to acknowledge the support of partners who have funded this
programme and we also look for the support of donors and all development partners in
order to achieve the ambitious indicators of this risk information and providing every
district with the disaster risk profile and their respective risk-informed plans.
H.E. Ato Mitiku Kassa
Commissioner
National Disaster Risk Management Commission (NDRMC)
The Federal Democratic Republic of Ethiopia (FDRE)

PREFACE
Woreda Disaster Risk Profiling (WDRP) is a government owned
programme undertaken by the National Disaster Risk
Management Commission (NDRMC) in collaboration with regional
DRM offices and development partners to provide baseline
information for disaster risk management practices and
activities in the country. The programme is designed by taking
into account the experiences gained from the implementation of pervious strategies
and actions like the Hygo Framework for Action (2000-2015) and the Sendai Framework
for Disaster Risk Reduction (2015-2030).
WDRP is composed of diversified indicators including hazard related issues, crop and
livestock production, landholding and environmental issues, human and livestock health
issues, education and social issues at wereda and kebele level. It provides basic and
detailed indicators with both quantitative and qualitative information which obtained
from both primary and secondary data sources.
Moreover, two pages summary of profiles is also prepared to help users easily
understand WDRP results for each wereda without going into detail for all indicators.
In addition to this booklet, developed profiles are uploaded on WDRP website
(http://profile.ndrmc.gov.et) to be viewed by all users; we encourage all DRM actors
at all levels to use this profile as baseline information for all DRM initiatives.
This WDRP booklet was produced through exemplary collaboration of all concerned
bodies and I would like to give my deepest gratitude to all who directly or indirectly
contribute for the success of the programme particularly for data enumerators and
supervisors, data encoders and profile development teams, consultants and advisors,
partner ministries and all DRM stakeholders.
Abraham Abebe
Director
Disaster Risk Reduction and Rehabilitation Directorate (DRRRD)
National Disaster Risk Management Commission (NDRMC)
Contents
No. Indicator Name
Page
General Information
I
Preface
II
Wereda Location in Ethiopian Map
III
Methodology
IV
Summary Profile
Hazard Related Characteristics
1
1
Biological Hazards of the Wereda
2
2
Geological Hazards of the Wereda
3
3
Hydro Metrological Hazards of the Wereda
4
4
Socio Economic Hazards of the Wereda
5
5
Technological Hazards of the Wereda
6
6
Disaster Characteristics By Kebele
7
7
Hazards: Conflict as an Issue
28
8
Hazard Situation During Last Disaster - Characteristics of most recent disaster that
affected the community
31
9
Frequency of Disaster Occurrence
34
10
Household Exposure to Hazards
35
11
Months of Occurrence of Frequent Disasters
36
12
Conflicts: Perception of households on conflict issues - Is conflict an issue in this
community?
38
13
Conflicts: Perception of households on conflict issues - Who do you turn to in case
of a conflict?
39
14
Losses from Disasters - Losses from all disasters (household response in %)
40
15
Losses from Disasters - Main Losses by Type of Disasters (household response in %) 41
16
Losses from Disasters - Secondary Losses by Type of Disasters (household response
in %)
44
17
Seasonal Calendar for Hazards, Activities and Income Level By Kebele
50
No. Indicator Name
Page
Infrastructure Access Characteristics
18
Physical Vulnerability: Access to Roads & Urban Centres - Households access to
road and urban centre
68
19
Physical Vulnerability: Access to Electricity - Households’ access and utilization of
electricity
69
20
Physical Vulnerability: Type of Dwelling Units - Households’ type of dwelling houses 70
Socio Demographic Characteristics
21
Economic Vulnerability: Level of Migration - Migration level and its characteristics
by Kebele
72
22
Economic Vulnerability: Household Migration - Household migration and reason for 75
migration
23
Economic Vulnerability: Household Migration - Disasters as a triggering factor for
migration (households response in %)
76
24
Demography: Population Structure
77
25
Demography: Population Trends and Ethnic Groups
79
Social Vulnerability: Household Demographic Characteristics - Demographic
26
characteristics of households
80
Social Vulnerability: Level of Educational Attainment - Education status of
27
household members
81
28
Social Vulnerability: Gender Parity - Gender parity in education level (7+ years)
and household heading
82
Environmental Characteristics
29
Environmental Situation: Environmental Problems - Major environmental problems
by Kebele
84
30
Environmental Situation: Deforestation - Observed changes over levels of
deforestation by the community and its problems
85
31
Environmental Situation: Natural Resources Availability - Natural resources
available and changes observed by the community
86
32
Environmental Situation: Rainfall & Temperature - Observed changes on rainfall
and temperature by the community over the last decade
95
33
Environmental Situation: Reasons for Environmental Changes
97
34
Environmental Situation: Soil Erosion - Observed changes on levels of soil erosion
by the community
98
No. Indicator Name
Page
Livelihood, Occupation and Source of food
35
Economic Vulnerability: Major Occupational Categories - Major categories of
occupation and percent of population engaged in the occupation by Kebele
100
36
Economic Vulnerability: Livelihoods - Households important sources of
livelihood (response in %)
102
Economic Vulnerability: Occupational Categories - Percent of population above 15
37
years age by occupation categories
105
38
Economic Vulnerability: Sources of Food - Households source for different food
items (response in %)
106
Crop Production
39
Hazards: Change in Crop Damages - Proportion of total crop damage (percentage
109
response by households)
40
Hazards: Change in Crop Damages - Major reasons for crop damage (percentage
response by households)
110
41
Hazards: Change in Crop Damages - Proportion of Damage for Major Crops
(percentage response by households)
111
42
Hazards: Change in Crop Damages - Reasons for Damage of Major Crops
(percentage response by households)
113
43
Agricultural Situation: Change in Crops Grown - Five major crops grown by
proportion of total cultivated land
115
45
Economic Vulnerability: Crops Grown - Types of crops grown by households
123
46
Economic Vulnerability: Crops Grown - Proportion of households by amount of yield 125
of major crops (last year)
47
Economic Vulnerability: Crops Grown - Proportion of households by amount of yield
of major crops (Five years ago)
126
48
Economic Vulnerability: Land Ownership and Quality - Landownership of households 128
49
Economic Vulnerability: Land Ownership and Quality - Farmers’ perception on the
quality of their agricultural land
129
50
Environmental Situation: Land-Use other than crop production - Types of land use
other than crop production across Kebeles
130
51
Economic Vulnerability: Crops Grown - Number of crops grown by households
122
Livestock Production
52
Agricultural Situation: Status of Livestock Disease - Change In Livestock Disease
133
Status By Kebele
No. Indicator Name
Page
53
Livestock Prevalent of Diseases & Veterinary Facility - Livestock Diseases
134
Prevalence
54
Livestock Prevalent of Diseases & Veterinary Facility - Evaluation of Access to
Veterinary Services and Livestock Drugs
135
55
Agricultural Situation: Livestock Diversity - Type of livestock and their economic
importance in the community
136
Economic Vulnerability: Livestock Ownership and Changes - Percentage of
56
households by number and type of livestock owned
139
57
Economic Vulnerability: Livestock Ownership and Changes - Households’ perception 141
on changes in livestock number in the last five years (response in %)
58
Economic Vulnerability: Livestock Ownership and Changes - Households
perception on changes in livestock number in the last five years (response in %)
143
59
Agriculture (Livestock): Pasture Availability - Households’ perception on access and
quality of pasture
145
60
Agriculture (Livestock): Pasture Availability - Households’ perception on
problematic months for pasture availability
146
61
Agriculture (Livestock): Water Availability - Households’ response on water
availability for livestock
147
62
Agriculture (Livestock): Water Availability - Households’ perception on problematic
months of water availability for livestock
148
63
Agriculture (Livestock): Water Availability - Sources of water for livestock
(households response in %)
149
Access to Markets and Credit
64
Economic Vulnerability: Proportion of Produce Sold and Market - Proportion of
crops and livestock sold from total production and markets
151
65
Economic Vulnerability: Kebele Access to Markets - Access to market by Kebele
153
66
Economic Vulnerability: Formal & Informal Transfers - Percentage of households
reporting received formal transfers
154
67
Economic Vulnerability: Formal & Informal Transfers - Percentage of households
reporting received Informal transfers
155
68
Capacity: Access to Credit Facilities - Households access to credit facilities
156
69
Capacity: Access to Credit Facilities - Percentage of households by major reasons
of borrowing money
157
No. Indicator Name
Page
70
Capacity: Access to Credit Facilities - Percentage of households by major sources
of credit
158
Capacity: Access to Credit Facilities - Percent of households with ability to raise
71
500 birr in one week
159
Health and Sanitation Characteristics
72
Household Access to Health Facilities - Where do patients go for health care?
161
73
Hazards: Health problems and changes over the last decade
162
74
Household Health Status - Households’ health condition and major health problems 163
75
Household Access to Sanitation - Percentage of households with access to different
kind of toilet facilities
165
76
Household Access to Drinking Water - Sources of drinking water for households
166
(response in %)
77
Household Access to Drinking Water - Households’ methods of treating drinking
water
167
78
Household Access to Drinking Water - Number of times households fetch water in a
week
168
79
Household Access to Drinking Water - Time taken per day to fetch water for
households
169
Coping Mechanisms and Preparedness Measures
80
Capacity: Community Preparedness against Sudden Onset Disasters
171
81
Capacity: Community Preparedness against Increase in Disaster Intensity
174
82
Capacity: Community Preparedness against Disasters
177
83
Hazard: Coping and recovering during last Disaster
181
84
Capacity: Type Community Participation
198
Capacity: Recovery from Losses from Disasters - Percentage of Households who
85
have managed to recover from losses of disasters
200
86
Capacity: Coping Strategies Adopted by Households - Main coping strategies
adopted by households to recover from respective losses
214
87
Capacity: Coping Strategies Adopted by Households - Percentage of households
by frequency of main coping strategies adopted
218
88
Capacity: Alternative Livelihood Sources - Alternative livelihood sources suggested
by the community
220
No. Indicator Name
Page
89
Capacity: Recovery from Losses from Disasters - Percentage of households
recovered from past disasters by type of Disasters
201
Capacity: Recovery from Losses from Disasters - Proportion of households
90
recovered by type of Losses
202
Capacity: Coping Options if More Resources Available - What coping strategy could
91
be adopted if more resource were available?
203
92
Capacity: Coping Strategies Adopted by Households - Percentage of households by
major type of coping strategies adopted (at least once)
204
93
Capacity: Coping Strategies Adopted by Households - Main coping strategies
adopted by households for respective disasters
206
94
Capacity: Coping Strategies Adopted by Households - Secondary coping strategies
adopted by households for respective disasters
211
Community Perception and Suggestions
95
Agricultural Situation: Access to Extension - Perception of the community on
Access to Agricultural extension Services
224
Agricultural Situation: Access to Inputs - Perception of the community on access
96
to improved agricultural inputs
225
Agricultural Situation: Water for irrigation - Access to water for irrigation in the
97
community
226
98
Agricultural Situation: Water Availability for Livestock - Water availability for
livestock in the community
227
Agricultural Situation: Soil Fertility - Perception of the community on soil fertility
99
and its change over time
228
100
Economic Vulnerability: Change in Agricultural Situation - Households
perception on changes of crop type, size of cultivated area and crop yields
229
101
Environmental Situation: General Land Quality - Perceptions of the community
on changes in the general quality of land over a decade
232
102
Environmental Situation: Changes in Landscape - Changes observed by the
community on landscape and the problems due to the changes
234
Interventions: Community Perception on Mediums to Influence DRM Actors -
103
Community perception on the effectiveness of institutional channels to use to
235
influence DRM actors
Interventions: Community Perception on their Knowledge used in DRM Process -
104
Perception of the community on how their knowledge influences the priorities and 239
measures of DRM actors
No. Indicator Name
Page
105
Interventions: Suggestions to DRM Actors in the Area - Community suggested
measures to DRM actors in the area for effective DRM actions
240
106
Economic Vulnerability: Community Suggestions to Improve Economic Situation -
Community suggested measures to improve the economic situation of the area
244
107
Community Awareness of Disaster Risk Management System and Actors
248
Community Perception of DRM System and Actors - Perception of the community on
108
the effectiveness of DRM system in helping them to prevent, cope and recover
252
from disasters
109
Major Public Interventions Desired - Percentage of households by type of
intervention desired
256
Others
110
Capacity: Community Based Organizations
258
111
Supporting Agencies against Disasters - Percentage of households by supporting
264
institutions to handle or recover from disaster damages
112
Types of support received by households during disasters
265
113
Government Actors in the Field of Disaster Risk Management - Government actors
and their activities in the field of Disaster Risk Managements
266
114
Non-Government Actors in the Field of Disaster Risk Management - Non-government
actors and their activities in the field of Disaster Risk Management
268
115
Interventions: Community Suggestions to Development Actors
269
116
Wereda SWOT Analysis
278
Supplementary Information from Secondary Sources
117
Wereda Livelihood Zone Information
285
118
Wereda General Information
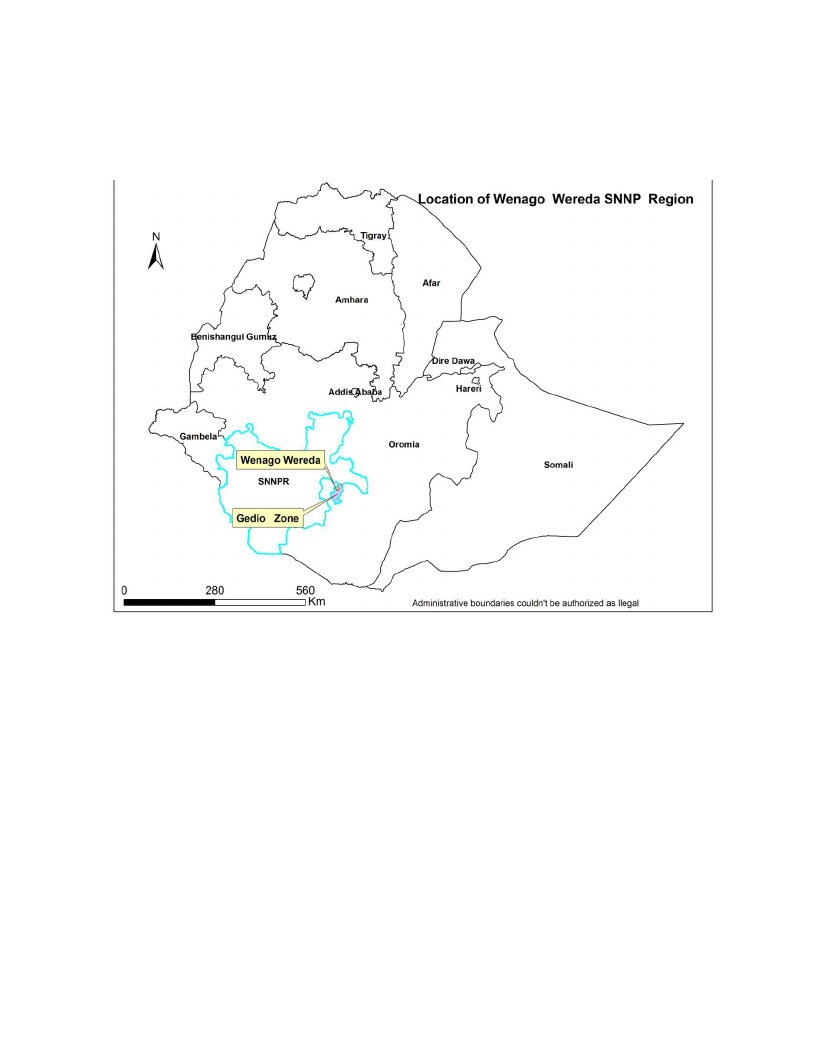
WEREDA LOCATON
METHODOLOGY
WDRP Content :
• Comprehensive information on disaster risk components
(Hazards, Vulnerability and Capacity)
• Multi-sectoral and multi-hazard information.
Research Approach:
• Mixed Approach
• Both quantitative and qualitative information
Data Sources:
• Primary Data:
Household Questionnaires: statistically significant number
(around 400 households).
Focus Groups Discussions: One per kebele
Key Informant Interviews: with major woreda level government
and non-government DRM actors
Problem Tree Analyses : to see the cause and effect of disasters
• Secondary Data:
collected relevant to WDRP indicators:
LIU, SERA Project, Risk baseline, other ministries…
Sampling Technique:
• Multistage cluster sampling
• Both Probability and Non-probability sampling
Methods of Analysis:
• Descriptive Statistics
• Textual Analysis
• Cispro and SPSS
• Automate WDRP software

WEREDA
SUMMARY DISASTER RISK PROFILE
INFORMATION
Wereda Disaster Risk Profiling Project: SNNP
Disaster Risk Profile: Wenago Wereda
SUMMARY OF WEREDA PROFILE
Crop pest and disease in particular Coffee Berry and
Bacterial Blight of coffee, Snow, Price Shock, Human
disease, and Drought are the major disaster in wenago
wereda. Besides, deforestation, soil erosion, water
pollution and land slide are also other major environmental
problems in the area.
Furthermore, in adequate provision of agricultural inputs
and extension services, poor access of veterinary services
and livestock drug, high population density, lack of
irrigation facilities, water logging and poor sanitation
facilities are some of the factors that contribute towards
household vulnerability in the area.
Enhancing provision of agricultural inputs (fertilizer,
improved varieties of seeds & pesticides) and extension
services, adequate access for veterinary services and
livestock drugs, developing soil and water conservation
measures, construction of draining system, provision of
medicine both for human and livestock and developing
irrigation schemes are some of the suggestion
interventions in the Wereda.
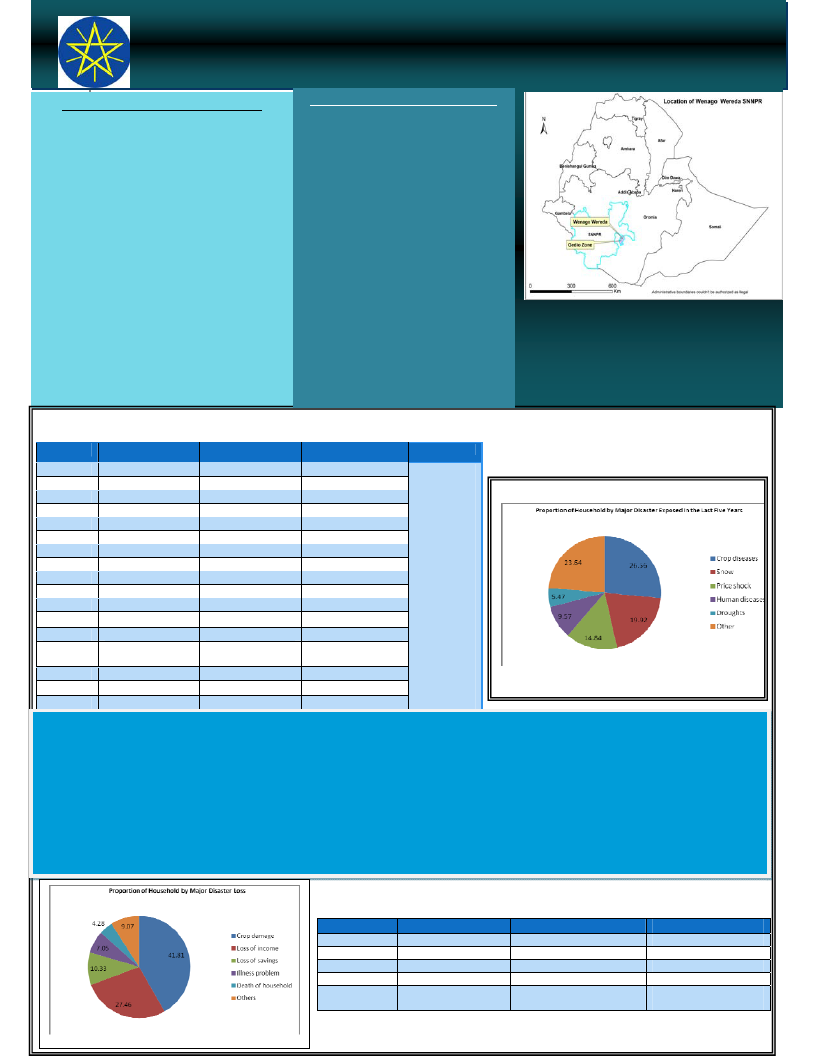
MAJOR DISASTERS REPORTED IN WEREDA
LIVELIHOOD ZONE SUMMARY
Sidama Maize Belt (SMB) Livelihood Zone
It is food insecure zone, and the main crop is maize,
planted in the belg rainy season, with shorter‐cycle crops
such as sweet potatoes grown in the summer. Enset is a
backstop but is not as important as elsewhere. Cattle
and goats are important to the better‐off.
Sidama‐Gedeo Highland Enset and Barley
(SHEB) Livelihood Zone
This hilly zone is known for its high quality enset
production. Rainfall is reliable, and the area is food
secure not only because of its perennial stock of enset in
the field, but because of reasonable livestock numbers ‐
even the poor are able to make 40% of their cash income
from livestock and butter sales. Vegetables are the main
cash crops.
Gedeo Coffee (GC) Livelihood Zone
This densely‐populated zone produces coffee famous for
its high quality, and wealthier households own coffee
bushes in thousands whilst poorer households have
hundreds, and in terms of cash income, this is the
wealthiest zone in the Region; but cash management by
farmers is often weak, and some still struggle to buy
food in the period before the green maize harvest. Food
production comes second to coffee production for all
groups; enset is the main locally‐produced staple.
Kebele
Disaster 1
Disaster 2
Disaster 3
LIU Info
Gelelicho
Dodoro
Tokicha
Mokonissa
Dobota
K/Sodit
H/Harro
Wotiko
B/Bukessa
T/Cherecha
Helemo
Sokicha
Kelecha
Sugale
Deko
B/Okoto
JemJemo
Coffee berry disease
Coffee berry disease
Coffee berry disease
Enset disease
Flood
Drought
Malaria
Coffee berry disease
Drought
Malaria
Human disease
Coffee berry disease
Wild animal attack
Coffee berry disease
Social conflict
Coffee berry disease
Measles
Flood
Coffee rust and welt
Coffee welt
Heavy snow
Crop disease
Coffee welt
Coffee welt
Flood
Coffee berry disease
Coffee berry disease
Coffee berry disease
Enset disease
Coffee berry disease
Enset disease
Crop disease
Enset disease
Coffee barley disease
Enset disease
Livestock disease
Enset disease
Coffee berry disease
Coffee berry disease
Coffee berry disease
Bacterial blight coffee
Enset disease
Bacterial blight coffee
Snow
Enset disease
Human disease
Human disease
Bacterial blight
coffee
Coffee barely disease
Human disease
Human disease
Chronic
Hazards:
SMB LZ:
Drought,
livestock
diseases and
malaria
SHEB LZ:
Wheat rust
&BBC in enset
GC LZ:
Hailstorm,
frost, CBD &
coffee wilt
disease,
fluctuation in
international
coffee prices
SHORT NARRATIVE ON MAJOR DISASTERS:
Crop pest and disease such as coffee berry (CB), bacterial blight of coffee (BBC), coffee rust and welt, enset disease , “Temch” and “wages” are the major
disaster caused by snow, lack of shed, poor management and shortage of rain affects crop production and productivity in particular coffee and enset
crops, reduction in quality of crop produced and hence exposed the community to economic hardship, hunger, loss of assets, loss of saving and migration
in the wereda. Besides, snow another major disaster is caused by environmental changes results in a reduction in coffee and other crops production,
destroy plants and crops, death of domestic & wild animals and shortage of food in the area. Inflation is also another disaster caused by shortage of crop
produced and reductions in value of grain create economic crises and make the life of the community very hard. Furthermore Human disease such as
Malaria, Acute Watery Disease, Meningitis and Measles are also another disaster caused by presence of stagnant water, sanitation problem, shortage of
pure drinking water and lack of awareness results in death and illness, prevalence of different water born disease and absence children from the schools in
the area. Livestock disease such as Lymphangitis, Trypanasomiasis, CBPP, Newcastle disease and Pasteurellosis are also another disaster which affects
livestock production and loss of assets in the wereda.
Disaster
Crop disease
Snow
Price shock
Human disease
Drought
EFFECT OF DISASTERS
Loss 1
Loss 2
Crop damage
Crop damage
Loss of income
Illness/health problem
Crop damage
Loss of income
Loss of income
Loss of savings
Death of household member
Loss of income
Loss 3
Loss of savings
Loss of savings
Illness/health problems
Loss of income
Lost access to water
source
Wereda Disaster Risk Profiling Programme: SNNP
Disaster Risk Profile: Wenago Wereda
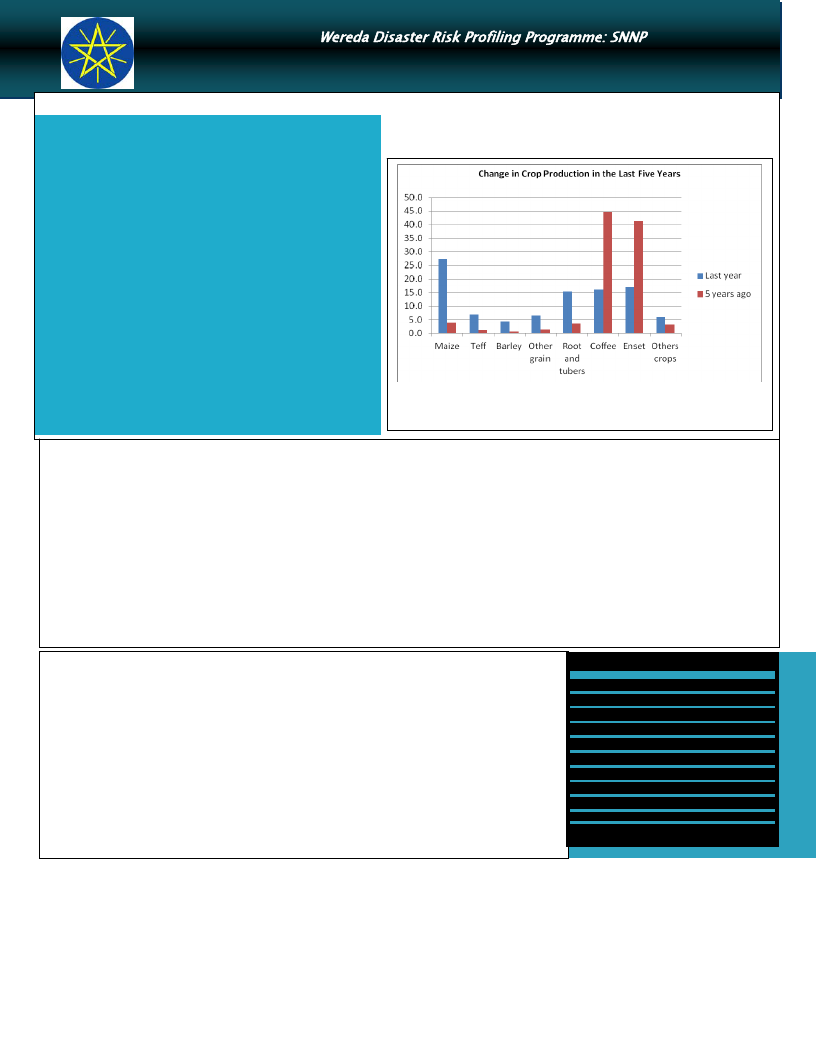
HOUSEHOLD AND COMMUNITY VULNERABILITY
VULNERABILITY
Crops such as Coffee, Enset and other cash crops are mainly grown in
the last five years. However due to sever coffee bearing disease, enset
bacterial welt diseases, high population density , shortage of farm land
and low soil fertility the community vulnerable to food shortage,
hunger and famine and hence shift to produced crops such as maize,
teff, barely and others grain to become food self sufficient in wereda.
Besides, in adequate access of agricultural inputs and extension
services, poor and very poor access of veterinary services and livestock
drug, lack of irrigation facilities, water logging, poor sanitation facilities,
deforestation and soil erosion are some of the factors that contribute
towards household vulnerability in the area.
Furthermore, weak resilient capacity of the community during hazard
or disaster is also another factor contribute to household vulnerability
in the area. For instance about 1/2 of the population did not recover
from the last disaster they faced and also it is impossible for about 2/3
of the population to raise 500 birr in a week in the event of hazard or
disaster risks.
Accessibility:
Access to Agricultural Inputs:‐ 82% of the household used natural or animals manure as a fertilizer, 82% of the household doesn’t used any types of
pesticides and only 8% of the household used improved varieties of seeds.
Access to Extension Services and Irrigation Facilities:‐ 38% of the household have received agricultural extension services and only 1.1 % of the
household have access to irrigation facilities.
Access to Veterinary Services and Livestock Drugs:‐ 57% of the household have got poor and very poor access to veterinary services and 59% of the
household have got poor and very poor access to livestock drug.
Access to Drinking Water:‐ 75% of the household drink water from covered well or borehole, open well, river stream, open pond or lake and fenced pond
or lake and also 89% of the household drink water without any treatment.
Access to Sanitation Service:‐ 90% of the household uses outdoor latrine or hole and also 7% of the household have no toile facilities.
Access to electricity: 37% of the household located in the community with electricity and 18% of the household have access with electricity connection.
Access to Road: ‐ 51% of the household have access paved, partly paved, gravel and dirt or difficult for car road which led to their houses and urban
centres and 49% of the household have no access road. For instance to reached the nearest paved road the household required on average 24minutes
and to the nearest urban centre it required on average 1 hour and 40 minutes.
Level of Awareness and Institutional Development
Literacy Rate: ‐ The literacy rate of the population is very poor. Only 3% of the population above 7 years old
can easily read and write. These populations categorized by level of education reported that 46% less than 1st
grade, 41% primary and 12% secondary school completed.
Community awareness about disaster risk management actors:‐ Good awareness exits. For instance during
disaster risk or hazard the community have got relevant training, agricultural inputs, vaccination and drugs,
“agober”, treatments and other supports form the respective government origination found in the wereda.
Community based organization:‐ Organization such as “Debo”, “Edir”, “Ekub”, cooperatives, credit and
saving association, women association and framers association which are informal and formal through which
community help each other during disaster risk and other social activities. The level of cooperation is good
compared with the last decade. Non government organization such Oxfam, R‐ Wash, WFP, UNICEF, Christian
child fund are actors which support the community in DRM activities in the wereda.
Info Bits:
Population
: 117,630 (2007)
Sex ratio
: 1010.01 F/1000 M
Urban Population : 9,196 (2007)
Mean Altitude
: 1961.50 m
Mean Slope
: 8.43 %
Measles caseload : 8 (2004-2009)
PLWHA on ART :
Under-five children eligible
for supplementary feeding:
Sources: Various Secondary Sources
COMMUNITY CAPACITY TO COPE
Major coping strategies:‐ Consumption rather than sale of crop surplus, Seek alternative or additional jobs and Reduced expenditure on non‐essential items
are the major coping strategies adopted by the household in the event of disaster risk or hazards.
In the event of more resource available:‐ 42% of the household choice storage of food and other necessities and also 36% of the household opted
adaptation of economic activities to hazards season as coping strategies during disaster risk.
Managed to recover from Losses:‐ 53% of the household have managed to recover from losses of disasters affected.
Access to Credit Facilities:‐ On the average 2.36 number of times households tried to get credit and 1.56 number of times households managed to get credit.
Community’s preparedness:‐ Saving money, soil and water conservation activities, using disease resistance crop varieties, clearing marsh and water logging
areas and daily labour to get additional income are some of the preparedness measures that the community take to minimize the negative effect of disaster
risk in the kebele.
Crop and livestock diversity: Crop such as coffee, enset and maize are grown and also livestock such as sheep, small number of cattle and poultry are
rearing in the wereda.
WDRP Indicators
Hazard Related Characteristics
1
Wereda Disaster
Risk Profile
Disaster Risk Management
and Food Security Sector (DRMFSS)
Data_Collected_Date
Tuesday, December 2, 2014
Region S.N.N.P
Zone
GEDEO
Wereda
WENAGO
Selected Indicator
Biological Hazards of the Wereda
Hazard_Name
Cause_Of_Hazard
Hazard_Sub_Type
Crop pest and disease
• Coffee Barley disease (CBD)
• Coffee rust and welt
• Enset disease, mill bag
• Crop pest/Wage/
• Bacterial blight coffee
(BBC)
• "Temeche "
Frost,
Snow,
Drought/'Tefa' bacteria/,
Climate Change,
Prevalence of Root warm and
Bacterial,
Shortage of rain,
Lack of shed,
Poor management,
Hazard_Sub_Type
Human diseases
• Malaria
• Meningitis
• Acute watery diarrhea
(AWD),
• “Hatete”
• Measles
Present stagnant water,
Lack of awareness,
Environmental Sanitation problem,
Shortage of pure drinking water,
Water pollution,
Hazard_Sub_Type
• Lymphangitis
• Trypanasomiasis
• CBPP
• Newcastle disease
• Pasteurellosis
Livestock disease
Snow,
Unseasonal rain fall,
Effects_Of_Hazard
Economic hard ship,
Hungry,
Shortage of money,
Shortage of food,
Reduction in coffee and others crops
production,
Loss assets,
Loss of income,
Damaged coffee and enset crops,
Reduction in quality of coffee,
Migration,
Exposed to food insecurity,
Loss of saving
Hungry,
Loss of assets,
Absence from school,
Death and illness,
Loss of income,
Famine,
Loss of assets,
Prevalence of different water born
disease
Shortage of livestock feed,
Loss of assets
Page 1 of 1
2

Wereda Disaster
Risk Profile
Disaster Risk Management
and Food Security Sector (DRMFSS)
Data_Collected_Date
Tuesday, December 2, 2014
Region S.N.N.P
Zone
GEDEO
Wereda
WENAGO
Selected Indicator
Geological Hazards of the Wereda
Hazard_Name
Hazard_Sub_Type
• Land slide
Cause_Of_Hazard
Geological Hazards
High rain fall,
Topography of the area,
Land scope
Effects_Of_Hazard
Crop damage/especially coffee/
Page 1 of 1
3
Wereda Disaster
Risk Profile
Disaster Risk Management
and Food Security Sector (DRMFSS)
Data_Collected_Date
Tuesday, December 2, 2014
Region S.N.N.P
Zone
GEDEO
Wereda
WENAGO
Selected Indicator
Hydro Metrological Hazards of the Wereda
Hazard_Name
Hazard_Sub_Type
Drought
Flood
Cause_Of_Hazard
Hydro-Meteorological Hazards
Decrease Forest ,
No afforestation ,
Climate Change,
Deforestation
Heavy rain,
Sloppy of the area,
Deforestation,
Population density,
Snow
Environmental change,
Effects_Of_Hazard
Damaged crops,
Reduction in crop production,
Shortage of food,
shortage of pure water,
Economic hardship
Damage crop,
Reduction in crop production,
Soil erosion,
Reduction in soil fertility,
Destroy plants & crops
Shortage of food,
Migration
Reduction in crop production,
Destroy plants & crops,
Hunger,
Economic hardship,
Shortage of food,
Damage of coffee and other crop ,
Loss of income,
Famine,
Death of domestic and wild animals
Page 1 of 1
4

Wereda Disaster
Risk Profile
Disaster Risk Management
and Food Security Sector (DRMFSS)
Data_Collected_Date
Tuesday, December 2, 2014
Region S.N.N.P
Zone
GEDEO
Wereda
WENAGO
Selected Indicator
Socio Economic Hazards of the Wereda
Hazard_Name
Hazard_Sub_Type
Inflation
Conflict
Cause_Of_Hazard
Social Hazards
Shortage crop production,
Blow price,
Social land and border conflict,
Wild animals attack
The number of wild animal increased
(ape),
Effects_Of_Hazard
Economic crises,
Life problem,
Burning houses and properties,
Burning crops,
Death,
Domestic animals attacks by wild
animals
Crop damage,
Poverty,
Shortage of food
Page 1 of 1
5

Wereda Disaster
Risk Profile
Disaster Risk Management
and Food Security Sector (DRMFSS)
Data_Collected_Date
Tuesday, December 2, 2014
Region S.N.N.P
Zone
GEDEO
Wereda
WENAGO
Selected Indicator
Technological Hazards of the Wereda
Hazard_Name
Cause_Of_Hazard
Hazard_Sub_Type
technological hazard
No technological hazard has
been reported in the area
Effects_Of_Hazard
Page 1 of 1
6

Wereda Disaster
Risk Profile
Data_Collected_Date
Region S.N.N.P
Zone GEDEO
Selected Indictor: Disaster Characteristics By Kebele
Kebele Name
Disaster_Type
Common Period
Year Occured
BELE BUKISA
Droughts
May to August
2000
CBD
February
2000
-September
Bacterial Blight
coffee
June - July
2004
Disaster Risk Management
and Food Security Sector (DRMFSS)
Tuesday, December 2, 2014
Wereda WENAGO
Worst_Year
Trends of
Effects
2000
Increased
2003
Increased
2004
Increased
Root Causes
Climatically
change,
shortage of
rain
Loss of
coffee
production
Bacterial
belt
transmit
form
affected
coffee to
another by
men
Effects
Vulnerability
Decrease
crop
productio
n,
shortage
of food,
economic
hardship
Loss of
income,
economic
hardship
Loss of
coffee
productio
n, loss
income,
economic
hardship
Food
problem, no
help or aid
from other
Economic
problem,
lack of
income to
buy food
and crop
Shortage of
income to by
food
Coping
Strategy
Selling fire
wood, daily
labour
Selling
livestock,
selling
sheep and
fire food
Working
daily labour
7
Page 1 of 22

Wereda Disaster
Risk Profile
Data_Collected_Date
Region S.N.N.P
Zone GEDEO
Selected Indictor: Disaster Characteristics By Kebele
Kebele Name
Disaster_Type
Common Period
Year Occured
BELE BUKISA
Shortage of Food
May to August
2000
BANKO OKOTO
Coffee & Barley
Diseases
May
-September
1968-now
Enset diseases
February,
September
1997 now
Disaster Risk Management
and Food Security Sector (DRMFSS)
Tuesday, December 2, 2014
Wereda WENAGO
Worst_Year
2003
Trends of
Effects
Increased
2001
Increased
2001
Increased
Root Causes Effects
Vulnerability
Climatically
change,
shortage of
rain, loss of
crop
production
Snow
Loss of
income
Economic
problem,
Lack of aid
from others
Coffee
damage ,
income
decrease,
exposed
to food
insecurity
Damage
Enset
crop,
income
decrease,
food,
insecurity
exposed
to
different
disease
No access to
improved
seed, lack
of
treatment,
no rapid
response
from
government
on time
Lack of
treatment,
no access to
improved
seed, no
rapid
response
from
government
on time
8
Coping
Strategy
Selling
sheep and
fire wood,
daily labour
Daily labour
, migration
to find
better job ,
selling fire
wood
Selling
their own
livestock,
selling
forest tree
for fire
wood
Page 2 of 22
Wereda Disaster
Risk Profile
Data_Collected_Date
Region S.N.N.P
Zone GEDEO
Selected Indictor: Disaster Characteristics By Kebele
Kebele Name
Disaster_Type
Common Period
Year Occured
BANKO OKOTO
Human diseases
July - October
1999
Maningites
February -April
1981
Water Pollution
April - October
1999-now
Disaster Risk Management
and Food Security Sector (DRMFSS)
Tuesday, December 2, 2014
Wereda WENAGO
Worst_Year
Trends of
Effects
1999
Decreased
1981
Decreased
1999
Decreased
Root Causes Effects
Vulnerability
Water
pollution,
poor
environment
al
sanitation,
use outdoor
latrine
Death,
income
decrease,
illness,
health
problem
Death of
house
member
Use latrine
in outdoors,
lack of
awareness
about
personal
and
environment
al
sanitation,
poor waste
disposal
system
Un known
Used
lantern in
outdoor, un
covered, lake
/ pond, lack
of water
treatment /
Exposed
to
different
water
born
disease
open
access of
water, pond
/ take ,
lack of clean
drinking
water
Coping
Strategy
Help each
other by
contributio
n money,
provide
food (
kocho)
Take the
patient to
the
hospital,
pray, help
each other
Take the
patients to
health
centre,
support by
food
9
Page 3 of 22

Wereda Disaster
Risk Profile
Data_Collected_Date
Region S.N.N.P
Zone GEDEO
Selected Indictor: Disaster Characteristics By Kebele
Kebele Name
Disaster_Type
Common Period
Year Occured
DEKO
Conflicts
January
-September
1987
Crop diseases
May - June
1970
Coffee & Barley
Diseases
June,
September
1972-now
Disaster Risk Management
and Food Security Sector (DRMFSS)
Tuesday, December 2, 2014
Wereda WENAGO
Worst_Year
Trends of
Effects
1987
Decreased
1970
Decreased
1972
Decreased
Root Causes Effects
Vulnerability
Social land
and border
conflict
Lack of rain
Cold,
decreased
shade trees
Burning
house and
crop ,
death,
domestic
animals
attacks
by wild
animals
Loss of
crop, loss
of
income,
famine
Loss of
coffee
productio
n, food
insecurity
Political
conflict ,
interest of
authority ,
lack of
awareness,
un
agreement
of political
leaders
Insufficient
response
from
government,
problems of
information
communicati
on
Coping
Strategy
Problem
solved by
local elders
& religious
leaders
There is no
any activity
for
prevention
& control
Selling
Enset /
kocho ) to
recover
household
consumptio
n, daily
labour
10
Page 4 of 22

Wereda Disaster
Risk Profile
Data_Collected_Date
Region S.N.N.P
Zone GEDEO
Selected Indictor: Disaster Characteristics By Kebele
Kebele Name
Disaster_Type
Common Period
Year Occured
DEKO
Malaria
May
-September
2000-now
Acute water
born diseases
February- June
1999
DABOTA
Floods
April ,
September,
1993
Disaster Risk Management
and Food Security Sector (DRMFSS)
Tuesday, December 2, 2014
Wereda WENAGO
Worst_Year
Trends of
Effects
2000
Decreased
2000
Decreased
2003
Increased
Root Causes Effects
Vulnerability
Water
logging area
Death ,
illness,
loss of
income
No use
agober, lack
of
awareness,
un removed
water
logging area
No access of
pure drinking
water, no
facilities of
latrine (
open space )
Deforestation
, pollution
density
Death ,
loss of
income,p
ay for
health
care
Shortage
of food,
migration
Poor
environment
al
sanitation,
poor disposal
system , lack
of clean
drinking
water
Do not make
enough
trace, do
not have
enough plant
planted,
Poor tree
management
Coping
Strategy
Take
patients to
health
centre,
help each
other by
supply food
, money
Help each
other, use
outdoor
latrine
Selling
wood,
exchange of
different
kind of
materials,
daily labour
11
Page 5 of 22

Wereda Disaster
Risk Profile
Data_Collected_Date
Region S.N.N.P
Zone GEDEO
Selected Indictor: Disaster Characteristics By Kebele
Kebele Name
Disaster_Type
Common Period
Year Occured
DABOTA
Crop Pest
November,
April
1981
CBD
May -August
1989
Snow
April - June
2001
Droughts
February,
March
2002
Disaster Risk Management
and Food Security Sector (DRMFSS)
Tuesday, December 2, 2014
Wereda WENAGO
Worst_Year
2002
Trends of
Effects
Increased
2003
Increased
Root Causes Effects
Vulnerability
Cultivate un
necessary
grass
Heavy rain
Populatio
n density,
shortage
of food
Economic
hardship,
loss of
money
Not destroy
the mole in
group
Not planted
another
plant
2004
Increased
Decrease
crop
productio
n,
shortage
of food
Cut big
tree, not
saving
2003
Increased
Decrease
forest, no
afforestation
Do not
collect
water, do
not save the
product
Coping
Strategy
Using
compost,
burning
disease
attack
coffee
Sowing
short period
crops,
exchange
assets by
different
materials,
& different
food
Selling
assets &
buy another
materials
12
Page 6 of 22

Wereda Disaster
Risk Profile
Data_Collected_Date
Region S.N.N.P
Zone GEDEO
Selected Indictor: Disaster Characteristics By Kebele
Kebele Name
Disaster_Type
Common Period
Year Occured
DODORO
CBD
July -August
2003
Coffee disease
January - June
2001
Enset diseases
March to
August
2000
Disaster Risk Management
and Food Security Sector (DRMFSS)
Tuesday, December 2, 2014
Wereda WENAGO
Worst_Year
Decrease
crop produ
Trends of
Effects
Increased
Root Causes
Climatic
change
Effects
Vulnerability
Decrease
crop
productio
n
Decrease
crop
production
2004
2004
Increased
Increased
Root warm
disease,
Bacterial
Snow,
seasonal
rain fall
problem
Shortage
of food,
shortage
of money
Shortage
of food ,
shortage
of money
Not using
short
matured
crops, not
using
compost to
destroy the
disease
To planted,
a cope of
plant , to
planted,
shorter
period, time
Coping
Strategy
To Advice
a
professional
man & to
planted
spatiality
coffee,
fired
disease
coffee
Not using
short
matured
crops, not
using
compost
to destroy
the disease
13
Page 7 of 22

Wereda Disaster
Risk Profile
Data_Collected_Date
Region S.N.N.P
Zone GEDEO
Selected Indictor: Disaster Characteristics By Kebele
Kebele Name
Disaster_Type
Common Period
Year Occured
GASELCHO
CBD
July
-September
1998
Heavy rain
January,
September
1996
Enset diseases
January,
Augusts
1987
Crop Pest
August,
September
1996
Disaster Risk Management
and Food Security Sector (DRMFSS)
Tuesday, December 2, 2014
Wereda WENAGO
Worst_Year
2003
Trends of
Effects
Increased
2003
Increased
2001
Increased
2001
Increased
14
Root Causes Effects
Vulnerability
Frost, snow
Economic
hardship,
hunger,
lack of
money
Do not
planted
specialty
coffee, lack
of awareness
Sloppy area,
deforestation
Snow, frost,
drought
'Tefa'
bacteria
Decrease
crop
productio
n,
decrease
soil &
fertility
Decrease
Food,
Hungry
Do not
make trace,
do not
planted
enough plant
Use disease
affected
enset as
food
Snow, heavy
coldness
seasonal
problem
Decrease
crop
productio
n,
economic
hardship
Not sowing
selected
seed instead
of that crop
not sowing
another
crops
Coping
Strategy
Sell the
assets to
buy
another
crop & food
labour, find
other job
opportunity
Daily
labour,
sowing as
short period
of crops
Page 8 of 22
Wereda Disaster
Risk Profile
Data_Collected_Date
Region S.N.N.P
Zone GEDEO
Selected Indictor: Disaster Characteristics By Kebele
Kebele Name
Disaster_Type
Common Period
Year Occured
GASELCHO
Snow
April,
September
2000
HASEHARO
Climate change
Saving other
crops
2001
Human diseases
July, November
2003
Coffee disease
February,
September
2003
Disaster Risk Management
and Food Security Sector (DRMFSS)
Tuesday, December 2, 2014
Wereda WENAGO
Worst_Year
Trends of
Effects
2003
Increased
2003
Increased
2003
Increased
2004
Increased
Root Causes Effects
Vulnerability
Unknown
Deforestation
Lack of
water, lack
of awareness
Have " tefa "
coffee
diseases (
warm )
Decrease
crop
productio
n, destroy
the
planting
& crops
Decrease
crop
productio
n,
economic
hardship
Hunger,
loss of
income,
absence
from
school
Economic
hardship
Lack of
awareness
Deforestatio
n
Destroy
collected
water, do
not use
agrober to
protection
of malaria
Not burning
disease
affected
coffee
Coping
Strategy
Saving
other crops
Selling
household
asset, daily
labour
Little beat
awareness
Planted
Enset &
collected
mature
plant
15
Page 9 of 22

Wereda Disaster
Risk Profile
Data_Collected_Date
Region S.N.N.P
Zone GEDEO
Selected Indictor: Disaster Characteristics By Kebele
Kebele Name
Disaster_Type
Common Period
Year Occured
HASEHARO
Bacterial Blight
coffee
July , August
2004
HALEMO
Human diseases
November,
December
January
1981-1982,
CBD
May, November
1970-now
Disaster Risk Management
and Food Security Sector (DRMFSS)
Tuesday, December 2, 2014
Wereda WENAGO
Worst_Year
2004
Trends of
Effects
Decreased
1981
Decreased
1983
Decreased
Root Causes Effects
Vulnerability
Poor crop
management
, heavy cold
to decrease
shadow tree
Lack of
personal and
environment
al sanitation
Economic
hardship
Death ,
illness,
increase
pay for
health
case
Damage
coffee
crop, loss
of
income,
exposed
to
poverty
Do not
decrease
shadow tree,
do not
enough
management
,
Distance
from health
centre, lack
of adequate
medicine,
no access of
transport to
take
patients to
health
centre
No access of
medicine,
lack of
improve &
disease
resistance
Coping
Strategy
Cutting out
disease
affected
coffee
Take
patients to
health
centre,
provide 1st
aid by loud
speaking,
help each
other by
food
Planning
other crop,
daily
labour,
selling by
baboon
16
Page 10 of 22
Wereda Disaster
Risk Profile
Data_Collected_Date
Region S.N.N.P
Zone GEDEO
Selected Indictor: Disaster Characteristics By Kebele
Kebele Name
Disaster_Type
Common Period
Year Occured
HALEMO
Enset diseases
Throughout the
year
1964-now
Heavy Rain
October, June,
August
1981-2003,2
000
JEMJEMO
Human diseases
January
1963-now
Disaster Risk Management
and Food Security Sector (DRMFSS)
Tuesday, December 2, 2014
Wereda WENAGO
Worst_Year
Trends of
Effects
1998
Decreased
2003
Decreased
1963
Decreased
Root Causes
Lack of
sanitation
Effects
Vulnerability
Damage
of Enset
crop, loss
of
income,
famine
No access of
medicine
for
prevention
& control
disease
Destroy
coffee,
Enset,
vegetable
, death of
domestic
and wild
animals
Eye and
face
problem
Lack of
personal
hygiene,
lack of
awareness
Coping
Strategy
Daily
labour,
migration,
money
borrowed
from money
lender,
eaten the
rest Enset
product
Selling
cow and
sheep buy
food ,
migration,
daily
labour,
selling fire
wood
Boil
sorghum
then drink
and wash
17
Page 11 of 22

Wereda Disaster
Risk Profile
Data_Collected_Date
Region S.N.N.P
Zone GEDEO
Selected Indictor: Disaster Characteristics By Kebele
Kebele Name
Disaster_Type
Common Period
Year Occured
JEMJEMO
Sula
July
1963
Gogosa
January-
February
Coffee & Barley
May
Diseases
1965
1968
Acute water
born diseases
July -October
1999
Disaster Risk Management
and Food Security Sector (DRMFSS)
Tuesday, December 2, 2014
Wereda WENAGO
Worst_Year
1963
Trends of
Effects
Decreased
1965
Decreased
1968
Decreased
1999
Decreased
Root Causes Effects
Vulnerability
Lack of
adequate
food, large
family size
Poor
environment
al
sanitation,
poor waste
disposal
Infant
death,
illness
Illness,
death of
household
members
Loss of
saving,
loss of
income,
loss of
coffee
quality
Death of
household
member,
diarrhea,
illness
Lack of
adequate
food, lack of
awareness,
lack of
balanced,
diet
Climate
change
Not use
outdoor
latrine, lack
of clear
drinking
water
Coping
Strategy
Take
indigenous
medicine/
leafs/
Pray
Pray as
keytala by
local
elders
Take
patients to
health
centre
18
Page 12 of 22
Wereda Disaster
Risk Profile
Data_Collected_Date
Region S.N.N.P
Zone GEDEO
Selected Indictor: Disaster Characteristics By Kebele
Kebele Name
Disaster_Type
Common Period
Year Occured
KERA SODITY
Droughts
January , April
2000
Coffee & Barley
Diseases
January to
march
1999
Enset diseases
February to
March
1998
Bacterial Blight
coffee
June up to July
2004
Disaster Risk Management
and Food Security Sector (DRMFSS)
Tuesday, December 2, 2014
Wereda WENAGO
Worst_Year
2003
Trends of
Effects
Decreased
2003
Decreased
2001
Decreased
2004
Decreased
Root Causes Effects
Vulnerability
Climatic
change
Climatic
change
Heavy
drought
Heavy rain
fall & over
shading
Shortage
of crop
productio
n,
shortage
of food,
shortage
of pure
water
Economic
hardship,
loss of
crop
productio
n
Have not
enough
food,
economic
hardship
Loss of
crop
productio
n,
economic
hardship
No sowing a
short period
of crop like
haricot
been
Not burning
the affected
coffee
Not planted
disease
resistance
Enset crop
Un minimize
shade
Coping
Strategy
Selling
fired wood,
selling,
livestock
Planted
disease
resistance
coffee ,
Saving
Selling fire
wood to
buy food
Cutting
infected
crop &
burnning
19
Page 13 of 22

Wereda Disaster
Risk Profile
Data_Collected_Date
Region S.N.N.P
Zone GEDEO
Selected Indictor: Disaster Characteristics By Kebele
Kebele Name
Disaster_Type
Common Period
Year Occured
KELECHA
Wild Animals
Attack
Throughout the
year
1980-now
CBD
July
1962
-September
Human diseases
February,
March
1999-2001
Disaster Risk Management
and Food Security Sector (DRMFSS)
Tuesday, December 2, 2014
Wereda WENAGO
Worst_Year
Trends of
Effects
2000- Now Increased
2003-2004
Increased
1999
Increased
Root Causes
The number
of wild
animal
increased
(ape )
Lack of
satiation
Effects
Vulnerability
Destroy
all crop,
poverty,
food
Government
cannot take
immediate
measure
Exposed
to
famine,
migration
,
economic
hardship
Death of
household
member,
illness,
loss of
income
Government
cannot take
immediate
measure,
cannot use
disease
resistant
crop
Distance of
health
centre,
problem of
transport, no
access of
medicine
Coping
Strategy
Few
farmers are
sell their
farm most
farmers are
nothing to
do
By inter
cropping
other plant,
daily
labour,
selling fire
wood
Take the
sicker
people to
health
centre,
contributin
g food by
together
20
Page 14 of 22

Wereda Disaster
Risk Profile
Data_Collected_Date
Region S.N.N.P
Zone GEDEO
Selected Indictor: Disaster Characteristics By Kebele
Kebele Name
Disaster_Type
Common Period
Year Occured
KELECHA
Landslides
July
2000-now
MEKONISA
Enset diseases
January ,march
1967
Snow
April
2000
CBD
May -August
1990
Disaster Risk Management
and Food Security Sector (DRMFSS)
Tuesday, December 2, 2014
Wereda WENAGO
Worst_Year
200
Trends of
Effects
Increased
2003
Increased
2004
Increased
2004
Increased
Root Causes Effects
Vulnerability
High rain
fall,
geographical
land scope
Present of
worm in the
area of rain
shortage
Destroy
crops
especially
coffee
Hunger
Geographical
land scope,
not doing
soil and
water
conservation
activities
Do not use
composts
Climatic
change
Economic
hardship,
destroy
crop
produced
Economic
hardship
Not saving ,
no re
plantation in
place of
affected
crops
Do not
planted
specialty
coffee
Coping
Strategy
Migration,
daily
labour, sell
fire wood
Sowing
disease
resistance
Enset,
Using ash in
that area
To help
each other
or daily
labour
Heated that
disease
coffee,
instead of
that
planted
other Enset
21
Page 15 of 22

Wereda Disaster
Risk Profile
Data_Collected_Date
Region S.N.N.P
Zone GEDEO
Selected Indictor: Disaster Characteristics By Kebele
Kebele Name
Disaster_Type
Common Period
Year Occured
MEKONISA
Crop diseases
April, June
2003
SOKICHA
Human diseases
February,
September
2000
Coffee & Barley
Diseases
June
-September
1967-now
Disaster Risk Management
and Food Security Sector (DRMFSS)
Tuesday, December 2, 2014
Wereda WENAGO
Worst_Year
Trends of
Effects
2003
Increased
2002
Increased
1970
Increased
Root Causes
Climatic
change
Heavy rain
& dust
Effects
Vulnerability
Shortage
of money,
exposed
to daily
labour
Damage
coffee
and
fruit, loss
of
income,
Famine ,
loss of
coffee
quality
Dependency,
not sowing
short
matured
crops
Have not
sanitation
at a village ,
no personal
sanitation
No access to
medicine
from
government
Coping
Strategy
Planted
specially
coffee ,
heated that
disease
coffee
To go to
health
centre,
advice
professional
Helping
each other
by money
and other
means,
daily labour
22
Page 16 of 22

Wereda Disaster
Risk Profile
Data_Collected_Date
Region S.N.N.P
Zone GEDEO
Selected Indictor: Disaster Characteristics By Kebele
Kebele Name
Disaster_Type
Common Period
Year Occured
SOKICHA
Enset diseases
March
September
1962-now
Human diseases
February
-March
1982-1983,1
999
Bacterial Blight
coffee
June -August
Disaster Risk Management
and Food Security Sector (DRMFSS)
Tuesday, December 2, 2014
Wereda WENAGO
Worst_Year
1998-1999
Trends of
Effects
Increased
1982
Increased
2004
Increased
23
Root Causes
Lack of
illness , loss
of income,
famine
Effects
Vulnerability
Damage
crop, loss
of
income,
famine
There is no
medicine
available in
the Kebele
Death,
illness,
loss of
income,
famine
Loss of
crop
productio
n, dried
leaf and
fruit
Far distance
from near
health
centre,
economical
problem,
transport
problem,
lack of
awareness,
distance
from wereda
health
centre
Lack of farm
management
Coping
Strategy
Daily
labour, to
use same
product
from
infected
plant
Help each
other by
food,
money &
transport
the affect
people to
health
centre,
Plant short
seasonal
plant
Page 17 of 22

Wereda Disaster
Risk Profile
Data_Collected_Date
Region S.N.N.P
Zone GEDEO
Selected Indictor: Disaster Characteristics By Kebele
Kebele Name
Disaster_Type
Common Period
Year Occured
SUGALE
Coffee & Barley
Diseases
June, July,
August
1962-now
Enset diseases
March
1962-now
Coffee disease
and paper
Frequently
occur
2001
Disaster Risk Management
and Food Security Sector (DRMFSS)
Tuesday, December 2, 2014
Wereda WENAGO
Worst_Year
Trends of
Effects
2002
Increased
Root Causes
Effects
Vulnerability
Coffee
damage,
loss of
income,
loss of
coffee
quality
Lack of
awareness
Every year Increased
Every year Increased
Enset
crop
damage,
loss of
income,
food
shortage,
food
insecurity
Coffee
damage,
loss of
coffee
quality,
loss of
income
Lack of
treatment
24
Coping
Strategy
Daily
labour,
selling
livestock
and
livestock
product,
selling fire
wood
Daily
labour,
carpenter,
selling teje,
eggs
Agricultural
labour,
selling
fruits,
selling
fruit juce,
selling
enset (
kocho )
Page 18 of 22
Wereda Disaster
Risk Profile
Data_Collected_Date
Region S.N.N.P
Zone GEDEO
Selected Indictor: Disaster Characteristics By Kebele
Kebele Name
Disaster_Type
Common Period
Year Occured
SUGALE
Bacterial Blight
coffee
March - July
2004
TOKOCHA
CBD
April
1997
September
Coffee & Barley
Diseases
January ,march
1991
Enset diseases
February,
September
1990
Disaster Risk Management
and Food Security Sector (DRMFSS)
Tuesday, December 2, 2014
Wereda WENAGO
Worst_Year
Trends of
Effects
2004
Increased
2003
Increased
2003
Increased
2003
Increased
Root Causes Effects
Vulnerability
Loss of
income,
decrease
crop
productio
n and
quality
Lack of
shade tree,
moisture,
lack of farm
management
Heavy rain
Economic
hardship,
loss of
money
Unknown
name of
warm "tefa "
Economic
hardship,
loss of
money
Do not
destroy
disease
affected
coffee
Unknown
name of
warm
Hunger,
shortage
of Food
Do not
enough
management
Coping
Strategy
Using of
resistance
variety,
burning
and
cleaning
affected
crop
Burning
disease
affected
coffee
plant
Replanting
speciality
coffee in
place of
disease
affected
coffee
Replanting
another
crop in
place of the
affected
crop
25
Page 19 of 22

Wereda Disaster
Risk Profile
Data_Collected_Date
Region S.N.N.P
Zone GEDEO
Selected Indictor: Disaster Characteristics By Kebele
Kebele Name
Disaster_Type
Common Period
Year Occured
TOKOCHA
Snow
February,
September
2003
TUMATA
CHRECHA
Floods
Malaria
April
September
2003
March- June
1990-2003
Disaster Risk Management
and Food Security Sector (DRMFSS)
Tuesday, December 2, 2014
Wereda WENAGO
Worst_Year
Trends of
Effects
2004
Increased
Root Causes
Effects
Vulnerability
Destroy
crop &
other
plant
hunger
Not saving
crop
produced,
not
preparednes
s
2004
1990
Increased
Decreased
Heavy rain
Lack of
environment
al
sanitation
Destroy
crop
other
plant
Illness,
death ,
physical
and
mental
effect ,
loss of
income,
famine
Not planted
necessary
plant
Economic
problem,
lack of
awareness,
lack of
accessible
health
centre
Coping
Strategy
Were not
another,
choice ,
for saving
a short,
period of
crop do not
have,
another,
place
Making
trace ,
making
bridges
The
community
help each
other,
transport
the sicker
people to
health
centre and
food aid
26
Page 20 of 22

Wereda Disaster
Risk Profile
Data_Collected_Date
Region S.N.N.P
Zone GEDEO
Selected Indictor: Disaster Characteristics By Kebele
Kebele Name
Disaster_Type
Common Period
Year Occured
TUMATA
CHRECHA
Coffee & Barley
Diseases
April -July
1951-now
Snow
September -
April
1988-2004
WETIKO
CBD
May to
2000
September
Heavy rain
April
2000
Coffee disease
June - July
2000
Disaster Risk Management
and Food Security Sector (DRMFSS)
Tuesday, December 2, 2014
Wereda WENAGO
Worst_Year
1975
Trends of
Effects
Decreased
1988
Decreased
2002
Decreased
2000
Decreased
2004
Increased
27
Root Causes Effects
Vulnerability
Environment
al change
Cold, heavy
rain season
Deforestation
, cutting of
trees
Damage
of coffee
and
barley,
loss of
income,
famine
Damage
of coffee
and other
crop, loss
of income
, famine
Loss of
crop
productio
n & loss
of income
Loss of
crop
productio
n
Lack of
accessible
treatment
and
chemical in
wereda
Lack of
saved
money, lack
of stored
products
2002
Lack of soil
management
Using knife
for all coffee
Loss of
coffee
productio
n
Not burning
infected
coffee
Coping
Strategy
By inter
cropping
other plant,
selling fire
wood, daily
labour
Substitute
by other
crop, daily
labour,
saving fire
wood
Selling
sheep, hen
and wood,
daily
labourer
Doing cut
off drain
and soil
managemen
t
Planting
other crop
inset
Page 21 of 22
Wereda Disaster
Risk Profile
Disaster Risk Management
and Food Security Sector (DRMFSS)
Data_Collected_Date
Tuesday, December 2, 2014
Region S.N.N.P
Zone GEDEO
Wereda WENAGO
Selected Indictor: Disaster Characteristics By Kebele
Kebele Name
Disaster_Type
Common Period
Year Occured Worst_Year
Trends of
Effects
Root Causes
Effects
Vulnerability
Coping
Strategy
WETIKO
Enset diseases
July to
November
2000
2004
Increased
Inflation
March
2000
2004
Increased
IMPORTANT: The years and months mentoned in this report are according to Ethiopian Calendar (EC).
Transition
disease when
cutting
coffee using
knife
Shortage
crop
production,
low price
Food
shortage,
Famine
Economic
crises
Problem of
food Famine
Unable to
buy food and
crop
Selling fire
wood,
sowing
short
period
crop
Daily
labour,
migration
to urban
gold
mining
area
28
Page 22 of 22
Wereda Disaster
Risk Profile
Data_Collected_Date
Region S.N.N.P
Zone GEDEO
Selected Indictor: Hazards: Conflict as an Issue
KebeleName
GASELCHO
DODORO
Description_Of_Conflict
No
No
TOKOCHA
No
MEKONISA
No
DABOTA
KERA SODITY
HASEHARO
WETIKO
BELE BUKISA
TUMATA CHRECHA
HALEMO
SOKICHA
KELECHA
SUGALE
DEKO
BANKO OKOTO
No
No
No
No
No
No
No
No
No
Nothing
Nothing
Nothing
Disaster Risk Management
and Food Security Sector
Tuesday, December 2, 2014
Wereda WENAGO
Change_In_Last_Decade
No
No
No
No
No
No
No
No
No
No
No
Main_Causes_Of_Conflict
No
No
No
No
No
No
No
No
No
No
No
No
No
29
Page 1 of 2

Wereda Disaster
Risk Profile
Data_Collected_Date
Region S.N.N.P
Zone GEDEO
Selected Indictor: Hazards: Conflict as an Issue
KebeleName
JEMJEMO
Description_Of_Conflict
No
Disaster Risk Management
and Food Security Sector
Tuesday, December 2, 2014
Wereda WENAGO
Change_In_Last_Decade
Main_Causes_Of_Conflict
30
Page 2 of 2
Wereda Disaster
Risk Profile
Disaster Risk Management
and Food Security Sector (DRMFSS)
Data_Collected_Date
Tuesday, December 2, 2014
Region S.N.N.P
Zone
GEDEO
Wereda
WENAGO
Selected Indicator: Hazard Situation During Last Disaster - Characteristics of most recent disasters that affected the community
KebeleName
Types of Disasters
Hazard_Description
Effect_Of_Disaster
Most_Severly_Affected
Reason
GASELCHO
BBC
DODORO
BBC
TOKOCHA
BBC
MEKONISA
BBC
DABOTA
BBC
KERA SODITY
BBC
HASEHARO
BBC
2:15 Hectare
1.5 hector
1.15 hector
1.15 hector
1.05 hector
1.5 hector
3.15 hector
2:15 Hectare
All the people
Economic hardship,
shortage of food
The whole community
Economic hardship
The whole community
Economic hardship
All the community
Economic hardship
Whole people
Economic hardship ,
food shortage
Economic hardship
31
Elders, pregnant
women, children
The whole people,
Because coffee is
back bone of the
people
The source of
income at the
wereda, the people
depend up on
coffee & Enset
Because of coffee
is the back bone
the committee the
big believe of
economy is coffee
at this wereda
Because coffee is
the back bore of
the community
Coffee is the back
bone of the
community , not
another choice
more
There are weak to
work
Because the basic
source of income
Page 1 of 3

Wereda Disaster
Risk Profile
Disaster Risk Management
and Food Security Sector (DRMFSS)
Data_Collected_Date
Tuesday, December 2, 2014
Region S.N.N.P
Zone
GEDEO
Wereda
WENAGO
Selected Indicator: Hazard Situation During Last Disaster - Characteristics of most recent disasters that affected the community
KebeleName
Types of Disasters
Hazard_Description
Effect_Of_Disaster
Most_Severly_Affected
Reason
WETIKO
CBD/ coffee berry
disease/, cold rain
BELE BUKISA
Shortage of rain /
CBD /, climatically
change
TUMATA CHRECHA
Snow
HALEMO
heavy rain ( snow )
6 months- April to September
May -September
500-600 peoples (150 hatate, March ,
April/ 2004
680 heater, coffee, and Enset are
destroyed, June 25-26-2003
Loss of coffee
production, shortage
of food, famine, loss
of assets and income
Enset and all
community children old
Food shortage ,
migration to find
job opportunity
Destroy the crop (
coffee , Enset ),
decrease income,
exposed to famine
All Keble community,
but most infants,
children lactate
mothers , pregnant
elders
All disaster affected
community members
Economic hardship,
decrease coffee
production and
quality, loss of income
Affected the whole
community
weak to resist the
problem & able to
work more from
place to place
during famine by
famine & food
shortage
Weak to resist the
problem food,
jobless
Because of this
Kebele economy
depend on
agricultural
activities especially
cash crop (coffee ,
Enset )
Communities
economic based on
coffee and Enset
production
32
Page 2 of 3
Wereda Disaster
Risk Profile
Disaster Risk Management
and Food Security Sector (DRMFSS)
Data_Collected_Date
Tuesday, December 2, 2014
Region S.N.N.P
Zone
GEDEO
Wereda
WENAGO
Selected Indicator: Hazard Situation During Last Disaster - Characteristics of most recent disasters that affected the community
KebeleName
SOKICHA
KELECHA
SUGALE
DEKO
BANKO OKOTO
JEMJEMO
Types of Disasters
Bacterial blight of
coffee
Hazard_Description
2004 ( June - August )
Bacterial blight of
coffee
BBC ( bacterial Bligh
coffee )
June - July , 2.6 hectare
0.5 hectare , March - July
Malaria
BBC ( bacterial bligh
coffee )
May -September ,1000
0.12 hectare , June - July
Acquired watering
diarrhea
July – October, 450-600
Effect_Of_Disaster
Loss of crop
production, crop
damage, loss of
income
Decrease coffee
production, loss of
income
Loss of income, food
shortage, loss of
coffee quality
Most_Severly_Affected
All family members
The whole family
The whole community
affected
Death, illness, loss of
income
Decrease coffee
production and
quality, decrease
individual income
Death, illness, loss of
income
The whole community
The whole community
members affected
The whole community
Reason
Affected
community income
based on coffee
Families economic
based on coffee
production
Because the whole
community
economy based on
coffee production
The whole
community attack
There live hold
based on coffee
production
Affected the whole
community
because it is
communicable
disease
33
Page 3 of 3
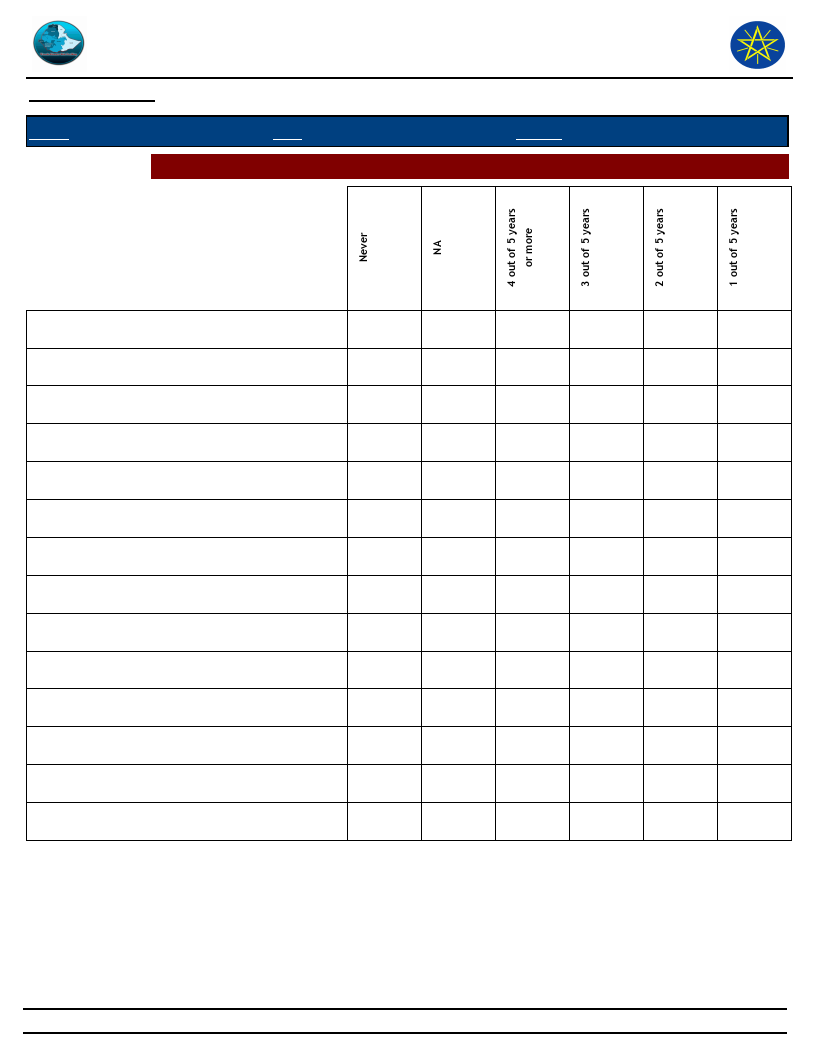
Wereda Disaster
Risk Profile
Data_Collected_Date
Region S.N.N.P
Zone GEDEO
Selected Indictor: Frequency of Disaster Occurrence
Disaster Risk Management
and Food Security Sector (DRMFSS)
Tuesday, December 2, 2014
Wereda WENAGO
Conflicts
Crop diseases
Droughts
Earthquake
Economic / Price shock
Floods
Frost / Cold waves
Heat waves/ High temp
Heavy Rain
Human diseases
Landslides
Livestock diseases
Road Accident
Storms / Cyclone/hail storm
100.00
41.00
10.00
18.00
31.00
36.00
25.00
39.00
100.00
1.00
1.00
64.00
12.00
7.00
15.00
50.00
20.00
30.00
54.00
46.00
50.00
50.00
25.00
50.00
25.00
25.00
15.00
27.00
33.00
25.00
50.00
25.00
36.00
9.00
27.00
27.00
50.00
50.00
16.00
8.00
37.00
39.00
34
Page 1 of 1
Wereda Disaster
Risk Profile
Data_Collected_Date
Region
S.N.N.P
Zone
Selected Indictor:
Household Exposure to Hazards
Disaster Type
Droughts
Floods
Landslides
Crop diseases
Livestock diseases
Human diseases
Storms / Cyclone/hail storm
Heavy Rain
Frost / Cold waves
Heat waves/ High temp
Conflicts
Economic / Price shock
Earthquake
Road Accident
No Disaster
Disaster Risk Management
and Food Security Sector (DRMFSS)
Tuesday, December 2, 2014
GEDEO
Wereda
WENAGO
General_Exposure
5.08
5.47
0.85
22.71
2.20
8.81
20.51
0.85
2.71
0.34
1.02
12.37
0.68
17.12
Last_Five_Years_Exposure
5.47
1.95
0.78
26.56
2.34
9.57
19.92
0.78
2.71
0.39
0.78
14.84
0.20
0.78
12.11
35
Page 1 of 1
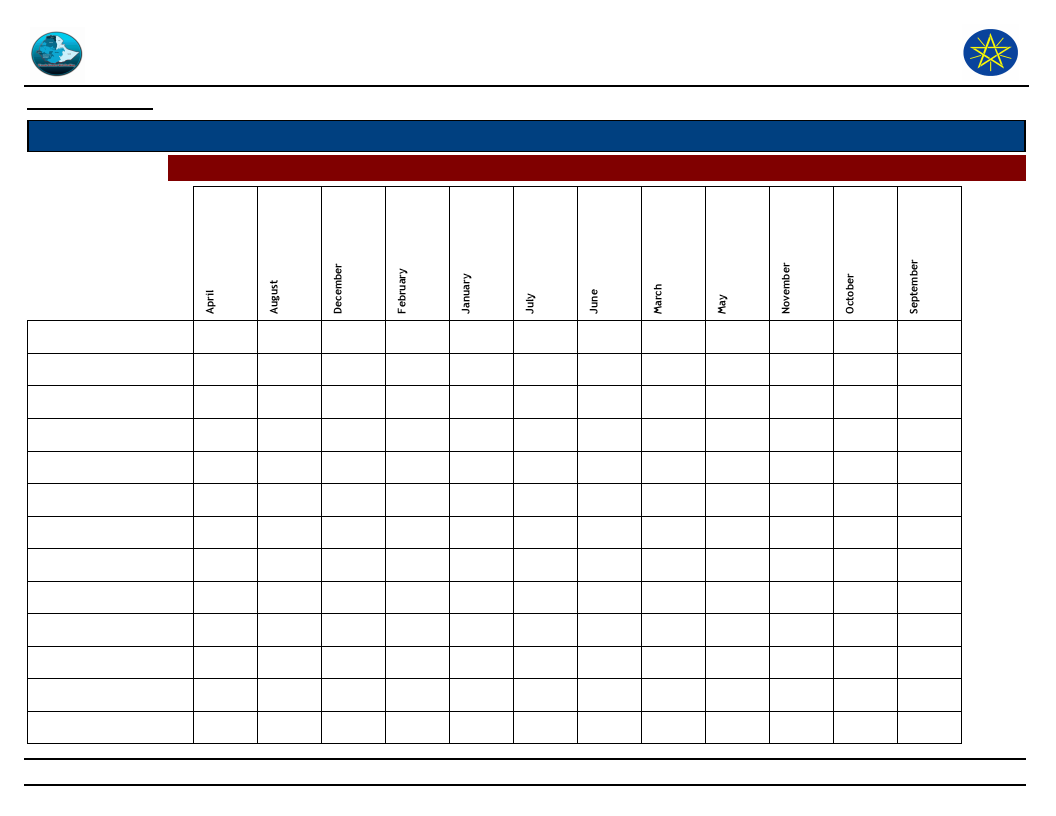
Wereda Disaster
Risk Profile
Data_Collected_Date
Region S.N.N.P
Selected Indictor:
Zone GEDEO
Months of Occurrence of Frequent Disasters
Disaster Risk Management
and Food Security Sector
Tuesday, December 2, 2014
Wereda WENAGO
Conflicts
Crop diseases
Droughts
Earthquake
Economic / Price shock
Floods
Frost / Cold waves
Heat waves/ High temp
Heavy Rain
Human diseases
Landslides
Livestock diseases
Road Accident
2.26
35.71
12.03
17.33
50.00
20.00
10.00
100.00
33.33
18.60
33.33
16.67
11.63
66.67
8.33
1.50
3.57
20.00
1.50
3.57
1.33
10.00
20.00
100.00
26.32
14.67
20.00
26.32
3.57
100.00
20.00
10.53
28.57
1.33
18.80
25.00
13.33
20.00
10.00
6.98
6.98
33.33
4.65
9.30
18.60
8.33
25.00
8.33
50.00
36
8.33
8.33
0.75
2.67
24.00
10.00
10.00
33.33
4.65
6.98
8.33
50.00
8.33
Page 1 of 2
Wereda Disaster
Risk Profile
Data_Collected_Date
Region S.N.N.P
Selected Indictor:
Zone GEDEO
Months of Occurrence of Frequent Disasters
Disaster Risk Management
and Food Security Sector
Tuesday, December 2, 2014
Wereda WENAGO
Storms / Cyclone/hail sto
16.16
15.15
1.01
1.01
8.08
14.14
1.01
24.24
13.13
37
Page 2 of 2
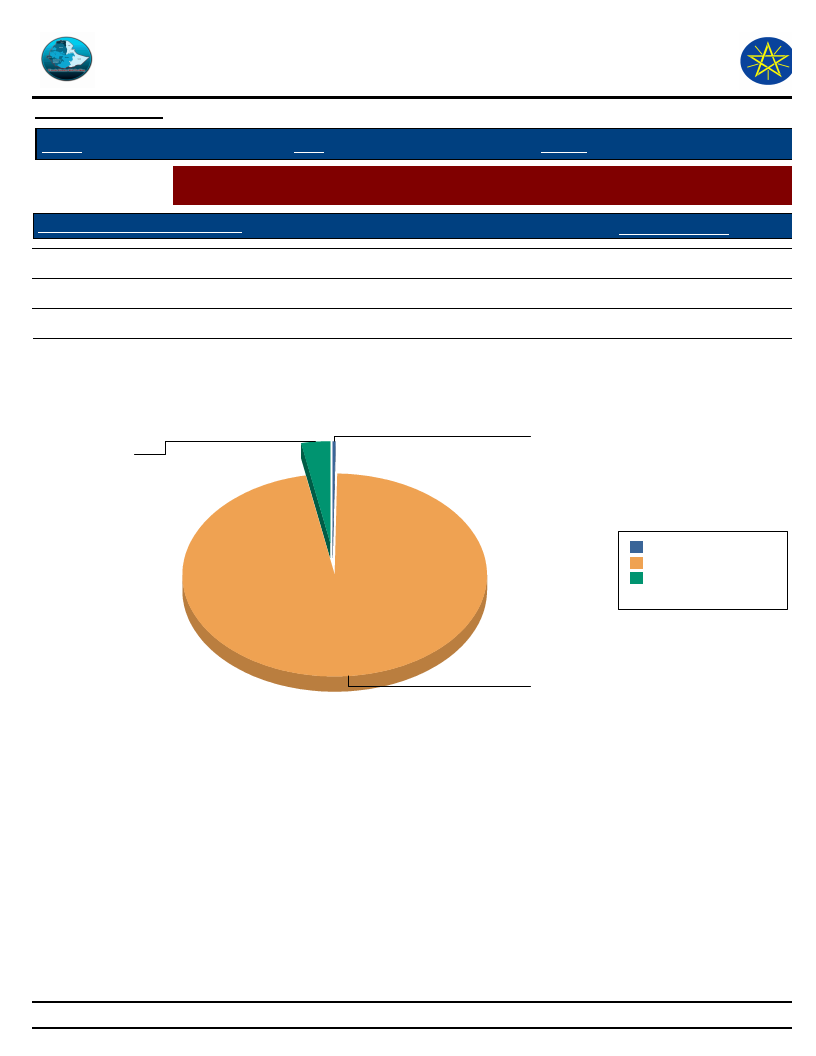
Wereda Disaster
Risk Profile
Data_Collected_Date
Disaster Risk Management
and Food Security Sector (DRMFSS)
Tuesday, December 2, 2014
Region S.N.N.P
Zone GEDEO
Wereda WENAGO
Selected Indictor:
Conflicts: Perception of households on conflict issues - Is conflict an issue in this
community?
Is Conflict an Issue in Community?
Response_Percent
1 Yes
2 No
8 DK
0.26
96.64
3.10
Is Conflict an Issue in Community?
8 DK
3.1
1 Yes
0.3
2 No
96.6
1 Yes 0.3 0.3%
2 No 96.6 96.6%
8 DK 3.1 3.1%
Total: 100 100.0%
38
Page 1 of 1
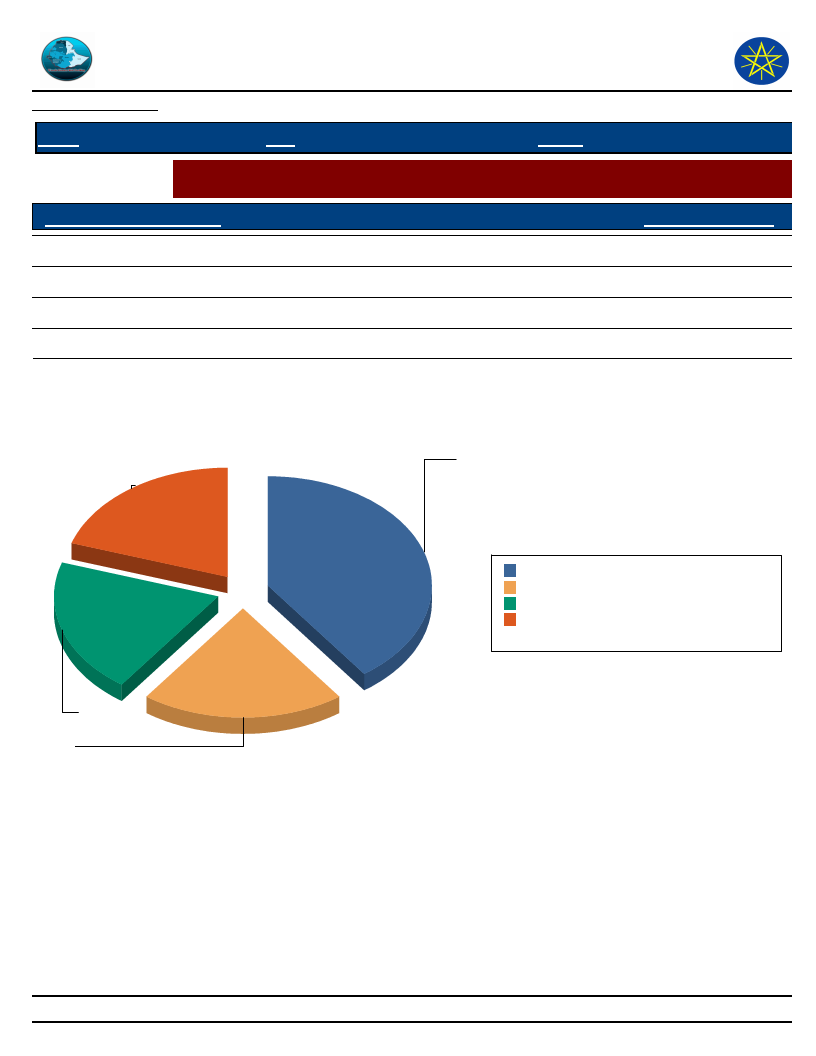
Wereda Disaster
Risk Profile
Data_Collected_Date
Disaster Risk Management
and Food Security Sector (DRMFSS)
Tuesday, December 2, 2014
Region S.N.N.P
Zone GEDEO
Wereda WENAGO
Selected Indictor:
Conflicts: Perception of households on conflict issues - Who To Turn To in case of
Conflict?
Who To Turn During Conflict?
Response_Percentage
Elders
40.00
Police
20.00
Regional representatives
20.00
Other
20.00
Who To Turn During Conflict?
Regional
representatives
20
Elders
40
Police
20
Other
20
Elders
40 40.0%
Other
20 20.0%
Police
20 20.0%
Regional representatives 20 20.0%
Total:
100 100.0%
39
Page 1 of 1
Wereda Disaster
Risk Profile
Data_Collected_Date
Disaster Risk Management
and Food Security Sector (DRMFSS)
Tuesday, December 2, 2014
Region S.N.N.P
Selected Indictor:
Type of Loss
Zone GEDEO
Wereda WENAGO
Losses from Disasters - Losses from all disasters (household response in %)
Main_Loss_Percent
Secondary_Loss_Percent
Crop damage
Loss of income
Loss of savings
Illness/health problems
Death of household members
Livestock damage
Loss of access to social services, including school
Physical damages on houses and property
Livestock were stolen
Lost access to water source
Lost access to grazing land
Had to flee/change residence area
Other losses/damages
41.81
27.46
10.33
7.05
4.28
3.02
1.76
0.50
0.50
0.25
0.00
0.00
0.25
5.54
51.90
19.83
4.37
1.17
1.46
3.50
0.58
0.29
1.46
0.87
1.01
1.46
40
Page 1 of 1

Wereda Disaster
Risk Profile
Data_Collected_Date
Disaster Risk Management
and Food Security Sector (DRMFSS)
Tuesday, December 2, 2014
Region S.N.N.P
Selected Indictor:
Type of Loss
Zone GEDEO
Wereda WENAGO
Losses from Disasters - Main Losses by Type of Disasters (household response in %)
Type of Disasters which mainly caused Listed Losses
Crop damage
Death of household
members
Had to flee/change
residence area
Illness/health problems
Livestock damage
41
Page 1 of 3
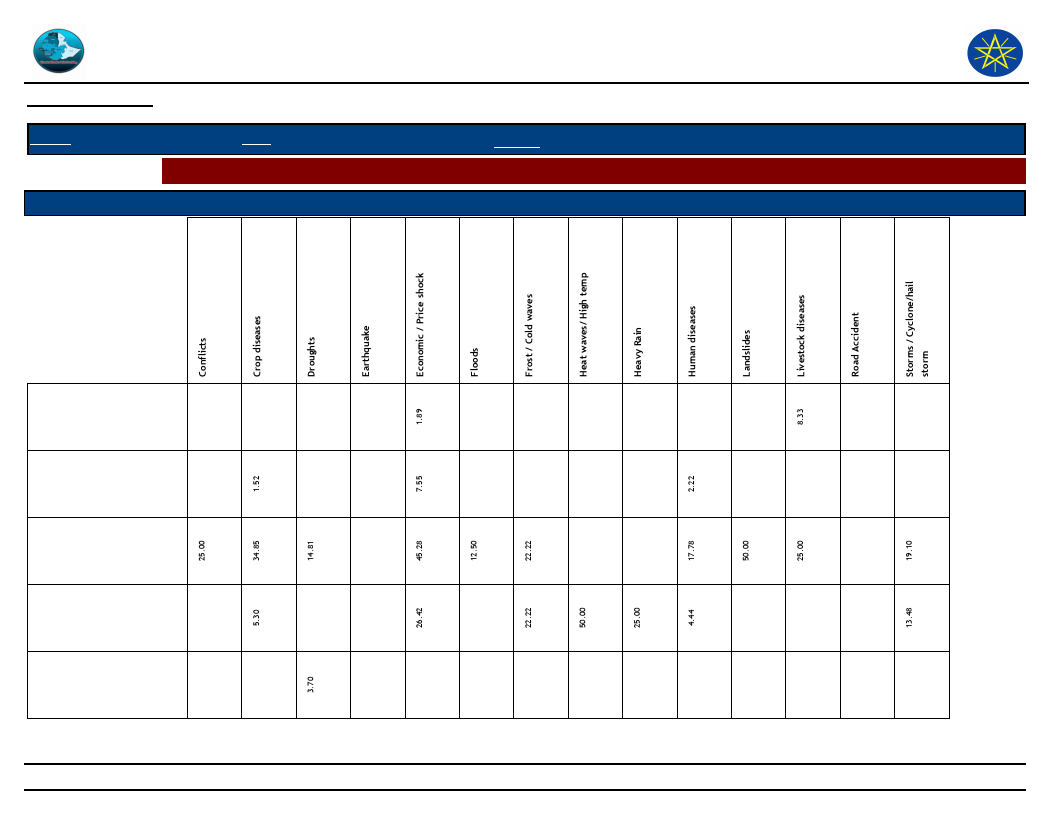
Wereda Disaster
Risk Profile
Data_Collected_Date
Disaster Risk Management
and Food Security Sector (DRMFSS)
Tuesday, December 2, 2014
Region S.N.N.P
Selected Indictor:
Type of Loss
Zone GEDEO
Wereda WENAGO
Losses from Disasters - Main Losses by Type of Disasters (household response in %)
Type of Disasters which mainly caused Listed Losses
Livestock were stolen
Loss of access to social
services, including
school
Loss of income
Loss of savings
Lost access to water
source
42
Page 2 of 3

Wereda Disaster
Risk Profile
Data_Collected_Date
Disaster Risk Management
and Food Security Sector (DRMFSS)
Tuesday, December 2, 2014
Region S.N.N.P
Selected Indictor:
Type of Loss
Zone GEDEO
Wereda WENAGO
Losses from Disasters - Main Losses by Type of Disasters (household response in %)
Type of Disasters which mainly caused Listed Losses
Other losses/damages
Physical damages on
houses and property
43
Page 3 of 3
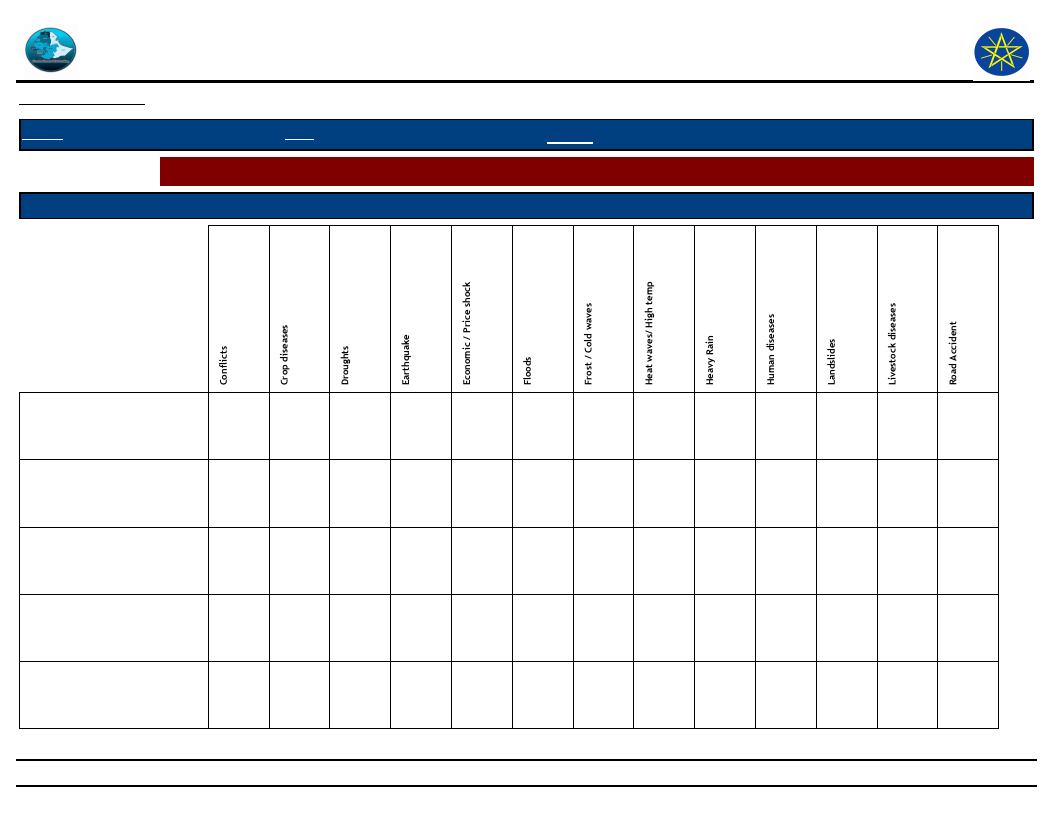
Wereda Disaster
Risk Profile
Data_Collected_Date
Disaster Risk Management
and Food Security Sector (DRMFSS)
Tuesday, December 2, 2014
Region S.N.N.P
Zone GEDEO
Wereda WENAGO
Selected Indictor: Losses from Disasters - Secondary Losses by Type of Disasters (household response in %)
Type of Loss
Type of Disasters which caused Listed Secondary Losses
Crop damage
Death of household
members
Illness/health problems
Livestock damage
Livestock were stolen
10.53
3.85
0.88
2.63
0.88
2.04
2.04
57.14
44
2.56
2.56
12.82
2.56
18.18
Page 1 of 3

5.33
2.67
2.67
2.67
45

Wereda Disaster
Risk Profile
Data_Collected_Date
Disaster Risk Management
and Food Security Sector (DRMFSS)
Tuesday, December 2, 2014
Region S.N.N.P
Zone GEDEO
Wereda WENAGO
Selected Indictor: Losses from Disasters - Secondary Losses by Type of Disasters (household response in %)
Type of Loss
Type of Disasters which caused Listed Secondary Losses
Loss of access to social
services, including school
Loss of income
Loss of savings
Lost access to grazing land
Lost access to water source
33.33
0.88
12.24
2.56
9.09
51.75
80.77
38.78
28.57
60.00
100.00
66.67
41.03
50.00
36.36
33.33
18.42
7.69
100.00
34.69
40.00
25.64
50.00
27.27
100.00
0.88
2.04
1.75
7.69
46
Page 2 of 3

2.67
61.33
10.67
1.33
1.33
47
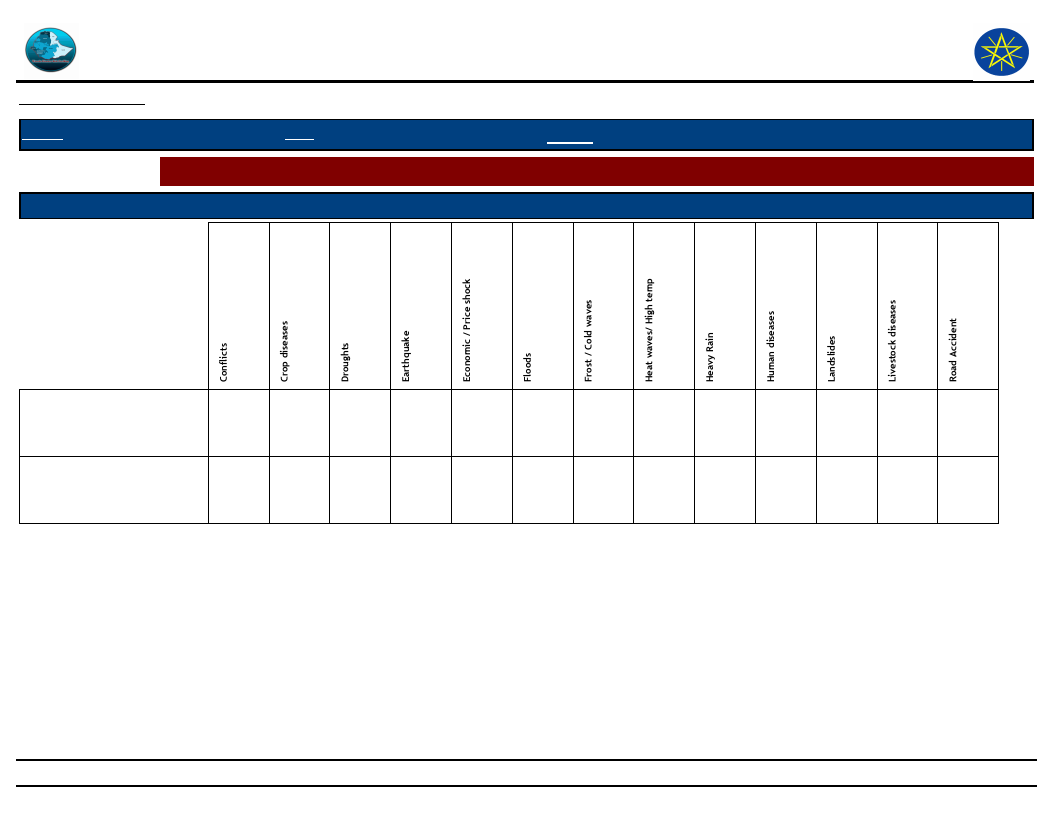
Wereda Disaster
Risk Profile
Data_Collected_Date
Disaster Risk Management
and Food Security Sector (DRMFSS)
Tuesday, December 2, 2014
Region S.N.N.P
Zone GEDEO
Wereda WENAGO
Selected Indictor: Losses from Disasters - Secondary Losses by Type of Disasters (household response in %)
Type of Loss
Type of Disasters which caused Listed Secondary Losses
Other losses/damages
1.75
2.04
2.56
Physical damages on houses
and property
33.33
0.88
48
Page 3 of 3

49
Wereda Disaster
Risk Profile
Data_Collected_Date
Disaster Risk Management and
Food Security Sector (DRMFSS)
Tuesday, December 2, 2014
Region S.N.N.P
Zone GEDEO
Wereda WENAGO
Selected Indictor: Seasonal Calendar for Hazards, Activities and Income Level By Kebele
Month of Hazard
Major_Problems /Disasters
Kebele
BANKO OKOTO
Hazard Severity
Rank
Agricultural_Activities
Income
Level Rank
January
Typhoid measles
1
Harvesting
3rd
February
Typhoid and measles, lack of drinking water, eye,
2
Land preparation for belg
4th
problem
March
Typhoid, typhus, and malaria, Enset, crop root,
2
Enset crop planting
5th
damage
April
Typhoid, typhus, and malaria, Enset, crop root,
2
Sowing
6th
damage
May
Influenza, coffee, cholera, disease, diarrhea, food
3
weeding
7th
shortage,
June
Animal diseases, coffee, cholera, food shortage
3
Weeding , maher land preparation
8th
July
Influenza, pneumonia, lung problem, food shortage
3
weeding , maher land preparation
9th
August
Influenza, typhoid, food shortage
3
10th
September
Influenza, typhoid, food shortage
3
sowing
11th
October
Malaria, typhoid, food shortage
3
weeding , boyna, planting
12th
November
Malaria, typhoid, food shortage
3
Cheery, coffee, harvesting
2nd
December
No problem
1
Coffee, harvesting , cutting , Enset corn
1st
NOTE: Hazard Severity Rank helps prioritize the more severe hazards that have occurred in the months of disaster occurrence, 3 being the worst and 1
the least severe hazards.
50
Page 1 of 18

Wereda Disaster
Risk Profile
Data_Collected_Date
Disaster Risk Management and
Food Security Sector (DRMFSS)
Tuesday, December 2, 2014
Region S.N.N.P
Zone GEDEO
Wereda WENAGO
Selected Indictor: Seasonal Calendar for Hazards, Activities and Income Level By Kebele
Month of Hazard
Major_Problems /Disasters
Kebele
BELE BUKISA
Hazard Severity
Rank
Agricultural_Activities
Income
Level Rank
January
Harvesting coffee
1st
February
Migration to find food, job, Daily labour to urban
1
Preparing farm
1st
rural
March
Migration to find food, job, Daily labour to urban
1
Preparing farm
1st
rural
April
Migration to find food, job, Daily labour to urban
rural
1
Crop sowing maize / migrant
May
Food shortage, migration
3
Planting coffee seeding CBD
3rd
June
Food shortage, migrated and BBC
2
Weeding Seeding CBD
3rd
July
Food shortage, migrated and BBC
2
BBC
August
Food shortage, migrated and CBD
3
BBC
3rd
September
Food shortage, migrated and CBD
3
BBC
2nd
October
Food shortage, migrated and CBD
3
Harvesting coffee
2nd
November
Harvesting coffee
1st
December
harvesting coffee
1st
NOTE: Hazard Severity Rank helps prioritize the more severe hazards that have occurred in the months of disaster occurrence, 3 being the worst and 1
the least severe hazards.
51
Page 2 of 18

Wereda Disaster
Risk Profile
Data_Collected_Date
Disaster Risk Management and
Food Security Sector (DRMFSS)
Tuesday, December 2, 2014
Region S.N.N.P
Zone GEDEO
Wereda WENAGO
Selected Indictor: Seasonal Calendar for Hazards, Activities and Income Level By Kebele
Month of Hazard
Kebele
DABOTA
Major_Problems /Disasters
Hazard Severity
Rank
Agricultural_Activities
Income
Level Rank
January
Shortage of rain fall ( influenza) typhoid
1
Prepared land ( harvesting )
3rd
February
Heavy warm , shortage of water
2
Prepared land ( harvesting )
5th
March
Heavy warm , shortage of water (Enset mill bag )
2
Planted Enset
6th
April
Un necessary outcome sometimes shortage of rain
2
Planted coffee
7th
fall , (Enset mill bag ,
May
CBD , Enset diseases mille bag )
2
Weeding time
8th
June
CBD , Enset diseases mille bag )
2
Weeding time
9th
July
CBD , Enset diseases mille bag )
2
Planted coffee
10th
August
CBD , Enset diseases mille bag )
3
Crop sowing
4th
September
CBD , Enset diseases mille bag )
3
Weeding
11th
October
CBD , Enset diseases mille bag )
3
Harvesting coffee
12th
November
No
Harvesting coffee
1st
December
No
Harvesting crop
2nd
NOTE: Hazard Severity Rank helps prioritize the more severe hazards that have occurred in the months of disaster occurrence, 3 being the worst and 1
the least severe hazards.
52
Page 3 of 18

Wereda Disaster
Risk Profile
Data_Collected_Date
Disaster Risk Management and
Food Security Sector (DRMFSS)
Tuesday, December 2, 2014
Region S.N.N.P
Zone GEDEO
Wereda WENAGO
Selected Indictor: Seasonal Calendar for Hazards, Activities and Income Level By Kebele
Month of Hazard
Kebele
DEKO
Major_Problems /Disasters
Hazard Severity
Rank
Agricultural_Activities
Income
Level Rank
January
Typhus, typhoid, pneumonia, eye problem
1
Harvesting
3rd
February
Typhus, typhoid, pneumonia, eye, problem
1
Land preparation
4th
March
Malaria, diarrhea, typhus, typhoid
2
Enset, planting
5th
April
Malaria, diarrhea, influenza, Enset, crop diseases
2
Sowing
6th
May
Malaria, coffee, cholera, influenza, food, shortage
2
Weeding
7th
June
Malaria, coffee, cholera, influenza, food, shortage
2
Weeding Maher, land preparation
8th
July
Malaria, coffee, cholera, Enset, not disease , food,
3
Weeding Maher, land preparation
9th
shortage
August
Malaria, coffee, cholera,, Enset, not disease, food,
3
Land preparation
10th
shortage
September
Coffee, cholera, Enset root disease, food, shortage,
3
Sowing
11th
October
Food, shortage
3
Planting boyna, weeding
12th
November
Food shortage
3
Coffee, harvesting
2nd
December
No Problem
1
Cutting of Enset, corn harvesting coffee
1st
NOTE: Hazard Severity Rank helps prioritize the more severe hazards that have occurred in the months of disaster occurrence, 3 being the worst and 1
the least severe hazards.
53
Page 4 of 18

Wereda Disaster
Risk Profile
Data_Collected_Date
Disaster Risk Management and
Food Security Sector (DRMFSS)
Tuesday, December 2, 2014
Region S.N.N.P
Zone GEDEO
Wereda WENAGO
Selected Indictor: Seasonal Calendar for Hazards, Activities and Income Level By Kebele
Month of Hazard
Major_Problems /Disasters
Kebele
DODORO
Hazard Severity
Rank
Agricultural_Activities
Income
Level Rank
January
Influence , typhoid , typhus
1
To prepared land , cultivate harvest
3rd
February
Warm & shortage of water, thyroid & typhus
2
To prepared land, harvesting
5th
March
Warm & shortage of water & Enset Mill bag
2
Planted Enset
6th
April
Unnecessary outcome, some time shortage of rain ,
2
Planted coffee
7th
Enset mill bag
May
CBD, Enset disease (mill bag)
2
Weeding time
8th
June
CBD, Enset disease (mill bag)
2
Weeding time
9th
July
CBD, Enset disease (mill bag)
2
Planted coffee
10th
August
CBD, Enset disease (mill bag)
3
Crop sowing
4th
September
CBD, Enset disease (mill bag)
3
Weeding
11th
October
CBD, Enset disease (mill bag)
3
Harvesting coffee
12th
November
No
1
Harvesting coffee
12th
December
No
1
Harvesting crops
2nd
NOTE: Hazard Severity Rank helps prioritize the more severe hazards that have occurred in the months of disaster occurrence, 3 being the worst and 1
the least severe hazards.
54
Page 5 of 18

Wereda Disaster
Risk Profile
Data_Collected_Date
Disaster Risk Management and
Food Security Sector (DRMFSS)
Tuesday, December 2, 2014
Region S.N.N.P
Zone GEDEO
Wereda WENAGO
Selected Indictor: Seasonal Calendar for Hazards, Activities and Income Level By Kebele
Month of Hazard
Major_Problems /Disasters
Kebele
GASELCHO
Hazard Severity
Rank
Agricultural_Activities
Income
Level Rank
January
Influence, typhoid, typhus
1
To prepared land, cultivate harvest
3rd
February
Warm & shortage of water, thyroid & typhus
2
To prepared land, harvesting
5th
March
Warm & shortage of water & Enset Mill bag
2
Planted Enset
6th
April
Unnecessary outcome, some time shortage of rain,
2
Planted coffee
7th
Enset mill bag
May
CBD, Enset disease (mill bag)
2
Weeding time
8th
June
CBD, Enset disease (mill bag)
2
Weeding time
9th
July
CBD, Enset disease (mill bag)
2
Planted coffee
10th
August
CBD, Enset disease (mill bag)
3
Crop sowing
4th
September
CBD, Enset disease (mill bag)
3
Weeding
11th
October
CBD, Enset disease (mill bag)
3
Harvesting coffee
12th
November
No
Harvesting coffee
1st
December
No
Harvesting crops
2nd
NOTE: Hazard Severity Rank helps prioritize the more severe hazards that have occurred in the months of disaster occurrence, 3 being the worst and 1
the least severe hazards.
55
Page 6 of 18

Wereda Disaster
Risk Profile
Data_Collected_Date
Disaster Risk Management and
Food Security Sector (DRMFSS)
Tuesday, December 2, 2014
Region S.N.N.P
Zone GEDEO
Wereda WENAGO
Selected Indictor: Seasonal Calendar for Hazards, Activities and Income Level By Kebele
Month of Hazard
Kebele
HALEMO
Major_Problems /Disasters
Hazard Severity
Rank
Agricultural_Activities
Income
Level Rank
January
High fever, diarrhea
1
Harvesting
3rd
February
Eye problem , influence, pneumonia
1
Farm preparation belg
5th
March
Animal diseases, malaria
1
Farm preparation
6th
April
Stomach ache, Famine
2
Farm preparation
7th
May
CBD, ERP, animals disease , Famine
2
Sowing planting, maize, coffee, inset
8th
June
CBD, ERP, New Cassel disease , Famine
2
Sowing planting , weeding
9th
July
CBD, ERP, New Cassel disease , Famine
3
Weeding , farm preparation / Maher
10th
August
Animal Disease, CBD, ERP, famine
3
Weeding , farm preparation
11th
September
Famine , animals disease, CBD, ERP
3
Sowing plant root tiff, wheat, harvesting root crop
4th
October
Typhoid , , ERD, Famine
3
Weeding
12th
November
high fever diarrhea
1
Harvesting , ( coffee ) weeding
1st
December
high fever diarrhea
1
Harvesting
2nd
NOTE: Hazard Severity Rank helps prioritize the more severe hazards that have occurred in the months of disaster occurrence, 3 being the worst and 1
the least severe hazards.
56
Page 7 of 18

Wereda Disaster
Risk Profile
Data_Collected_Date
Disaster Risk Management and
Food Security Sector (DRMFSS)
Tuesday, December 2, 2014
Region S.N.N.P
Zone GEDEO
Wereda WENAGO
Selected Indictor: Seasonal Calendar for Hazards, Activities and Income Level By Kebele
Month of Hazard
Major_Problems /Disasters
Kebele
HASEHARO
Hazard Severity
Rank
Agricultural_Activities
Income
Level Rank
January
Shortage of rain fall influenza , typhoid
1
Prepared land (harvesting )
3rd
February
Influenza, typhoid, shortage of waster
2
Prepared land (harvesting )
5th
March
Influenza, typhoid, Inset mill bag
2
Planted , inset
6th
April
Economic hard ship, Inset mill bag
2
Planted coffee
7th
May
CBD Inset , diseases Mill bag
2
Weeding , time
8th
June
CBD Inset , diseases Mill bag
2
Weeding time
9th
July
CBD Inset , diseases Mill bag
2
Planted coffee
10th
August
CBD Inset , diseases Mill bag
3
Crop sowing
4th
September
CBD Inset , diseases Mill bag
3
Weeding
11th
October
CBD Inset , diseases Mill bag
3
Harvesting coffee
12th
November
No
Harvesting coffee
1st
December
No
Harvesting crop
2nd
NOTE: Hazard Severity Rank helps prioritize the more severe hazards that have occurred in the months of disaster occurrence, 3 being the worst and 1
the least severe hazards.
57
Page 8 of 18

Wereda Disaster
Risk Profile
Data_Collected_Date
Disaster Risk Management and
Food Security Sector (DRMFSS)
Tuesday, December 2, 2014
Region S.N.N.P
Zone GEDEO
Wereda WENAGO
Selected Indictor: Seasonal Calendar for Hazards, Activities and Income Level By Kebele
Month of Hazard
Major_Problems /Disasters
Kebele
JEMJEMO
Hazard Severity
Rank
Agricultural_Activities
Income
Level Rank
January
Typhoid , measles, typhus
1
Harvesting
2nd
February
Typhoid, eye problem , no access to drinking water
2
Land preparation
6th
March
Thyroid, typhus, inset, disease, coffee, disease
2
Inset crop planting
6th
April
Influenza, coughing , diarrhea , inset, disease
2
Sowing , maize , coffee, seed, haricot been,
7th
May
Malarial, food, shortage
3
Weeding
8th
June
Malaria, famine, coffee, disease, inset, disease
3
Weeding, Maher, land preparation
9th
July
Influenza, typhus, typhoid, coffee, disease, food
3
Harvesting , Maher, land preparation
3rd
shortage
August
Influenza, coffee, disease, inset, disease, food
3
Harvesting , maher, land preparation
4th
shortage
September
Food., shortage, coffee, disease, Ensets disease, food
3
Sowing
10th
shortage
October
Food., shortage, coffee, disease, Ensets disease, food
3
Weeding , boyna, planting
11th
shortage
November
Food., shortage, coffee, disease, Ensets disease, food
3
Harvesting , coffee
1st
shortage
December
No problem
1
Harvesting coffee, cutting , inset corn
1st
NOTE: Hazard Severity Rank helps prioritize the more severe hazards that have occurred in the months of disaster occurrence, 3 being the worst and 1
the least severe hazards.
58
Page 9 of 18

Wereda Disaster
Risk Profile
Data_Collected_Date
Disaster Risk Management and
Food Security Sector (DRMFSS)
Tuesday, December 2, 2014
Region S.N.N.P
Zone GEDEO
Wereda WENAGO
Selected Indictor: Seasonal Calendar for Hazards, Activities and Income Level By Kebele
Month of Hazard
Major_Problems /Disasters
Kebele
KELECHA
Hazard Severity
Rank
Agricultural_Activities
Income
Level Rank
January
Inset disease
1
Harvesting coffee
3rd
February
typhoid, typhus , influenza , inset disease
1
Farm preparation / Belg
5th
March
Typhoid ,typhus , influenza, inset disease
1
Farm preparation
6th
April
Typhoid , typhus , influenza, inset disease
1
Sowing / planting
7th
May
Malaria, lack of food , inset disease
2
Sowing / planting , weeding
8th
June
Malaria , lack of food , inset disease , CBD
2
Weeding , farm preparation / Maher
9th
July
CBD, New Cassel disease, inset, disease, famine
2
Weeding , farm, preparation
10th
August
CBD, New Cassel disease, inset, disease famine
3
Harvesting , sowing , / planting
4th
disease animal
September
CBD, inset diastase famine
3
Weeding , sowing
11th
October
CBD, inset Disease famine
3
Weeding
12th
November
CBD , inset disease
1
Harvesting , weeding ,
1st
December
CBD, inset disease
1
Harvesting
2nd
NOTE: Hazard Severity Rank helps prioritize the more severe hazards that have occurred in the months of disaster occurrence, 3 being the worst and 1
the least severe hazards.
59
Page 10 of 18

Wereda Disaster
Risk Profile
Data_Collected_Date
Disaster Risk Management and
Food Security Sector (DRMFSS)
Tuesday, December 2, 2014
Region S.N.N.P
Zone GEDEO
Wereda WENAGO
Selected Indictor: Seasonal Calendar for Hazards, Activities and Income Level By Kebele
Month of Hazard
Major_Problems /Disasters
Kebele
KERA SODITY
Hazard Severity
Rank
Agricultural_Activities
Income
Level Rank
January
Shortage of rain fall influenza , hypoid
1
Harvesting
3rd
February
influenza , thyroid, shortage of water
2
Preparing land cultivation
5th
March
influenza , thyroid, Enset mill bag
2
Planted Enset
6th
April
Economic hard ship , Enset mill bag
2
Planted, coffee
7th
May
CBD, Enset disease
2
Planted, coffee
8th
June
CBD, Enset disease
2
Weeding
9th
July
CBD, Enset disease
2
Weeding
10th
August
CBD, Enset disease
3
Crop sowing
4th
September
CBD, Enset disease
3
Crop sowing
11th
October
Drought malaria influenza
3
Weeding
12th
November
No
Harvesting coffee
1st
December
No
Harvesting coffee & crop
2nd
NOTE: Hazard Severity Rank helps prioritize the more severe hazards that have occurred in the months of disaster occurrence, 3 being the worst and 1
the least severe hazards.
60
Page 11 of 18

Wereda Disaster
Risk Profile
Data_Collected_Date
Disaster Risk Management and
Food Security Sector (DRMFSS)
Tuesday, December 2, 2014
Region S.N.N.P
Zone GEDEO
Wereda WENAGO
Selected Indictor: Seasonal Calendar for Hazards, Activities and Income Level By Kebele
Month of Hazard
Major_Problems /Disasters
Kebele
MEKONISA
Hazard Severity
Rank
Agricultural_Activities
Income
Level Rank
January
Shortage of rain fall influenza, typhoid
1
To prepare land & harvesting
3rd
February
influenza , typhoid , shortage of water
2
To prepare land & harvesting
5th
March
Influenza typhoid , typhoid, Enset mille bag
2
To planted Enset
6th
April
To planted Enset
2
To planted coffee& another or plant
7th
May
CBD, Enset disease ( Mille bag )
2
To weeding
8th
June
CBD, Enset disease ( Mille bag )
2
To weeding
9th
July
CBD, Enset disease ( Mille bag )
3
To planted coffee
10th
August
CBD, Enset disease ( Mille bag )
3
To sowing
4th
September
CBD, Enset disease ( Mille bag )
3
weeding
11th
October
Drought , malaria influenza
3
Weeding
12th
November
No
Harvesting
1st
December
No
Harvesting
2nd
NOTE: Hazard Severity Rank helps prioritize the more severe hazards that have occurred in the months of disaster occurrence, 3 being the worst and 1
the least severe hazards.
61
Page 12 of 18

Wereda Disaster
Risk Profile
Data_Collected_Date
Disaster Risk Management and
Food Security Sector (DRMFSS)
Tuesday, December 2, 2014
Region S.N.N.P
Zone GEDEO
Wereda WENAGO
Selected Indictor: Seasonal Calendar for Hazards, Activities and Income Level By Kebele
Month of Hazard
Major_Problems /Disasters
Kebele
SOKICHA
Hazard Severity
Rank
Agricultural_Activities
Income
Level Rank
January
Influenza, typhoid , typhus
1
Harvesting
3rd
February
Influenza, typhoid , typhus
2
Farm preparation / Belg
5th
March
Influence, typhoid, typhus, inset diseases ( mill bay )
2
Farm preparation
6th
April
Influence, typhoid, typhus, inset diseases ( mill bay )
2
Sowing / planting
7th
May
CBD influence, typhoid, typhus , inset diseases ( mill
2
Sowing planting, weeding
8th
bay )
June
CBD Inset mill bay, famine
2
Weeding farm preparation Maher
9th
July
CBD Inset mill bay, famine
3
Weeding , farm preparation
10th
August
CBD Inset mill bay, famine
3
Harvesting sowing planting
4th
September
CBD Inset mill bay, famine
3
Weeding
11th
October
Drought malaria influenza, typhoid, typhus
3
Weeding
12th
November
There is no father problem
Harvesting
1st
December
There is no father problem
Harvesting
2nd
NOTE: Hazard Severity Rank helps prioritize the more severe hazards that have occurred in the months of disaster occurrence, 3 being the worst and 1
the least severe hazards.
62
Page 13 of 18

Wereda Disaster
Risk Profile
Data_Collected_Date
Disaster Risk Management and
Food Security Sector (DRMFSS)
Tuesday, December 2, 2014
Region S.N.N.P
Zone GEDEO
Wereda WENAGO
Selected Indictor: Seasonal Calendar for Hazards, Activities and Income Level By Kebele
Month of Hazard
Kebele
SUGALE
Major_Problems /Disasters
Hazard Severity
Rank
Agricultural_Activities
Income
Level Rank
January
Typhoid , typhus, malaria, eye, problem
2
Harvesting
2nd
February
Influenza
2
Land preparation
5th
March
New castle disease, inset, root disease
1
Inset crop planting
6th
April
Malaria, influenza, coffee, cholera
1
Sowing , maize, coffee, seed., haricot bean
7th
May
Africa horse, disease, and new castle, disease, food
3
Weeding
8th
shortage
June
Africa horse, disease, and new castle, food shortage
3
Weeding, Maher land preparation
9th
July
Coffee, disease, malaria, food shortage, food shortage
3
Harvesting, Maher land preparation
3rd
August
Coffee, disease, food shortage , Enset disease
3
Harvesting, Maher land preparation
4th
September
Coffee, disease, food shortage
3
Sowing
10th
October
Influenza, coffee, diseases, Enset disease, food
3
Weeding, Boyne, planting
11th
shortage
November
Coffee, cholera, Enset root disease, food shortage
3
Cheery, coffee, harvesting ,
1st
December
Diarrhea influenza
1
Harvesting coffee, cutting , inset corn
1st
NOTE: Hazard Severity Rank helps prioritize the more severe hazards that have occurred in the months of disaster occurrence, 3 being the worst and 1
the least severe hazards.
63
Page 14 of 18

Wereda Disaster
Risk Profile
Data_Collected_Date
Disaster Risk Management and
Food Security Sector (DRMFSS)
Tuesday, December 2, 2014
Region S.N.N.P
Zone GEDEO
Wereda WENAGO
Selected Indictor: Seasonal Calendar for Hazards, Activities and Income Level By Kebele
Month of Hazard
Major_Problems /Disasters
Kebele
TOKOCHA
Hazard Severity
Rank
Agricultural_Activities
Income
Level Rank
January
Shortage of rain fall , influenza, typhoid, & typhoid
1
To prepare land, harvesting
3rd
February
heavy warm, shortage of water
2
To prepare land, harvesting
5th
March
heavy warm, shortage of water
2
To planted Ensets
6th
April
Unnecessary outcome ,some time shortage of rain fall
2
To planted coffee father plant
7th
May
Some time snow, CBD, Enset diseases mailbag
2
Weeding
8th
June
CBD, Enset, disease ,( Mill bag )
2
Weeding
9th
July
CBD, Enset, disease ,( Mill bag )
2
To planted, coffee
10th
August
CBD, Enset, disease ,( Mill bag )
2
To sowing
4th
September
Some time sown & heavy rain & CBD, Enset disease
3
To sowing
11th
October
CBD, Enset, disease
3
To weeding
12th
November
No
3
To weeding ( harvesting )
1st
December
No
3
harvesting
2nd
NOTE: Hazard Severity Rank helps prioritize the more severe hazards that have occurred in the months of disaster occurrence, 3 being the worst and 1
the least severe hazards.
64
Page 15 of 18

Wereda Disaster
Risk Profile
Data_Collected_Date
Disaster Risk Management and
Food Security Sector (DRMFSS)
Tuesday, December 2, 2014
Region S.N.N.P
Zone GEDEO
Wereda WENAGO
Selected Indictor: Seasonal Calendar for Hazards, Activities and Income Level By Kebele
Month of Hazard
Major_Problems /Disasters
Kebele
TUMATA CHRECHA
Hazard Severity
Rank
Agricultural_Activities
Income
Level Rank
January
Thyroid , typhus , ERP
1
Harvesting
3rd
February
Air born disease, typhoid ,typhus, ERP
1
Farm preparation / Belge
5th
March
Air born disease , typhoid , typhus , ERP
1
Farm preparation
6th
April
Malaria ERP
1
Sowing / planting
7th
May
Coffee berry disease, hen diseases, Inset root pest
2
Sowing planting , weeding
8th
malaria
June
Malaria , Typhoid, CBD, ERP , Animals Disease
2
Weeding farm preparation , Maher
9th
July
Malaria , typhoid, typhus, CBD , ERP, animals disease
2
Weeding , farm preparation
10th
August
Famine, CBD , ERP, malaria , water born diseases
3
Harvesting , sowing / planting
4th
September
Famine, CBD , ERP, malaria , water born diseases
3
Weeding
11th
October
Famine CBD ERP water born disease
3
Weeding
12th
November
Harvesting , weeding,
1st
December
Harvesting
2nd
NOTE: Hazard Severity Rank helps prioritize the more severe hazards that have occurred in the months of disaster occurrence, 3 being the worst and 1
the least severe hazards.
65
Page 16 of 18

Wereda Disaster
Risk Profile
Data_Collected_Date
Disaster Risk Management and
Food Security Sector (DRMFSS)
Tuesday, December 2, 2014
Region S.N.N.P
Zone GEDEO
Wereda WENAGO
Selected Indictor: Seasonal Calendar for Hazards, Activities and Income Level By Kebele
Month of Hazard
Kebele
WETIKO
Major_Problems /Disasters
Hazard Severity
Rank
Agricultural_Activities
Income
Level Rank
January
Harvesting coffee
3rd
February
Prepare action farm
March
Inflation to
Planting inset
April
2
Planting coffee seedlings
May
CBD ,
3
Planting coffee seedlings
June
CBD
3
Weeding
July
CBD , coffee wilt
1
Weeding
August
CBD , coffee wilt
Sowing , barley beans
September
CBD , coffee wilt
Harvesting maize
October
CBD , coffee wilt
Learning farm
November
Harvesting coffee
1st
December
Harvesting coffee
2nd
NOTE: Hazard Severity Rank helps prioritize the more severe hazards that have occurred in the months of disaster occurrence, 3 being the worst and 1
the least severe hazards.
66
Page 17 of 18
WDRP Indicators
Infrastructure Access Characteristics
67
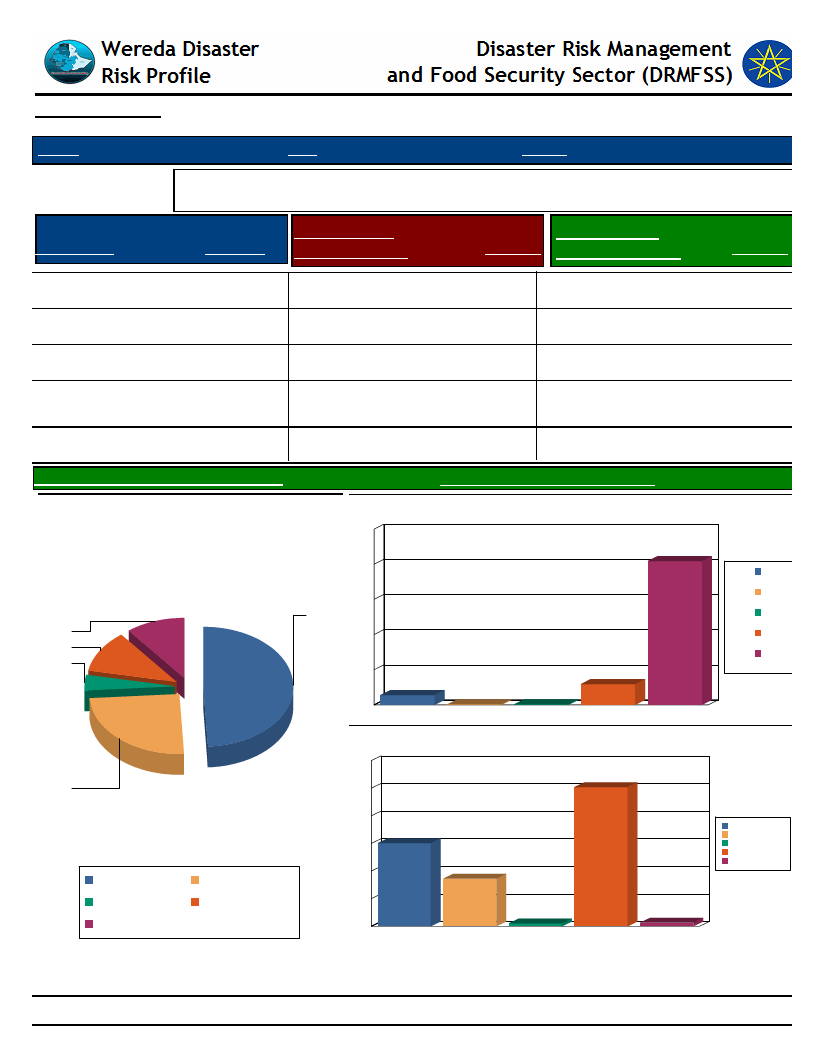
Data_Collected_Date
Tuesday, December 2, 2014
Region S.N.N.P
Selected Indicator
Type of Road
Yes, paved
Zone GEDEO
Wereda WENAGO
Physical Vulnerability: Access to Roads & Urban Centres - Households access to
road and urban centre
Response
Time to Nearest
Paved Road (Mins.)
Time To Nearest
Response Urban Center (Mins.)
10.57 Less than 30 min
81.84 Less than 1 hr
Yes, partly paved road
11.34 30 – 60 min
11.84 1 - 2 hrs
Yes, gravel road
4.12 1 – 2 hrs
5.53 2 - 4 hrs
Yes, dirt road (difficult
for car)
No, no road
24.74 2 – 3 hrs
49.23 3 – 4 hrs
0.26 4 - 6 hrs
0.26 More than 6 hrs
Response
50.39
30.08
17.22
1.03
1.29
Avg Time To Nearest Urban Center(Mins.)
Type of Road
49
11
11
4
25
No, no road
Yes, gravel road
Yes, paved
Yes, dirt road (difficult
for car)
Yes, partly paved road
100.36 Avg_Time_To_Nearest_Paved_Road
23.48
Time to reach the nearest paved road from the HH
100
80
60
40
20
6
0
1 – 2 hrs
0
2 – 3 hrs
0
3 – 4 hrs
82
1 – 2 hrs
2 – 3 hrs
3 – 4 hrs
30 – 60 min
Less than 30 min
12
30 – 60 min
Less than 30 min
Time to reach nearest urban center from the HH
60
50
50
40
30
30
20
10
0
1 - 2 hrs
17
2 - 4 hrs
1
4 - 6 hrs
Less than 1 hr
1
More than 6 hrs
1 - 2 hrs
2 - 4 hrs
4 - 6 hrs
Less than 1 hr
More than 6 hrs
68
Page 1 of 1
Data_Collected_Date
Tuesday, December 2, 2014
Region S.N.N.P
Selected Indicator
Zone GEDEO
Wereda WENAGO
Physical Vulnerability: Access to Electricity - Households access and utilization of
electricity
Household_Located_In_Electricity
36.50
Household_Connected_To Electricity
18.00
69
Page 1 of 1
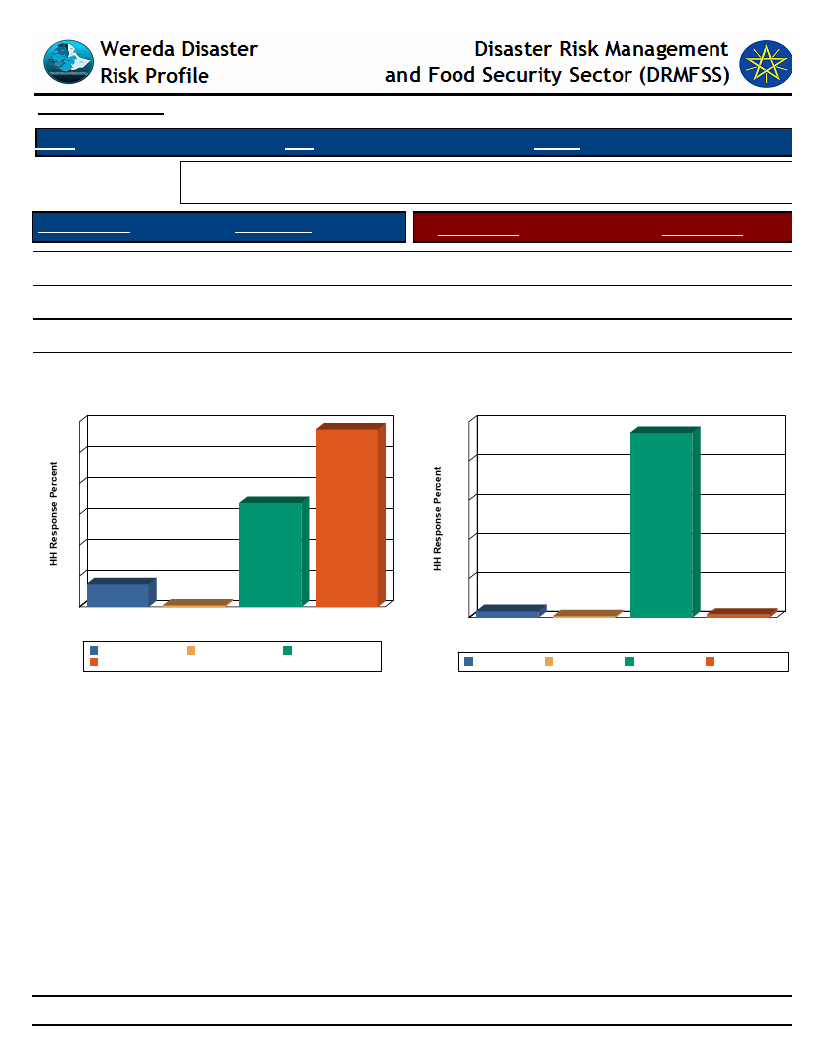
Data_Collected_Date
Tuesday, December 2, 2014
Region S.N.N.P
Selected Indicator
Floor Structure
Zone GEDEO
Wereda WENAGO
Physical Vulnerability: Type of Dwelling Units - Households type of dwelling
houses
HH Response
Type of Floor
HH Response
Tin house
Wood and mud
Bamboo
Brick/stone house
33.76
57.54
7.42
0.51
Concrete
Non-Concrete
DK
NR
3.33
94.36
0.77
1.54
Floor Structure
60
58
50
40
34
30
20
10
7
0
Bamboo
1
Brick/stone
Tin house
houFseloor Structure
Wood and mud
Bamboo
Wood and mud
Brick/stone house Tin house
Type of Floor
100
94
80
60
40
20
3
0
Concrete
Concrete
1
DK
Non-Concrete
Type of Floor
DK
Non-Concrete
2
NR
NR
70
Page 1 of 1
WDRP Indicators
Socio Demographic Characteristics
71

Wereda Disaster
Risk Profile
Data_Collected_Date
Disaster Risk Management and Food
Security Sector (DRMFSS)
Tuesday, December 2, 2014
Region S.N.N.P
Selected Indicator
Kebele Name
GASELCHO
DODORO
TOKOCHA
MEKONISA
DABOTA
KERA SODITY
HASEHARO
WETIKO
BELE BUKISA
Zone GEDEO
Wereda WENAGO
Economic Vulnerability: Level of Migration - Migration level and its characteristics by Kebele
Approx_No. Age_Group
Sex
Migration_Period
Migration Trend
Migration_Reason
1000
18-50
Increased
Economic hardship
1500
400
1500
2000
195
500
1200%
18-40
18-40
18-40
18-40
28-45
18-40
18-45
both
M-330,F-
7
M-1000,F
M-1500,F
-
M-110,F-
8
M-420,F-
8
M&F
Increased
Increased
Increased
Increased
Increased
Increased
Increased
Job opportunities,
loss of assets,
Economics hardship
Economic hard ship
Economic hardship ,
Job opportunity
M-1500,F-500
M-110,F-85
Economic hardship ,
job opportunities
Jobs opportunity ,
loss of assets,
economic hardship
110
8-15,18-45
M
Increased
Job opportunities
,loss of Assets ,
economic hardship
Destination
Rural area
Rural area
Rural area
Rural area
Rural area
Rural area
Rural area
Urban area, yarely town,
rural area, gold mining
shakisso, different place
to ruler
Urban area yavello town,
Gold mining shakes of rural
72
Page 1 of 3
Wereda Disaster
Risk Profile
Data_Collected_Date
Disaster Risk Management and Food
Security Sector (DRMFSS)
Tuesday, December 2, 2014
Region S.N.N.P
Selected Indicator
Kebele Name
TUMATA CHRECHA
HALEMO
SOKICHA
KELECHA
SUGALE
DEKO
BANKO OKOTO
Zone GEDEO
Wereda WENAGO
Economic Vulnerability: Level of Migration - Migration level and its characteristics by Kebele
Approx_No. Age_Group
Sex
Migration_Period
Migration Trend
Migration_Reason
75
250
2000
>600
youth and
working
25-38
25-45
15-30
75 M
M-210,F-
4
M-1200,F
-
M-600
300
15-45
280
30-50
500
20-39
F-50,
250
F-93,M-7
F-200,M-
3
Increased
Increased
Increased
Increased
Increased
Increased
Increased
Land security ,
economic hardship,
job opportunity
Job opportunity ,
loss of assets,
economic hardship
Jobs opportunity,
loss of asset ,
economic hardship
Loss of asses, wild
animal attack,
poverty, land
scarcity, low
production , job
opportunity
Loss of asset , job
opportunity ,
economic hard ship
Land scarcity, job
opportunity ,
economic hard ship
Job opportunity ,
land scarcity,
economic hard ship
Destination
To shakiso, moyalle,
(oromiya region )
To omiya region ( solomon,
bosoto, shakiso, terro )
To oromiya region ( guji,
bolena )
To oromiya region real
area ( dawa )
To urban area and oromia
region ( rural, dawa, to dig
minerals such as gold )
To rural oromiya region to
dig minerals(gold)
To shakiso, dawa, and
different oromiya, region
( rural )
73
Page 2 of 3

Wereda Disaster
Risk Profile
Data_Collected_Date
Disaster Risk Management and Food
Security Sector (DRMFSS)
Tuesday, December 2, 2014
Region S.N.N.P
Selected Indicator
Kebele Name
JEMJEMO
Zone GEDEO
Wereda WENAGO
Economic Vulnerability: Level of Migration - Migration level and its characteristics by Kebele
Approx_No.
850
Age_Group
15-45
Sex
M-700,F-
15
Migration_Period
Migration Trend
Increased
Migration_Reason
Land scarce,
increased,
Population density,
job opportunity
Destination
To oromiya region (
shakiso, dawa ) to gig,
minerals, specially gold
74
Page 3 of 3
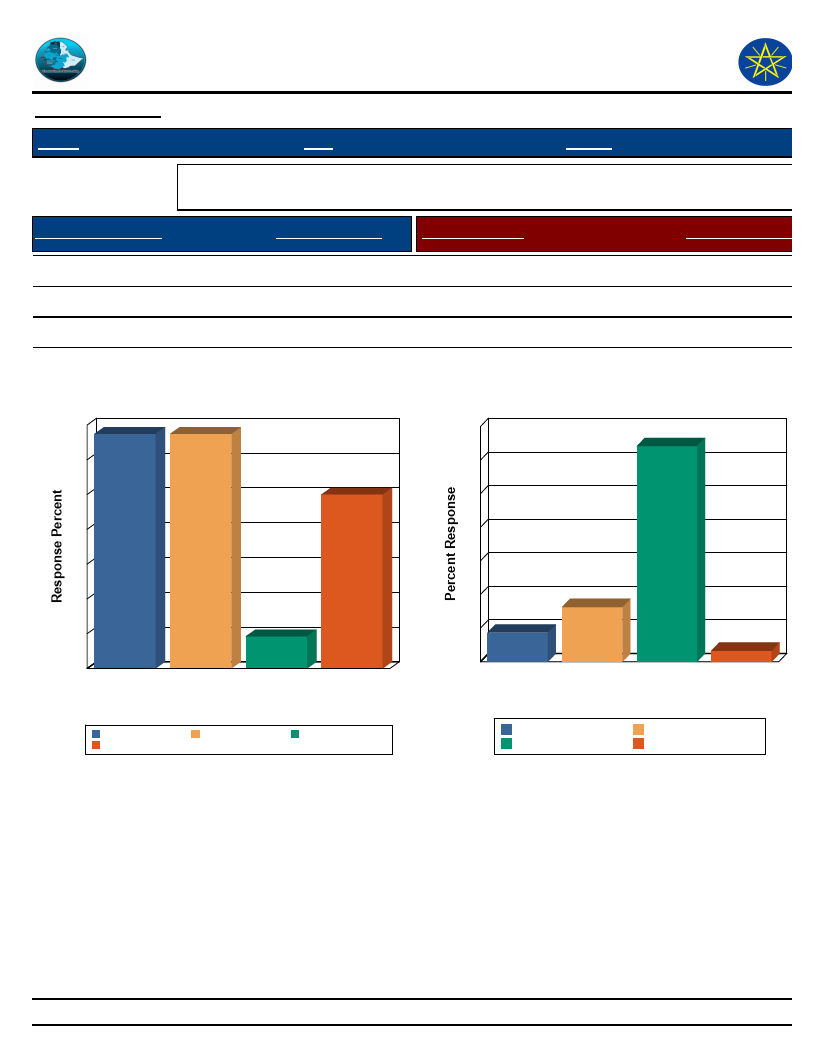
Wereda Disaster
Risk Profile
Data_Collected_Date
Region S.N.N.P
Disaster Risk Management
and Food Security Sector (DRMFSS)
Tuesday, December 2, 2014
Zone
GEDEO
Wereda WENAGO
Selected Indicator
Economic Vulnerability: Household Migration - Household migration and reason
for migration
Duration of Migration
Response Percent
Migration Reason
Response Percent
Less than 2 weeks
Two weeks – month
A month – 3 months
3 – 6 months
4.60
25.00
33.70
33.70
Family reasons
Looking for work
Working elsewhere
Away at school
16.30
64.13
3.26
8.70
Duration of Migration
35
34
34
30
25
25
20
15
10
5
5
0
3–6
months
A month – 3 Less than 2 Two weeks
months
weeks
– month
Duration of Migration
3 – 6 months
Two weeks – month
A month – 3 months
Less than 2 weeks
Migration Reason
70
64
60
50
40
30
20
16
10
9
0
Away at
school
3
Family Looking for
reasons
work
Migration Reason
Working
elsewhere
Away at school
Looking for work
Family reasons
Working elsewhere
75
Page 1 of 1
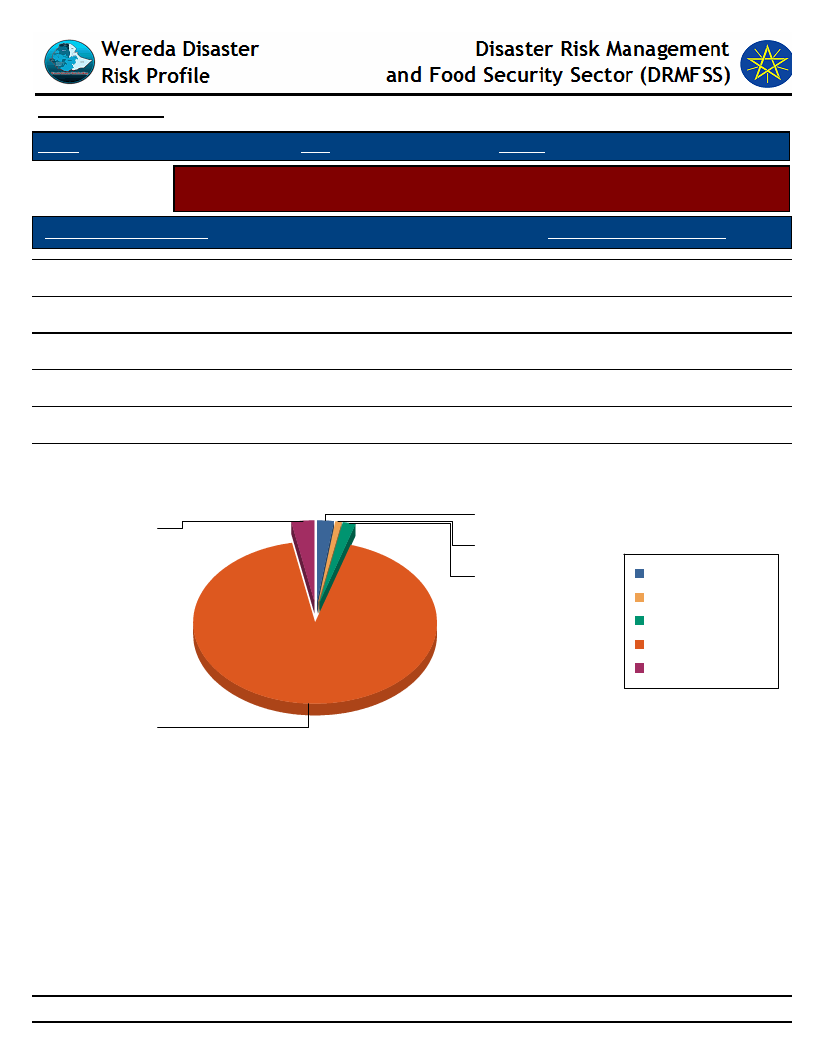
Data_Collected_Date
Tuesday, December 2, 2014
Region S.N.N.P
Zone GEDEO
Wereda WENAGO
Selected Indicator
Economic Vulnerability: Household Migration - Disasters as a triggering factor for
migration (households response in %)
Is Migration Due to Hazard?
HH Response - Due To Hazard
NA
DK
Migration partly because of such impacts
No
Yes
1.80
2.10
0.90
92.19
3.00
Is Migration Due to Hazard?
DK
Yes
2.1
3
Migration partly because of such
impacts
0.9
NA
DK
1.8
Migration partly because
of such impacts
NA
No
Yes
No
92.2
76
Page 1 of 1
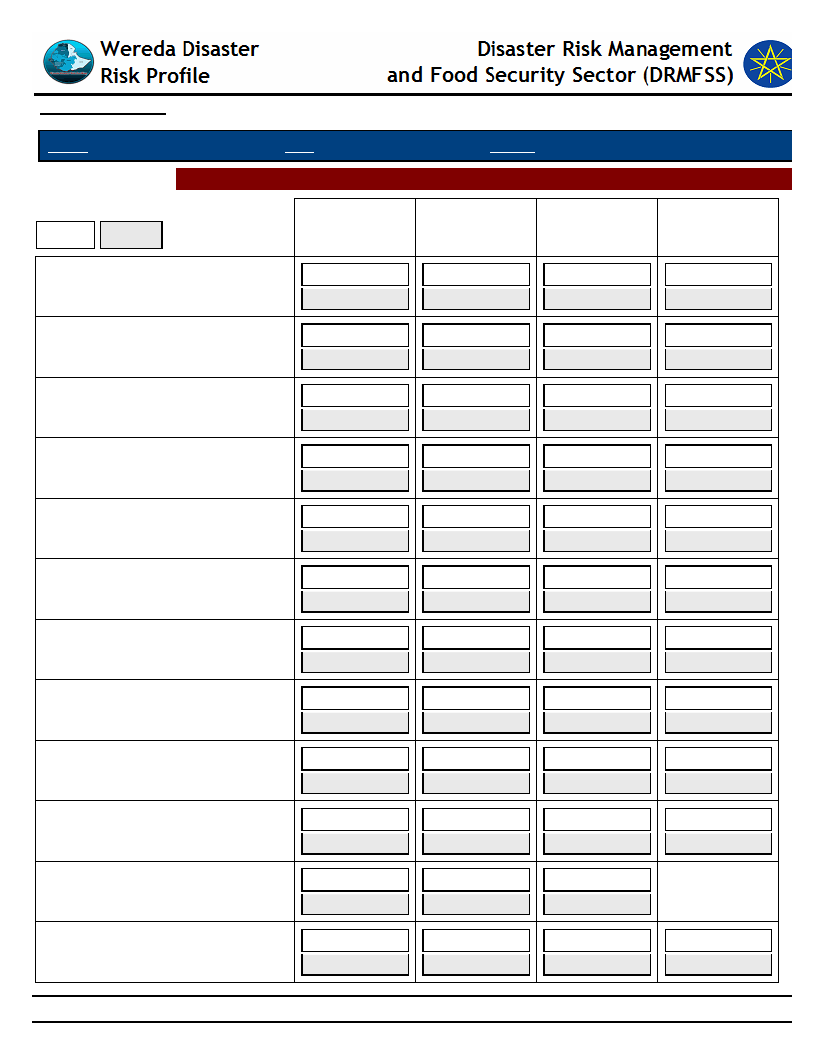
Data_Collected_Date
Region S.N.N.P
Zone GEDEO
Selected Indictor: Demography: Population Structure
KEY:
Male
Female
Children
(0-12 yrs)
BANKO OKOTO
40
60
BELE BUKISA
22
25
DABOTA
7
8
DEKO
45
55
DODORO
11
11
GASELCHO
15
19
HALEMO
46
54
HASEHARO
11
13
JEMJEMO
45
55
KELECHA
45
55
KERA SODITY
18
21
MEKONISA
22
24
Wereda WENAGO
Tuesday, December 2, 2014
Older (Above
55 yrs)
42
58
3
3
5
7
42
58
5
4
3
4
46
54
7
4
65
35
50
50
8
6
17
19
Working
(25-55 yrs)
45
55
14
16
24
31
50
50
18
20
6
8
44
56
15
18
48
52
50
50
13
11
27
29
Youth (12-25
yrs)
45
55
12
13
9
10
35
65
14
16
16
25
47
53
13
14
40
60
45
55
23
25
77
Page 1 of 2
Data_Collected_Date
Region S.N.N.P
Zone GEDEO
Selected Indictor: Demography: Population Structure
Children
(0-12 yrs)
SOKICHA
45
55
SUGALE
40
60
TOKOCHA
22
22
TUMATA CHRECHA
45
55
WETIKO
11
13
Wereda WENAGO
Tuesday, December 2, 2014
Older (Above
55 yrs)
5
50
43
57
5
4
50
50
6
8
Working
(25-55 yrs)
50
50
47
43
4
13
50
50
16
18
Youth (12-25
yrs)
40
60
45
50
14
17
40
60
13
14
78
Page 2 of 2
Data_Collected_Date
Region S.N.N.P
Zone GEDEO
Wereda
Selected Indicator
Demography: Population Trends and Ethnic Groups
Kebele Name
Population Change Trend
Population Change Reasons
Tuesday, December 2, 2014
WENAGO
Ethnic_Groups
GASELCHO
DODORO
TOKOCHA
MEKONISA
DABOTA
KERA SODITY
HASEHARO
WETIKO
BELE BUKISA
TUMATA CHRECHA
HALEMO
SOKICHA
KELECHA
SUGALE
DEKO
BANKO OKOTO
JEMJEMO
Increased
Increased
Increased
Increased
Increased
Increased
Increased
Increased
Increased
Increased
Increased
Increased
Increased
Increased
Increased
Increased
Increased
youth
Younger
Youth
Youth
Youth
Youth
Youth
Youth
Youth
Youth and child
Child
Children
Children and
youth
Children
Children
Children
Youth
79
Page 1 of 1

Data_Collected_Date
Tuesday, December 2, 2014
Region S.N.N.P
Zone
GEDEO
Wereda WENAGO
Selected Indicator
Social Vulnerability: Household Demographic Characteristics - Demographic
characteristics of households
Demographic Indicator
Indicator_Value Comments
Average household size
7
Sex ratio
982 Number of males divided by number of females
Child sex ratio (under 14 yrs)
Adult sex ratio (18 & Above yrs)
Dependency ratio ([(0-14)+(64+)] / (15-64)
yrs)
1,009 Sex ration for the population whose age is
below 14 years
980 Sex ratio for the population whose age is 18 and
above years
1
80
Page 1 of 1
Wereda Disaster
Risk Profile
Disaster Risk Management and Food
Security Sector (DRMFSS)
Data_Collected_Date
Tuesday, December 2, 2014
Region S.N.N.P
Zone
GEDEO
Wereda WENAGO
Selected Indicator
Social Vulnerability: Level of Educational Attainment - Education status of household members
General Awareness
Percentage Educational Level
Percentage
Read and understand text - Easily
2.60
From Proportion of population (7+) - Less than 1st grade
46.27
Read and understand text - with difficulty
4.50
From Proportion of population (7+) - Primary (1-6)
41.22
Can write letters - easily
1.50
From Proportion of population (7+) - Secondary (7-12)
11.46
Can write letters - with difficulty
General Literacy Rate
Proportion of literate population (7+) to total 7+
population
3.90
From Proportion of population (7+) - Technical
Percentage
3.10
Adult Literacy Rate
Proportion of literate population (15+) to total 15+
population
0.68
Percentage
4.20
81
Page 1 of 1

Data_Collected_Date
Tuesday, December 2, 2014
Region S.N.N.P
Zone GEDEO
Wereda WENAGO
Selected Indicator
Social Vulnerability: Gender Parity - Gender parity in education level (7+ years)
and household heading
Educational Level
Male_Percent
Female_Percent
From Proportion of population (7+) - Less than 1st grade
35.55
64.45
From Proportion of population (7+) - Primary (1-6)
60.69
39.31
From Proportion of population (7+) - Secondary (7-12)
75.27
24.73
From Proportion of population (7+) - Technical
100.00
0.00
From Proportion of population (7+) - Pursuing or completed
University
Male Head of HH
83.40
100.00
Female Head of HH
0.00
16.60
82
Page 1 of 1
WDRP Indicators
Environmental Characteristics
83

Data_Collected_Date
Tuesday, December 2, 2014
Region S.N.N.P
Zone GEDEO
Wereda WENAGO
Selected Indicator
Environmental Situation: Environmental Problems - Major environmental
problems by Kebele
KebeleName
Problem_1
Problem_2
Problem_3
Problem4
GASELCHO
DODORO
TOKOCHA
Pests
Pests
Land slide, pollution
Land slide, water
pollution
Deforestation
Land slide, pollution
Soil erosion
Land slide, water
pollution
Erosion
MEKONISA
Water pollution
Pest
DABOTA
KERA SODITY
Soil erosion
Erosion
Land slide, water
pollution
Deforestation
Pest
Pollution
WETIKO
Deforestation
Erosion
Pollution
BELE BUKISA
Deforestation
Erosion
pollution
TUMATA CHRECHA
Deforestation
Soil erosion
HALEMO
Deforestation
Soil erosion
Water pollution
SOKICHA
Soil erosion
Soil erosion
KELECHA
Soil erosion
Deforestation
SUGALE
Soil erosion
Deforestation
Water, pollution
Pests
DEKO
Soil erosion
Deforestation
Water pollution
Land slide
BANKO OKOTO
Land slide
Soil erosion
Water pollution
Deforestation
JEMJEMO
Water pollution
Soil erosion
Deforestation
84
Page 1 of 1
Data_Collected_Date
Tuesday, December 2, 2014
Region S.N.N.P
Selected Indicator
KebeleName
Zone GEDEO
Wereda WENAGO
Environmental Situation: Deforestation - Observed changes over levels of
deforestation by the community and its problems
Changes_Observed
Problems_Due_To_Changes
GASELCHO
DODORO
Increasing
Over population, more construction
GASELCHO
Increasing
Over population, have more construction
MEKONISA
DABOTA
Increasing
Increasing
Not planted additional plant, not forestation, over
population
Over population, more construction
KERA SODITY
Increasing
Over population, more construction
HASEHARO
Increasing
Over population, more constructor, use fire wood
WETIKO
Decreasing
Population size Increasing, lack of plant indigenous tress
BELE BUKISA
Decreasing
Population size Increasing, lack of plant indigenous tress
TUMATA CHRECHA
Increasing
Increased soil erosion, climatically change
HALEMO
Increasing
Climatic change, increase soil erosion
SOKICHA
Increasing
Climatic change, soil erosion
SUGALE
Increasing
Climatic change , soil erosion
DEKO
Increased
Soil erosion , famine, drought, less food
BANKO OKOTO
Increased
Soil erosion , famine, drought, less food
JEMJEMO
Increasing
Soil erosion, decreased production, drought and famine
85
Page 1 of 1
Wereda Disaster
Risk Profile
Data_Collected_Date
Disaster Risk Management
and Food Security Sector (DRMFSS)
Tuesday, December 2, 2014
Region S.N.N.P
Zone GEDEO
Wereda
WENAGO
Selected Indicator
Environmental Situation: Natural Resources Availability - Natural resources available and changes observed by
the community
KebeleName
GASELCHO
Resources_1
Land
Resources_3
Observed_Change_1
Decreasing
Observed_Change_3
Problems_Changes_1
depredation
Problems_Changes_3
Resources_2
Observed_Change_2
Problems_Changes_2
Water
Decreasing
Shortage of rain fall
Resources_4
Observed_Change_4
Problems_Changes_4
KebeleName
DODORO
Resources_1
Land
Observed_Change_1
Decreasing
Problems_Changes_1
Water
Resources_2
Observed_Change_2
Problems_Changes_2
Decreasing
Seasonal problem
Forest
Resources_3
Observed_Change_3
Problems_Changes_3
Resources_4
Observed_Change_4
Problems_Changes_4
86
Page 1 of 9

Wereda Disaster
Risk Profile
Data_Collected_Date
Disaster Risk Management
and Food Security Sector (DRMFSS)
Tuesday, December 2, 2014
Region S.N.N.P
Zone GEDEO
Wereda
WENAGO
Selected Indicator
Environmental Situation: Natural Resources Availability - Natural resources available and changes observed by
the community
KebeleName
TOKOCHA
Resources_1
Land
Resources_3
Observed_Change_1
Decreasing
Observed_Change_3
Problems_Changes_1
Not enough land
Problems_Changes_3
Resources_2
Observed_Change_2
Problems_Changes_2
Water
Decreasing
Not enough land
Resources_4
Observed_Change_4
Problems_Changes_4
KebeleName
MEKONISA
Resources_1
Land
Observed_Change_1
Decreasing
Problems_Changes_1
Shortage of land
Resources_2
Observed_Change_2
Problems_Changes_2
Water
Decreasing
Deforestation, shortage of rain fall
Resources_3
Observed_Change_3
Problems_Changes_3
Resources_4
Observed_Change_4
Problems_Changes_4
87
Page 2 of 9

Wereda Disaster
Risk Profile
Data_Collected_Date
Disaster Risk Management
and Food Security Sector (DRMFSS)
Tuesday, December 2, 2014
Region S.N.N.P
Zone GEDEO
Wereda
WENAGO
Selected Indicator
Environmental Situation: Natural Resources Availability - Natural resources available and changes observed by
the community
KebeleName
DABOTA
Resources_1
Land
Resources_3
Observed_Change_1
Decreasing
Observed_Change_3
Problems_Changes_1
High population density
Problems_Changes_3
Resources_2
Observed_Change_2
Problems_Changes_2
Water
Decreasing
Shortage of rain fall , seasonal problem
Resources_4
Observed_Change_4
Problems_Changes_4
KebeleName
KERA SODITY
Resources_1
Land
Observed_Change_1
Decreasing
Problems_Changes_1
Loss of fertility
Resources_2
Observed_Change_2
Problems_Changes_2
Water
Decreasing
Deforestation
Resources_3
Observed_Change_3
Problems_Changes_3
Resources_4
Observed_Change_4
Problems_Changes_4
88
Page 3 of 9

Wereda Disaster
Risk Profile
Data_Collected_Date
Disaster Risk Management
and Food Security Sector (DRMFSS)
Tuesday, December 2, 2014
Region S.N.N.P
Zone GEDEO
Wereda
WENAGO
Selected Indicator
Environmental Situation: Natural Resources Availability - Natural resources available and changes observed by
the community
KebeleName
HASEHARO
Resources_1
Land
Resources_3
Observed_Change_1
Decreasing
Observed_Change_3
Problems_Changes_1
Degraded
Problems_Changes_3
Resources_2
Observed_Change_2
Problems_Changes_2
Water
Decreasing
Deforestation , shortage of rain fall
Resources_4
Observed_Change_4
Problems_Changes_4
KebeleName
WETIKO
Resources_1
Land
Observed_Change_1
Decreasing
Problems_Changes_1
Erosion , degraded
Resources_2
Observed_Change_2
Problems_Changes_2
Water
Decreasing
Deforestation
Resources_3
Observed_Change_3
Problems_Changes_3
Resources_4
Observed_Change_4
Problems_Changes_4
89
Page 4 of 9

Wereda Disaster
Risk Profile
Data_Collected_Date
Disaster Risk Management
and Food Security Sector (DRMFSS)
Tuesday, December 2, 2014
Region S.N.N.P
Zone GEDEO
Wereda
WENAGO
Selected Indicator
Environmental Situation: Natural Resources Availability - Natural resources available and changes observed by
the community
KebeleName
BELE BUKISA
Resources_1
Land
Resources_3
Observed_Change_1
Decreasing
Observed_Change_3
Problems_Changes_1
Population density
Problems_Changes_3
Resources_2
Observed_Change_2
Problems_Changes_2
water
Water pollution
Decreasing water / sanitation
Resources_4
Observed_Change_4
Problems_Changes_4
KebeleName
Resources_1
TUMATA CHRECHA
Forest / Agro forest
Observed_Change_1
Decreasing
Problems_Changes_1
Resources_2
Climatically change, soil erosion, land
slide
Water
Observed_Change_2
Decreasing
Problems_Changes_2
Shortage of water, during winter
Resources_3
Observed_Change_3
Problems_Changes_3
Resources_4
Observed_Change_4
Problems_Changes_4
90
Page 5 of 9

Wereda Disaster
Risk Profile
Data_Collected_Date
Disaster Risk Management
and Food Security Sector (DRMFSS)
Tuesday, December 2, 2014
Region S.N.N.P
Zone GEDEO
Wereda
WENAGO
Selected Indicator
Environmental Situation: Natural Resources Availability - Natural resources available and changes observed by
the community
KebeleName
HALEMO
Resources_1
Agro forestry
Resources_3
Observed_Change_1
Decreasing
Observed_Change_3
Problems_Changes_1
Soil erosion, climatically change
Problems_Changes_3
Resources_2
Observed_Change_2
Problems_Changes_2
Resources_4
Observed_Change_4
Problems_Changes_4
KebeleName
SOKICHA
Resources_1
Water
Observed_Change_1
Decreasing
Problems_Changes_1
Shortage of water during winter
Resources_2
Observed_Change_2
Problems_Changes_2
Resources_3
Observed_Change_3
Problems_Changes_3
Resources_4
Observed_Change_4
Problems_Changes_4
91
Page 6 of 9

Wereda Disaster
Risk Profile
Data_Collected_Date
Disaster Risk Management
and Food Security Sector (DRMFSS)
Tuesday, December 2, 2014
Region S.N.N.P
Zone GEDEO
Wereda
WENAGO
Selected Indicator
KebeleName
Environmental Situation: Natural Resources Availability - Natural resources available and changes observed by
the community
KELECHA
Resources_1
Observed_Change_1
Ago forestry
Decreasing
Resources_3
Observed_Change_3
Problems_Changes_1
Resources_2
Soil erosion, loss of soil fertility, land
slide
Problems_Changes_3
Resources_4
Observed_Change_2
Observed_Change_4
Problems_Changes_2
Problems_Changes_4
KebeleName
Resources_1
SUGALE
Water
Observed_Change_1
Decreasing
Problems_Changes_1
Resources_2
Dry spring , river, ponds, water born
disease
Temperature
Observed_Change_2
Increasing
Problems_Changes_2
Environmental change, desert, flood, act,
Resources_3
Observed_Change_3
Problems_Changes_3
Resources_4
Observed_Change_4
Problems_Changes_4
92
Page 7 of 9

Wereda Disaster
Risk Profile
Data_Collected_Date
Disaster Risk Management
and Food Security Sector (DRMFSS)
Tuesday, December 2, 2014
Region S.N.N.P
Zone GEDEO
Wereda
WENAGO
Selected Indicator
Environmental Situation: Natural Resources Availability - Natural resources available and changes observed by
the community
KebeleName
DEKO
Resources_1
Water
Resources_3
Observed_Change_1
Decreasing
Observed_Change_3
Problems_Changes_1
Water scarcity
Problems_Changes_3
Resources_2
Observed_Change_2
Problems_Changes_2
Land
Decreasing
Loss of production and income
Resources_4
Observed_Change_4
Problems_Changes_4
KebeleName
BANKO OKOTO
Resources_1
Forest
Observed_Change_1
Decreasing
Problems_Changes_1
Air pollution , soil erosion
Resources_2
Observed_Change_2
Problems_Changes_2
Water
Decreasing
Water, scarcity, water, born disease
Resources_3
Observed_Change_3
Problems_Changes_3
Resources_4
Observed_Change_4
Problems_Changes_4
93
Page 8 of 9
Wereda Disaster
Risk Profile
Data_Collected_Date
Disaster Risk Management
and Food Security Sector (DRMFSS)
Tuesday, December 2, 2014
Region S.N.N.P
Zone GEDEO
Wereda
WENAGO
Selected Indicator
Environmental Situation: Natural Resources Availability - Natural resources available and changes observed by
the community
KebeleName
JEMJEMO
Resources_1
Land
Resources_3
Observed_Change_1
Decreasing
Observed_Change_3
Problems_Changes_1
Land scarcity, migration
Problems_Changes_3
Resources_2
Observed_Change_2
Problems_Changes_2
Water
Decreasing
Water scarcity, water pollution, water born
disease
Resources_4
Observed_Change_4
Problems_Changes_4
94
Page 9 of 9

Wereda Disaster
Risk Profile
Data_Collected_Date
Disaster Risk Management
and Food Security Sector (DRMFSS)
Tuesday, December 2, 2014
Region S.N.N.P
Selected Indicator
Zone GEDEO
Wereda WENAGO
Environmental Situation: Rainfall & Temperature - Observed changes on rainfall and temperature by the
community over the last decade
Rainfall
Temperature
Kebele Name
GASELCHO
DODORO
TOKOCHA
MEKONISA
DABOTA
KERA SODITY
HASEHARO
WETIKO
BELE BUKISA
TUMATA
CHRECHA
HALEMO
SOKICHA
KELECHA
Changes Observed Problems
Deceasing
Deforestation
Deceasing
Deforestation
Decreasing
High construction , not Afforestation
Decreasing
Deforestation
Decreasing
Deforestation seasonal problem
Decreasing
Deforestation
Decreasing
Deforestation
Deceasing
Decreasing
Climatically change, food shortage,
loss of production
Climatically change , deforestation
Moderate
Delay farm calendar
Decreasing
Moderate
Moderate
Delay farm calendar
Delay farm calendar
Climatic change , delay farm
calendar
Changes Observed
Problems
Increasing
Climatic change
Increasing
Climatic change
Moderate
Climate change seasonal problem
Moderate
Climate change , seasonal problem
Moderate
Climate change
Moderate
Climatic change, seasonal problem
Deforestation
Climatically change ,seasonal problem
Increasing
Increasing
Deforestation , global warming ,
climatically change
Climatically change , deforestation
Moderate
delay rain fall period
Increasing
Increasing
Increasing
Delay farm calendar
Delay rain fall period
Climatic change , delay rain fall period
95
Page 1 of 2
Wereda Disaster
Risk Profile
Data_Collected_Date
Disaster Risk Management
and Food Security Sector (DRMFSS)
Tuesday, December 2, 2014
Region S.N.N.P
Selected Indicator
Zone GEDEO
Wereda WENAGO
Environmental Situation: Rainfall & Temperature - Observed changes on rainfall and temperature by the
community over the last decade
Rainfall
Temperature
Kebele Name
SUGALE
DEKO
BANKO OKOTO
JEMJEMO
Changes Observed Problems
Deceasing
Deceasing
Deceasing
Deceasing
Food, shortage , dryness of river ,
ponds
Dryness of spring river, pond,
decreased production
Dryness of spring , rivers, lack of
food
Dryness of springs, ponds, rivers,
decreased production and
productivity
Changes Observed
Problems
Increasing
Drought , famine, desert
Increasing
Increasing
increased, desert, dryness of rivers,
ponds, lakes, climate change
Deforestation , environment pollution
Increasing
Increase desert, dryness, of rivers, ponds,
lakes
96
Page 2 of 2

Data_Collected_Date
Tuesday, December 2, 2014
Region S.N.N.P
Zone GEDEO
Wereda WENAGO
Selected Indicator
KebeleName
Environmental Situation: Reasons for Environmental Changes
Reason_For_Environmental_Changes
KERA SODITY
Deforestation , over population
HASEHARO
Decrease forest , increase population density
BELE BUKISA
TUMATA CHRECHA
Highly increasing of population, global warning, shortage of rain, loss of
production, shortage of food
Over population, deforestation
HALEMO
Deforestation , over population, high poverty
SOKICHA
Deforestation, over population, high poverty
KELECHA
Over population, deforestation
SUGALE
Over population, water pollution, land slide, deforestation
GASELCHO
Deforestation , Increase the size of population
DODORO
Decrease the Size of forest, increase population density
TOKOCHA
Over population, deforestation
MEKONISA
High population density, Deforestation, over grazing
DABOTA
Deforestation , over population
DEKO
Land slide, water pollution, deforestation, over population
JEMJEMO
BANKO OKOTO
Lack of awareness and personal hygiene, environmental sanitation,
population growth , pollution , deforestation
Over population, deforestation, water pollution, land slide
97
Page 1 of 1

Data_Collected_Date
Tuesday, December 2, 2014
Region S.N.N.P
Zone GEDEO
Wereda WENAGO
Selected Indicator
KebeleName
Environmental Situation: Soil Erosion - Observed changes on levels of soil erosion
by the community
Changes_Observed
Problems_Observed
GASELCHO
DODORO
TOKOCHA
MEKONISA
DABOTA
KERA SODITY
HASEHARO
WETIKO
BELE BUKISA
TUMATA CHRECHA
HALEMO
SOKICHA
KELECHA
SUGALE
DEKO
BANKO OKOTO
JEMJEMO
Decreasing
Decreasing
Decreasing
Increasing
Increasing
Increasing
Increasing
Increasing
increasing
Increasing
Increasing
Increasing
Increasing
Increasing
Increasing
Increasing
Increasing
Do not make terrace, over grazing
Do not make terrace, over grazing, have not enough
forestation
Do not make tracing do not planted different kind of
plant
Have not enough afforesting , do not make trace, over
grazing
Do not make trace, over grazing
Over graining , do not make tracing
Deforestation , do not make trace, over grazing
Population size in area dense lack of soil management
lack of water shade , lack of drain age, ridges
Cut of drain, afforestation, soil management
Loss of soil fertility, low production
Loss of soil fertility, low production
Loss soil fertility, low production
Loss of soil fertility, low productivity
Decreasing production and productivities, drought,
famine, loss of soil fertility
Loss of soil fertility, drought
Loss of soil fertility, drought, food shortage
Soil infertility, food shortage, famine, drought
98
Page 1 of 1
WDRP Indicators
Livelihood, Occupation and Source
of Food Characteristics
99

Wereda Disaster
Risk Profile
Data_Collected_Date
Disaster Risk Management and Food
Security Sector (DRMFSS)
Tuesday, December 2, 2014
Region S.N.N.P
Zone
GEDEO
Wereda WENAGO
Selected Indicator
Economic Vulnerability: Major Occupational Categories - Major categories of occupation and percent of population
engaged in the occupation by Kebele
Occupational Categories and Percent of Population engaged within these occupational categories
Percent (%) of Population
KebeleName
Occupation 1
Population Occupation 2
Population Occupation 3
Population Occupation 4
Population
GASELCHO
Agricultural
85
Trade
5
Hand craft
5
DODORO
Agricultural
85
Hand craft
5
Labour
10
TOKOCHA
Agricultural
100%
MEKONISA
Agricultural
85
Agricultural
10
Trade
5
DABOTA
Agricultural
85% Trade
10%
Labour
5%
KERA SODITY
Agricultural
80%
Hand craft
5%
Labour
10%
Trade
5%
HASEHARO
Agricultural
80% Trade
10%
Labour
10%
WETIKO
Coffee production
85% Enset
70%
BELE BUKISA
Coffee production
80% Enset
70%
Sweet potato
40%
Godare / tarro
30%
TUMATA CHRECHA
Agricultural
85% Daily
5%
Petty trading
10%
HALEMO
Agricultural
85
Daily labour
10
Hand craft
SOKICHA
Agricultural
90
Daily labour
5
Petty trade
5
100
Page 1 of 2

Wereda Disaster
Risk Profile
Data_Collected_Date
Disaster Risk Management and Food
Security Sector (DRMFSS)
Tuesday, December 2, 2014
Region S.N.N.P
Zone
GEDEO
Wereda WENAGO
Selected Indicator
Economic Vulnerability: Major Occupational Categories - Major categories of occupation and percent of population
engaged in the occupation by Kebele
Occupational Categories and Percent of Population engaged within these occupational categories
Percent (%) of Population
KebeleName
Occupation 1
Population Occupation 2
Population Occupation 3
Population Occupation 4
Population
KELECHA
Agricultural
90
Petty trade
3
Daily labour
7
SUGALE
DEKO
Agricultural &
livestock production
Agricultural
75
Petty trading
85
Daily labour
5
Daily labour
20
10
Petty trading
5
BANKO OKOTO
Agricultural
60
Daily labour
30
Petty trading
10
JEMJEMO
Agricultural
90
Daily labour
5
Petty trading
5
101
Page 2 of 2

Data_Collected_Date
Tuesday, December 2, 2014
Region S.N.N.P
Zone GEDEO
Wereda WENAGO
Selected Indicator
Economic Vulnerability: Livelihoods - Households important sources of
livelihood (response in %)
Type of Livelihood Activity
Order of Importnce
Agricultural laborer
1st
2nd
3rd
7.18
12.42
3.81
Animal herder
0.00
1.01
0.00
Barber or Hairdresser
0.26
0.00
0.95
Basket-making, Mat-making
0.51
1.34
1.34
Begging activities
0.51
0.00
0.95
Buying and selling livestock (cattle, sheep, goats, camels)
0.51
4.03
0.95
Carpenter, Furniture-maker, or Metal-worker
0.26
2.68
0.95
Construction worker (masonry)
0.00
0.34
0.00
Daily laborer
20.77
29.87
11.43
Making jewellery
0.26
0.00
0.00
Making traditional utensils or farm tools
0.51
0.34
0.00
Others
58.97
17.79
36.19
Pottery
0.00
0.67
0.00
102
Page 1 of 3

Data_Collected_Date
Tuesday, December 2, 2014
Region S.N.N.P
Zone GEDEO
Wereda WENAGO
Selected Indicator
Economic Vulnerability: Livelihoods - Households important sources of
livelihood (response in %)
Type of Livelihood Activity
Order of Importnce
1st
2nd
3rd
Rearing & selling animals (camels, cattle, sheep, goats)
0.77
2.01
4.76
Religious teacher
0.26
0.34
0.00
Restaurant or hotel worker
0.51
0.00
0.00
Salaried job
1.03
2.68
0.95
Sale_Of_Natural_Products - Firewood
0.77
0.00
3.81
Sale_Of_Natural_Products - Incense, frankincense, and natural gum
0.00
0.34
0.95
Sale_Of_Natural_Products - Precious stones (gold, gem-stones)
0.00
0.00
0.95
Sale_Of_Natural_Products - Water
0.26
0.00
0.95
Selling Building materials and hardware
0.00
0.34
0.00
Selling Cereal food crops (sorghum, maize, wheat, barley)
2.82
2.01
1.90
Selling Clothes and shoes
0.00
0.34
0.95
Selling cooked food
0.00
0.67
0.95
Selling dairy products (milk, butter, ghee, cheese)
0.00
3.02
0.00
103
Page 2 of 3

Data_Collected_Date
Tuesday, December 2, 2014
Region S.N.N.P
Zone GEDEO
Wereda WENAGO
Selected Indicator
Economic Vulnerability: Livelihoods - Households important sources of
livelihood (response in %)
Type of Livelihood Activity
Order of Importnce
1st
2nd
3rd
Selling eggs (from own chickens) Beekeeping (selling honey,
0.00
1.01
2.86
Selling fruit juice (orange, etc) or soft drink (Fanta, etc)
0.51
0.51
0.00
Selling Fruits (mango, papaya, banana, orange, lemon, etc.)
0.51
1.68
4.76
Selling hides and skins (from goats, sheep, cattle)
0.00
0.00
0.95
Selling meat (from own livestock)
0.00
1.01
0.00
Selling Other foods (sugar, flour, coffee, etc.)
1.03
4.36
3.81
Selling Pulses (beans, cow-pea, chick-pea)
0.26
0.67
0.95
Selling Root crops (Irish potato, sweet potato)
1.03
3.02
3.81
Selling tea, coffee, cake, bread, “areki”, “tella”
0.26
0.26
0.26
Selling Vegetables (onion, tomato, cabbage, pumpkin, etc.)
0.00
1.34
3.81
Traditional birth attendant (TBA)
0.00
0.67
0.00
Traditional healer
0.00
1.01
0.00
Weaving, Knitting, Embroidery, Tailoring
0.00
0.67
0.00
104
Page 3 of 3

Data_Collected_Date
Tuesday, December 2, 2014
Region S.N.N.P
Zone GEDEO
Wereda WENAGO
Selected Indicator
Economic Vulnerability: Occupational Categories - Percent of population
above 15 years age by occupation categories
Type of Livelihood Activity
Main Occupation
Secondary Occupation
1 Below school age children
10 Craftsman
11 Shopkeeper and Petty trade
12 Home-maker (housewife)
13 Salaried
14 Chronically ill
15 Physically disabled
16 Others (specify)
2 Student
3 Unemployed & seeking work
4 Neither studying nor working nor seeking work
5 Retired/ Old
6 Cultivator
7 Agricultural labourer
8 Livestock rearing
9 Non-agricultural labour
None
1st Occupation
0.11
0.95
1.38
21.90
0.85
0.21
0.11
0.63
14.81
3.07
0.74
1.16
45.93
2.65
0.53
4.97
0.00
2nd Occupation
0.00
3.68
9.89
20.91
1.90
0.00
0.00
0.25
2.15
2.15
0.51
1.27
20.28
11.03
2.15
15.97
5.45
105
Page 1 of 1
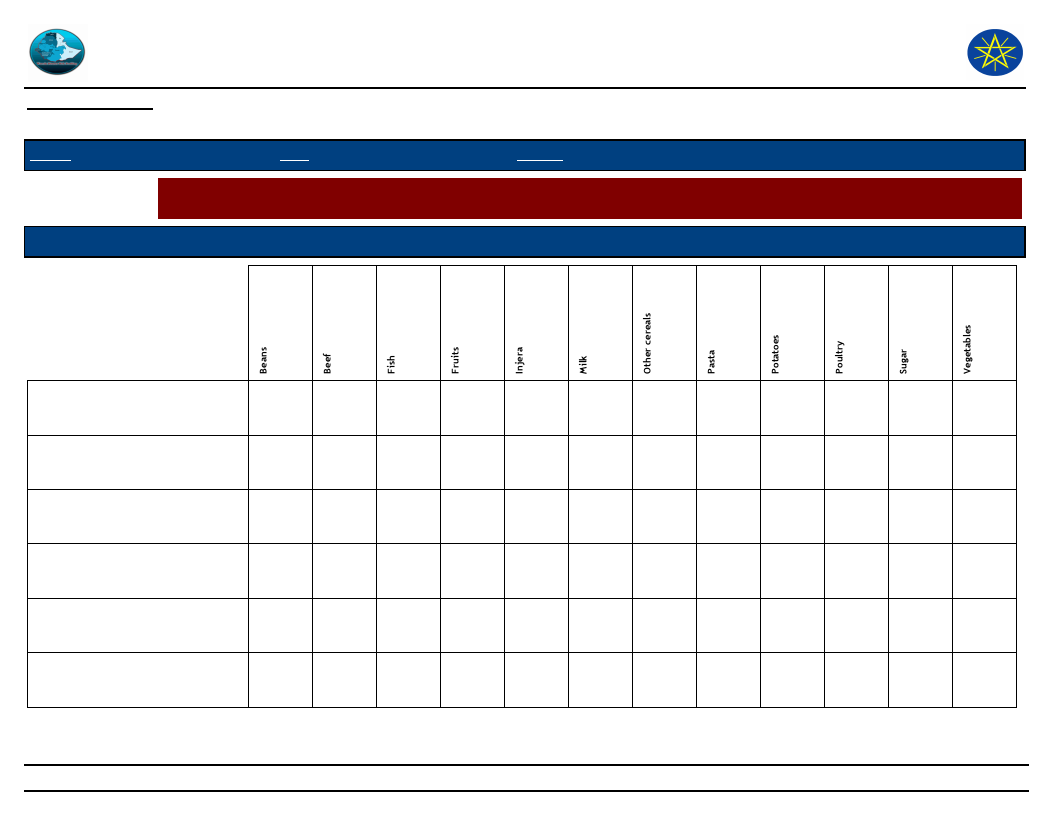
Wereda Disaster
Risk Profile
Data_Collected_Date
Disaster Risk Management
and Food Security Sector (DRMFSS)
Tuesday, December 2, 2014
Region S.N.N.P
Zone GEDEO
Wereda WENAGO
Economic Vulnerability: Sources of Food - Households source for different food items (response in %)
Selected Indictor:
Source of Food
Types of Food Item
Begging
Borrowed
Casual labor
Free meals/Food assistance
Gifts from friends/neighbors
Other
26.70
14.60
0.50
0.50
0.40
1.10
21.10
32.20
3.00
32.50
3.80
30.00
12.50
16.10
21.20
0.40
3.00
35.00
1.60
0.50
9.10
106
Page 1 of 2
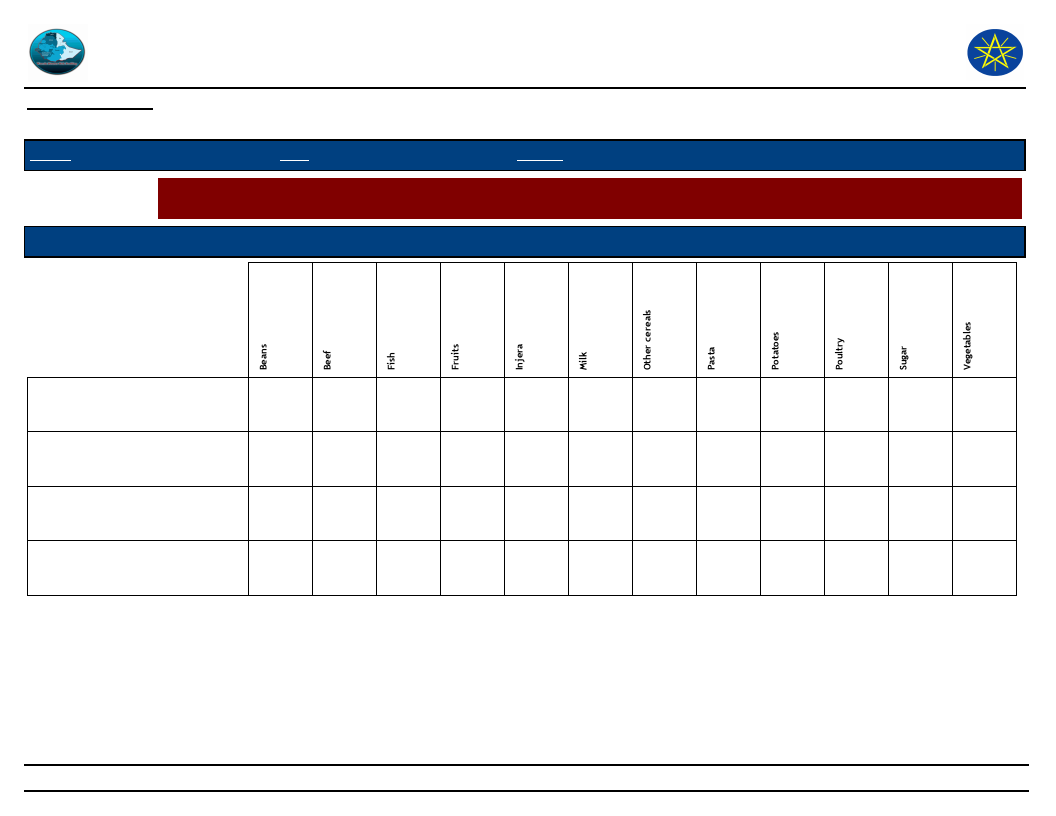
Wereda Disaster
Risk Profile
Data_Collected_Date
Disaster Risk Management
and Food Security Sector (DRMFSS)
Tuesday, December 2, 2014
Region S.N.N.P
Zone GEDEO
Wereda WENAGO
Economic Vulnerability: Sources of Food - Households source for different food items (response in %)
Selected Indictor:
Source of Food
Types of Food Item
Own cultivation/production
Purchase from roadside
vendor/tuck shop
Purchase subsidized food
from Kebele shop
Purchases from main shop
11.10
3.40
26.70
12.10
17.50
9.10
10.00
25.00
9.70
21.20
37.80
78.60 100.00
35.60
36.40
87.50
62.70
63.60
55.00
50.00
45.20
52.70
8.90
1.50
24.20
97.50
2.70
5.00
12.50
3.20
2.40
15.60
1.50
4.40
21.20
40.00
5.90
18.20
25.80
1.20
107
Page 2 of 2
WDRP Indicators
Crop Production Characteristics
108
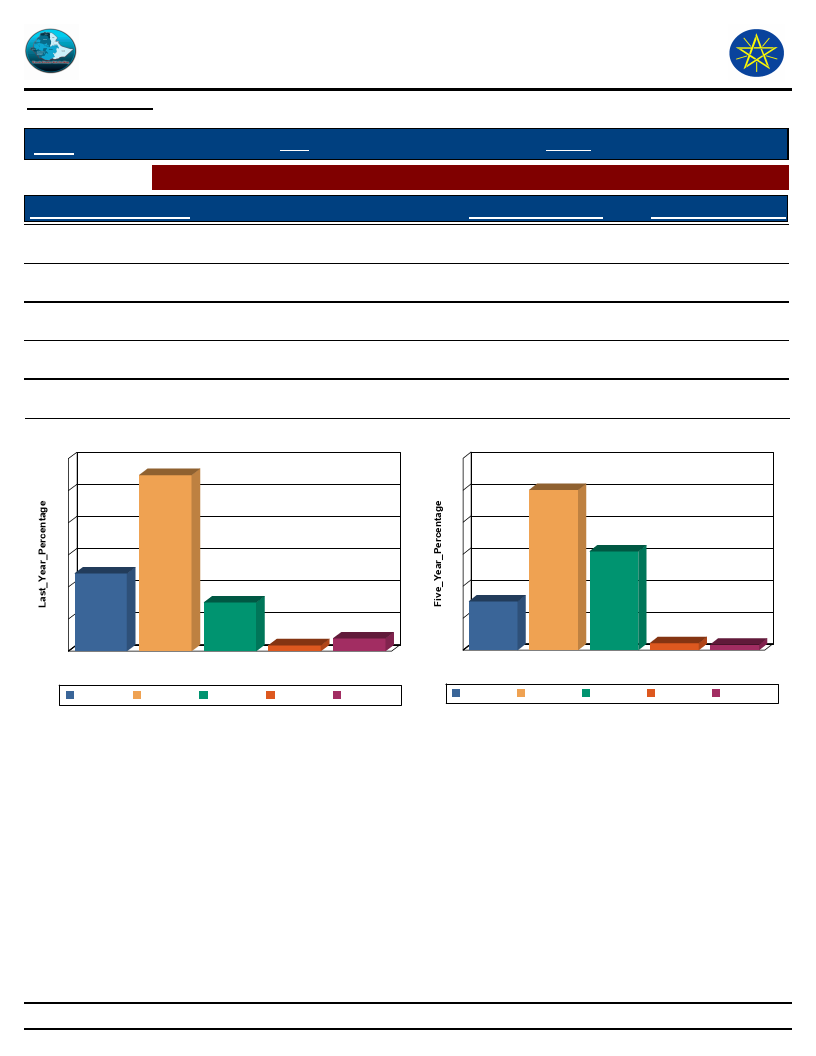
Wereda Disaster
Risk Profile
Data_Collected_Date
Disaster Risk Management
and Food Security Sector (DRMFSS)
Tuesday, December 2, 2014
Region S.N.N.P
Zone GEDEO
Wereda WENAGO
Selected Indictor: Hazards: Change in Crop Damages - Proportion of Total Crop Damage
Extent of Crop Damage (%)
0%
Last_Year_Percentage
24.19
Five_Year_Percentage
15.21
1 - 25 %
54.87
50.08
26 - 50 %
15.16
30.88
51 - 75 %
1.81
2.15
76 - 100 %
3.97
1.69
Extent of Crop Damage Last_Year
60
55
50
40
30
24
20
10
0
0%
0%
15
2
1 - 25 %
26 - 50 %
51 - 75 %
Extent of Crop Damage
1 - 25 %
26 - 50 %
51 - 75 %
4
76 - 100 %
76 - 100 %
Extent of Crop Damage Five Years Ago
60
50
50
40
31
30
20
15
10
0
0%
0%
2
2
1 - 25 %
26 - 50 % 51 - 75 %
Extent of Crop Damage
76 - 100 %
1 - 25 %
26 - 50 %
51 - 75 %
76 - 100 %
109
Page 1 of 1
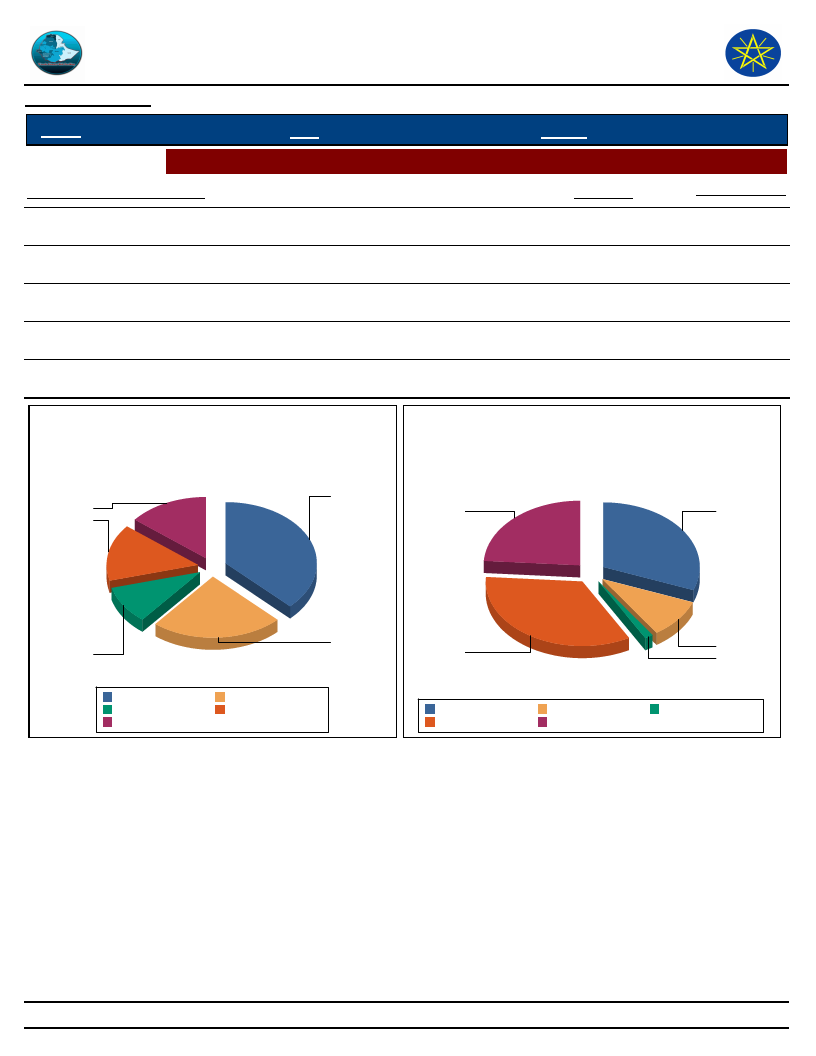
Wereda Disaster
Risk Profile
Data_Collected_Date
Disaster Risk Management
and Food Security Sector (DRMFSS)
Tuesday, December 2, 2014
Region S.N.N.P
Zone GEDEO
Wereda WENAGO
Selected Indictor: Hazards: Change in Crop Damages - Major reasons for crop damage
Major Reason of Crop Damage
Last_Year
Five_Year_Ago
1 Pests / Termite
32.20
27.52
2 Drought
20.08
8.80
3 Flood
8.80
1.28
4 Frost/ Cold wave
12.88
30.56
5 Others (specify)
12.12
21.28
Major Reason of Crop Damage -
Last Year
32.2
12.1
12.9
Major Reason of Crop Damage -
Five Years Ago
5 Others
(specify)
1 Pests /
Termite
20.1
8.8
1 Pests / Termite
3 Flood
5 Others (specify)
2 Drought
4 Frost/ Cold wave
4 Frost/ Cold
wave
2 Drought
3 Flood
1 Pests / Termite
4 Frost/ Cold wave
2 Drought
5 Others (specify)
3 Flood
110
Page 1 of 1
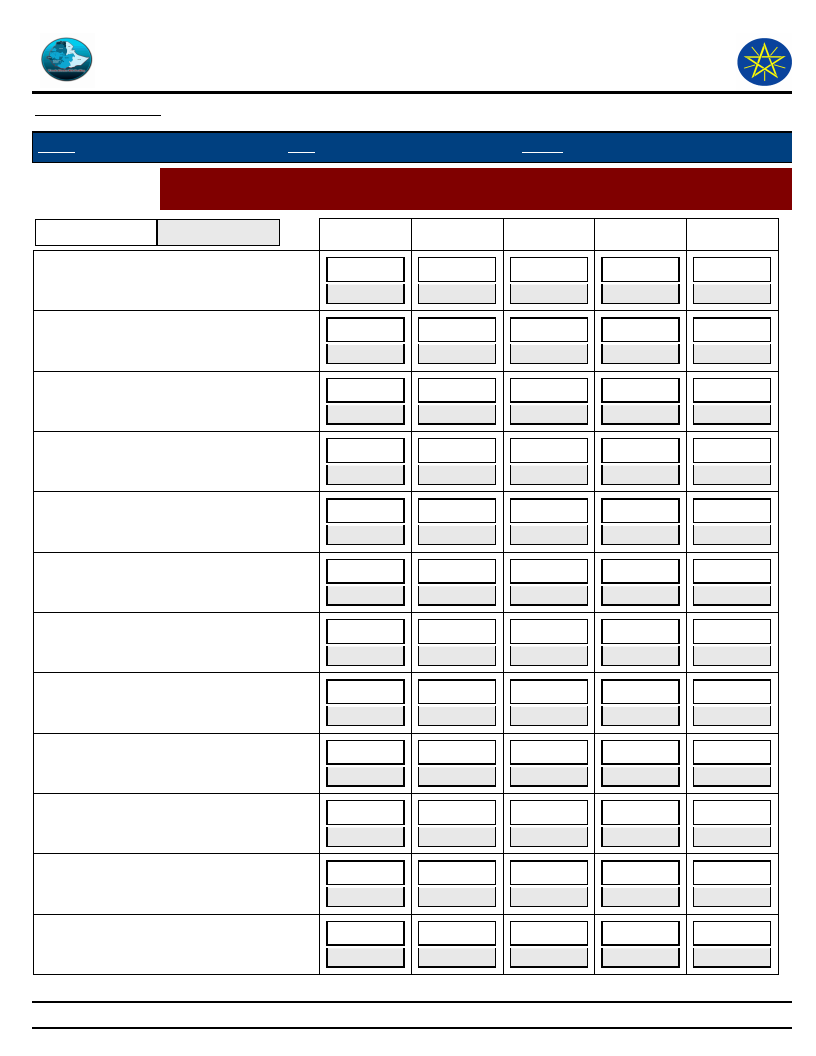
Wereda Disaster
Risk Profile
Data_Collected_Date
Disaster Risk Management
and Food Security Sector (DRMFSS)
Tuesday, December 2, 2014
Region S.N.N.P
Zone GEDEO
Wereda WENAGO
Selected Indictor:
Hazards: Change in Crop Damages - Proportion of Damage for Major Crops
(percentage response by households)
Last Year
Five Years Ago
0%
1 - 25 %
26 - 50 %
51 - 75 %
76 - 100 %
1 Teff
22.73
36.36
27.27
4.55
9.09
22.22
55.56
22.22
0.00
0.00
11 Other pulses
25.00
75.00
0.00
0.00
0.00
0.00
100.00
0.00
0.00
0.00
18 Vegetables
20.00
80.00
0.00
0.00
0.00
0.00
77.78
22.22
0.00
0.00
19 Root & tubers
37.21
48.84
9.30
2.33
2.33
40.91
54.55
0.00
4.55
0.00
2 Barley
6.67
53.33
40.00
0.00
0.00
0.00
50.00
50.00
0.00
0.00
20 Enset
25.64
74.36
0.00
0.00
0.00
22.73
57.02
17.36
0.83
2.07
21 Fruits
0.00
100.00
0.00
0.00
0.00
33.33
50.00
16.67
0.00
0.00
22 Coffee
20.93
76.74
2.33
0.00
0.00
6.67
43.17
44.76
3.49
1.90
23 Hops
0.00
0.00
0.00
0.00
0.00
0.00
100.00
0.00
0.00
0.00
24 Chat
0.00
0.00
0.00
0.00
0.00
0.00
100.00
0.00
0.00
0.00
25 Other cash crop
50.00
25.00
25.00
0.00
0.00
0.00
0.00
0.00
0.00
0.00
3 Wheat
66.67
33.33
0.00
0.00
0.00
100.00
0.00
0.00
0.00
0.00
111
Page 1 of 2
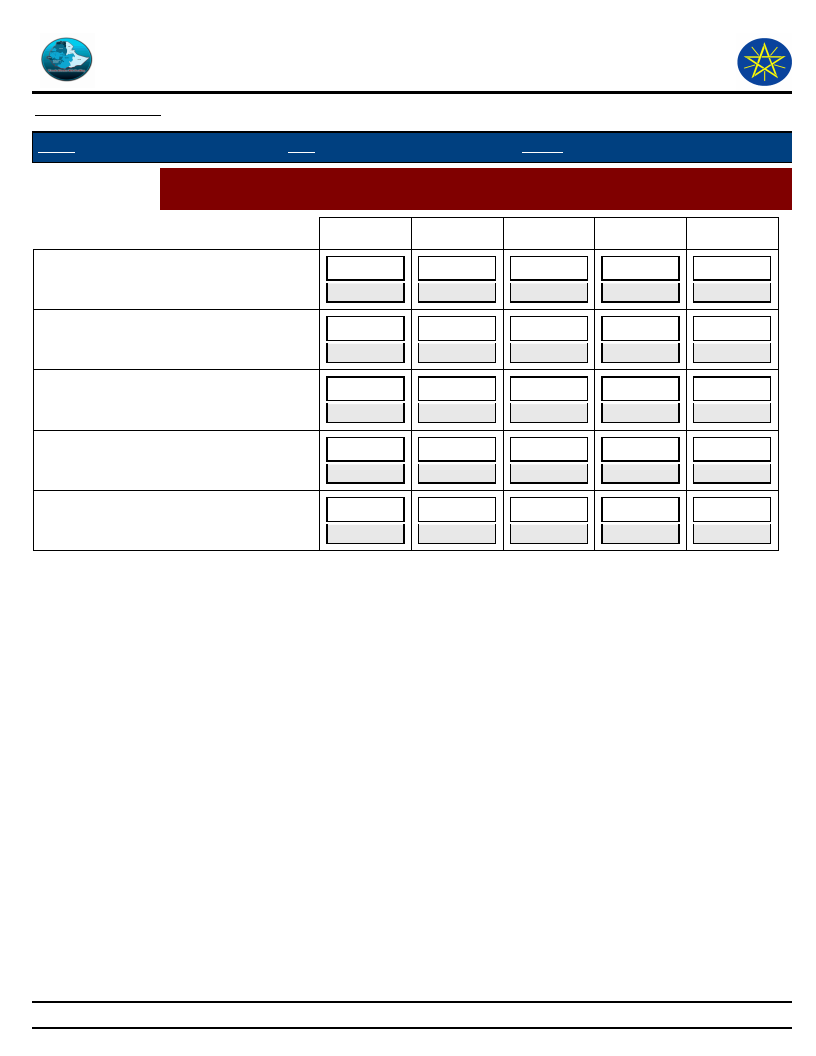
Wereda Disaster
Risk Profile
Data_Collected_Date
Disaster Risk Management
and Food Security Sector (DRMFSS)
Tuesday, December 2, 2014
Region S.N.N.P
Zone GEDEO
Wereda WENAGO
Selected Indictor:
Hazards: Change in Crop Damages - Proportion of Damage for Major Crops
(percentage response by households)
0%
1 - 25 %
26 - 50 %
51 - 75 %
76 - 100 %
4 Maize
23.08
46.15
23.08
2.56
0.00
21.43
39.29
39.29
0.00
0.00
5 Sorghum
12.50
37.50
50.00
0.00
0.00
33.33
66.67
0.00
0.00
0.00
7 Other grain (specify)
0.00
20.00
33.33
80.00
11.11
0.00
11.11
0.00
44.44
0.00
8 Beans
0.00
0.00
100.00
0.00
0.00
0.00
0.00
0.00
0.00
0.00
9 Peas
0.00
100.00
0.00
0.00
0.00
0.00
0.00
0.00
0.00
0.00
112
Page 2 of 2
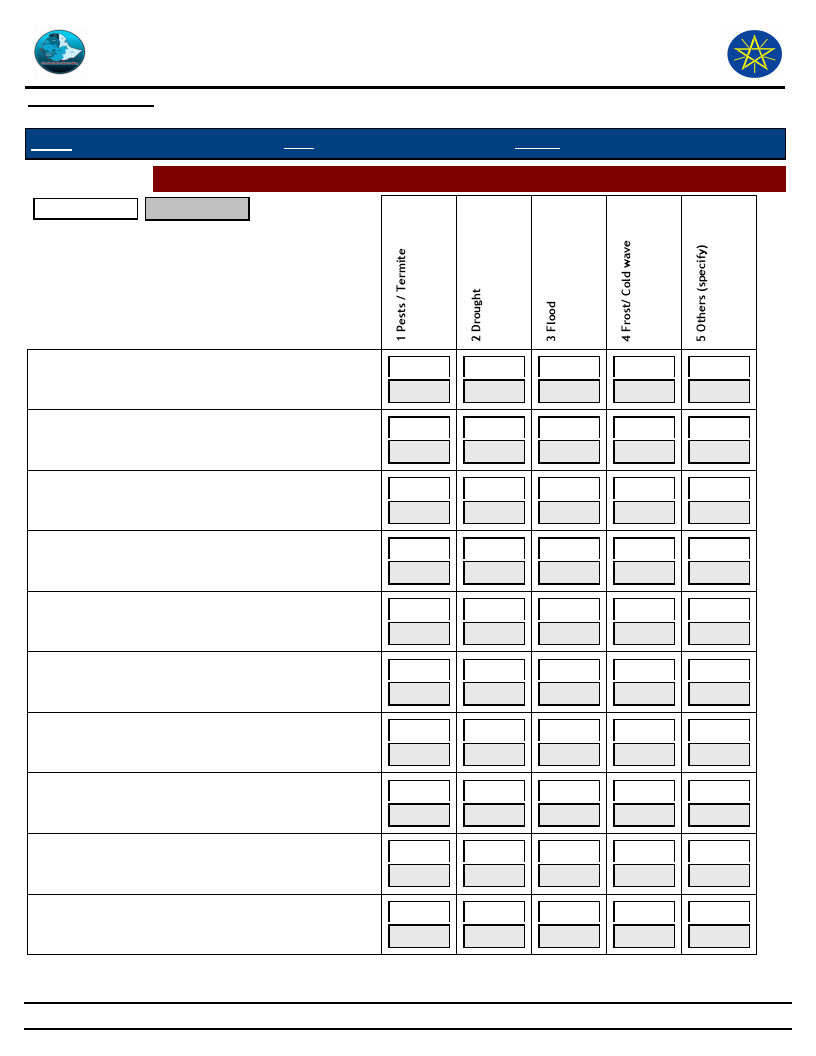
Wereda Disaster
Risk Profile
Data_Collected_Date
Disaster Risk Management
and Food Security Sector (DRMFSS)
Tuesday, December 2, 2014
Region S.N.N.P
Zone GEDEO
Wereda WENAGO
Selected Indictor: Hazards: Change in Crop Damages - Reasons for Damage of Major Crops
Last Year
Five Years Ago
1 Teff
11 Other pulses
18 Vegetables
19 Root & tubers
2 Barley
20 Enset
21 Fruits
22 Coffee
23 Hops
24 Chat
13.64
33.33
100.00
100.00
80.00
77.78
43.24
50.00
40.00
25.00
15.38
40.99
0.00
16.67
20.93
11.54
0.00
50.00
0.00
0.00
18.18
22.22
0.00
0.00
0.00
11.11
16.22
10.00
6.67
25.00
15.38
14.41
0.00
0.00
39.53
3.21
50.00
0.00
100.00
0.00
22.73
0.00
0.00
0.00
0.00
11.11
2.70
0.00
13.33
0.00
7.69
2.70
16.67
0.00
4.65
0.00
0.00
0.00
0.00
0.00
9.09
22.22
0.00
0.00
0.00
0.00
10.81
5.00
20.00
25.00
5.13
12.61
0.00
0.00
13.95
0.00
0.00
0.00
0.00
0.00
22.73
11.11
0.00
0.00
20.00
0.00
2.70
5.00
20.00
25.00
17.95
12.61
100.00
33.33
2.33
32.05
0.00
0.00
0.00
0.00
113
Page 1 of 2
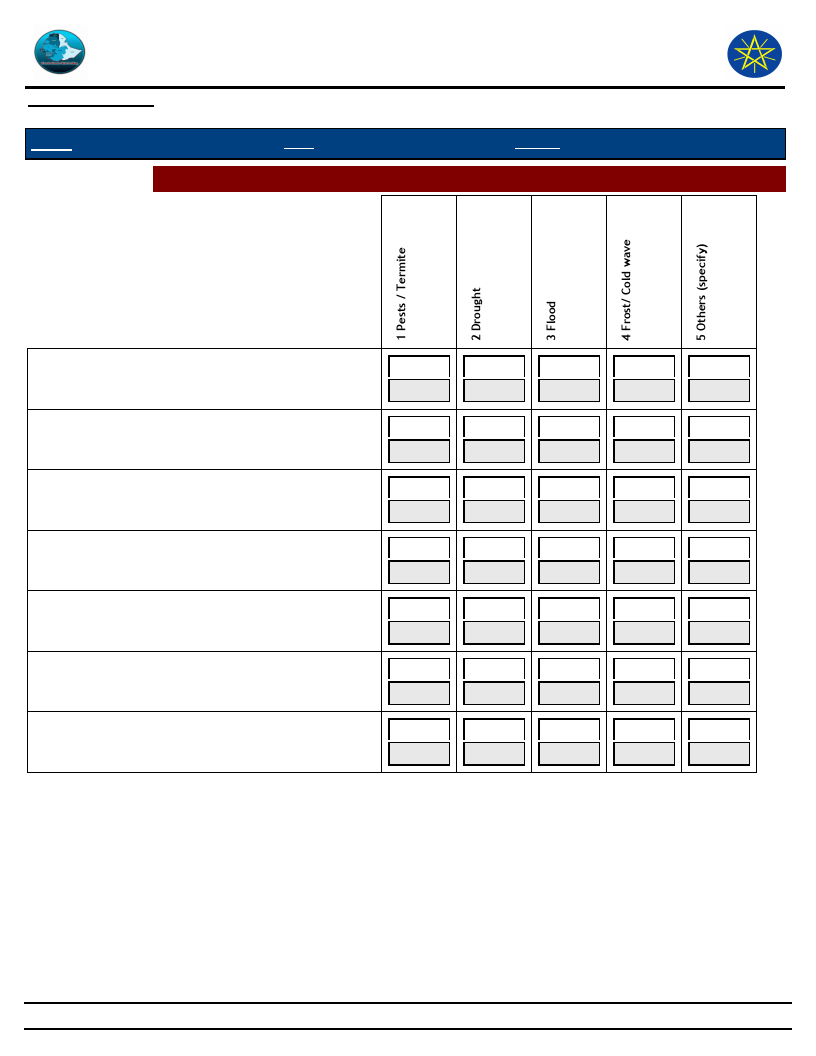
Wereda Disaster
Risk Profile
Data_Collected_Date
Disaster Risk Management
and Food Security Sector (DRMFSS)
Tuesday, December 2, 2014
Region S.N.N.P
Zone GEDEO
Wereda WENAGO
Selected Indictor: Hazards: Change in Crop Damages - Reasons for Damage of Major Crops
25 Other cash crop
3 Wheat
4 Maize
5 Sorghum
7 Other grain (specify)
8 Beans
9 Peas
0.00
33.33
0.00
33.33
0.00
0.00
0.00
0.00
0.00
0.00
0.00
0.00
0.00
33.33
0.00
0.00
0.00
0.00
50.00
0.00
42.67
9.33
5.33
14.67
13.33
60.71
10.71
0.00
10.71
0.00
37.50
12.50
0.00
12.50
25.00
0.00
33.33
0.00
33.33
0.00
25.00
37.50
0.00
37.50
0.00
75.00
25.00
0.00
0.00
0.00
0.00
0.00
0.00
0.00
100.00
0.00
0.00
0.00
0.00
0.00
100.00
0.00
0.00
0.00
0.00
0.00
0.00
0.00
0.00
0.00
114
Page 2 of 2

Wereda Disaster
Risk Profile
Data_Collected_Date
Disaster Risk Management and Food
Security Sector (DRMFSS)
Tuesday, December 2, 2014
Region
S.N.N.P
Zone
GEDEO
Wereda
WENAGO
Selected Indictor:
Agricultural Situation: Change in Crops Grown - Five major crops grown by proportion of total cultivated land
Kebele Name
GASELCHO
Major Crops
22 Coffee
Main Season
Meher
Present
Cropped Area
Five_Years_Ago
70
85
Reason_For_Change
Because of coffee Diseases
20 Enset
Meher
75
85
Because of Enset disease
4 Maize
Meher
40
30
Because get high income food
8 Beans
Meher
40
35
Because to reach a short period of time
3 Wheat
Meher
35
30
Because to get Additional income & good
DODORO
22 Coffee
Meher
75
85
Because coffee diseases
20 Enset
Meher
80
90
Because Enset disease
Niger seed
Meher
60
50
Because reach at short period
8 Beans
Meher
50
40
Because reach of short period
TOKOCHA
22 Coffee
Meher
80
85
Because shortage of land
20 Enset
Meher
75
80
Because shortage of land
Sweet potato
Meher
40
35
Be reach a shortage of time
Niger seed
Meher
35
30
Be reach a shortage of time
Papaya
Meher
25
20
Be reach a shortage of time
MEKONISA
22 Coffee
Meher
75
85
Because to increase the disease
115
Page 1 of 6

Wereda Disaster
Risk Profile
Data_Collected_Date
Disaster Risk Management and Food
Security Sector (DRMFSS)
Tuesday, December 2, 2014
Region
S.N.N.P
Zone
GEDEO
Wereda
WENAGO
Selected Indictor:
Agricultural Situation: Change in Crops Grown - Five major crops grown by proportion of total cultivated land
Kebele Name
MEKONISA
Major Crops
20 Enset
Main Season
Meher
Present
Cropped Area
Five_Years_Ago
70
85
Reason_For_Change
Because to increase the disease
Niger seed
Meher
50
40
Because to reach a short pried of time
8 Beans
Meher
35
30
Because to reach a short pried of time
Papaya
Meher
20
15
Because to reach a short pried of time
DABOTA
22 Coffee
Meher
75
85
Because coffee diseases
20 Enset
Meher
70
85
Because Enset Disease
Sweet potato
Meher
50
45
Because reach at a short period
8 Beans
Meher
45
40
Because reach at a short period
Chick pea
Meher
40
35
Because reach at a short period
KERA SODITY
22 Coffee
Meher
80
85
Because of coffee , disease
20 Enset
Meher
75
80
Enset diseases
4 Maize
Meher
30
25
Consumption & to get price
1 Teff
Meher
25
30
shortage of cultivated land
HASEHARO
Sweet potato
Meher
25
22 Coffee
Meher
75
20
A short period of crop , to use house
consumption & to get good price
85
The disease
116
Page 2 of 6

Wereda Disaster
Risk Profile
Data_Collected_Date
Disaster Risk Management and Food
Security Sector (DRMFSS)
Tuesday, December 2, 2014
Region
S.N.N.P
Zone
GEDEO
Wereda
WENAGO
Selected Indictor:
Agricultural Situation: Change in Crops Grown - Five major crops grown by proportion of total cultivated land
Kebele Name
HASEHARO
Major Crops
20 Enset
Main Season
Meher
Present
Cropped Area
Five_Years_Ago
75
80
Reason_For_Change
The diseases
4 Maize
Meher
30
35
Reach a short period time
Sweet potato
Meher
25
30
Reach a short period time
WETIKO
22 Coffee
Meher
75
80
Because of disease
20 Enset
Meher
70
75
Because of diseases
2 Barley
Meher
40
45
Because shortage of land
Niger seed
Meher
30
35
Because a shortage of period crop
Sweet potato
Meher
20
25
Because a shortage of period crop
BELE BUKISA
22 Coffee
Meher
70
75
because of disease
20 Enset
Meher
60
Because of Enset disease
Sweet potato
Meher
40
35
Because a short period of crop
Haricot Bean
Meher
35
30
Because a short period of crop
Garlic
Meher
25
20
Because a short period of crop
TUMATA CHRECHA
22 Coffee
Meher
50
30
Make available
20 Enset
Meher
20
35
Disease problem
117
Page 3 of 6

Wereda Disaster
Risk Profile
Data_Collected_Date
Disaster Risk Management and Food
Security Sector (DRMFSS)
Tuesday, December 2, 2014
Region
S.N.N.P
Zone
GEDEO
Wereda
WENAGO
Selected Indictor:
Agricultural Situation: Change in Crops Grown - Five major crops grown by proportion of total cultivated land
Kebele Name
TUMATA CHRECHA
Major Crops
4 Maize
Main Season
Meher
Present
Cropped Area
Five_Years_Ago
15
20
Reason_For_Change
The land cover of coffee
Sweet potato
Meher
10
12
The land cover of coffee
Niger seed
Meher
5
3
Due to high productivity in small farm land
HALEMO
20 Enset
Meher
70
80
Agrology condition
22 Coffee
Meher
20
10
Agrology condition
4 Maize
Meher
4
4
No change
2 Barley
Meher
3
3
No change
8 Beans
Meher
3
3
No change
SOKICHA
22 Coffee
Meher
60
40
Available market
20 Enset
Meher
30
50
Available market
8 Beans
Meher
5
5
No changes
Niger seed
Meher
2
2
No change
KELECHA
22 Coffee
Meher
60
40
Market available
20 Enset
Meher
30
50
Disease problem land cover by coffee
Banana
Meher
6
6
No change
118
Page 4 of 6
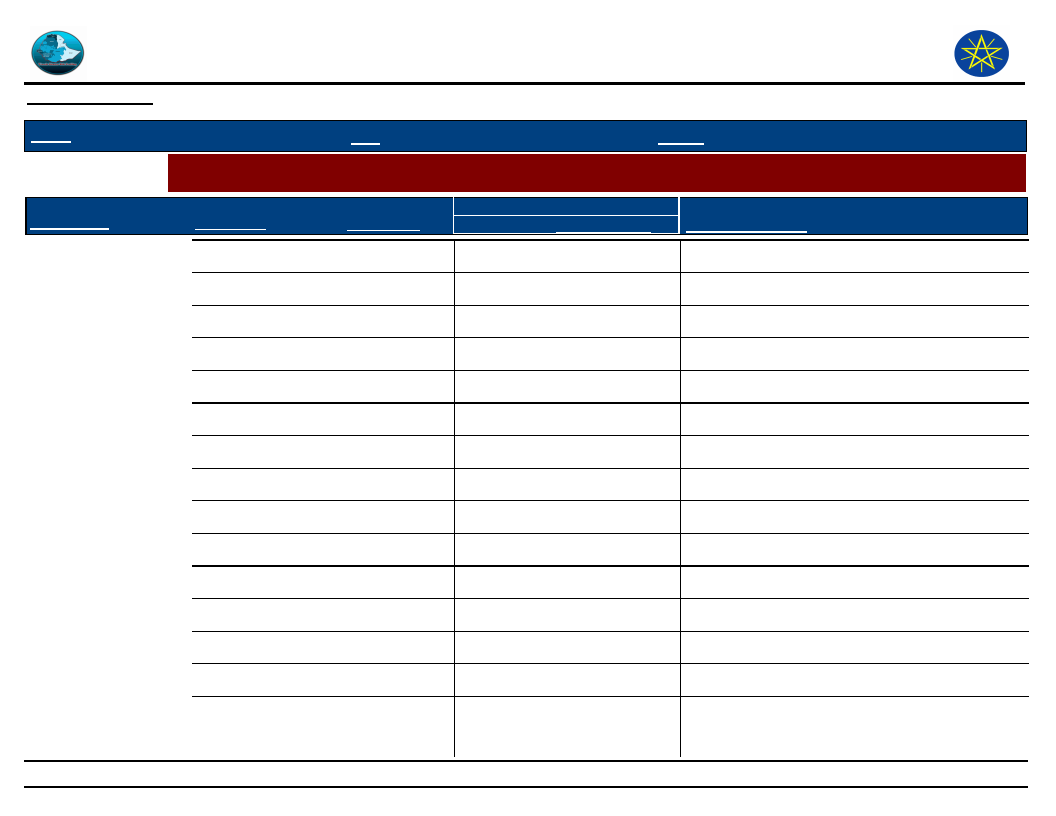
Wereda Disaster
Risk Profile
Data_Collected_Date
Disaster Risk Management and Food
Security Sector (DRMFSS)
Tuesday, December 2, 2014
Region
S.N.N.P
Zone
GEDEO
Wereda
WENAGO
Selected Indictor:
Agricultural Situation: Change in Crops Grown - Five major crops grown by proportion of total cultivated land
Kebele Name
KELECHA
Major Crops
Sweet potato
Main Season
Meher
Present
Cropped Area
Five_Years_Ago
2
2
Reason_For_Change
No change
SUGALE
Sweet potato
Meher
45
35
20 Enset
Meher
35
45
Sweet potato
Meher
8
5
Haricot Bean
Meher
7
10
4 Maize
Meher
5
5
DEKO
22 Coffee
Meher
40
30
Increased price of coffee
20 Enset
Meher
30
45
Substitute by coffee crop
Sweet potato
Meher
10
5
Food consumption
4 Maize
Meher
10
15
Substitute by coffee crop
1 Teff
Meher
10
5
Increased price & Teff
BANKO OKOTO
22 Coffee
Meher
70
50
Increased price
20 Enset
Meher
15
35
Attack by disease ( substitute by coffee
Niger seed
Meher
5
3
Used to for food , consumption
4 Maize
Meher
5
7
Covered by coffee plane
119
Page 5 of 6
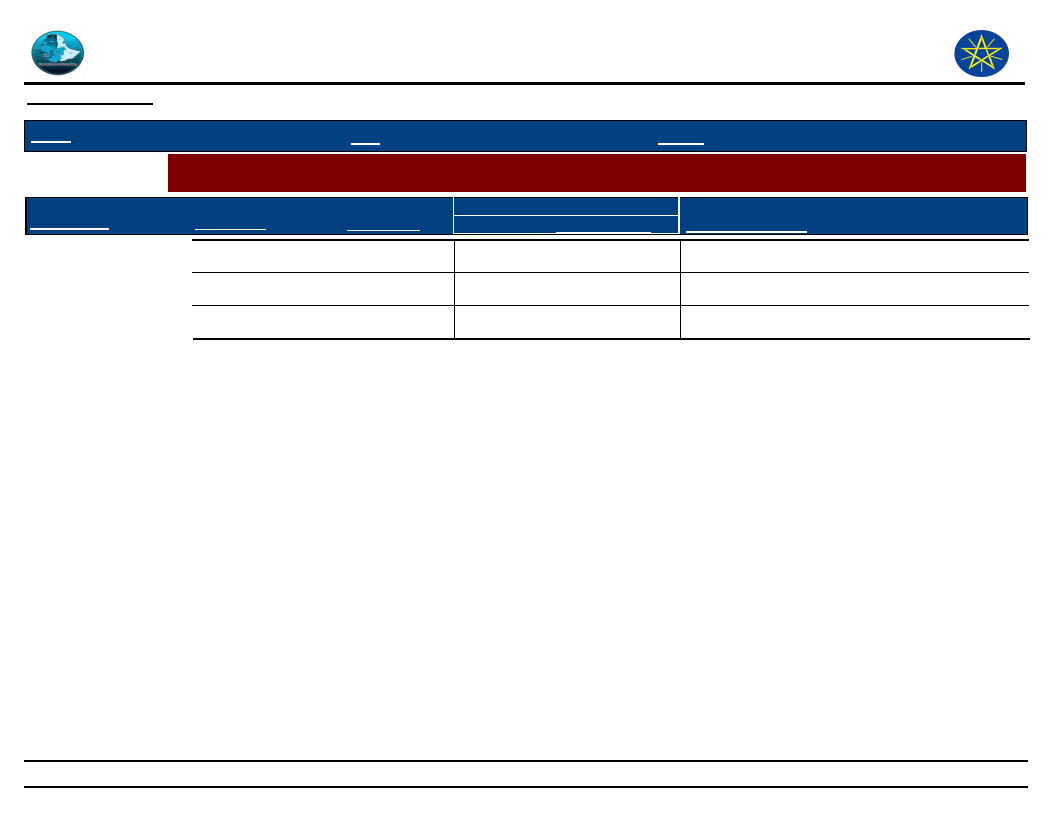
Wereda Disaster
Risk Profile
Data_Collected_Date
Disaster Risk Management and Food
Security Sector (DRMFSS)
Tuesday, December 2, 2014
Region
S.N.N.P
Zone
GEDEO
Wereda
WENAGO
Selected Indictor:
Agricultural Situation: Change in Crops Grown - Five major crops grown by proportion of total cultivated land
Kebele Name
BANKO OKOTO
Major Crops
18 Vegetables
Main Season
Meher
Present
Cropped Area
Five_Years_Ago
5
5
Reason_For_Change
No change
JEMJEMO
22 Coffee
Meher
55
45
Increased price
20 Enset
Meher
45
55
Substitute by coffee crop
120
Page 6 of 6
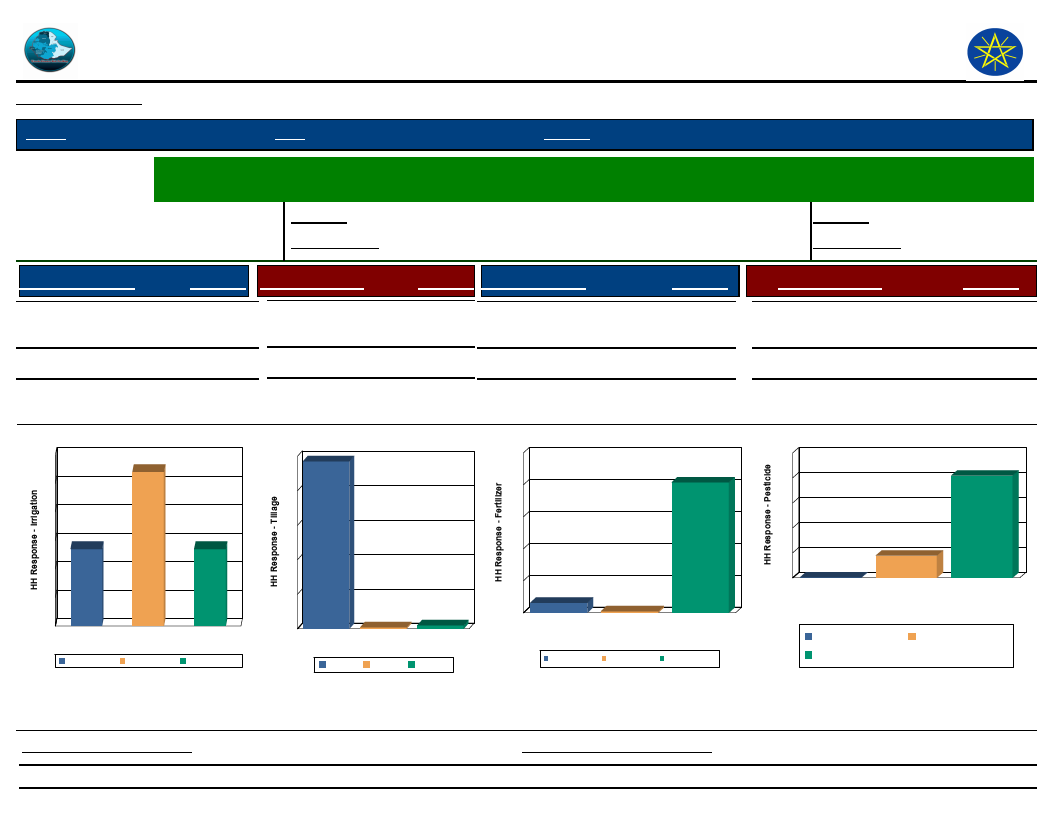
Wereda Disaster
Risk Profile
Data_Collected_Date
Disaster Risk Management
and Food Security Sector (DRMFSS)
Tuesday, December 2, 2014
Region S.N.N.P
Zone GEDEO
Wereda WENAGO
Selected Indictor:
Economic Vulnerability: Status of Agriculture - Methods of tillage, Irrigation and other agricultural input utilization
by households
Percentage of
Last Year
0.59
Irrigated Area
Five Years Ago
0.27
Percentage of households
with irrigated area
Last Year
Five Years Ago
47.10
46.04
Source of Irrigation
River/Lake/Pond
Response Method of Tillage
0.27 Oxen
Response Type of Fertilizer
1.90 Chemical
Response
0.84
Birkas (tanks)
0.27
Other (specify)
0.54
Source of Irrigation
0.6
1
0.5
0.4
0.3
0
0
0.2
0.1
0
Birkas (tanks) Other (specify) River/Lake/Pond
Source of Irrigation
Birkas (tanks)
Other (specify)
River/Lake/Pond
Manual
None
97.01
0.82
Method of Tillage
100
97
80
60
40
20
0
Manual
1
None
2
Oxen
Method of Tillage
Manual None
Oxen
Natural/Animal manure
Both Chemical and
Natural
Type of Fertilizer
100
80
81.51
6.16
82
60
40
20
6
0
Both Chemical
and Natural
1
Chemical
Natural/Animal
manure
Type of Fertilizer
Both Chemical and
Natural
Chemical
Natural/Animal manure
Type of Pesticide
Chemicals (insecticides,
fungicide, etc)
Natural methods
None
Response
0.28
17.66
81.77
Type of Pesticide
100
82
80
60
40
20
18
0
0
Chemicals
(insecticides,
fungicide, etc)
Natural methods
Type of Pesticide
None
Chemicals (insecticides,
fungicide, etc)
None
Natural methods
Proportion_Improved_Seeds
8.00
Proportion_Agriculture_Service
38.30
121
Page 1 of 1
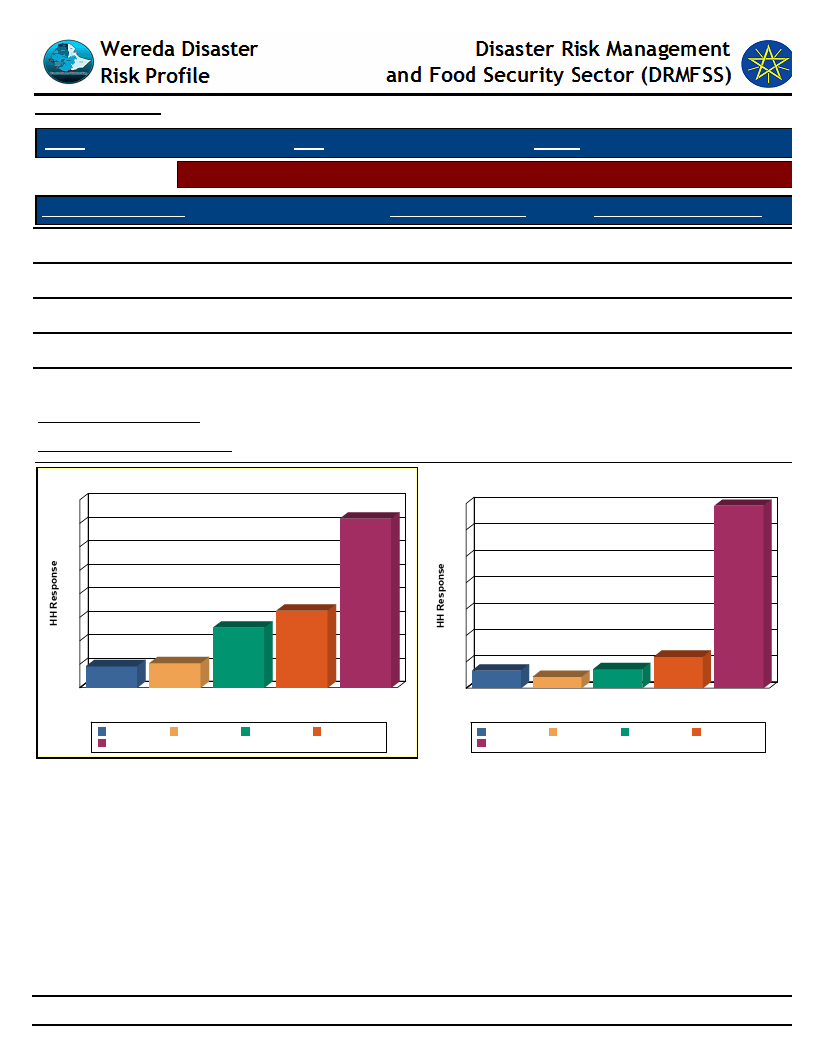
Data_Collected_Date
Tuesday, December 2, 2014
Region S.N.N.P
Zone GEDEO
Wereda WENAGO
Selected Indicator
Economic Vulnerability: Crops Grown - Number of crops grown by households
Number of Crops Grown
One type
Crops Grown Last Year
12.76
Crops Grown Five Years Ago
7.25
Two types
35.99
69.13
Three types
16.40
11.95
Four types
5.24
4.30
Five types
4.56
6.71
Avg Crops Grown Last Year
Avg Crops Grown Five Years Ago
1.78
2.32
Number of Crops Grown Last Year
40
36
35
30
25
20
15
10
5
5
16
13
5
0
Five types
Four types One type Three types
Number of Crops Grown
Two types
Five types
Two types
Four types
One type
Three types
Number of Crops Grown five years ago
69
70
60
50
40
30
20
10
7
0
Five types
12
7
4
Four types One type Three types Two types
Number of Crops Grown
Five types
Two types
Four types
One type
Three types
122
Page 1 of 1
Data_Collected_Date
Region S.N.N.P
Zone GEDEO
Tuesday, December 2, 2014
Wereda WENAGO
Selected Indicator
Economic Vulnerability: Crops Grown - Types of crops grown by households
Major Crop Type
1 Teff
Type of Crops Grown
Last Year
6.97
Type of Crops Grown
Five Years Ago
1.22
2 Barley
4.55
0.68
3 Wheat
0.91
0.27
4 Maize
27.27
3.92
5 Sorghum
2.42
0.41
7 Other grain (specify)
2.73
0.81
8 Beans
0.61
0.00
9 Peas
0.30
0.00
10 Lentils
0.30
0.00
11 Other pulses
1.21
0.27
12 Neug
0.00
0.14
18 Vegetables
1.82
1.49
19 Root & tubers
15.45
3.51
20 Enset
16.97
41.22
21 Fruits
0.30
0.95
22 Coffee
16.06
44.73
23 Hops
0.27
0.00
24 Chat
0.14
0.00
25 Other cash crop
1.52
0.00
123
Page 1 of 2
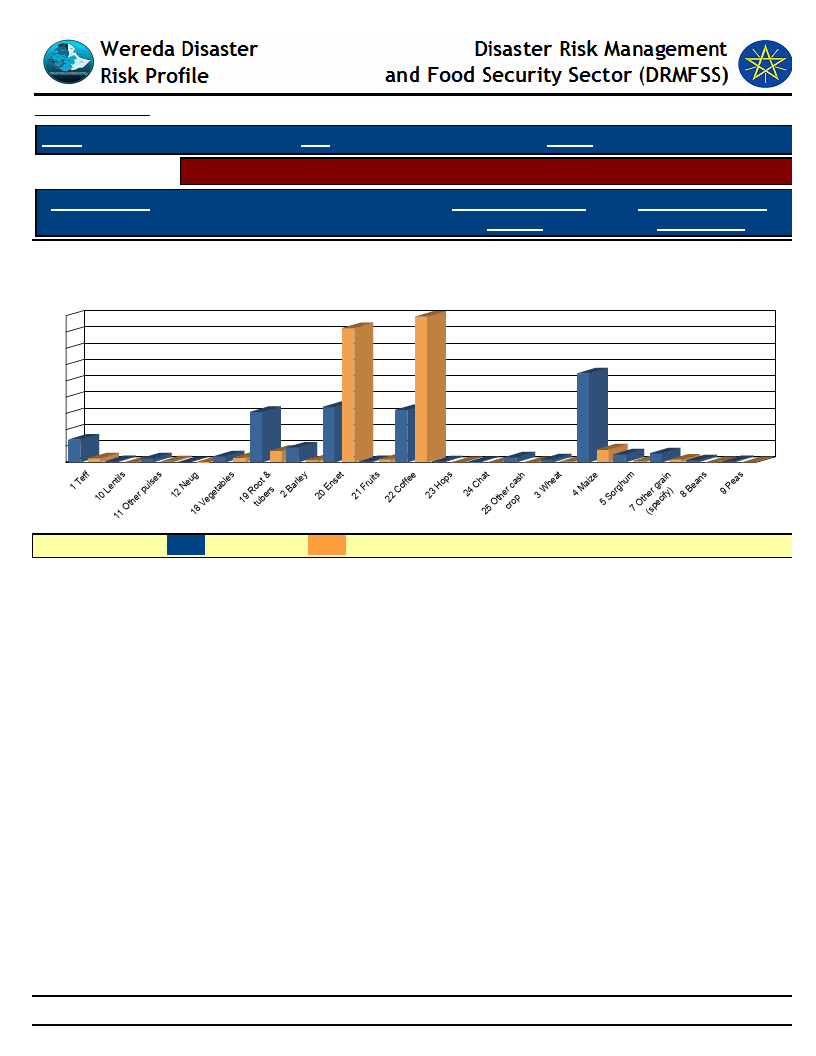
Data_Collected_Date
Region S.N.N.P
Selected Indicator
Major Crop Type
Zone GEDEO
Tuesday, December 2, 2014
Wereda WENAGO
Economic Vulnerability: Crops Grown - Types of crops grown by households
Type of Crops Grown
Last Year
Type of Crops Grown
Five Years Ago
Types of Crops Grown - Percent Responses of HHs for Last Year as compared to
Five Years Ago
45
45
41
40
35
30
27
25
20
15
17
16
15
10 7
5
10
01
00
2
0
1
0
45
1
01
0 00 02 01 0
4
2
3
0
11 00 0
Teff
1
Lentils
10
ther pulses
O
11
Neug
12
Vegetables
19 Rotuobt e&rs
18
Barley
2
Enset
20
Fruits
21
Coffee
22
Hops
23
24
Chat
25
Othercrcoapsh
heat
W
3
aize
M
4
5
Sorghum
7
Oth(esrpgercaifiny)
Beans
8
Peas
9
LEGEND :
Last year
Five Years Ago
124
Page 2 of 2
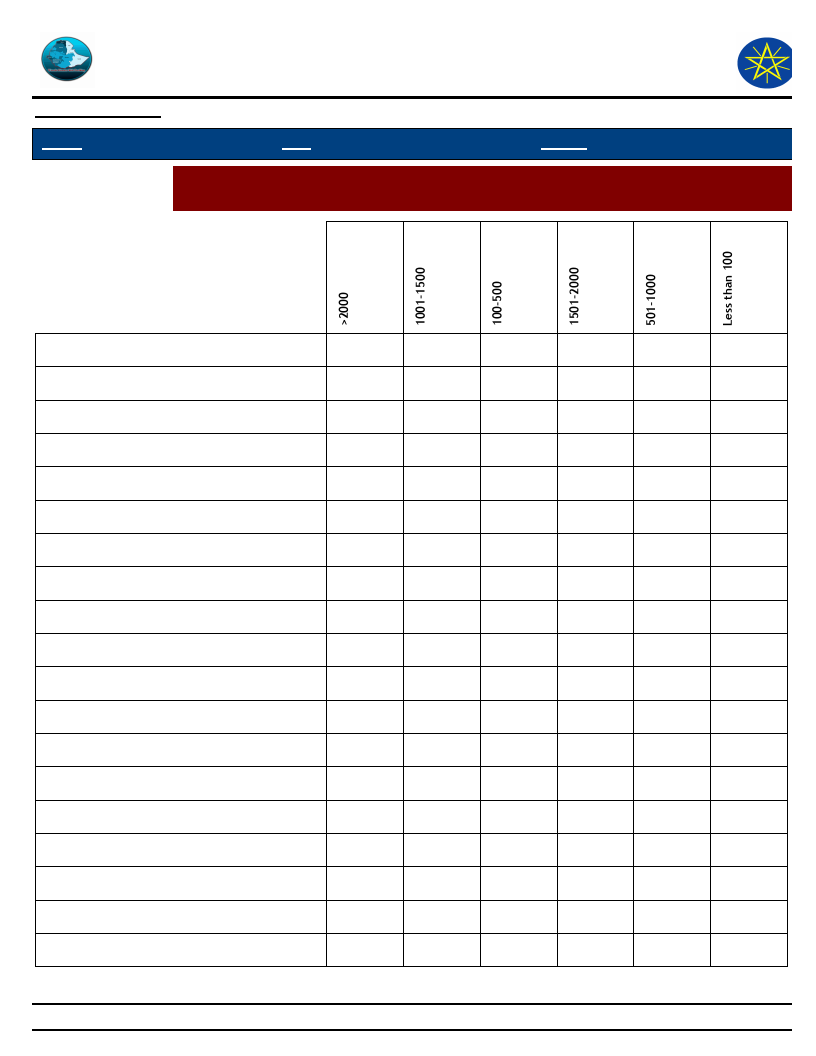
Wereda Disaster
Risk Profile
Data_Collected_Date
Region S.N.N.P
Zone
Disaster Risk Management
and Food Security Sector (DRMFSS)
Tuesday, December 2, 2014
GEDEO
Wereda WENAGO
Selected Indictor:
Economic Vulnerability: Crops Grown - Proportion of households by amount of
yield of major crops (last year)
1 Teff
10 Lentils
11 Other pulses
12 Neug
18 Vegetables
19 Root & tubers
2 Barley
20 Enset
21 Fruits
22 Coffee
23 Hops
24 Chat
25 Other cash crop
3 Wheat
4 Maize
5 Sorghum
7 Other grain (specify)
8 Beans
9 Peas
13.64
1.96
49.02
20.00
33.33
1.12
15.73
12.50
125
86.36
100.00
100.00
11.76
100.00
37.25
80.00
100.00
100.00
100.00
60.00
66.67
5.62
77.53
87.50
100.00
100.00
100.00
Page 1 of 1

Wereda Disaster
Disaster Risk Management
Risk Profile
and Food Security Sector (DRMFSS)
Data_Collected_Date
Tuesday, December 2, 2014
Region S.N.N.P
Zone GEDEO
Wereda WENAGO
Selected Indictor:
Economic Vulnerability: Crops Grown - Proportion of households by amount of
yield of major crops (Five Years Ago)
Types of Major Crops
Category of Yield used to be obtained five years ago
1 Teff
10 Lentils
11 Other pulses
12 Neug
18 Vegetables
19 Root & tubers
2 Barley
20 Enset
21 Fruits
22 Coffee
23 Hops
24 Chat
25 Other cash crop
3 Wheat
4 Maize
22.22
77.78
100.00
100.00
100.00
3.85
50.00
46.15
60.00
40.00
1.01
5.70
39.93
0.34
9.40
43.62
28.57
71.43
0.61
2.15
34.36
0.61
4.29
57.98
100.00
100.00
40.00
50.00
50.00
3.57
7.14
3.57
85.71
126
Page 1 of 2
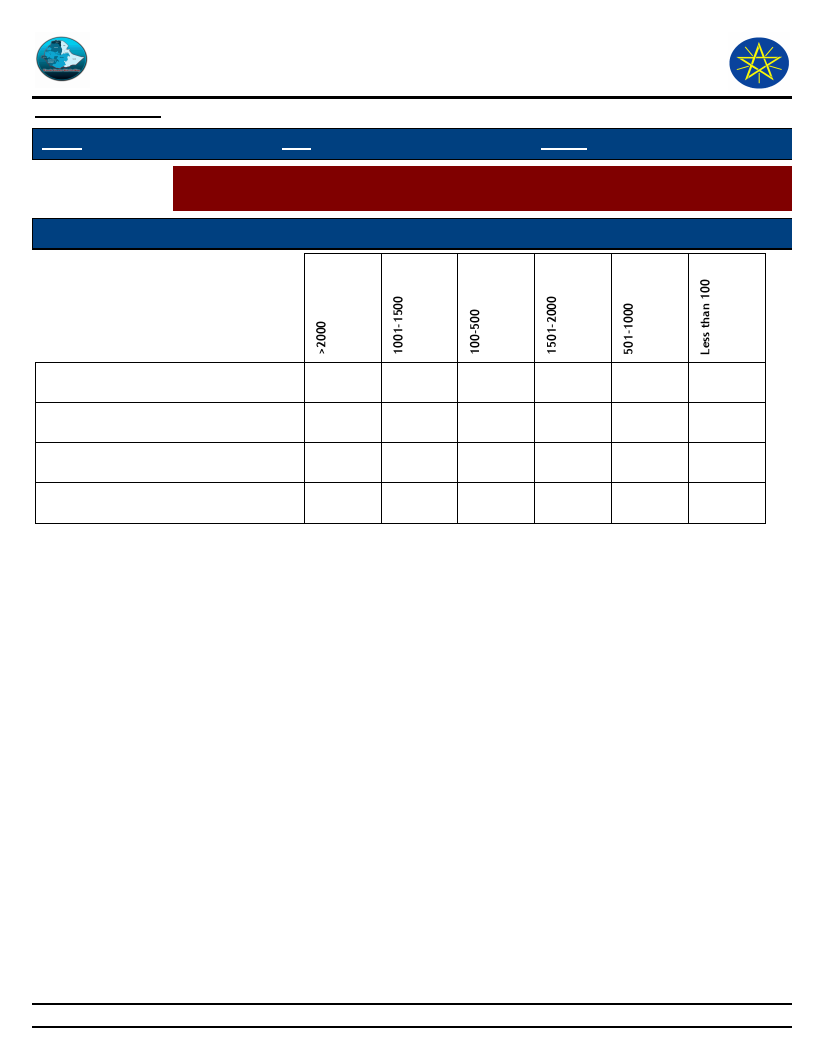
Wereda Disaster
Disaster Risk Management
Risk Profile
and Food Security Sector (DRMFSS)
Data_Collected_Date
Tuesday, December 2, 2014
Region S.N.N.P
Zone GEDEO
Wereda WENAGO
Selected Indictor:
Economic Vulnerability: Crops Grown - Proportion of households by amount of
yield of major crops (Five Years Ago)
Types of Major Crops
Category of Yield used to be obtained five years ago
5 Sorghum
7 Other grain (specify)
8 Beans
9 Peas
100.00
100.00
127
Page 2 of 2
Data_Collected_Date
Tuesday, December 2, 2014
Region S.N.N.P
Zone GEDEO
Wereda WENAGO
Selected Indictor: Economic Vulnerability: Land Ownership and Quality - Landownership of households
Households owning land (%)
Average landholding (in Hectares)s
Households cultivating land in last 12 months (%)
Average quantity of land cultivated (in hectares)
95.50
0.83
93.80
0.49
Range Land Holding
Percent_Response
Less than 0.25 ha
54.0
0.25 - 0.50 ha
19.0
0.5 - 0.75 ha
3.0
0.75 - 1 ha
10.0
1 - 2 ha
5.0
More than 2 ha
9.0
IMPORTANT: ha = Hectar
Household Responses to Range Land Holding
19.3
8.9
3.4
Range Cultivated Land
Less than 0.25 ha
0.25 - 0.50 ha
0.5 - 0.75 ha
0.75 - 1 ha
1 - 2 ha
More than 2 ha
Percent_Respons
61.0
19.0
2.0
9.0
5.0
3.0
Household Responses to Range Cultivated Land
19.0
3.5
2.4
53.5
9.7
5.2
0.25 - 0.50 ha
0.5 - 0.75 ha
19.3%
3.4%
0.75 - 1 ha
9.7%
1 - 2 ha
5.2%
Less than 0.25 ha 53.5%
More than 2 ha
8.9%
Total:
100.0%
9
4.8
61.3
0.25 - 0.50 ha 19.0
0.5 - 0.75 ha
2.4
0.75 - 1 ha
9
1 - 2 ha
4.8
Less than 0.25 ha 61.3
More than 2 ha 3.5
Total:
100
128
Page 1 of 1
Data_Collected_Date
Tuesday, December 2, 2014
Region S.N.N.P
Zone GEDEO
Wereda WENAGO
Selected Indictor:
Economic Vulnerability: Land Ownership and Quality - Farmers’ perception on the
quality of their agricultural land
Cropping_Intensity *
Households with enough land for farming
HHs with favourable location of farm
Response
Households with fertile soil
Yes
25.00
Highly fertile
0.96
10.30
Response
1.36
Partially
65.76
Fertile
83.15
No
8.97
Not fertile
15.22
DK
0.27
----
* Cropping Intensity = (Gross Cropped Area / total land owned Area )x 100%
Household responses to the type of farm
location
Household responses tp the type of soil
fertility
0
25
9
15
1
66
DK
No
Partially Yes
83
----
Fertile
Highly fertile Not fertile
129
Page 1 of 1
Wereda Disaster
Risk Profile
Data_Collected_Date
Region S.N.N.P
Zone GEDEO
Disaster Risk Management and Food
Security Sector (DRMFSS)
Tuesday, December 2, 2014
Wereda WENAGO
Selected Indicator
Kebele Name
Environmental Situation: Land-Use other than crop production - Types of land use other than crop production
across Kebeles
Landuse_1
Comments_1
Landuse_2
Comments_2
Landuse_3
Comments_3
GASELCHO
No
No
DODORO
No
TOKOCHA
no
Because a shortage
of land
No
MEKONISA
No
No
No
No
DABOTA
No
KERA SODITY
No
HASEHARO
No
WETIKO
No
BELE BUKISA
TUMATA CHRECHA
2 hectare covering
grass
No land use
For hut covering
purpose
HALEMO
SOKICHA
Affectation
No
Large land cover,
coffee shad, solid &
water conservation
KELECHA
Ago forestry
Large land cover
coffee shade, soil &
water conservation
130
Page 1 of 2
Wereda Disaster
Risk Profile
Data_Collected_Date
Region S.N.N.P
Zone GEDEO
Disaster Risk Management and Food
Security Sector (DRMFSS)
Tuesday, December 2, 2014
Wereda WENAGO
Selected Indicator
Kebele Name
Environmental Situation: Land-Use other than crop production - Types of land use other than crop production
across Kebeles
Landuse_1
Comments_1
Landuse_2
Comments_2
Landuse_3
Comments_3
SUGALE
Nothing
DEKO
Forest
2 ha - income source
BANKO OKOTO
No
JEMJEMO
Nothing
131
Page 2 of 2
WDRP Indicators
Livestock Production Characteristics
132
Wereda Disaster
Risk Profile
Disaster Risk Management
and Food Security Sector (DRMFSS)
Data_Collected_Date
Tuesday, December 2, 2014
Region S.N.N.P
Zone GEDEO
Wereda WENAGO
Selected Indictor:
Kebele Name
Agricultural Situation: Status of Livestock Disease - Change in Livestock Disease
Status
Current_Level
Change_Over_Last_Decade
Comment
GASELCHO
New castle disease
Increasing
Have professional
DODORO
TOKOCHA
MEKONISA
DABOTA
KERA SODITY
HASEHARO
WETIKO
Trypanasomiasis Black
leg
Trypanosomiasis new
castle disease chicken
Black leg
New castle disease /
chickens/
Black leg
Trypanosomiasis, new
castle disease
New scissile
Decreasing
Decreasing
Decreasing
Decreasing
Decreasing
Decreasing
Increasing
BELE BUKISA
TUMATA CHRECHA
HALEMO
KELECHA
SUGALE
DEKO
BANKO OKOTO
JEMJEMO
New castle
New castle,
trypanosomiasis
New castle,
trypanosomiasis
New castle,
trypanosomiasis
New castle, disease
trypanosomiasis
New castle, disease
trypanosomiasis
Decreasing,
tryponosmiasis, new
castle disease
New castle disease
Increasing
Decreasing
Decreasing
Decreasing
Decreasing
Decreasing
Decreasing
Decreasing
To help professional
more
Have professional man
To presence professional
man
Have professional man at
Keble
To present professional
man
Have professional man
Less treatment medical
need disease , resistant
hen
Disease resistant hen. For
treatment lack of money
Climatically change
Climatically change
Climatically change
Access to veterinary
service
Access to drugs for
livestock
Access to veterinary
service, access to drugs,
for livestock
Access to drugs for
livestock , access to
veterinary service
133
Page 1 of 1
Wereda Disaster
Risk Profile
Data_Collected_Date
Disaster Risk Management
and Food Security Sector (DRMFSS)
Tuesday, December 2, 2014
Region S.N.N.P
Zone GEDEO
Wereda WENAGO
Selected Indictor: Livestock Diseases Prevalece
Type of livestock diseases affected households in the last five years (households reporting in %)
African horse disease
1st
2nd
3rd
2.07
1.45
Anthrax affecting cattle
4.14
8.70
6.90
Black leg
2.07
CBPP
18.62
7.25
Contagious Caprine PLeuropneumonia (CCPP)
1.45
Foot and mouth disease
2.90
3.45
Internal & External Parasites (Tick, mange, helminthiasis, fasci
0.69
1.45
Liverfluke (Sheep and cattle)
2.07
4.35
3.45
Lumpy Skin Disease (LSD)
3.45
Lymphangitis
30.34
33.33
27.59
Newcasle disease (Chicken)
10.34
17.39
27.59
Pasteurellosis
8.28
8.70
6.90
Respiratory complex of camels
0.69
3.45
Sheep pox
2.76
11.59
17.24
Tick born diseases
0.69
1.45
Trypanosomiasis
17.24
134
Page 1 of 1
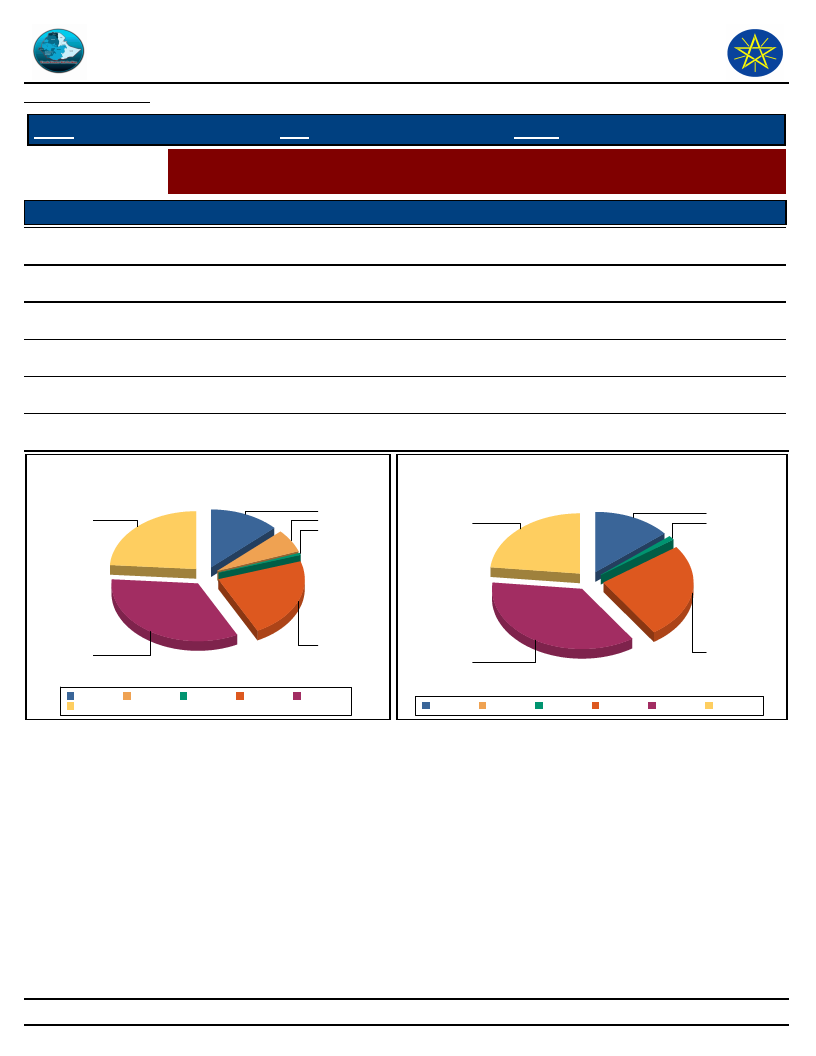
Wereda
Disaster Risk
Data_Collected_Date
Disaster Risk Management
and Food Security Sector
Tuesday, December 2, 2014
Region S.N.N.P
Selected Indictor:
Level of Access
Excellent
Zone GEDEO
Wereda WENAGO
Evaluation of Access to Veternary Services and Livestock Drugs
Households’ evaluation on access to drugs and veterinary services
Veternary Service
0.57
Livestock_Drugs
1.16
Good
22.73
25.58
Adequate
13.07
13.95
Poor
33.52
36.05
Very poor
23.86
23.26
DK
6.25
Level of Access to Veternary Services
13
24
6
1
Access Level of Livestock Drugs
14
23
1
34
Adequate DK
Very poor
23
Excellent
Good
Poor
36
Adequate DK
26
Excellent
Good
Poor
Very poor
135
Page 1 of 1

Data_Collected_Date
Tuesday, December 2, 2014
Region S.N.N.P
Zone GEDEO
Wereda WENAGO
Selected Indictor:
Agricultural Situation: Livestock Diversity - Type of livestock and their economic
importance in the community
KebeleName
GASELCHO
Type of Livestock
Sheep
Avg_Num_Per_HH
50.00
Economic_Importance_Rank
To seal, meat
Poultry
40.00
Meat and egg for selling
Cattle: Mature Female
10.00
Meat for selling
DODORO
Sheep
5.50
To sell, meat
Cattle: Mature Female
3.00
For milk, meat
Poultry
15.00
Meat and egg for selling
TOKOCHA
Poultry
4.50
For egg for sell
Sheep
4.00
For sell for meat
Cattle: Mature Female
1.50
For milk, for sells
MEKONISA
Sheep
5.00
For sell for meat
Poultry
4.00
Meat and egg for selling
Cattle: Mature Female
10.00
Meat for selling
DABOTA
Sheep
4.50
Meat to sell
Poultry
3.50
Meat and egg for selling
Cattle: Mature Female
2.00
Meat and milk for selling
KERA SODITY
Poultry
5.00
Meat and egg for selling
Cattle: Mature Female
2.50
Meat for selling
Sheep
1.50
Meat for selling
Goats
5.00
Meat for selling
HASEHARO
Sheep
4.50
Sell, meat
Poultry
4.00
Meat and egg for selling
Cattle: Mature Female
1.50
Meat for selling
WETIKO
Poultry
10.00
For income
136
Page 1 of 3

Data_Collected_Date
Tuesday, December 2, 2014
Region S.N.N.P
Zone GEDEO
Wereda WENAGO
Selected Indictor:
Agricultural Situation: Livestock Diversity - Type of livestock and their economic
importance in the community
KebeleName
WETIKO
Type of Livestock
Sheep
Avg_Num_Per_HH
1.50
Economic_Importance_Rank
For income
Cattle: Mature Female
10.00
For income
BELE BUKISA
Cattle: Mature Female
15.00
Meat for selling
Sheep
4.00
For income
Poultry
4.00
For income
Goats
5.00
For income
TUMATA CHRECHA
Cattle: Mature Female
1.00
Milk production
Cattle: Mature Male
1.00
For selling
Goats
1.00
For selling
Sheep
1.00
For selling
Poultry
1.00
For egg production & selling
HALEMO
Sheep
1.00
Saving
Poultry
1.00
Egg, production / saving
Cattle: Mature Female
1.00
Selling
Mules
1.00
Transpiration
Horses
1.00
Transportation
SOKICHA
Cattle: Mature Female
1.00
For selling
Cattle: Mature Male
1.00
For selling
Sheep
1.00
For selling
Poultry
1.00
For egg production & selling
Horses
1.00
For transportation
KELECHA
Cattle: Mature Female
1.00
Milk production
Sheep
1.00
Selling
137
Page 2 of 3

Data_Collected_Date
Tuesday, December 2, 2014
Region S.N.N.P
Zone GEDEO
Wereda WENAGO
Selected Indictor:
Agricultural Situation: Livestock Diversity - Type of livestock and their economic
importance in the community
KebeleName
KELECHA
Type of Livestock
Mules
Avg_Num_Per_HH
1.00
Economic_Importance_Rank
Transportation
SUGALE
Sheep
1.00
Income source
Poultry
1.00
Income source
DEKO
Cattle: Mature Female
1.00
Selling ( subsidy to house hold )
Goats
1.00
Economy
Sheep
1.00
Economy
Poultry
1.00
Economy
Mules
1.00
Economy
BANKO OKOTO
Sheep
1.00
Income source
Poultry
1.00
Income source
Cattle: Mature Female
1.00
Income source
Cattle
1.00
Income source
JEMJEMO
Cattle: Mature Male
1.00
Sold for food
Sheep
1.00
Sold for food
138
Page 3 of 3
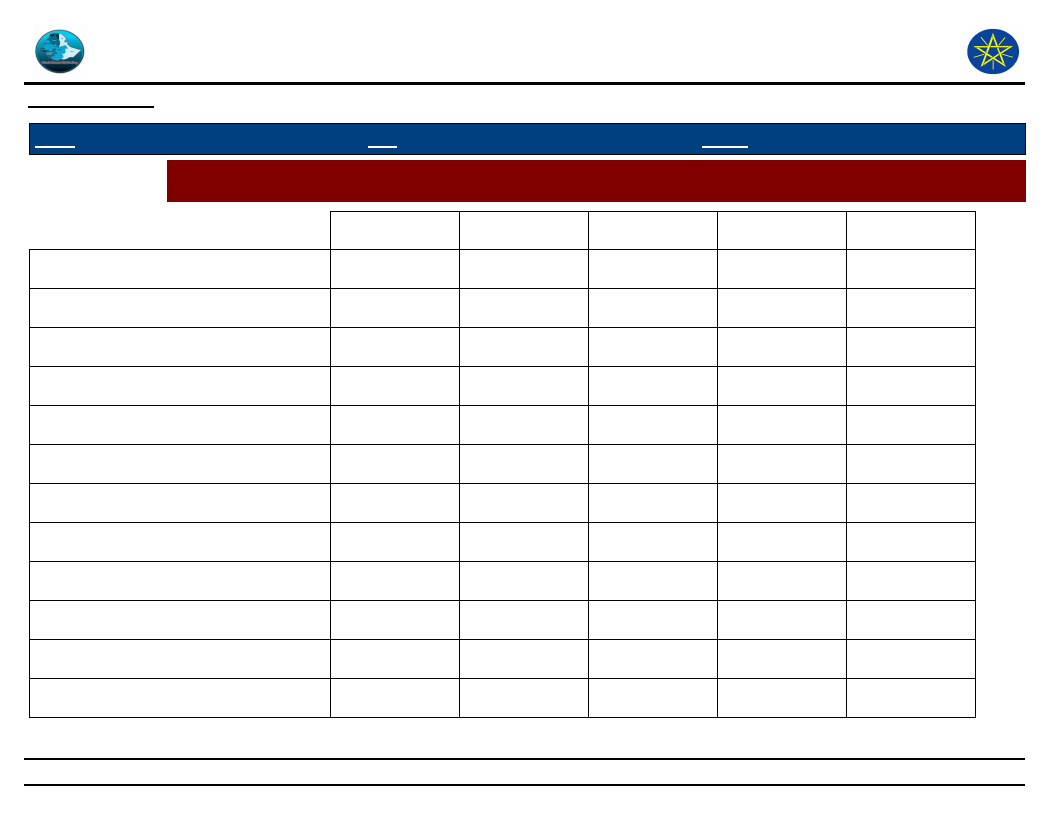
Wereda Disaster
Risk Profile
Data_Collected_Date
Disaster Risk Management
and Food Security Sector (DRMFSS)
Tuesday, December 2, 2014
Region S.N.N.P
Zone GEDEO
Wereda WENAGO
Selected Indictor:
Economic Vulnerability: Livestock Ownership and Changes - Percentage of households by number and type of
livestock owned
1–5
11 – 50
51 – 100
6 – 10
None
Bee keeping
6.80
0.30
0.30
1.50
91.10
Camels: Female
100.00
Camels: Male
100.00
Camels: Young Female
100.00
Camels: Young Male
100.00
Cattle: Female
3.60
96.40
Cattle: Male bulls
11.50
0.60
87.90
Cattle: Mature Female
7.40
0.30
0.30
92.00
Cattle: Mature Male
2.40
0.30
97.30
Cattle: under 1 year
5.30
94.70
Donkeys
0.90
99.10
Goats
1.80
98.20
139
Page 1 of 2
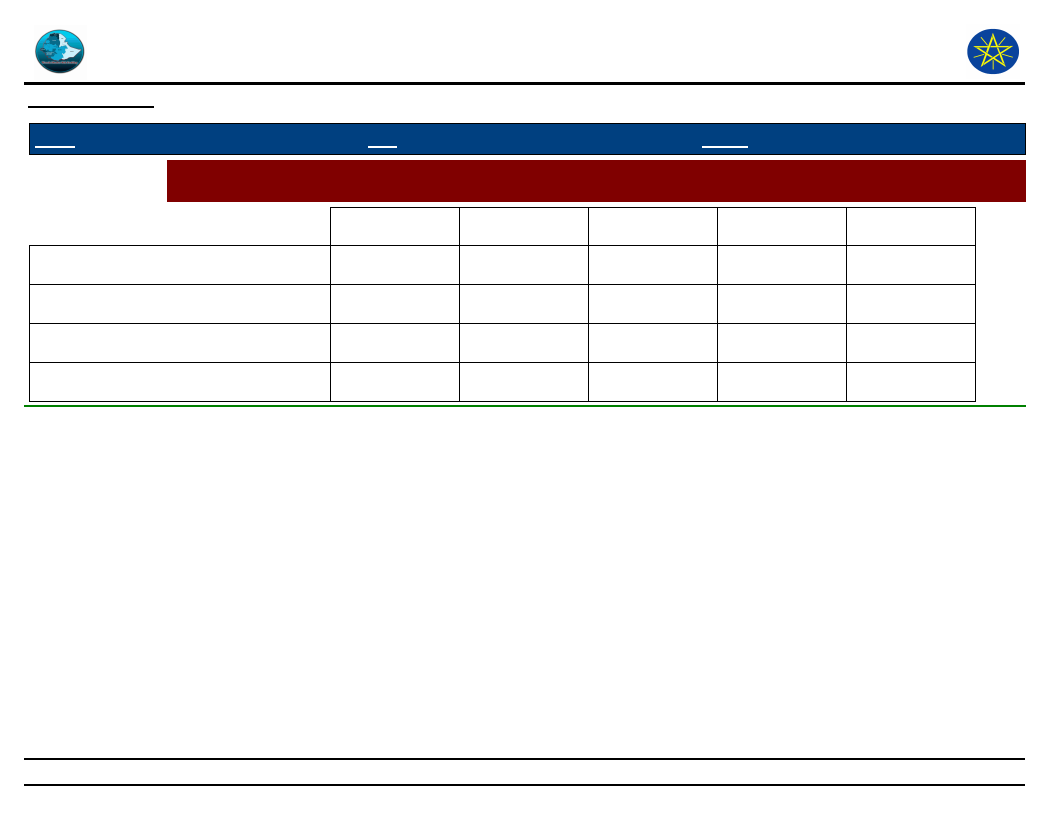
Wereda Disaster
Risk Profile
Data_Collected_Date
Disaster Risk Management
and Food Security Sector (DRMFSS)
Tuesday, December 2, 2014
Region S.N.N.P
Zone GEDEO
Wereda WENAGO
Selected Indictor:
Economic Vulnerability: Livestock Ownership and Changes - Percentage of households by number and type of
livestock owned
1–5
11 – 50
51 – 100
6 – 10
None
Horses
3.20
0.30
96.50
Mules
3.00
0.60
96.40
Poultry
29.30
0.30
0.30
3.10
67.00
Sheep
23.80
0.60
1.50
74.10
140
Page 2 of 2

Wereda Disaster
Risk Profile
Data_Collected_Date
Disaster Risk Management
and Food Security Sector (DRMFSS)
Tuesday, December 2, 2014
Region S.N.N.P
Zone GEDEO
Wereda WENAGO
Selected Indicator
Economic Vulnerability: Livestock Ownership and Changes - Households
perception on changes in livestock number in the last five years (response in %)
Type of Livestock Owned
Changes Observed By Households
Bee keeping
----
Decreased
Increased
31.00
31.00
Cattle: Female
9.10
Cattle: Male bulls
36.60
14.60
Cattle: Mature Female
42.90
17.90
Cattle: Mature Male
33.30
37.50
12.50
Cattle: under 1 year
35.30
17.60
Donkeys
Goats
20.00
Horses
30.80
Mules
25.00
Poultry
40.90
20.90
Sheep
50.60
19.50
141
Page 1 of 3

Remained the Same
37.90
48.80
39.30
50.00
47.10
100.00
80.00
69.20
75.00
38.30
29.90
142
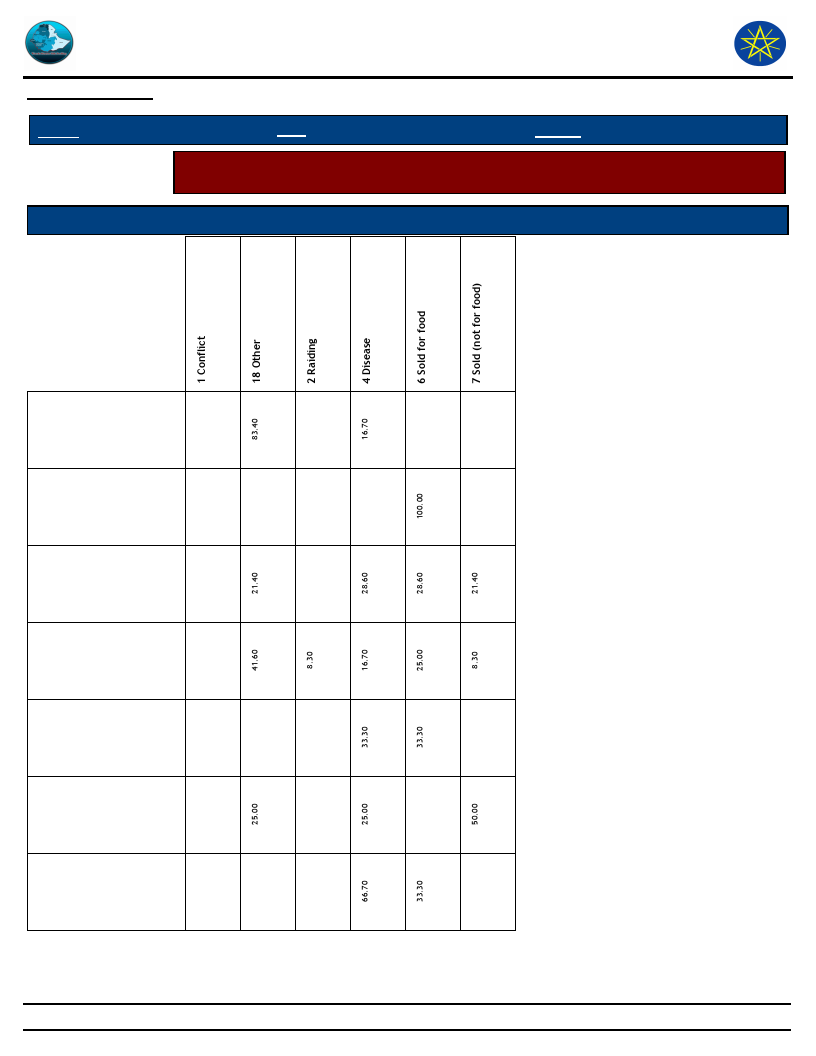
Wereda Disaster
Risk Profile
Data_Collected_Date
Disaster Risk Management
and Food Security Sector (DRMFSS)
Tuesday, December 2, 2014
Region S.N.N.P
Zone GEDEO
Wereda WENAGO
Selected Indicator
Economic Vulnerability: Livestock Ownership and Changes - Households
perception on changes in livestock number in the last five years (response in %)
Type of Livestock Owned
Reason for Decrease in Livestock Number
Bee keeping
Cattle: Female
Cattle: Male bulls
Cattle: Mature
Female
Cattle: Mature
Male
Cattle: under 1
year
Horses
143
Page 2 of 3
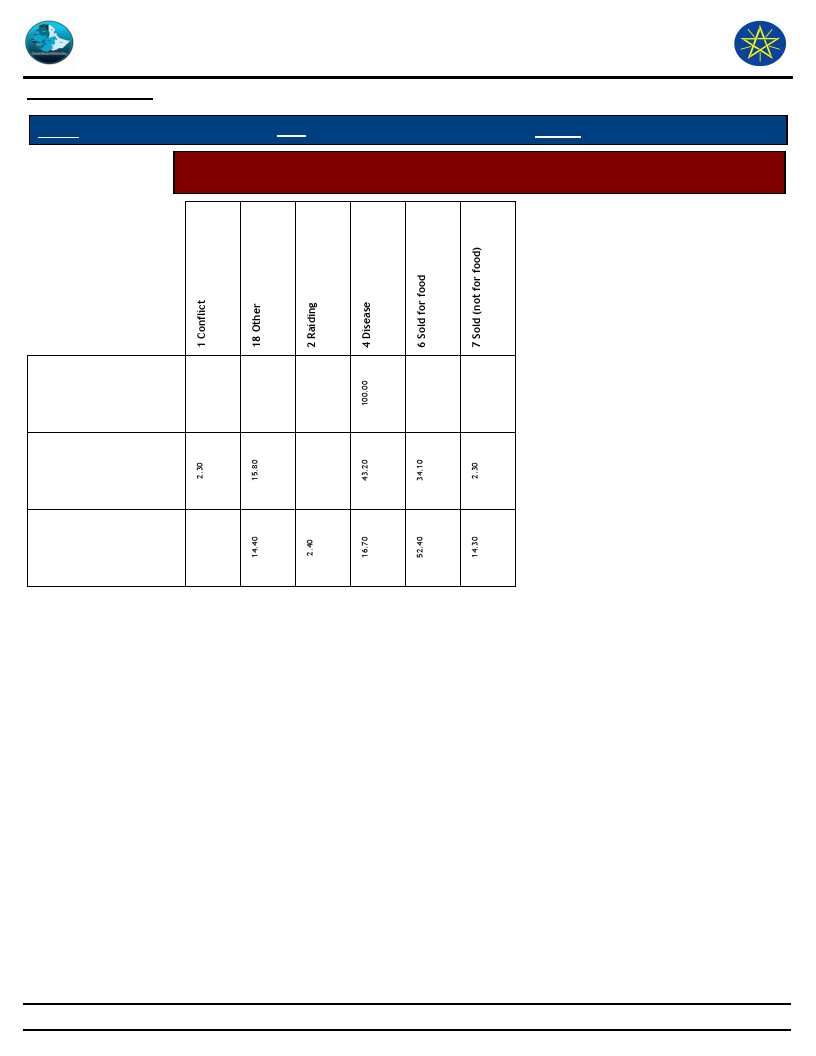
Wereda Disaster
Risk Profile
Data_Collected_Date
Disaster Risk Management
and Food Security Sector (DRMFSS)
Tuesday, December 2, 2014
Region S.N.N.P
Zone GEDEO
Wereda WENAGO
Selected Indicator
Economic Vulnerability: Livestock Ownership and Changes - Households
perception on changes in livestock number in the last five years (response in %)
Mules
Poultry
Sheep
144
Page 3 of 3
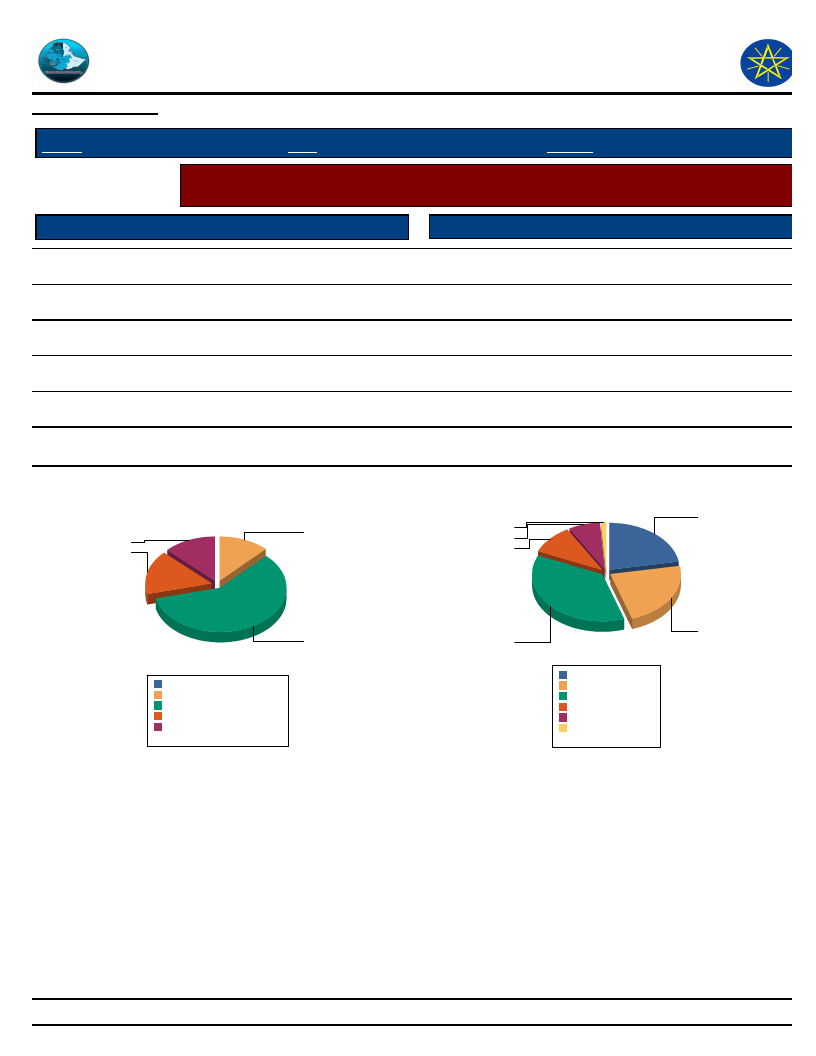
Wereda Disaster
Risk Profile
Data_Collected_Date
Disaster Risk Management
and Food Security Sector (DRMFSS)
Tuesday, December 2, 2014
Region S.N.N.P
Selected Indicator
Access to Pasture
Regularly available
Zone GEDEO
Wereda WENAGO
Agriculture (Livestock): Pasture Availability - Households perception on access
and quality of pasture
Response Percent
Quality of Pasture
Response Percent
15.87
Excellent
1.11
Occasionally
58.20
Good
22.78
Seldom available
12.70
Adequate
22.22
Never available
12.17
Poor
36.67
----
0.00
Very poor
10.00
----
0.00
DK
7.22
Household responses to Access to Pasture for
Livestock
12.2
12.7
15.9
Household responses to Quality of Pasture
22.2
1.1
7.2
10
58.2
----
0.0%
Never available
12.3%
Occasionally
58.8%
Regularly available 16.0%
Seldom available 12.8%
Total:
100.0%
36.7
Adequate
Good
Poor
Very poor
22.2%
22.8%
36.7%
10.0%
DK
Excellent
7.2%
1.1%
Total:
100.0%
22.8
145
Page 1 of 1
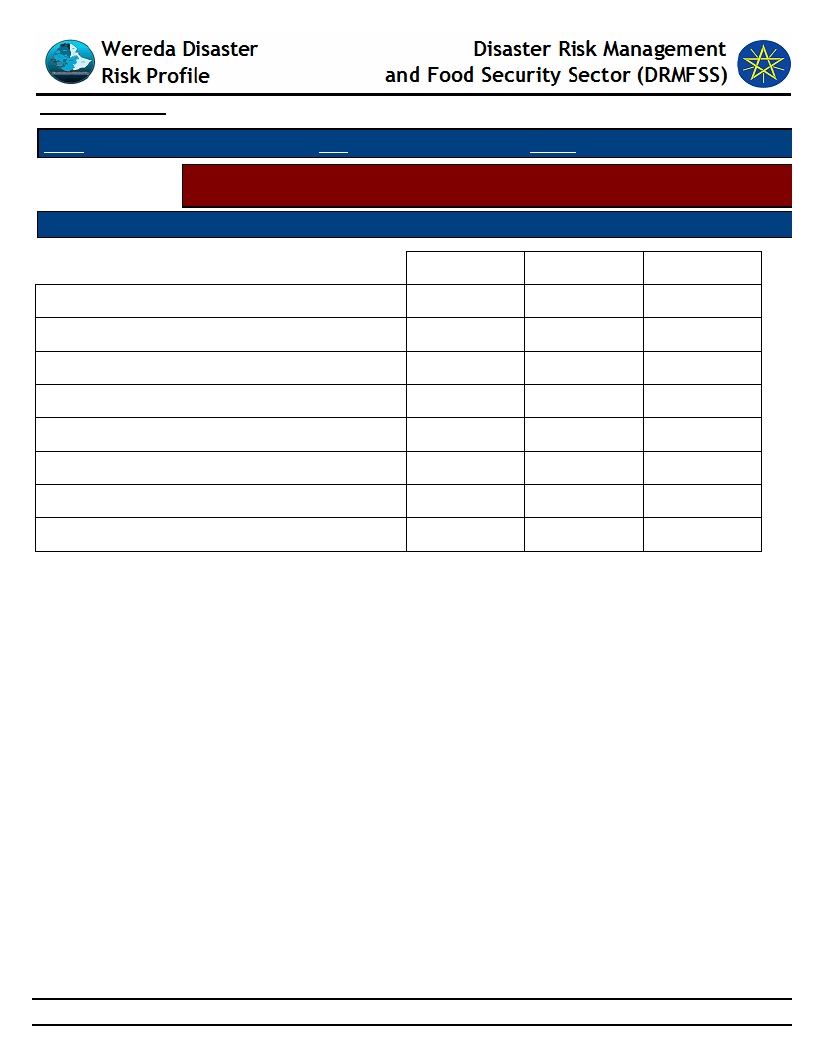
Data_Collected_Date
Tuesday, December 2, 2014
Region S.N.N.P
Zone GEDEO
Wereda WENAGO
Selected Indicator
Problematic Months
Agriculture (Livestock): Pasture Availability - Households perception on
problematic months for pasture availability
Order of Severity
Ginbot
Hamle
Meazea
Megabit
Sene
Tahsas
Tir
Yekatit
1st
36.69
1.18
55.03
7.10
2nd
0.60
0.60
6.02
0.60
1.20
90.96
3rd
3.11
58.39
37.89
0.62
146
Page 1 of 1
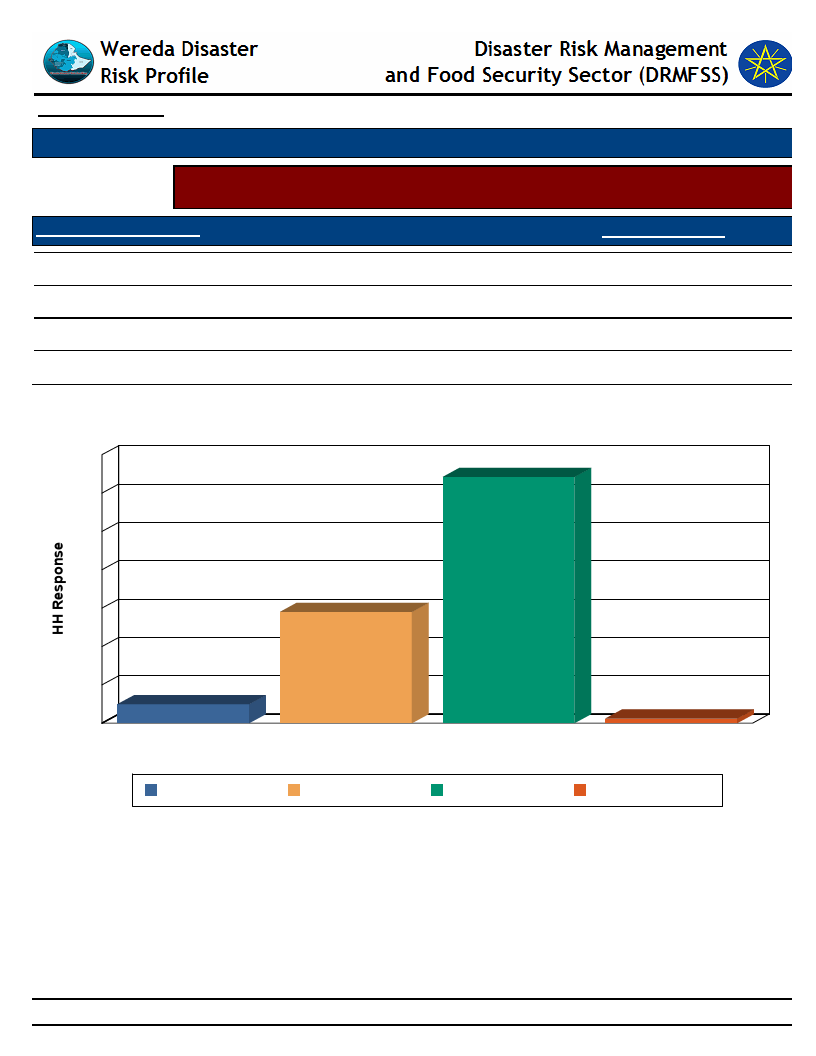
Data_Collected_Date
Tuesday, December 2, 2014
Selected Indicator
Agriculture (Livestock): Water Availability - Households response on water
availability for livestock
Access to Water - Livestock
Household Response
Regularly available
Occasionally
Seldom available
Never available
64.20
29.01
1.23
4.94
Household Access to Water for Livestock
70
64
60
50
40
30
29
20
10
5
0
Never available
Never available
Occasionally
Regularly available
Access to Water - Livestock
Occasionally
Regularly available
1
Seldom available
Seldom available
147
Page 1 of 1
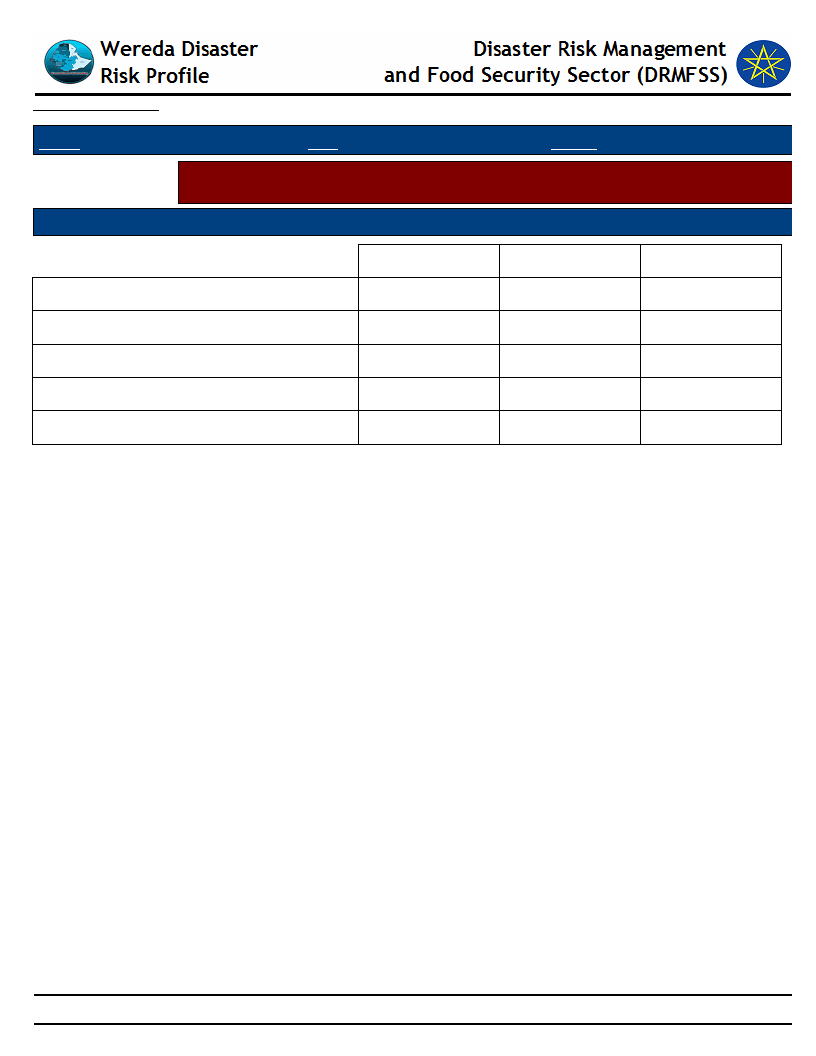
Data_Collected_Date
Tuesday, December 2, 2014
Region S.N.N.P
Zone GEDEO
Wereda WENAGO
Selected Indicator
Agriculture (Livestock): Water Availability - Households perception on
problematic months for water availability for Livestock
Problematic Months
Order of Severity
Meazea
Megabit
Nehase
Tir
Yekatit
1st
43.48
0.87
50.43
5.22
2nd
4.46
95.54
3rd
1.82
51.82
46.36
148
Page 1 of 1
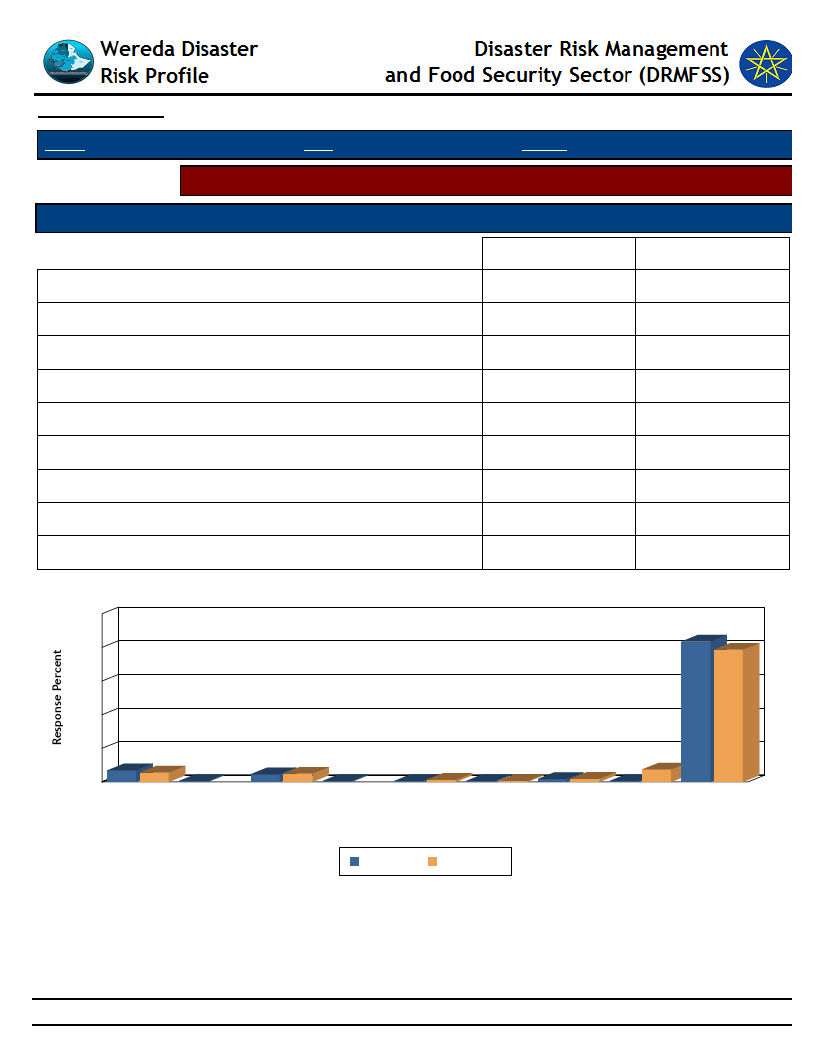
Data_Collected_Date
Tuesday, December 2, 2014
Region S.N.N.P
Zone GEDEO
Wereda WENAGO
Selected Indicator
Sources of water for livestock (households response in %)
Type of Livestock Owned
Changes Observed By Households
Pond or lake (open access)
Communal tap (Bono)
DK
Open/Deep well
Other
Piped water outside the house
Pond or lake (fenced)
Rainwater harvesting
River, stream
Dry Season
6.86
0.57
4.57
0.57
0.57
0.57
1.71
0.57
83.43
Wet Season
5.52
4.91
1.23
0.61
1.84
7.36
78.53
Household Responses to Type of Water Source and Season for Livestock
100
83
80
79
60
40
20
7
6
1
0
Pond or lake Communal tap
(open access)
(Bono)
5
5
DK
1
1
1
1
1
Open/Deep
well
Other
Piped water
outside the
house
Type of Water Source & Season
2
2
Pond or lake
(fenced)
Dry Season
Wet Season
7
1
Rainwater
harvesting
River, stream
149
Page 1 of 1
WDRP Indicators
Access to Market and Credit
150

Wereda Disaster
Risk Profile
Disaster Risk Management
and Food Security Sector (DRMFSS)
Data_Collected_Date
Tuesday, December 2, 2014
Region S.N.N.P
Zone GEDEO
Wereda WENAGO
Selected Indictor:
KebeleName
GASELCHO
DODORO
TOKOCHA
MEKONISA
DABOTA
KERA SODITY
HASEHARO
WETIKO
Economic Vulnerability: Proportion of Produce Sold and Market - Proportion of crops and livestock sold from total
production and markets
Market_For_Crops
Market_For_Livestock_Produce
Percent
Livestock_Sold
Total_% Comments
Sold
Wenaga, Hassa, Re
PA
Wenefe, Sakcha
95
55
Read the necessary material to
sell the crop to balance the
economy to sell the livestock &
livestock produce
Wonago, Della, to
Wonage & sokicha
75
35
The size household families are
cooperative
very high so the consumption is
very high
Wonago , Hassa
No product
5
95
Have not enough product, the
product is hand mouth
Wonago, co-
Not enough at household
85
operative market
The product is hand to mouth
Wonago, sokecha
Wonago, sokecha
85
15
Have not enough product,
Economic hard ship
Wonago , Kote
Wonago , Kote
85
25
From agricultural to get less
production & we have
economical hardship
85
15
Economic hardship, to exchange
asset by another goods
95
BELE BUKISA
95
The farmers exploited by made
men merchant
151
Page 1 of 2
Wereda Disaster
Risk Profile
Disaster Risk Management
and Food Security Sector (DRMFSS)
Data_Collected_Date
Tuesday, December 2, 2014
Region S.N.N.P
Zone GEDEO
Wereda WENAGO
Selected Indictor:
KebeleName
TUMATA CHRECHA
HALEMO
SOKICHA
KELECHA
SUGALE
DEKO
BANKO OKOTO
Economic Vulnerability: Proportion of Produce Sold and Market - Proportion of crops and livestock sold from total
production and markets
Market_For_Crops
Market_For_Livestock_Produce
Percent
Livestock_Sold
Total_% Comments
Sold
Wenago market
Wenago market centre
100
centre
80
Because of most crop production
selling (coffee ) but all animals
are sell due to economical
problem
Blue woreda repay
Repa and sokicha market centre
100
market centre
90
Most crop productions are cash
crop
For coffee sokicha,
Sokicha local market and
10
local market
wenago central market
90
Kocho- use to home consumption,
livestock selling all due to
economic problem
Kelecha, hasse
wonago market centre
100
harrow and wonago
market centre
90
Most selling crops are cash crop (
coffee )
Wonago, central
Wonago , central market
100
market
95
Selling higher percent of crop
and livestock because to recover
household basic needs
local market ( red
Wonago market centre
100
cheery, coffee )
70
Selling high percent of crop and
livestock because to recover
household expense or consumption
local market centre
sokicha, Keble market centre
100
80
To cover household expense
JEMJEMO
Wonago, market
Wonago, market centre
100
centre
85
To use household consumption
152
Page 2 of 2
Data_Collected_Date
Region S.N.N.P
Selected Indicator
Tuesday, December 2, 2014
Zone GEDEO
Wereda WENAGO
Economic Vulnerability: Kebele Access to Markets - Access to market by Kebele
Kebele Name
GASELCHO
DODORO
TOKOCHA
MEKONISA
DABOTA
KERA SODITY
HASEHARO
WETIKO
BELE BUKISA
TUMATA CHRECHA
HALEMO
SOKICHA
KELECHA
SUGALE
DEKO
BANKO OKOTO
JEMJEMO
Market_Access_Comments
Shortage of transportation and Road problem
Have no central market, lack of Legal merchant , road and transportation problem
No product to sell to the market
No products to sell to the market
Shortage of transport, road problem
Problem of transportation, monopolize, no central market
Road problem for product
Seasonal problem - Road
Road problem to the markets and price of coffee is very low, Dalliance of banks not give
loan for co - operative on time
Luck of marketing information for livestock production
Distance from market centre, lack of information about market price
The market near to the Kebele , the main problem are information about market price
Distance from market centre, lack of I information about market price
No legal coffee market place, lack of information about market price, far distance to the
market
Lack of information about market price , distance from central market
The kebele is very far from central market, lack of information about market price,
cheating by brokerage
Lack of awareness about market price , no formal market place, distance from central
market
153
Page 1 of 1
Data_Collected_Date
Tuesday, December 2, 2014
Region S.N.N.P
Zone GEDEO
Wereda WENAGO
Selected Indicator
Economic Vulnerability: Formal & Informal Transfers - Percentage of households
reporting received formal transfers
Type of Formal Transfer
Food aid
HH Response Type of Informal Transfer
Formal
13.40 Remittances (from relative living elsewhere)
Cash-for-Work project
7.40 Zakaat
7.10 Other cash gift
Faffa
4.70 Cash loan (no interest)
Free cash
9.80 Food or grain gift
Credit support
0.30 Seed gift
tools and seeds
Seed loan
Livestock
Free labour
Free use of oxen or plough
Free use of pack animals (camels or donkeys)
Cash or kind gift to married daughters when they visit
parents or relatives
Dowry given to bride’s parents
HH Response
2.40
0.60
2.40
0.90
4.20
1.20
0.30
2.40
0.60
0.30
0.30
0.30
Type of Formal Transfer Received By Households
9.8
13.4
7.4
0.3
Cash-for-Work project
Credit support
Faffa
Food aid
Free cash
Livestock
tools and seeds
0.0%
20.8%
0.8%
13.2%
37.6%
27.5%
0.0%
0.0%
Total:
100.0%
4.7
154
Page 1 of 1
Data_Collected_Date
Tuesday, December 2, 2014
Region S.N.N.P
Zone GEDEO
Wereda WENAGO
Selected Indicator
Economic Vulnerability: Formal & Informal Transfers - Percentage of households
reporting received Informal transfers
Type of Formal Transfer
Food aid
HH Response Type of Informal Transfer
Formal
13.40 Remittances (from relative living elsewhere)
HH Response
2.40
Cash-for-Work project
7.40 Zakaat
0.60
7.10 Other cash gift
2.40
Faffa
4.70 Cash loan (no interest)
0.90
Free cash
9.80 Food or grain gift
4.20
Credit support
0.30 Seed gift
1.20
tools and seeds
Seed loan
0.30
Livestock
Free labour
2.40
Free use of oxen or plough
0.60
Free use of pack animals (camels or donkeys)
0.30
Cash or kind gift to married daughters when they visit
0.30
parents or relatives
Dowry given to bride’s parents
0.30
Type of Informal Transfer Received By Households
7
10
0
Cash-for-Work project
Credit support
Faffa
Food aid
Free cash
Livestock
tools and seeds
0.0%
20.8%
0.8%
13.2%
37.6%
27.5%
0.0%
0.0%
Total:
100.0%
5
13
155
Page 1 of 1
Data_Collected_Date
Tuesday, December 2, 2014
Region S.N.N.P
Selected Indicator
Zone GEDEO
Wereda WENAGO
Capacity: Access to Credit Facilities - Households access to credit facilities
Type of Access To Credit Facilities
Households with membership in any credit /micro finance society (%)
Households who borrowed any money in the last one year (%)
Households who tried to borrow 1-2
Households who tried to borrow 3-4
Households who tried to borrow 5 & Above
Households who managed to get credit 1-2
Households who managed to get credit 3-4
Households who managed to get credit 5 & Above
Indicator_Value
14.80
12.50
40.00
55.00
5.00
90.38
7.69
1.92
Average No. of HHs Tried to get Credit
Average No. HHs Managed to get Credit
2.63
1.56
156
Page 1 of 1
Data_Collected_Date
Tuesday, December 2, 2014
Region S.N.N.P
Zone GEDEO
Wereda WENAGO
Selected Indicator
Capacity: Access to Credit Facilities - Percentage of households by major reasons
of borrowing money
Type of Borrowing Reason
Degree of Importance of the Borrowing Reasons - HH Respones
Buy agricultural input
Buy food
Buy or rent land
Others (specify)
Pay for education
Pay for health care
Pay for social event
1st
Important
13.21
39.62
5.66
11.32
5.66
3.77
20.75
2nd
Important
7.14
28.57
2.38
11.90
19.05
21.43
9.52
3rd
Important
3.85
11.54
3.85
11.54
15.38
7.69
42.31
157
Page 1 of 1

Data_Collected_Date
Tuesday, December 2, 2014
Region S.N.N.P
Zone GEDEO
Wereda WENAGO
Selected Indicator
Capacity: Access to Credit Facilities - Percentage of households by major sources
of credit
Major Sources of Credit for Households
Degree of Importance of the Credit Source
Bank/formal lending institution
1st
Important
20.83
2nd
Important
3rd
Important
Friends/relatives
22.22
50.00
Help associations (Edir)
4.17
Informal savings group (Ekub)
20.83
22.22
25.00
Local shops / moneylenders
43.75
11.11
25.00
Neighbors
50.00
33.33
Others (specify)
25.00
25.00
158
Page 1 of 1
Data_Collected_Date
Tuesday, December 2, 2014
Region S.N.N.P
Zone GEDEO
Wereda WENAGO
Selected Indicator
Capacity: Access to Credit Facilities - Percent of households with ability to raise
500 birr in one week
HH Ability To Raise 500 Br in One Week
Response_Percent
Yes, we would use our savings
8.66
Yes, by borrowing money
6.98
Yes, with some help from others
0.56
Perhaps, but I doubt it
6.15
No, it would be impossible
73.46
DK
3.63
NA
0.56
Households' Ability To Raise 500 Br in One Week
1
9
4
7
1
6
DK
NA
No, it would be
impossible
Perhaps, but I doubt it
Yes, by borrowing
money
Yes, we would use our
savings
Yes, with some help
from others
73
159
Page 1 of 1
WDRP Indicators
Health and Sanitation
Characteristics
160
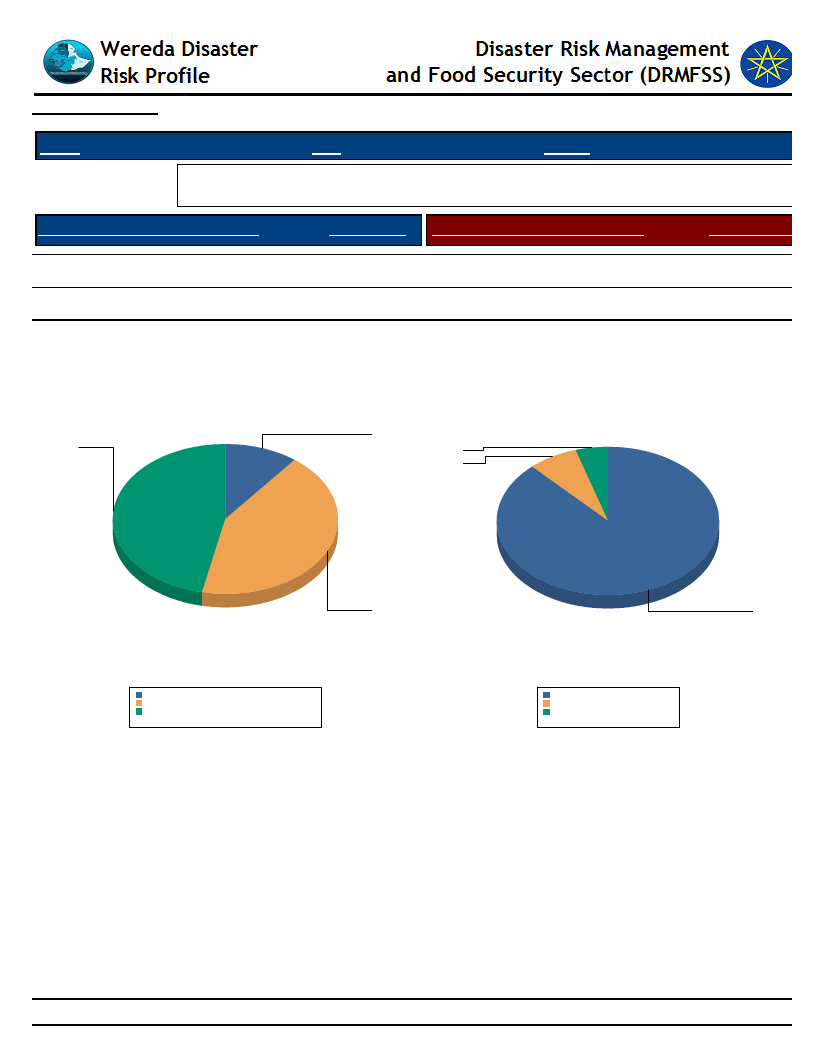
Data_Collected_Date
Tuesday, December 2, 2014
Region S.N.N.P
Zone GEDEO
Wereda WENAGO
Selected Indicator
Household Access to Health Facilities - Where do patients go for health care?
Constraints to adequate healthcare
Where do Patients Go for Healthcare
HH Response Constraints to Adequate Health Car
HH Responses
Did not get Health Care
15.22
Central Hospital
3.81
District/Municipal hospital/health
centre/ clinic
16.61
Where Do Patients go for Health care?
No money for treatment costs
Religious reasons
No Reasons
88.10
4.76
7.14
Constraints to Adequate Health Care
4
17
5
7
15
Central Hospital
10.7%
Did not get Health Care
42.7%
District/Municipal hospital/health centre/ clinic 46.6%
Total:
100.0%
88
No money for treatment costs 88.1%
No Reasons
7.1%
Religious reasons
4.8%
Total:
100.0%
161
Page 1 of 1

Data_Collected_Date
Tuesday, December 2, 2014
Region S.N.N.P
Selected Indicator
Zone GEDEO
Wereda WENAGO
Hazards: Health problems and changes over the last decade
Kebele Name
Health_Problems
Changes_In_Last_Decade
GASELCHO
DODORO
TOKOCHA
MEKONISA
DABOTA
KERA SODITY
HASEHARO
WETIKO
BELE BUKISA
TUMATA CHRECHA
HALEMO
SOKICHA
KELECHA
SUGALE
DEKO
BANKO OKOTO
JEMJEMO
No
Malaria, typhoid, typhus
Malaria, Typhoid and typhus TB
TB, typhoid & typhus
Malaria, Typhoid and typhus TB
Malaria
Malaria, Typhoid, typhus and TB
Malaria
Malaria
Malaria, typhoid, typhus
Malaria, typhoid, typhus
Typhus, malaria, typhoid
Typhus, Typhus, malaria
Malaria, malnutrition
Malaria, diarrhea, malnutrition
Water born disease, distance from health, malnutrition
Malaria, malnutrition, influenza, typhoid
No
Increasing
Increasing
Increasing
Increasing
Decrease
Improved
Decreasing
Decreasing
Improved
Improved
Improved
Progress
Improved
Improved
Progress
162
Page 1 of 1
Wereda Disaster
Risk Profile
Data_Collected_Date
Disaster Risk Management and Food
Security Sector (DRMFSS)
Tuesday, December 2, 2014
Region S.N.N.P
Zone GEDEO
Wereda WENAGO
Selected Indicator
Household Health Status - Households health condition and major health problems
Health Condition
HH Response Population Sickness
HH Response Children Sickness
HH Response
Good health
85.0
Malaria
26.0 Chronic fever
8.0
Ill for <3 months
10.0
Headache
14.0 Malaria
14.0
Ill for more than three months
5.0
Stomach pain
9.0 Diarrhea
22.0
NR
0.0
Back ache
6.0 Headache
14.0
Tuberculosis
6.0 Meningitis
12.0
Diarrhea
5.0 HIV/AIDS
2.0
Hyper tension
1.0
Asthma
1.0
Chronic fever
4.0 Stomach pain
2.0
Pneumonia/ lung problem
3.0 Mental illness
4.0
Mental illness
3.0
Meningitis
3.0
Eye problems
2.0
HIV/AIDS
1.0
2.0
163
Page 1 of 2
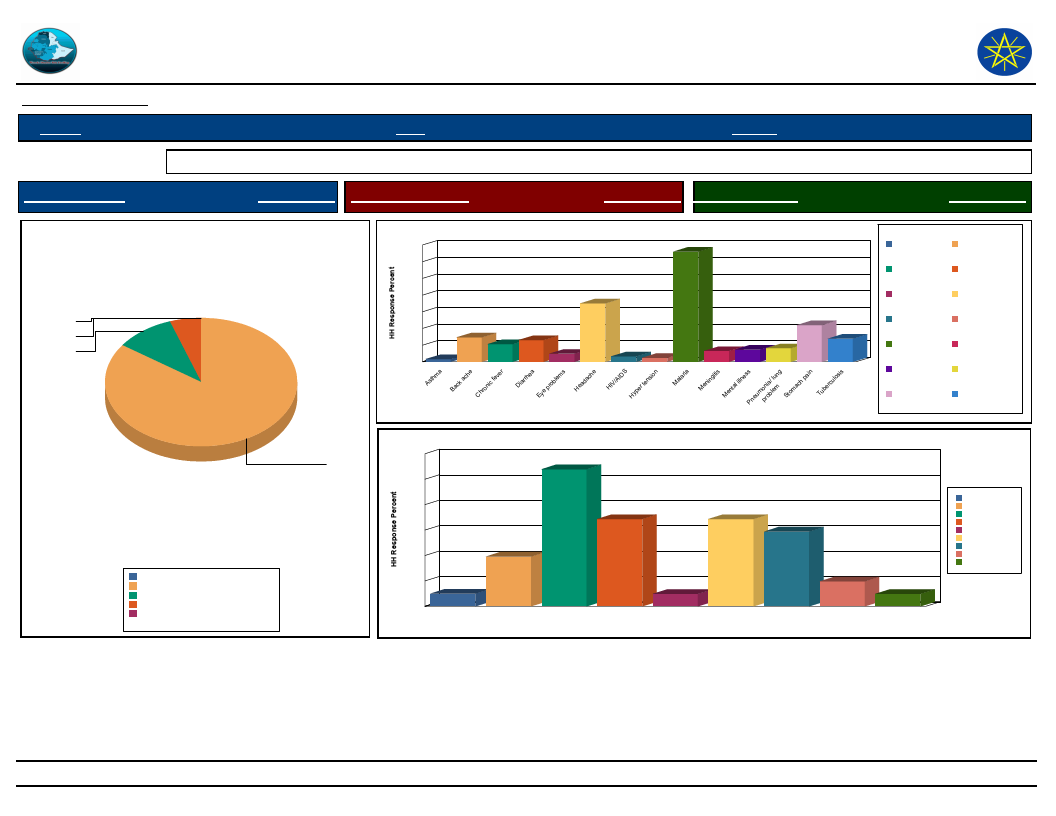
Wereda Disaster
Risk Profile
Data_Collected_Date
Disaster Risk Management and Food
Security Sector (DRMFSS)
Tuesday, December 2, 2014
Region S.N.N.P
Zone GEDEO
Wereda WENAGO
Selected Indicator
Household Health Status - Households health condition and major health problems
Health Condition
HH Response Population Sickness
HH Response Children Sickness
HH Response
Health Condition of the Community
0.1
5.1
10.2
84.6
Good health
Ill for <3 months
Ill for more than three months
NR
0.0%
84.6%
10.2%
5.1%
0.1%
Total:
100.0%
Population Sickness in the Community
28
26
24
20
16
14
12
8
6
5
4
4
2
1
0
1
1
9
6
3
3
3
Population Sickness
Asthma
Chronic fever
Eye problems
HIV/AIDS
Malaria
Mental illness
Stomach pain
24
20
16
12
8
4
2
0
Children Sickness in the Community
22
14
14
8
Chronic fever
Diarrhea
2
Headache
HIV/AIDS
Children Sickness
Malaria
12
4
2
Meningitis
Mental illness Stomach pain
Back ache
Diarrhea
Headache
Hyper tension
Meningitis
Pneumonia/ lung
problem
Tuberculosis
Chronic fever
Diarrhea
Headache
HIV/AIDS
Malaria
Meningitis
Mental illness
Stomach pain
164
Page 2 of 2
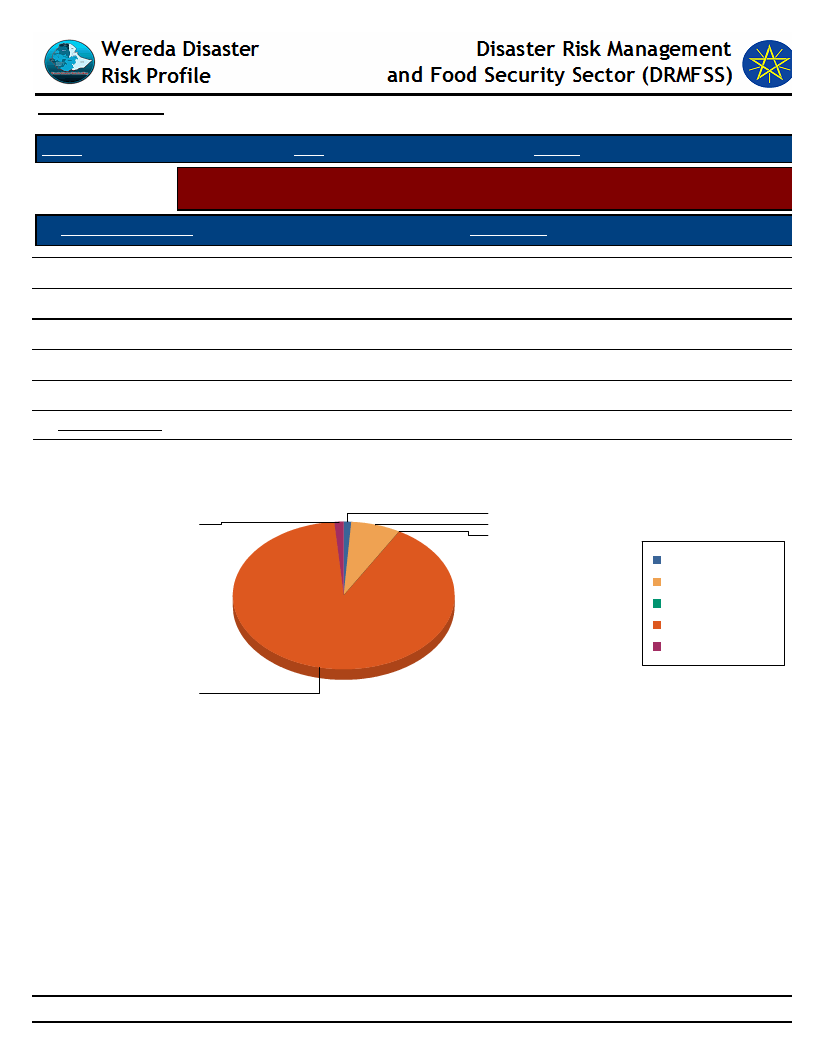
Data_Collected_Date
Tuesday, December 2, 2014
Region S.N.N.P
Zone GEDEO
Wereda WENAGO
Selected Indicator
Household Access to Sanitation - Percentage of households with access to
different kind of toilet facilities
Type of Toilet Facility
HH Response
Modern water closet
Ventilated, build in latrine
Outdoors latrine/hole on plot
No facilities/Open Space
Other
HH Sharing Toilet
1.03
1.28
90.26
7.18
0.26
16.30
Household Responses to the type of toilet facilities in the community
1.3
90.3
1.0
7.2
0.3
Modern water closet
No facilities/Open Space
Other
Outdoors latrine/hole on
plot
Ventilated, build in
latrine
165
Page 1 of 1
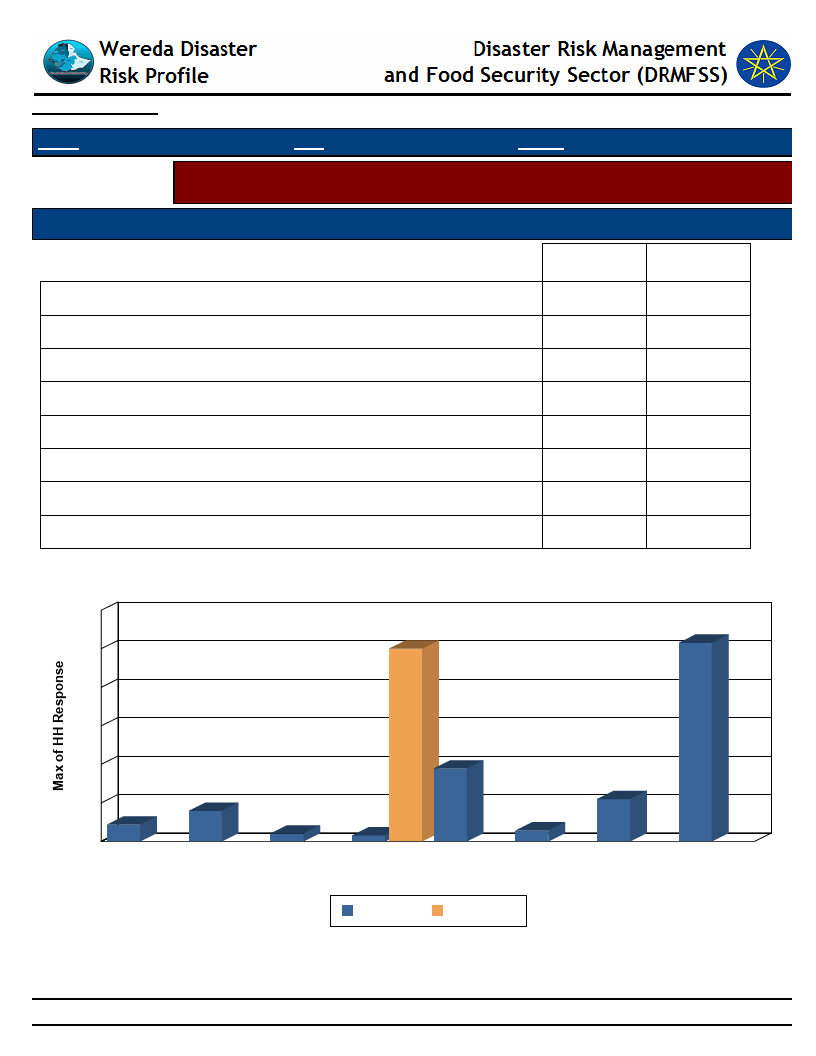
Data_Collected_Date
Tuesday, December 2, 2014
Region S.N.N.P
Zone GEDEO
Wereda WENAGO
Selected Indicator
Household Access to Drinking Water - Sources of drinking water for households
(response in %)
Sources of drinking water for Households
Priority of the Water Source
Main
Secondary
Communal tap (Bono)
Covered well or borehole
Open well
Other
Piped water outside the house
Pond or lake (fenced)
Pond or lake (open access)
River, stream
4.34
7.91
2.04
1.53
18.88
2.81
10.97
51.53
0.00
0.00
0.00
50.00
0.00
0.00
0.00
0.00
Source of Drinking Water & Type of Source
60
50
52
50
40
30
20
10
8
4
2
0
Communal Covered well Open well
tap (Bono) or borehole
2
Other
Main
19
11
3
Piped water Pond or lake Pond or lake River, stream
outside the (fenced)
(open
house
access)
Secondary
166
Page 1 of 1
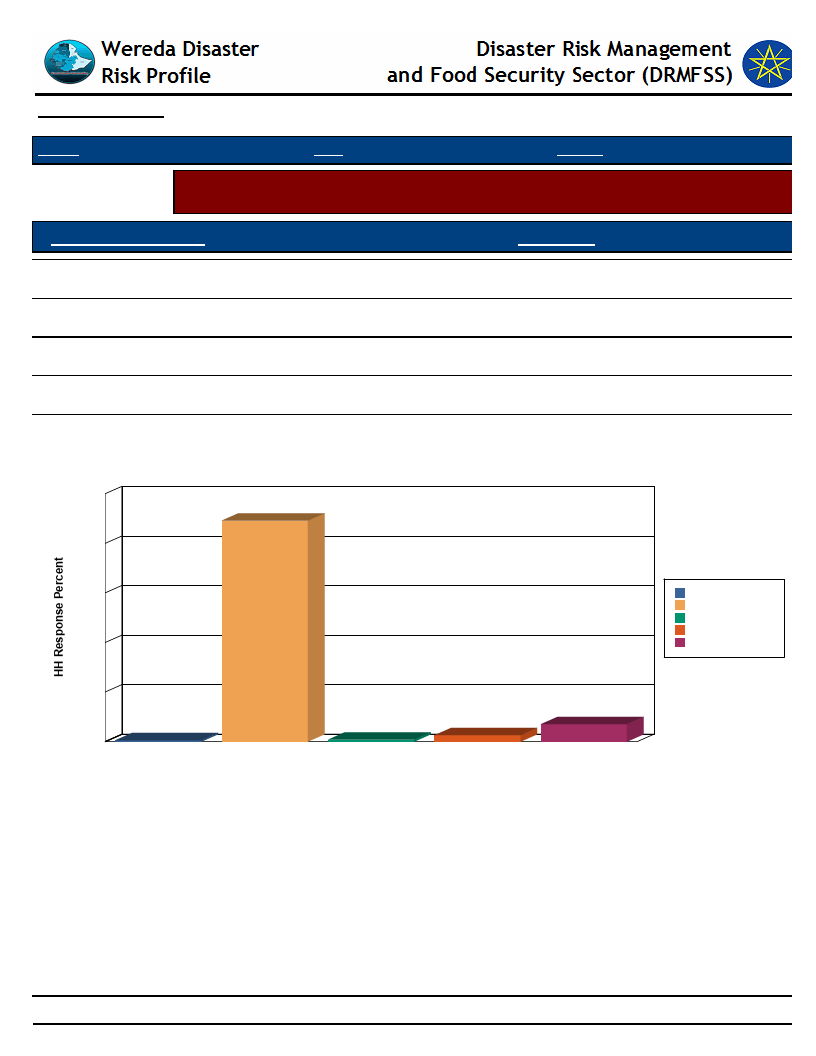
Data_Collected_Date
Tuesday, December 2, 2014
Region S.N.N.P
Zone GEDEO
Wereda WENAGO
Selected Indicator
Household Access to Drinking Water - Households methods of treating drinking
water
Method of Treating Water
HH Response
Boil
0.52
Water Guard
6.99
Use filter
2.59
Other chemicals
0.78
None
89.12
Method of Treating Water by Households
100
89
80
60
Boil
None
Other chemicals
Use filter
40
Water Guard
20
1
0
Boil
None
1
3
Other chemicals
Use filter
Water Treatment Method
7
Water Guard
167
Page 1 of 1
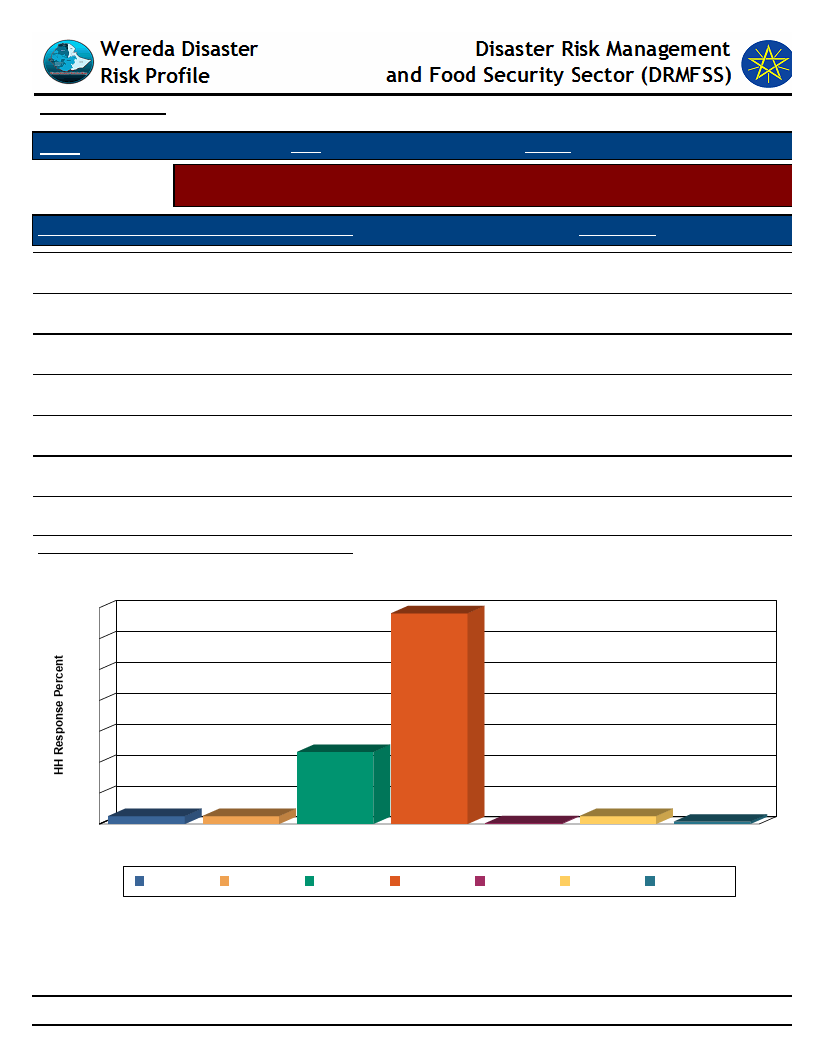
Data_Collected_Date
Tuesday, December 2, 2014
Region S.N.N.P
Zone GEDEO
Wereda WENAGO
Selected Indicator
Household Access to Drinking Water - Number of times households fetch water in
a week
Number of Times Households Fetch Water in a Week
HH Response
Once
23.33
Twice
0.77
Three times
2.56
Four times
2.56
Five times
2.56
Six times
0.26
Seven times
68.21
Average Number of Times HH Fetch Water Per Week
5.32
Number of Times HH Fetch Water in a Week
70
68
60
50
40
30
23
20
10
3
0
Five times
3
Four times
0
Once
Seven times
Six times
Number of Times HH Fetch Water in a Week
3
Three times
1
Twice
Five times
Four times
Once
Seven times
Six times
Three times
Twice
168
Page 1 of 1
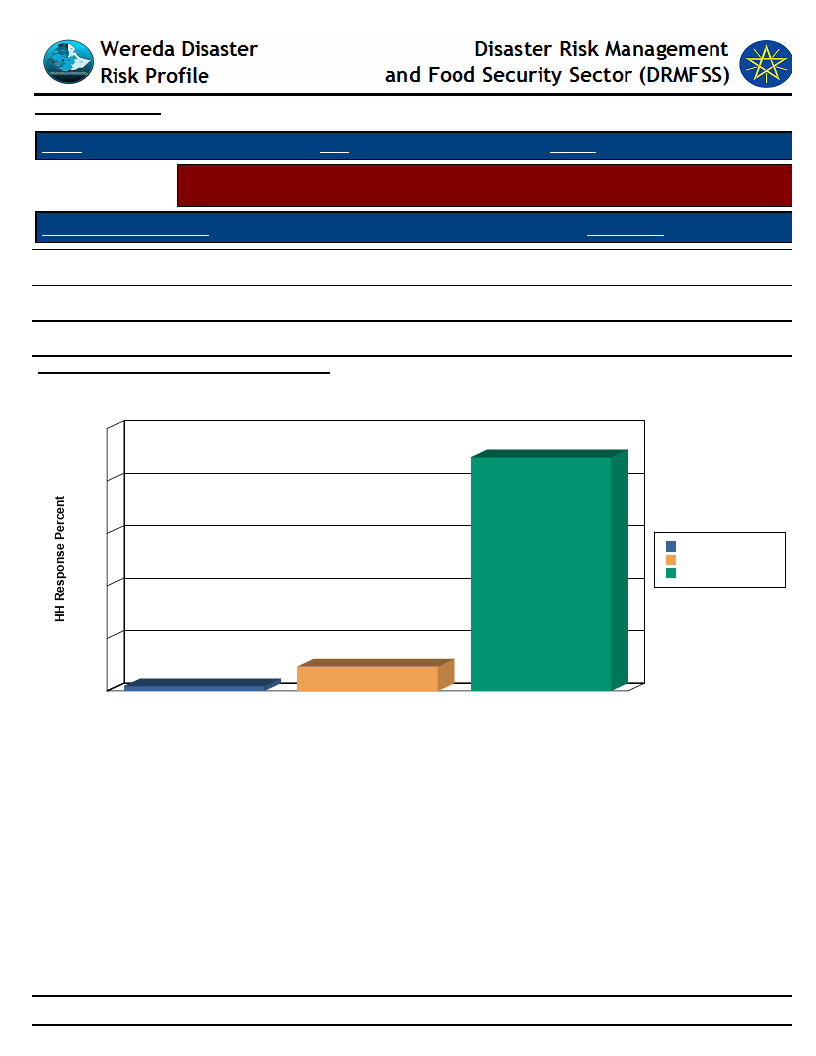
Data_Collected_Date
Tuesday, December 2, 2014
Region S.N.N.P
Zone GEDEO
Wereda WENAGO
Selected Indicator
Household Access to Drinking Water - Time taken per day to fetch water for
households
Time Taken To Fetch Water
HH Response
Less than 30 min
88.97
30 min - 1 hr
9.23
1 hr and Above
Average Number of Times Taken To Fetch Water
1.79
19.02
Time Taken To Fetch Water for the HH
100
89
80
60
1 hr and Above
30 min - 1 hr
Less than 30 min
40
20
9
2
0
1 hr and Above
30 min - 1 hr
Less than 30 min
Time Taken To Fetch Water
169
Page 1 of 1
WDRP Indicators
Coping Mechanisms and
Preparedness
170

Wereda Disaster
Risk Profile
Data_Collected_Date
Disaster Risk Management and Food
Security Sector (DRMFSS)
Tuesday, December 2, 2014
Region S.N.N.P
Selected Indicator
Zone GEDEO
Wereda WENAGO
Capacity: Community Preparedness against Sudden Onset Disasters
KebeleName
Precaution_1
Comment_1
Precaution_2
Comment_2
Precaution_3
Comment_3
GASELCHO
No
No
No
No
DODORO
TOKOCHA
MEKONISA
DABOTA
KERA SODITY
HASEHARO
To change another
place
Change to place
To change another
place
To change another
place
No
To save Survival of
life
Because not another
choice
Because for save
themselves
To save survival of
life
Flood
No
Always reactivate
root disaster
Help each other
Additional saving
Run away , change
a place
No
Because to save
themselves
Because of the
cultural
Outcome that
problem , this
system is cope the
problem
Snow
No
Run to home
from outside
WETIKO
Snow
BELE BUKISA
Snow
The run away to
home to save life
tell for others by
trading and
method
Run away to home
to save life
Flood
Flood
We cut drainage
Run away to
gather place,
171
Page 1 of 3

Wereda Disaster
Risk Profile
Data_Collected_Date
Disaster Risk Management and Food
Security Sector (DRMFSS)
Tuesday, December 2, 2014
Region S.N.N.P
Selected Indicator
Zone GEDEO
Wereda WENAGO
Capacity: Community Preparedness against Sudden Onset Disasters
KebeleName
Precaution_1
Comment_1
Precaution_2
Comment_2
Precaution_3
Comment_3
TUMATA CHRECHA
Pray to God
HALEMO
Pray to God
SOKICHA
Pray to God
KELECHA
Pray to God
SUGALE
Assembles elders,
religious leaders
peoples by
traditional shengo
To skip sudden
disaster by his
generosity
To skip sudden
disaster by his
generosity
If the disaster,
unmanageable by
the community
If the disaster
higher and un
manageable
To survive
Assemble in
variable song
To share
information
Change information
To take enough
awareness about
disaster
Migrate
If the disaster, un
by the community
Assemblage by
traditional way
(shongo )
Change
information
To pray and
change / share
information for
taking measure
together
To Retreat /
Escape
Take measure
by co-
operation
Prevention
activities with
together
Assembled at
Sango
To share local
knowledge and
force effectively
To share local
knowledge and
force
effectively
To share
information and
to take effective
measure
together
Apply to
government
when beyond
to community
capacity
To survive / To
give rapid
response
172
Page 2 of 3
Wereda Disaster
Risk Profile
Data_Collected_Date
Disaster Risk Management and Food
Security Sector (DRMFSS)
Tuesday, December 2, 2014
Region S.N.N.P
Selected Indicator
Zone GEDEO
Wereda WENAGO
Capacity: Community Preparedness against Sudden Onset Disasters
KebeleName
DEKO
BANKO OKOTO
JEMJEMO
Precaution_1
Assemble by
traditional shengo
and pray to god
Pray to God
Pray to God
Comment_1
To minimize /
destroy disaster
To cure from sudden
onset disaster
To cure from
sudden onset on set
disaster
Precaution_2
Apply to
government when
beyond to
community
capacity
Change information
Change
information
Comment_2
To survive
Retreat to escape
from disaster
Retreat to escape
from disaster
Precaution_3
Change
information
Comment_3
To retreat /
escape
173
Page 3 of 3

Wereda Disaster
Risk Profile
Disaster Risk Management and Food
Security Sector (DRMFSS)
Data_Collected_Date
Tuesday, December 2, 2014
Region S.N.N.P
Zone GEDEO
Wereda WENAGO
Selected Indicator
Capacity: Community Preparedness against Increase in Disaster Intensity
KebeleName
Precaution_1
Comment_1
Precaution_2
Comment_2
Precaution_3
Comment_3
GASELCHO
DODORO
TOKOCHA
MEKONISA
DABOTA
KERA SODITY
HASEHARO
WETIKO
BELE BUKISA
Additional saving
To migrate
another place,
Additional saving
To save more
To change
another place
Additional saving
Saving & credit
Saving & credit
A big solution of a
disaster
Because, to cope, &
recover the disaster
To be the basic
choice
Because prevented
the problem
To be the basic
choice at a problem
Helping each other
Planted a short of
period of crop
As weather,
condition to plated
selected plant
To collect water
We depend on a
shortage of crop
Additional saving
To recover
A big solution of a
problem
To cover economic
crises and assets
loss
To get money to
solve problem
Planted a short
period crop
Reporting
Sowing 3 months
short period crop
To reach a short
period of time
Because to cope as a
disaster
To cultivate
additional land
Because to reach a
short period of time
To be the basic
choice at a problem
Saving
To reach a short
period of time
To Administration
to get aid
To get food
Change other
place
To live
sustainably
To sow planted
a seasonal crop
To cope the
problem
To buy crop
To cultivate
land
Ekub
To help each
other
174
Page 1 of 3

Wereda Disaster
Risk Profile
Disaster Risk Management and Food
Security Sector (DRMFSS)
Data_Collected_Date
Tuesday, December 2, 2014
Region S.N.N.P
Zone GEDEO
Wereda WENAGO
Selected Indicator
Capacity: Community Preparedness against Increase in Disaster Intensity
KebeleName
Precaution_1
Comment_1
Precaution_2
Comment_2
Precaution_3
Comment_3
TUMATA CHRECHA
HALEMO
SOKICHA
KELECHA
SUGALE
DEKO
Doing other
income generate
activities
Replace the
farmer crop by
improve variety
Petty trade
Change work
Sowing diastase
resistant and
improved seeds
Build public
latrine appropriate
place, keep
community
sanitation
To improve income
generate
For existent and
continuous way of
reducing effects of
disasters
Easy to work in this
area
Subject measure
Increased
production and
productivity and
insure food security
To prevent
community from
communicable
disease
Migration
Migration
Daily labour
The farmer crop
replace by other
type of crop
Treatment of farm
land
Removed attack
crop and substitute
by other crop
For better job and
income generate
activities
For better job and
income generate
activities
On option of income
generate
Existent and
continuous option of
measure
Disease prevention
and control
Develop production
and productivity
Replant other
type of crop
cannot be
affected by
pest or disease
Community
discussion
To solve the
problem
continuously
To solve the
problem
continuously
Migration
Resettlement
Work soil and
water
conservation
activities
Working soil
and water
conservation
activity
To find better
job opportunity
Existent and
continuous
option of
measure
Create safe
environment
Create
sustainable
development
175
Page 2 of 3

Wereda Disaster
Risk Profile
Disaster Risk Management and Food
Security Sector (DRMFSS)
Data_Collected_Date
Tuesday, December 2, 2014
Region S.N.N.P
Zone GEDEO
Wereda WENAGO
Selected Indicator
Capacity: Community Preparedness against Increase in Disaster Intensity
KebeleName
Precaution_1
Comment_1
Precaution_2
Comment_2
Precaution_3
Comment_3
BANKO OKOTO
JEMJEMO
Removed attack
crops and
substitute by other
crops
Soil and water
conservation
activities
To increased
production and
productivity
To become
sustainable
development
Provide prevention
medicine for human
and crop diseases
To control disease
Keep personal and
environmental
satiation
To create health
family and safe
environment
Keep personal
and
environmental
sanitation
Planting new
variety of seed,
development
saving habit
To prevent and
control disease
Increasing
production
insure
household food
security
176
Page 3 of 3

Wereda Disaster
Risk Profile
Disaster Risk Management and Food
Security Sector (DRMFSS)
Data_Collected_Date
Tuesday, December 2, 2014
Region S.N.N.P
Zone
GEDEO
Wereda WENAGO
Selected Indicator
Capacity: Community Preparedness against Disasters
Kebele Name
Precaution 1
Comment 1
Precaution 2
Comment 2
Precaution 3
Comment 3
GASELCHO
DODORO
TOKOCHA
MEKONISA
DABOTA
KERA SODITY
Saving
To save money
A big solution for the
problem
From saving survival
of life
To Develop sowing
different types ,
crops
To prevent at the
problem
Saving
Sowing a short
period of time
For coped the
problem
Cope problem , reach
at a problem time
To save money
Additional jobs
option
To buy a cheap
calf & to sell a
fathering bull
Daily labour
Daily labour
Saving
To prevent that
disasters
Because
sustainable
prevent disaster
At seasonal
problem with
stoned a
disaster, &
To gets
additional money
We have not
another choice
Daily labour
To planted
selected tree
Only always
depend up on basic
plant to snow
selected plant
Daily labour
To buy a cheap
calf & to sell, a
fating bull
At seasonal
problem with
stand a disaster &
to gets additional
income
To get money at
a short period of
time
Because of to get
additional income
This method is the
basic one at a
problem time
Get money for
short period of
time
177
Page 1 of 4
Wereda Disaster
Risk Profile
Disaster Risk Management and Food
Security Sector (DRMFSS)
Data_Collected_Date
Tuesday, December 2, 2014
Region S.N.N.P
Zone
GEDEO
Wereda WENAGO
Selected Indicator
Capacity: Community Preparedness against Disasters
Kebele Name
HASEHARO
Precaution 1
Saving
Comment 1
A big solution of a
problem
Precaution 2
Sowing a short
period of time
crops
Comment 2
To reach a short
period of time
Precaution 3
Daily labour
Comment 3
To get money
WETIKO
Saving credit
To cover their
financial problem
Daily labour
To get income
Tread
To get money
profile & caver
home need
BELE BUKISA
Hand craft
To get money to
household expense
Small scale
material treat
from rural
market to town
To get money to
buy food crop
Sowing 3 month
short period crop
like haricot bean
To get production
use for
consumption
TUMATA
CHRECHA
Participate in
awareness creation
program
To taking any
prevention action
before disaster
Clean swamp
area , plant
improved seed
To prevent
malaria and
water born
diseases , to
increase
productivity
Work soil and
water conservation
activities, use
toilet in
appropriate place
To reduce erosion
and environmental
degradation, to
keep personal
sanitation which
prevent diseases
related
HALEMO
Soil and water
conservation
activities
Environmental
rehabilitation
Keep personal
and
environmental
sanitation
Prevention of
disease caused
by sanitation
problem
Develop saving
habit
Continuous way of
reducing effect of
disasters
178
Page 2 of 4

Wereda Disaster
Risk Profile
Disaster Risk Management and Food
Security Sector (DRMFSS)
Data_Collected_Date
Tuesday, December 2, 2014
Region S.N.N.P
Zone
GEDEO
Wereda WENAGO
Selected Indicator
Capacity: Community Preparedness against Disasters
Kebele Name
SOKICHA
Precaution 1
Clean water
logging area,
Comment 1
To control pest
reproductive,
Precaution 2
Keeping
environmental
and personal
sanitation
Comment 2
To prevent
disease causing
organism
Precaution 3
Farm following
and management
Comment 3
To control the
incident
immediately
KELECHA
Plant improved
and disease
resistant crop
Increase production
and productivity,
decrease crop disease
disaster
Clean marsh
and logging
area
Preventing
disease causing
organism or pest
Keep personal
hygiene
Prevention of
disease caused by
sanitation
problem
SUGALE
Using disease
resistance variety,
burning and
cleaning affected
crop
To insure household
food security ,
increased production
Weeding farm
land based on
farming
calendar
Treatment of
farm land, soil and
water conservation
activities
DEKO
Keep community
sanitation
For disease control &
prevention
Remove water
logging area,
using Agober
Prevent and
disease control
Planting improved
& disease
resistance seed
To increase
production &
productivity
BANKO OKOTO
Clean marsh and
water logging area
Disease prevention
and control malaria
Keep
environmental
satiation,
improved waste
disposal system
To keep
community from
water born
disease and
others human
disease
Planting improved
& disease
resistances seed,
planting short
period crop
To increase
production and
productivity , to
assure house hold
food, security
179
Page 3 of 4
Wereda Disaster
Risk Profile
Disaster Risk Management and Food
Security Sector (DRMFSS)
Data_Collected_Date
Tuesday, December 2, 2014
Region S.N.N.P
Zone
GEDEO
Wereda WENAGO
Selected Indicator
Capacity: Community Preparedness against Disasters
Kebele Name
JEMJEMO
Precaution 1
Keep personal and
environmental
sanitation
Comment 1
Disease preventing
and control
Precaution 2
Using outdoor
latrine
Comment 2
To decrease
environment
pollution and
communicable
disease
Precaution 3
Improved waste
disposal system
Comment 3
180
Page 4 of 4

Wereda Disaster
Risk Profile
Data_Collected_Date
Region S.N.N.P
Selected Indicator
Kebele Name
Type of Disaster(s)
Zone
GEDEO
Hazard: Coping and recovering during last Disaster
GASELCHO
BBC/ Bacterial blight of coffee/
Coping_Strategy
Pray to God
Disaster Risk Management and Food
Security Sector (DRMFSS)
Tuesday, December 2, 2014
Wereda WENAGO
Description
Recovery_Strategy
To ask wereda administration
Description
Community
Participation_Ways
Description
By supply different kind of help
Each people at that help each by different kind of material & money
181
Page 1 of 17

Wereda Disaster
Risk Profile
Data_Collected_Date
Region S.N.N.P
Selected Indicator
Kebele Name
Type of Disaster(s)
Zone
GEDEO
Hazard: Coping and recovering during last Disaster
DODORO
BBC
Coping_Strategy
Pray to God
Disaster Risk Management and Food
Security Sector (DRMFSS)
Tuesday, December 2, 2014
Wereda WENAGO
Description
Recovery_Strategy
To ask wereda administration
Description
No
Community
Participation_Ways
Description
We help each other by the culture
Each people at that time help each other, by different kind of material & money
182
Page 2 of 17

Wereda Disaster
Risk Profile
Data_Collected_Date
Region S.N.N.P
Selected Indicator
Kebele Name
Type of Disaster(s)
Zone
GEDEO
Hazard: Coping and recovering during last Disaster
TOKOCHA
BBC
Coping_Strategy
Pray to God
Description
Recovery_Strategy
To ask wereda on administration
Description
Community
Participation_Ways
Description
We help each other by cultural method
Help by different kind of material & money
Disaster Risk Management and Food
Security Sector (DRMFSS)
Tuesday, December 2, 2014
Wereda WENAGO
183
Page 3 of 17

Wereda Disaster
Risk Profile
Data_Collected_Date
Region S.N.N.P
Selected Indicator
Kebele Name
Type of Disaster(s)
Zone
GEDEO
Hazard: Coping and recovering during last Disaster
MEKONISA
BBC
Coping_Strategy
Daily labour, pray to God
Description
To get income
Recovery_Strategy
To ask wereda administration
Description
Community
Participation_Ways
Description
To help by cultural method
To give different kind of material & money
Disaster Risk Management and Food
Security Sector (DRMFSS)
Tuesday, December 2, 2014
Wereda WENAGO
184
Page 4 of 17

Wereda Disaster
Risk Profile
Data_Collected_Date
Region S.N.N.P
Selected Indicator
Kebele Name
Type of Disaster(s)
Zone
GEDEO
Hazard: Coping and recovering during last Disaster
DABOTA
BBC
Coping_Strategy
Pray the God
Disaster Risk Management and Food
Security Sector (DRMFSS)
Tuesday, December 2, 2014
Wereda WENAGO
Description
Recovery_Strategy
To ask wereda Administration
Description
Community
Participation_Ways
Description
We help each of other by the cultural
Each people at that time help each other by different kind of material & money
185
Page 5 of 17

Wereda Disaster
Risk Profile
Data_Collected_Date
Region S.N.N.P
Selected Indicator
Kebele Name
Type of Disaster(s)
Zone
GEDEO
Hazard: Coping and recovering during last Disaster
KERA SODITY
BBC
Coping_Strategy
To sowing a short period of crops, daily labour
Description
Plant disease resistance crop & job opportunity
Recovery_Strategy
Saving
Description
Always ready different kind of material & food
Community
Participation_Ways
Description
To borrow money each other
To buy a seed to recover from the disaster
Disaster Risk Management and Food
Security Sector (DRMFSS)
Tuesday, December 2, 2014
Wereda WENAGO
186
Page 6 of 17

Wereda Disaster
Risk Profile
Data_Collected_Date
Region S.N.N.P
Selected Indicator
Kebele Name
Type of Disaster(s)
Zone
GEDEO
Hazard: Coping and recovering during last Disaster
HASEHARO
BBC
Coping_Strategy
Pray the god, daily labour
Description
The possible option
Recovery_Strategy
To ask help from the wereda administration
Description
Community
Participation_Ways
Description
To help by cultivatable method, save money
To give different kind of material & money
Disaster Risk Management and Food
Security Sector (DRMFSS)
Tuesday, December 2, 2014
Wereda WENAGO
187
Page 7 of 17

Wereda Disaster
Risk Profile
Data_Collected_Date
Region S.N.N.P
Selected Indicator
Kebele Name
Type of Disaster(s)
Zone
GEDEO
Hazard: Coping and recovering during last Disaster
WETIKO
CBD/ coffee berry disease/, cold
Coping_Strategy
Sowing short period crop
Description
To get food
Recovery_Strategy
Working as daily labour
Description
To get income & buy food
Community
Participation_Ways
Description
Borrow money from mood micro finance
To use for home
Disaster Risk Management and Food
Security Sector (DRMFSS)
Tuesday, December 2, 2014
Wereda WENAGO
188
Page 8 of 17

Wereda Disaster
Risk Profile
Data_Collected_Date
Region S.N.N.P
Selected Indicator
Kebele Name
Type of Disaster(s)
Zone
GEDEO
Hazard: Coping and recovering during last Disaster
BELE BUKISA
Shortage of rain, CBD, climatically change
Coping_Strategy
Sowing shortage period of crop
Description
To recover from the problem and get food
Recovery_Strategy
Daily labour work
Description
To get money and buy food
Community
Participation_Ways
Description
Borrow money from other
To buy food for home consumption
Disaster Risk Management and Food
Security Sector (DRMFSS)
Tuesday, December 2, 2014
Wereda WENAGO
189
Page 9 of 17

Wereda Disaster
Risk Profile
Data_Collected_Date
Region S.N.N.P
Selected Indicator
Kebele Name
Type of Disaster(s)
Zone
GEDEO
Hazard: Coping and recovering during last Disaster
TUMATA CHRECHA
Snow
Coping_Strategy
Apply to government, use the remaining product from disaster
Disaster Risk Management and Food
Security Sector (DRMFSS)
Tuesday, December 2, 2014
Wereda WENAGO
Description
Most crops are damage
Recovery_Strategy
Plant short seasonal crop, daily labour, begging activities
Description
A few households are recovered by intercropping other plant and deposit the product
Community
Participation_Ways
Description
Church help by contribution money & food during incident, but after incident the above activates sure decreased due
to the community economic hardship
The community have same effects for recovery of affected people but the contribution is not enough
190
Page 10 of 17

Wereda Disaster
Risk Profile
Data_Collected_Date
Region S.N.N.P
Selected Indicator
Kebele Name
Type of Disaster(s)
Zone
GEDEO
Hazard: Coping and recovering during last Disaster
HALEMO
Heavy rain /snow/
Coping_Strategy
Cannot do anything during disaster
Disaster Risk Management and Food
Security Sector (DRMFSS)
Tuesday, December 2, 2014
Wereda WENAGO
Description
Most crops are damage
Recovery_Strategy
Farmer planting additional short time mature crop
Description
Few households who deposit some crop are recovered
Community
Participation_Ways
Description
Help each other by providing food, contrition money by Edir, church
For short period of time
191
Page 11 of 17

Wereda Disaster
Risk Profile
Data_Collected_Date
Region S.N.N.P
Selected Indicator
Kebele Name
Type of Disaster(s)
Zone
GEDEO
Hazard: Coping and recovering during last Disaster
TOKOCHA
BBC
Coping_Strategy
Cut out disease affected coffee ( leaf and branch )
Disaster Risk Management and Food
Security Sector (DRMFSS)
Tuesday, December 2, 2014
Wereda WENAGO
Description
To control disease transmission and reduce the disease severity
Recovery_Strategy
Plant short seasonal crop
Description
To cover the food gap and to get other income
Community
Participation_Ways
Description
The community have many way to help each other traditional by debo (golo), Edri and church
The committee work together
192
Page 12 of 17

Wereda Disaster
Risk Profile
Data_Collected_Date
Region S.N.N.P
Selected Indicator
Kebele Name
Type of Disaster(s)
Zone
GEDEO
Hazard: Coping and recovering during last Disaster
KELECHA
BBC
Coping_Strategy
The community help each other
Disaster Risk Management and Food
Security Sector (DRMFSS)
Tuesday, December 2, 2014
Wereda WENAGO
Description
The major activities of the community are effective
Recovery_Strategy
Sowing short mature crops, done additional work
Description
The activities are not enough but they would been done something
Community
Participation_Ways
Description
Help them by church traditional debo
Help for short period of time
193
Page 13 of 17

Wereda Disaster
Risk Profile
Data_Collected_Date
Region S.N.N.P
Selected Indicator
Kebele Name
Type of Disaster(s)
Zone
GEDEO
Hazard: Coping and recovering during last Disaster
SUGALE
BBC
Coping_Strategy
Help each other by borrowed money and seed/ seedling/
Disaster Risk Management and Food
Security Sector (DRMFSS)
Tuesday, December 2, 2014
Wereda WENAGO
Description
Provide food /kocho, beans, maize, peas/ fire wood , sowing other crop instead of damage
Recovery_Strategy
Works as a daily labour, selling fire wood, livestock product, borrowed seed, seedling
Description
To recover basic needs , sowing seed, harvesting for a short period of time
Community
Participation_Ways
Description
Church, Edir, Ekub, debo
Ploughing farm land, repair old house, works any agricultural activities
194
Page 14 of 17

Wereda Disaster
Risk Profile
Data_Collected_Date
Region S.N.N.P
Selected Indicator
Kebele Name
Type of Disaster(s)
Zone
GEDEO
Hazard: Coping and recovering during last Disaster
DEKO
Malaria
Coping_Strategy
Help each other by borrowed money
Disaster Risk Management and Food
Security Sector (DRMFSS)
Tuesday, December 2, 2014
Wereda WENAGO
Description
Provide food /kocho, beans, maize, peas/ fire wood, take patients to health centre
Recovery_Strategy
Selling livestock, rent farm land, selling fruit, daily labour
Description
to recover, households, basic needs
Community
Participation_Ways
Description
Church, Edir, Ekub, debo
Ploughing farm land , repair build old house, work any agricultural activity
195
Page 15 of 17

Wereda Disaster
Risk Profile
Data_Collected_Date
Region S.N.N.P
Selected Indicator
Kebele Name
Type of Disaster(s)
Zone
GEDEO
Hazard: Coping and recovering during last Disaster
BANKO OKOTO
BBC
Coping_Strategy
Help each other by borrow money from others
Disaster Risk Management and Food
Security Sector (DRMFSS)
Tuesday, December 2, 2014
Wereda WENAGO
Description
Take the patients to health centre, provide food
Recovery_Strategy
Works as daily labour, selling fire wood, livestock and livestock product, borrowed seed, seedling
Description
For food , consumption , sowing seed and harvesting for short period of time
Community
Participation_Ways
Description
Church, Edir, debo
Contribute money food repaired, build, old house, plough farm land and work, any agricultural activities
196
Page 16 of 17

Wereda Disaster
Risk Profile
Data_Collected_Date
Region S.N.N.P
Selected Indicator
Kebele Name
Type of Disaster(s)
Zone
GEDEO
Hazard: Coping and recovering during last Disaster
JEMJEMO
Acquired watering diarrhea
Coping_Strategy
Support each other by borrow money from others
Disaster Risk Management and Food
Security Sector (DRMFSS)
Tuesday, December 2, 2014
Wereda WENAGO
Description
Provide food /kocho, beans, maize, peas/, fire wood, take patients to health centre
Recovery_Strategy
Rent farm land, selling livestock, daily labour, selling fruits,
Description
To recover household by providing basic needs
Community
Participation_Ways
Description
Church, Ekub, Edir, debo
Working any agricultural activities, plough farm land, repair or build old house
197
Page 17 of 17

Data_Collected_Date
Region S.N.N.P
Zone GEDEO
Selected Indicator
Capacity: Type Community Participation
Kebele Name
Levels_Comm_Participation
GASELCHO
DODORO
TOKOCHA
MEKONISA
DABOTA
KERA SODITY
HASEHARO
WETIKO
BELE BUKISA
TUMATA CHRECHA
HALEMO
SOKICHA
KELECHA
SUGALE
The people are participate every time but the
participate is not enough
The people are participate every time but the
participate is not enough
The people are participate every time but the
participate is not enough
The people are participate every time but the
participate is not enough
The people are participate every time but the
participate is not enough
Debo, saving, Equb
The people are participate every time but the
participate is not enough
Help each other, saving
Saving, Debo, help each other
The community participate and cooperate in
different way such as traditionally by shongo
and church association
We have a good cooperation and
participation habits
The community cooperate and participate
through traditional assembled like shongo
and church help each other by idea, food and
money
We have a good cooperation and participation
habit through shongo, Debo, Edir, Ekub
There was good level of cooperation
activities for the last decade but now
decreasing
198
Tuesday, December 2, 2014
Wereda WENAGO
Changes_In_Last_Decade
Improved
Decreasing
Improved
Improved
Improved
Decreasing
Improved
Decreasing
Decreasing
Improved
Improved
Increasing
Improved
Decreasing
Page 1 of 2
Data_Collected_Date
Region S.N.N.P
Zone GEDEO
Selected Indicator
Capacity: Type Community Participation
Kebele Name
Levels_Comm_Participation
DEKO
BANKO OKOTO
JEMJEMO
There was good level of cooperation for the
last decade but now decreasing
Level of cooperation during hardship become
very poor compared to the last decade
There was good level of cooperation for the
last decade but now decrease
Tuesday, December 2, 2014
Wereda WENAGO
Changes_In_Last_Decade
Decreasing
Decreasing
Decreasing
199
Page 2 of 2
Data_Collected_Date
Tuesday, December 2, 2014
Region S.N.N.P
Selected Indicator
Zone
GEDEO
Wereda WENAGO
Capacity: Recovery from Losses from Disasters - Percentage of Households who
have managed to recover from losses of disasters
Percentage of households who have managed to recover from losses of disasters
Comments
52.70 %
200
Page 1 of 1
Data_Collected_Date
Region S.N.N.P
Zone GEDEO
Tuesday, December 2, 2014
Wereda WENAGO
Selected Indicator
Type of Disaster
Capacity: Recovery from Losses from Disasters - Percentage of households
recovered from past disasters by type of Disasters
Recovered Percentage
Droughts
Floods
Landslides
Crop diseases
Livestock diseases
Human diseases
Storms / Cyclone/hail storm
Heavy Rain
Frost / Cold waves
Conflicts
Economic / Price shock
Earthquake
13.43
1.99
1.99
32.34
2.49
3.98
28.36
1.49
2.49
1.49
8.46
0.50
201
Page 1 of 1

Data_Collected_Date
Tuesday, December 2, 2014
Region S.N.N.P
Zone GEDEO
Wereda WENAGO
Selected Indictor:
Capacity: Recovery from Losses from Disasters - Proportion of households
recovered by type of Losses
Type of Loss
Physical damages on houses and property
Percentage
0.52
Crop damage
47.15
Livestock damage
2.59
Death of household members
1.55
Illness/health problems
2.59
Loss of income
31.09
Loss of savings
10.88
Livestock were stolen
0.52
Lost access to water source
0.52
Had to flee/change residence area
1.55
202
Page 1 of 1
Data_Collected_Date
Region S.N.N.P
Zone GEDEO
Tuesday, December 2, 2014
Wereda WENAGO
Selected Indicator
Capacity: Coping Options if More Resources Available - What coping strategy
could be adopted if more resource were available?
Coping Strategy To Be Adopted
Response (%)
Storage of food and other necessities
42.16
Adaptation of economic activities to hazards season (e.g. cropping cycle, short term
crops, etc.)
Physical protection of buildings and property
36.27
17.65
None
2.94
203
Page 1 of 1
Data_Collected_Date
Tuesday, December 2, 2014
Region S.N.N.P
Zone GEDEO
Wereda
WENAGO
Selected Indictor:
Capacity: Coping Strategies Adopted by Households - Percentage of households by
major type of coping strategies adopted (at least once)
Coping Strategy Adopted
Main Strategy
Secondary Strategy
Consumption rather than sale of crop surplus
25.00
8.25
Increased working hours
22.00
20.62
Seek alternative or additional jobs
18.00
21.65
Reduced expenditure on non-essential items (beer, cigarettes,
clothes, meat, etc.)
Rely on less preferred and less expensive food
10.00
9.50
3.61
20.10
Borrowing of food or cash (including purchasing food on credit)
5.00
3.09
Short-term / seasonal labor migration
4.50
3.61
Sending children of household for work
1.50
2.06
Limit portion size at meals
1.50
11.34
Sale of non-productive assets (Jewelry, clothing, etc.)
1.00
2.06
Sell more livestock than usual
0.50
0.52
Reduced expenditure on productive inputs (fertilizer, seeds,
livestock drugs, etc.)
Long-term / permanent migration (including distress migration of
whole families)
Collection of wild food
0.50
0.00
0.00
0.52
0.00
0.52
Restrict consumption by adults in order for small children to eat
0.00
0.52
204
Page 1 of 2

Data_Collected_Date
Tuesday, December 2, 2014
Region S.N.N.P
Zone GEDEO
Wereda
WENAGO
Selected Indictor:
Capacity: Coping Strategies Adopted by Households - Percentage of households by
major type of coping strategies adopted (at least once)
Coping Strategy Adopted
Main Strategy
Secondary Strategy
Begging for money or for food
0.00
0.52
Reduce number of meals eaten in a day
0.50
0.52
Skip entire day without eating
0.00
0.50
205
Page 2 of 2

Wereda Disaster
Risk Profile
Data_Collected_Date
Region S.N.N.P
Zone
GEDEO
Disaster Risk Management and Food
Security Sector (DRMFSS)
Tuesday, December 2, 2014
Wereda WENAGO
Selected Indicator
Capacity: Coping Strategies Adopted by Households - Main coping strategies adopted by households for respective
disasters
Coping Strtegies Adopted
Types of disaters for which HHs in the community adopt the listed
Coping Strtegies
Borrowing of food or cash
(including purchasing food
on credit)
Consumption rather than
sale of crop surplus
Increased working hours
206
Page 1 of 5
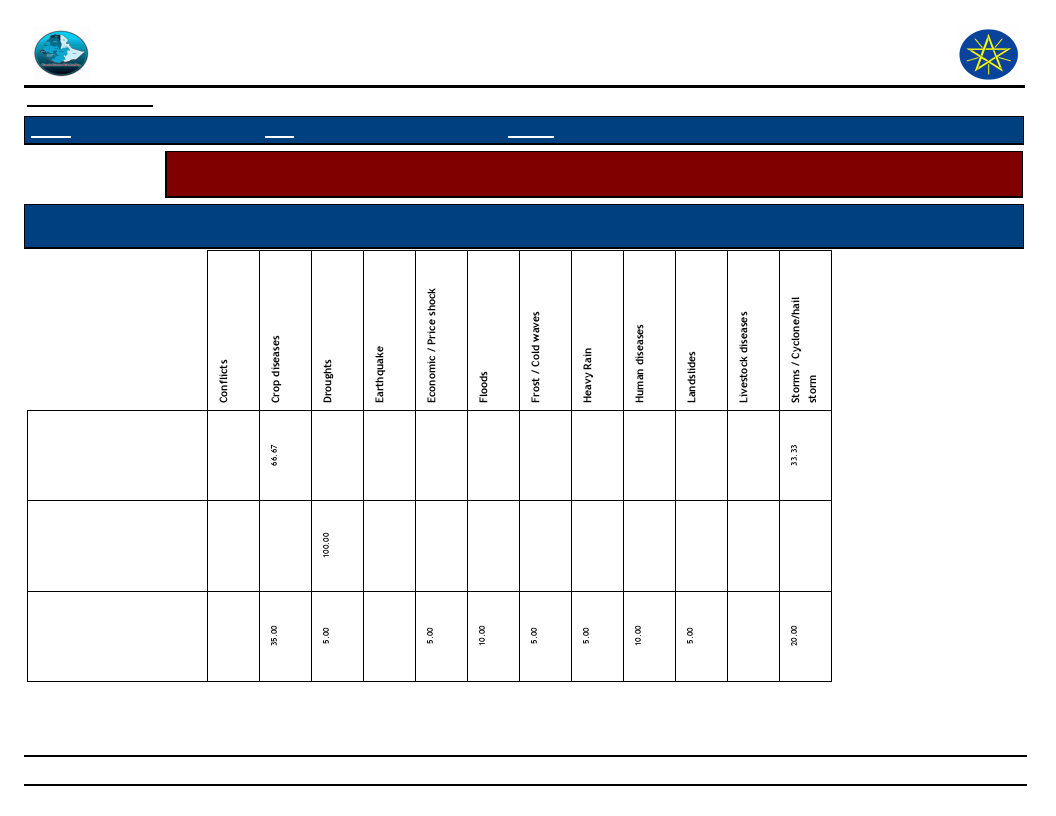
Wereda Disaster
Risk Profile
Data_Collected_Date
Region S.N.N.P
Zone
GEDEO
Disaster Risk Management and Food
Security Sector (DRMFSS)
Tuesday, December 2, 2014
Wereda WENAGO
Selected Indicator
Capacity: Coping Strategies Adopted by Households - Main coping strategies adopted by households for respective
disasters
Coping Strtegies Adopted
Types of disaters for which HHs in the community adopt the listed
Coping Strtegies
Limit portion size at meals
Reduce number of meals
eaten in a day
Reduced expenditure on
non-essential items (beer,
cigarettes, etc)
207
Page 2 of 5

Wereda Disaster
Risk Profile
Data_Collected_Date
Region S.N.N.P
Zone
GEDEO
Disaster Risk Management and Food
Security Sector (DRMFSS)
Tuesday, December 2, 2014
Wereda WENAGO
Selected Indicator
Capacity: Coping Strategies Adopted by Households - Main coping strategies adopted by households for respective
disasters
Coping Strtegies Adopted
Types of disaters for which HHs in the community adopt the listed
Coping Strtegies
Reduced expenditure on
productive inputs
(fertilizer, seeds, etc)
Rely on less preferred and
less expensive food
Sale of non-productive
assets (jewellery,
clothing, etc.)
208
Page 3 of 5

Wereda Disaster
Risk Profile
Data_Collected_Date
Region S.N.N.P
Zone
GEDEO
Disaster Risk Management and Food
Security Sector (DRMFSS)
Tuesday, December 2, 2014
Wereda WENAGO
Selected Indicator
Capacity: Coping Strategies Adopted by Households - Main coping strategies adopted by households for respective
disasters
Coping Strtegies Adopted
Types of disaters for which HHs in the community adopt the listed
Coping Strtegies
Seek alternative or
additional jobs
Sending children of
household for work
Short-term / seasonal
labor migration
209
Page 4 of 5
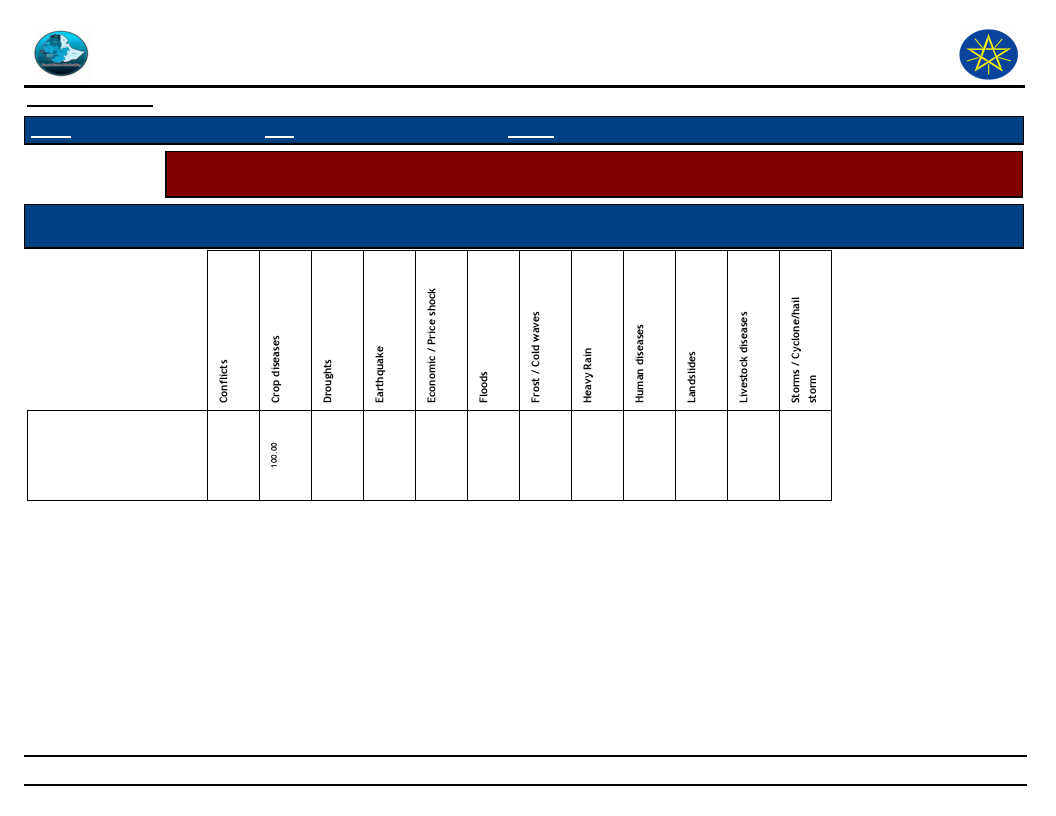
Wereda Disaster
Risk Profile
Data_Collected_Date
Region S.N.N.P
Zone
GEDEO
Disaster Risk Management and Food
Security Sector (DRMFSS)
Tuesday, December 2, 2014
Wereda WENAGO
Selected Indicator
Capacity: Coping Strategies Adopted by Households - Main coping strategies adopted by households for respective
disasters
Coping Strtegies Adopted
Types of disaters for which HHs in the community adopt the listed
Coping Strtegies
Skip entire day without
eating
210
Page 5 of 5
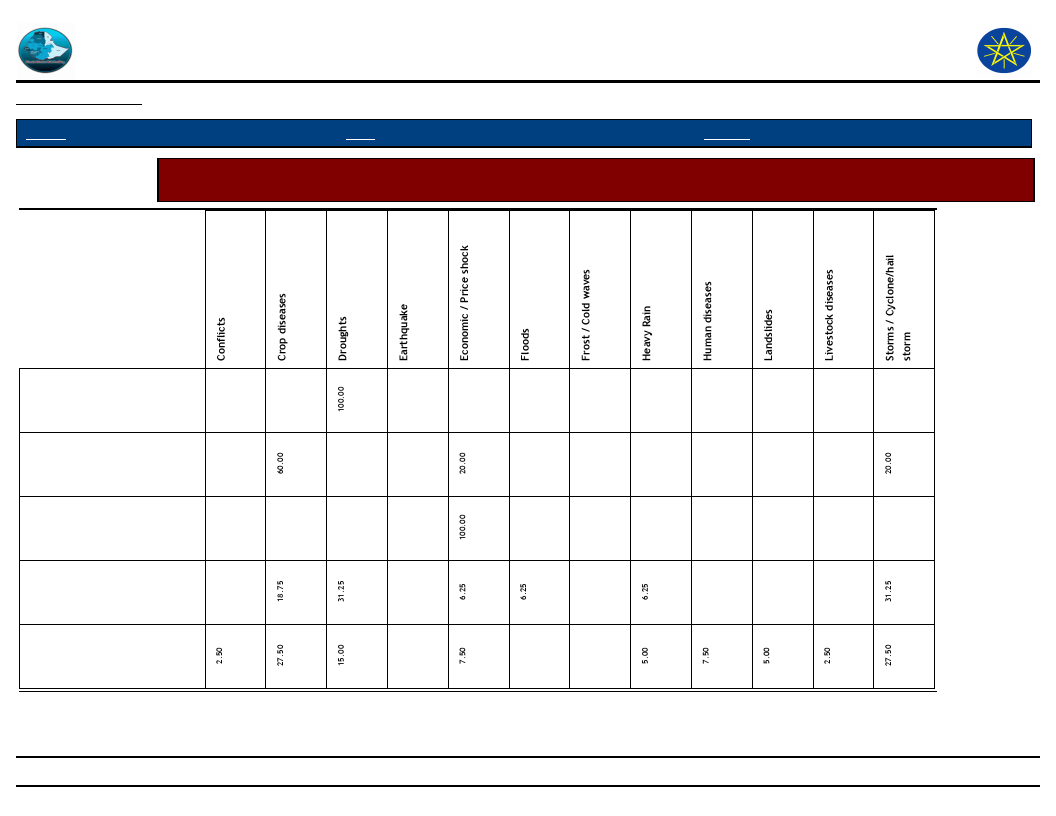
Wereda Disaster
Risk Profile
Data_Collected_Date
Disaster Risk Management and Food
Security Sector (DRMFSS)
Tuesday, December 2, 2014
Region S.N.N.P
Zone
GEDEO
Wereda WENAGO
Selected Indicator
Capacity: Coping Strategies Adopted by Households - Secondary coping strategies adopted by households for
respective disasters
Begging for money or for
food
Borrowing of food or cash
(including purchasing food
on credit)
Collection of wild food
Consumption rather than
sale of crop surplus
Increased working hours
211
Page 1 of 3

Wereda Disaster
Risk Profile
Data_Collected_Date
Disaster Risk Management and Food
Security Sector (DRMFSS)
Tuesday, December 2, 2014
Region S.N.N.P
Zone
GEDEO
Wereda WENAGO
Selected Indicator
Capacity: Coping Strategies Adopted by Households - Secondary coping strategies adopted by households for
respective disasters
Limit portion size at meals
Reduce number of meals
eaten in a day
Reduced expenditure on
non-essential items (beer,
cigarettes, etc)
Rely on less preferred and
less expensive food
Restrict consumption by
adults in order for small
children
Sale of non-productive
assets (jewellery, clothing,
etc.)
212
Page 2 of 3
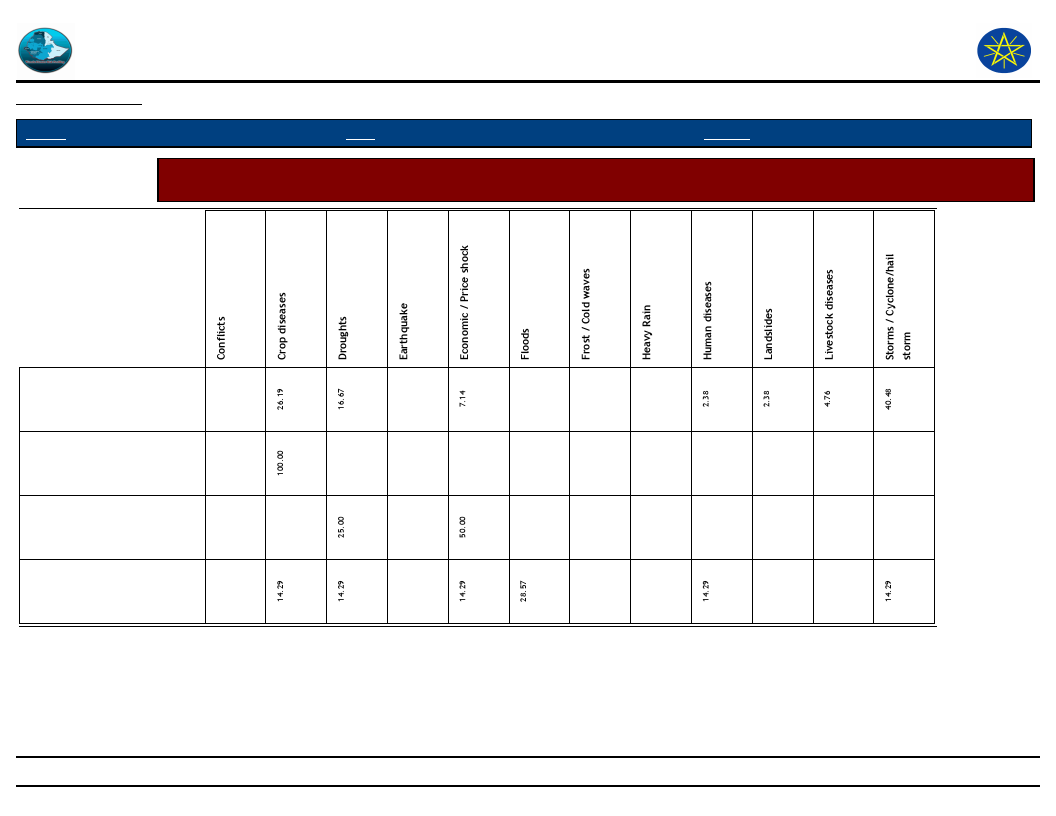
Wereda Disaster
Risk Profile
Data_Collected_Date
Disaster Risk Management and Food
Security Sector (DRMFSS)
Tuesday, December 2, 2014
Region S.N.N.P
Zone
GEDEO
Wereda WENAGO
Selected Indicator
Capacity: Coping Strategies Adopted by Households - Secondary coping strategies adopted by households for
respective disasters
Seek alternative or
additional jobs
Sell more livestock than
usual
Sending children of
household for work
Short-term / seasonal labor
migration
213
Page 3 of 3

Wereda Disaster
Risk Profile
Disaster Risk Management and
Food Security Sector (DRMFSS)
Data_Collected_Date
Region S.N.N.P
Zone GEDEO
Wereda WENAGO
Tuesday, December 2, 2014
Selected Indicator
Capacity: Coping Strategies Adopted by Households - Main coping strategies adopted by households to recover
from respective losses
Type of Coping Strategy Adopted
Type of Loss
Begging for money or for food
Borrowing of food or cash
(including purchasing food on
credit)
Collection of wild food
Consumption rather than sale
of crop surplus
214
Page 1 of 4

Wereda Disaster
Risk Profile
Disaster Risk Management and
Food Security Sector (DRMFSS)
Data_Collected_Date
Region S.N.N.P
Zone GEDEO
Wereda WENAGO
Tuesday, December 2, 2014
Selected Indicator
Capacity: Coping Strategies Adopted by Households - Main coping strategies adopted by households to recover
from respective losses
Type of Coping Strategy Adopted
Type of Loss
Increased working hours
Limit portion size at meals
Long-term / permanent
migration (including distress
migration of whole families)
Reduced expenditure on
non-essential items (beer,
cigarettes, clothes, meat, etc.)
215
Page 2 of 4
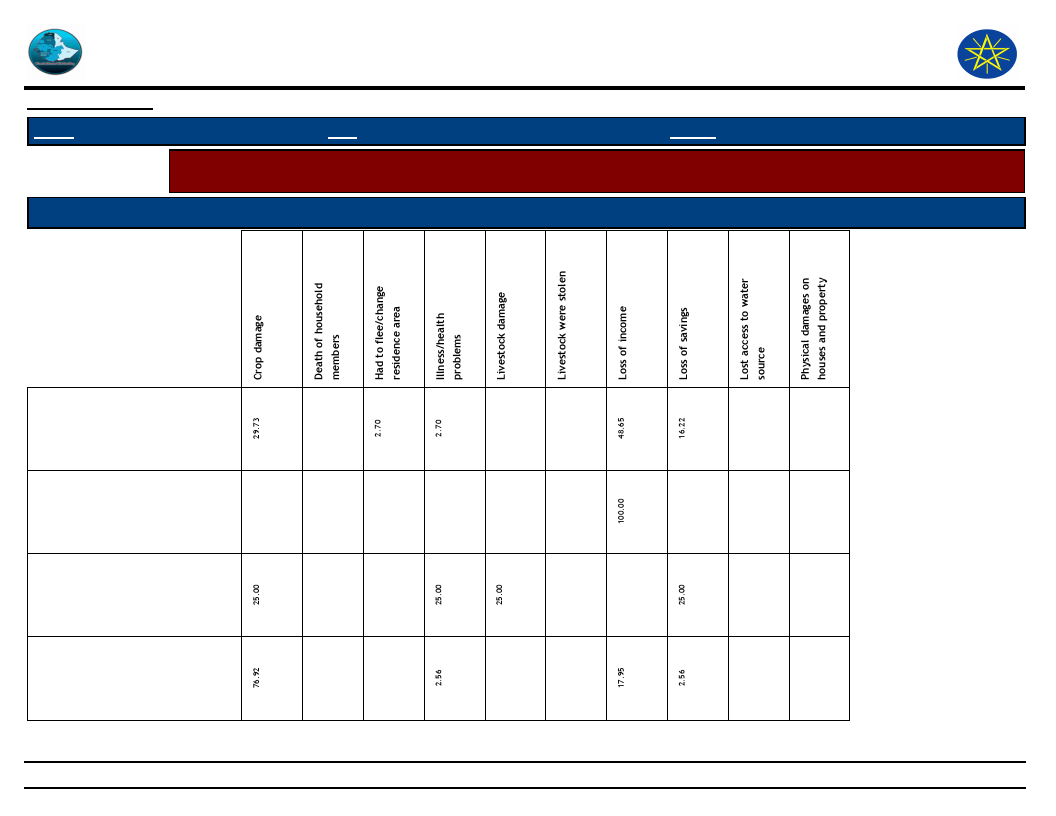
Wereda Disaster
Risk Profile
Disaster Risk Management and
Food Security Sector (DRMFSS)
Data_Collected_Date
Region S.N.N.P
Zone GEDEO
Wereda WENAGO
Tuesday, December 2, 2014
Selected Indicator
Capacity: Coping Strategies Adopted by Households - Main coping strategies adopted by households to recover
from respective losses
Type of Coping Strategy Adopted
Type of Loss
Rely on less preferred and less
expensive food
Restrict consumption by adults
in order for small children to
eat
Sale of non-productive assets
(Jewelry, clothing, etc.)
Seek alternative or additional
jobs
216
Page 3 of 4
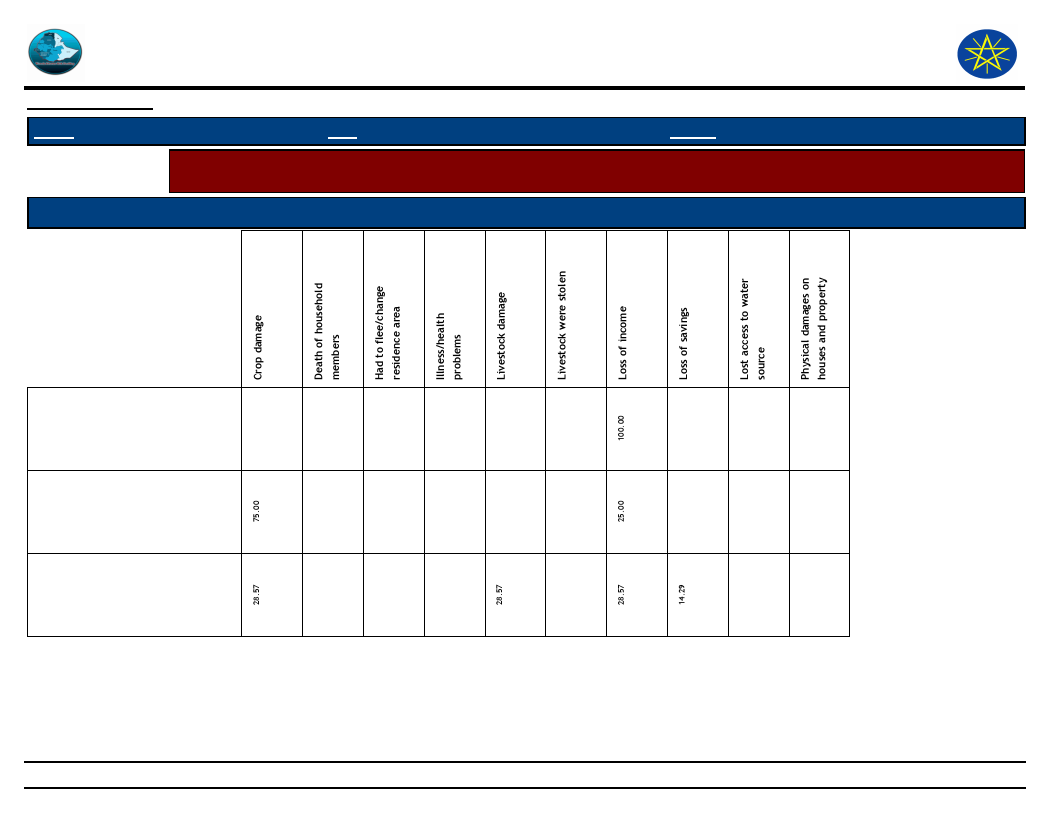
Wereda Disaster
Risk Profile
Disaster Risk Management and
Food Security Sector (DRMFSS)
Data_Collected_Date
Region S.N.N.P
Zone GEDEO
Wereda WENAGO
Tuesday, December 2, 2014
Selected Indicator
Capacity: Coping Strategies Adopted by Households - Main coping strategies adopted by households to recover
from respective losses
Type of Coping Strategy Adopted
Type of Loss
Sell more livestock than usual
Sending children of household
for work
Short-term / seasonal labor
migration
217
Page 4 of 4
Data_Collected_Date
Tuesday, December 2, 2014
Region S.N.N.P
Zone GEDEO
Wereda WENAGO
Selected Indicator
Capacity: Coping Strategies Adopted by Households - Percentage of households by
frequency of main coping strategies adopted
Type of Coping Strategy Adopted
Frequency of Adoption
Borrowing of food or cash (including purchasing
food on credit)
Consumption rather than sale of crop surplus
Increased working hours
Limit portion size at meals
Reduce number of meals eaten in a day
Reduced expenditure on non-essential items
(beer, cigarettes, etc)
Reduced expenditure on productive inputs
(fertilizer, seeds, etc)
Rely on less preferred and less expensive food
Sale of non-productive assets (jewellery, clothing,
etc.)
Seek alternative or additional jobs
Sell more livestock than usual
Sending children of household for work
2.86
3.03
33.33
15.00
44.44
16.00
11.43
6.06
5.00
11.11
100.00
8.00
100.00
6.06
5.00
11.11
4.00
60.00
74.29
69.70
66.67
100.00
45.00
100.00
33.33
60.00
66.67
40.00
11.43
12.12
30.00
12.00
33.33
218
Page 1 of 2

Data_Collected_Date
Tuesday, December 2, 2014
Region S.N.N.P
Zone GEDEO
Wereda WENAGO
Selected Indicator
Capacity: Coping Strategies Adopted by Households - Percentage of households by
frequency of main coping strategies adopted
Type of Coping Strategy Adopted
Frequency of Adoption
Short-term / seasonal labor migration
Skip entire day without eating
25.00
50.00
100.00
25.00
219
Page 2 of 2

Wereda Disaster
Risk Profile
Data_Collected_Date
Disaster Risk Management and Food
Security Sector (DRMFSS)
Tuesday, December 2, 2014
Region S.N.N.P
Selected Indicator
Zone GEDEO
Wereda WENAGO
Capacity: Alternative Livelihood Sources - Alternative livelihood sources suggested by the community
Kebele Name
Work_Option_1
Comment_1
Work_Option_2
Comment_2
Work_Option_3
Comment_3
TOKOCHA
DABOTA
KERA SODITY
No
Daily labour
Hand craft
Because we have not
No
option
Because we have not
No
option
To get additional
money
To get money
Petty Trading
Petty Trading
To get additional
money
To get money
Because we
have not
option
HASEHARO
Petty Trading
WETIKO
Trading some
banana made
materials
BELE BUKISA
Petty Trading
TUMATA CHRECHA
Apply to
government
To get income
To get money
To get money
Contingency for short
period
Share of another
person
Because both of user are
Muslim
Daily labour
To earn income money
Co-operative
Daily labour
To get support crop
seed farm in put
To recovery and income
generate
Daily labour
Saving and
credit instillation
Daily labour
Support each
other
Because gets
additional
income
To solve home
problem buy
educational
material to
their children
To earn
money income
On option of
coping
activates
220
Page 1 of 3

Wereda Disaster
Risk Profile
Data_Collected_Date
Disaster Risk Management and Food
Security Sector (DRMFSS)
Tuesday, December 2, 2014
Region S.N.N.P
Selected Indicator
Zone GEDEO
Wereda WENAGO
Capacity: Alternative Livelihood Sources - Alternative livelihood sources suggested by the community
Kebele Name
Work_Option_1
Comment_1
Work_Option_2
Comment_2
Work_Option_3
Comment_3
HALEMO
SOKICHA
KELECHA
SUGALE
BANKO OKOTO
JEMJEMO
Used money from
Deposited
To use the
saved many
To replace farmer
income activities
The saved money are
secured
Daily labour
To work daily
labour
Doing any job as
much possible
Noting other option
Apply to
government
Selling livestock
and livestock
product, fire
wood, charcoal
To recover household
consumption and
basic needs
Petty Trading
Migration to other
country, to do job
Migration
To gain additional
income and to fulfil
household
consumption (food
and cloth)
To get a better job
Apply to
government to
give support
use saving
money
One option of income
generator
To get other income
For contingency food
To recover household
consumption and other
basic needs
To subsidy by food and
cash
For household
consumption
Migration
To ask the
government help
(Aid )
Migration to
neighbour
country
Carpenter
Borrowed money
from money
lenders
Better job
opportunity
For disable
and food
inscribed,
people
For better job
opportunity
To recover
household
consumption
and other
basic needs
To recover
household
expense
Petty trade
To cover
household
expense
221
Page 2 of 3
Wereda Disaster
Risk Profile
Data_Collected_Date
Disaster Risk Management and Food
Security Sector (DRMFSS)
Tuesday, December 2, 2014
Region S.N.N.P
Selected Indicator
Zone GEDEO
Wereda WENAGO
Capacity: Alternative Livelihood Sources - Alternative livelihood sources suggested by the community
Kebele Name
Work_Option_1
Comment_1
Work_Option_2
Comment_2
Work_Option_3
Comment_3
MEKONISA
Daily labour
BANKO OKOTO
Daily labour
DODORO
Daily labour
To get Additional
income
Hand craft
Have no other option
Petty Trading
Help himself to save
survival of life
Hand craft
To gate additional
income, have not
enough the economy
To get Additional
income
To get Additional
income
A little bit hand
craft
To pet
additional
income
222
Page 3 of 3
WDRP Indicators
Community
Perceptions and Suggestions
223
Data_Collected_Date
Tuesday, December 2, 2014
Region S.N.N.P
Selected Indictor:
KebeleName
Zone GEDEO
Wereda WENAGO
Agricultural Situation: Access to Extension - Perception of the community on
Access to Agricultural extension Services
Current_Level
Change_In_Last_Decade
Comments
GASELCHO
DODORO
TOKOCHA
MEKONISA
DABOTA
KERA SODITY
HASEHARO
WETIKO
BELE BUKISA
TUMATA
CHRECHA
HALEMO
SOKICHA
KELECHA
SUGALE
DEKO
BANKO OKOTO
JEMJEMO
Well
Not enough
Well
Well
Well
It is not sufficient
Well
Increase training
awareness
Good
Good access
Good access
Good access
Inadequate
Inadequate
Inadequate
Insufficient
Decreasing
Increasing
Increasing
Increasing
Increasing
Weak
Decreasing
But particularly very less
Decreasing
Increasing
Increased
Increasing
Progress
Increasing
Increasing
Increasing
224
Have awareness,
understand the people
To increase product &
production
Have awareness
To development
awareness
Have awareness
Not enough
Have awareness
Economic problem to buy
agricultural input
Economic problem to buy
seed and fertilizer to
community
Unknown
Access of enough
educated expert
Enough number of expert
in all department
Access of enough
educated expert
Access to agricultural
extension service
Farmers adopt new
technology
Farmers adopt new
technology
Employed effective
agricultural expert
Page 1 of 1
Data_Collected_Date
Tuesday, December 2, 2014
Region S.N.N.P
Selected Indictor:
KebeleName
GASELCHO
DODORO
TOKOCHA
MEKONISA
DABOTA
KERA SODITY
HASEHARO
WETIKO
BELE BUKISA
TUMATA
CHRECHA
HALEMO
SOKICHA
KELECHA
SUGALE
DEKO
BANKO OKOTO
JEMJEMO
Zone GEDEO
Wereda WENAGO
Agricultural Situation: Access to Inputs - Perception of the community on access
to improved agricultural inputs
Current_Level
Change_In_Last_Decade
Comments
Good
Less amount
Well
Good
Good
Medium
Good
Practically less
Land practically
Enough access
Good access
Available
Good access
In adequate
Inadequate
Inadequate
Insufficient
Decreasing
As the same
Increasing
Increasing
Increasing
Increasing
Decreasing
Less
There is change by
awareness
Increasing
Increasing
Improve time to time
Increasing
Progress
Increasing
Increasing
Increasing
Have awareness
Because of not changed
as cultivated system
Have awareness
Have awareness
Have awareness
Good awareness
Have awareness
Economic problem to buy
a farm agricultural inputs
Problem to buy seed
fertilizer income
The government take
attention for increased
production & productivity
Good attention of
government
Enough supply of inputs
Good attention of
government
can access new
technology to farmers
Farmers adopt new
technology
Farmers adopt new
technology
Farmers a adopt new
agricultural technology
225
Page 1 of 1

Data_Collected_Date
Tuesday, December 2, 2014
Region S.N.N.P
Zone GEDEO
Wereda WENAGO
Selected Indictor:
KebeleName
Agricultural Situation: Water for irrigation - Access to water for irrigation in the
community
Current_Level
Change_In_Last_Decade
Comments
GASELCHO
DODORO
TOKOCHA
MEKONISA
DABOTA
KERA SODITY
HASEHARO
TUMATA CHRECHA
HALEMO
SOKICHA
KELECHA
SUGALE
DEKO
BANKO OKOTO
JEMJEMO
No
No
No
No
No
No
No
No
No
No
No
No
No
Poor
Poor
No
Decreasing
No
Decreasing
No
Decreasing
No
No
No
No
No
No
No
Poor
Poor
Difficulty the area
Because not suitable area
No
Not suitable
Have not suitable area
The area is not suitable
No
Due to geographical land scope
Geographical land scope
Due to geographical land scope
Geographical land scope
Farmers used to rain water
No more irrigation activities
No more irrigation activities
No more irrigation activities
226
Page 1 of 1
Data_Collected_Date
Tuesday, December 2, 2014
Region S.N.N.P
Zone GEDEO
Wereda WENAGO
Selected Indictor:
Agricultural Situation: Water Availability for Livestock - Water availability for
livestock in the community
KebeleName
Current_Level
Change_In_Last_Decade
Comments
GASELCHO
Increasing
Decreasing
Have awareness
DODORO
Well
Decreasing
To aware the people
TOKOCHA
MEKONISA
DABOTA
KERA SODITY
HASEHARO
WETIKO
Decreasing
Decreasing
Well
Well
Decreasing
Less management
Decreasing
Decreasing
Decreasing
Increasing
Enough
Increasing
Deforestation, shortage of
rain fall
Shortage of rain fall,
deforestation
Deforestation, shortage of
rain fall
The awareness of farmer is
increased
Deforestation , shortage of
rain fall
Lack of awareness
BANKO OKOTO
Good
TUMATA CHRECHA
Enough access
They awareness to give on
time
Decreasing
They get water from
different
Deforestation
HALEMO
Good
Decreasing
Deforestation
SOKICHA
KELECHA
Available
Good
Decreasing
Decreasing
Due to deforestation,
climatically change
Deforestation
SUGALE
DEKO
BANKO OKOTO
JEMJEMO
Good
Good
Good
Good
Good
Good
Good
Good
Present of river, pond,
spring
Present of spring, pond
and rivers
Present of rivers, springs
and ponds
Present of water
227
Page 1 of 1
Data_Collected_Date
Tuesday, December 2, 2014
Region S.N.N.P
Selected Indictor:
Kebele Name
Zone GEDEO
Wereda WENAGO
Agricultural Situation: Soil Fertility - Perception of the community on soil fertility
and its change over time
Current_Level
Change_In_Last_Decade
Comments
GASELCHO
DODORO
TOKOCHA
MEKONISA
DABOTA
KERA SODITY
HASEHARO
WETIKO
Decreasing
Medium
Medium
Medium
Medium
Medium
Decreasing
Increasing
BELE BUKISA
Decreasing
TUMATA CHRECHA
HALEMO
Fertile
Less fertile
SOKICHA
Fertile
KELECHA
Less fertile
SUGALE
Infertile
DEKO
Infertile
BANKO OKOTO
Infertile
Increasing
Decreasing
Decreasing
Decreasing
Decreasing
Decreasing
Increasing
Decreasing
Increasing
Decreasing
Increased
Decreasing
Increasing
Decreasing
Decreasing
Decreasing
Over grazing , erosion
Erosion always,
cultivated
Repetition of cultivate
To cultivate reparation
Reparation of cultivate
Continuous cultivated
Report cultivated degraded
land
Erosion need management
, deforestation &
population size
Erosion on need soil
management
Increase soil erosion
Deforestation , poor
management
Due to soil erosion over
used
Geographical lands cup ,
deforestation
Soil erosion, deforestation
, farming system, lack of
fertilized
Soil erosion , farming
system, lack of fertilizer,
deforestation
Faming system, soil,
erosion , lack of fertilize
228
Page 1 of 2
Data_Collected_Date
Tuesday, December 2, 2014
Region S.N.N.P
Selected Indictor:
Kebele Name
Zone GEDEO
Wereda WENAGO
Agricultural Situation: Soil Fertility - Perception of the community on soil fertility
and its change over time
Current_Level
Change_In_Last_Decade
Comments
JEMJEMO
Infertile
Decreasing
Soil erosion , faming
system , deforesting
229
Page 2 of 2
Data_Collected_Date
Tuesday, December 2, 2014
Region S.N.N.P
Selected Indictor:
Zone GEDEO
Wereda WENAGO
Economic Vulnerability: Change in Agricultural Situation - Households perception
on changes of crop type, size of cultivated area and crop yields
Proportion of households reporting change in crops grown
Adequate fertilizer
38.90
%
1st
2nd
3rd
18.92
16.98
16.67
Adequate rainfall
29.73
7.55
6.67
Insufficient fertilizer
4.05
7.55
Insufficient irrigation available
5.41
0.00
3.33
Less rainfall
14.86
3.77
More drought resistant crop
1.35
5.66
30.00
More pest resistant crop
5.41
15.09
20.00
More yielding crop
20.27
43.40
23.33
Proportion of households reporting change in size of area cultivated
41.40 %
Adequate fertilizer
1st
2nd
3rd
1.36
13.64
6.25
Adequate irrigation available
0.00
6.25
Adequate rainfall
8.16
insafficient irrigation available
0.68
0.00
insufficient fertilizer
0.68
6.25
Insufficient rainfall
2.04
18.18
31.25
Landslides
2.72
22.73
more yielding crop
22.73
6.25
230
Page 1 of 2
Data_Collected_Date
Tuesday, December 2, 2014
Region S.N.N.P
Selected Indictor:
Zone GEDEO
Wereda WENAGO
Economic Vulnerability: Change in Agricultural Situation - Households perception
on changes of crop type, size of cultivated area and crop yields
Proportion of households reporting change in crop yield
48.60
%
1st
2nd
3rd
Adequate fertilizer
17.70
18.09
19.48
Adequate irrigation available
0.88
0.00
Adequate rainfall
23.01
9.57
11.69
Better yielding crop
25.66
27.66
19.48
Improved variety of seeds
7.08
18.09
40.26
Insufficient fertilizer
5.31
20.21
1.30
Insufficient irrigation available
10.62
5.32
5.19
Insufficient rainfall
9.73
1.06
1.30
231
Page 2 of 2
Data_Collected_Date
Tuesday, December 2, 2014
Region S.N.N.P
Selected Indicator
Zone GEDEO
Wereda WENAGO
Environmental Situation: General Land Quality - Perceptions of the community
on changes in the general quality of land over a decade
KebeleName
Current_Situation
Change_Last_Decade
Comment
GASELCHO
Have awareness
Decreasing
Increase
DODORO
TOKOCHA
Because of always
cultivated
Repetition of cultivate
Medium
Medium
Decreasing
Decreasing
MEKONISA
To cultivate reparation
Medium
Decreasing
DABOTA
KERA SODITY
Because of repeatedly
cultivated
Continuous cultivated
Medium
Medium
Decreasing
Decreasing
HASEHARO
WETIKO
BELE BUKISA
TUMATA
CHRECHA
HALEMO
SOKICHA
KELECHA
SUGALE
Repeatedly cultivated and
degraded land
Yearly cultivated
Population size & soil
erosion, lack of soil
management results low
land performance
Due to Agro forestay
system
Due to agro foresting
system
Due to different natural
problem, soil erosion &
deforestation
Due to agro forestry
system
Plough repeatedly
Decreasing
Decreasing because of
deforestation & population
size
Decreasing
Increasing
Decreasing
The problem increasing
Fertile
Less fertile
Fertile
Less fertile
Infertile
Decreasing
Increasing
Decreasing
Increasing
Decreasing
DEKO
Repeating farm
Infertile
Decreasing
BANKO OKOTO
Repeating ploughing
Infertile
Decreasing
232
Page 1 of 2
Data_Collected_Date
Tuesday, December 2, 2014
Region S.N.N.P
Selected Indicator
Zone GEDEO
Wereda WENAGO
Environmental Situation: General Land Quality - Perceptions of the community
on changes in the general quality of land over a decade
KebeleName
Current_Situation
Change_Last_Decade
Comment
JEMJEMO
Plough again and again
Infertile
Decreasing
233
Page 2 of 2
Data_Collected_Date
Tuesday, December 2, 2014
Region S.N.N.P
Selected Indicator
KebeleName
GASELCHO
Zone GEDEO
Wereda WENAGO
Environmental Situation: Changes in Landscape - Changes observed by the
community on landscape and the problems due to the changes
Changes_Observed
Problems_Due_To_Changes
Cover afforesting
Deforestation, over population
DODORO
TOKOCHA
MEKONISA
DABOTA
Cover Agro forestry at
now
Cover Agro forestry at
now
To cover agro forestry at
now
Cover Agro forestry now
Deforestation, over population
Deforestation, over population
Deforestation, over population
Deforestation, fire wood
KERA SODITY
Cover Agro forestry
Deforestation, over population
HASEHARO
Cover Agro forestry now
Deforestation, over population
WETIKO
BANKO OKOTO
TUMATA CHRECHA
Decreasing
Decreasing
No change
Because population is increasing results land
shortage
Shortage of land, population growing fast, loss of
soil fertility
No
HALEMO
No change
No
SOKICHA
No change
No
KELECHA
No change
No
SUGALE
Decreasing
Deforestation, over population
DEKO
Decreasing
Deforestation, over population
BANKO OKOTO
Decreasing
Deforestation, over population, over grazing
JEMJEMO
Decreasing
Deforestation, over pollution
234
Page 1 of 1

Wereda Disaster
Risk Profile
Data_Collected_Date
Disaster Risk Management and Food
Security Sector (DRMFSS)
Tuesday, December 2, 2014
Region S.N.N.P
Zone
GEDEO
Wereda WENAGO
Selected Indicator
Kebele Name
Interventions: Community Perception on Mediums to Influence DRM Actors - Community perception on the
effectiveness of institutional channels to use to influence DRM actors
Institution_1
Process_Description
Institution_2 Process_Description
Institution_3
Process_Description
GASELCHO
DODORO
TOKOCHA
MEKONISA
Development
group men for
Development
agent for
agricultural
office
Extension of
health to health
centre office
To get sustainable
solution
As this system
health centre office
to do a salutation
Good message
health extension
health centre
To get sustainable
solution
Good massagers -
health extensions
- health centre
To get sustainable
solution
Good
Measures
health
extension -
health centre
health office
Development
to agricultural
office
To gets sustainable
Solution
As this system
agricultural office to
do a solution
Development
for
development
for
agricultural
office
Development
group man try
Development
agent for
agricultural
office
To get sustainable
solution
To get sustainable
solution
Prong leader
ships - school
directors
educational
office
To get sustainable
solution
Keble office to
water &
Resource
office
Group leaders
ship - school
director
-educational
office
As this system water
resource office to do a
solution
To get sustainable
solution
Group
leadership -
school director
- educational
office
To get sustainable
solution
235
Page 1 of 4

Wereda Disaster
Risk Profile
Data_Collected_Date
Disaster Risk Management and Food
Security Sector (DRMFSS)
Tuesday, December 2, 2014
Region S.N.N.P
Zone
GEDEO
Wereda WENAGO
Selected Indicator
Interventions: Community Perception on Mediums to Influence DRM Actors - Community perception on the
effectiveness of institutional channels to use to influence DRM actors
Kebele Name
DABOTA
KERA SODITY
HASEHARO
WETIKO
BELE BUKISA
Institution_1
Good message-
health extension ,
health centre
health office
Process_Description
Find a solution at a
head office
Wereda
Administrator
office
To get aid,
electricity
Good messages, -
health extension
, health centres
To get sustainable
solution
Wereda
Administrator
office
Wereda
Administrator
office
To get solution
To get solution
Institution_2 Process_Description
Development
as a Keble as
Development
Agricultural
office
Find a solution at a
head office
Wereda E/
W/R/R food
security
settlement
department
To get help, Early
warming direction
Development
program for
development
for agricultural
office
To get sustainable
solution
Wereda
Agricultural
office
To get food security
aid
E/W/R/R /
Food security
department
To get help support
aid seed, farm input,
packages
Institution_3
Ngo's
Group leader
ships school
director
-Educational
office
Omo Micro
Ngo's CCF
Process_Description
To get good aid, help
direction school
material to our children
To get sustainable
solution
To get credit to buy
farm in puts
To get Farm inputs ,
school material for
education to supply
our to children
students
236
Page 2 of 4
Wereda Disaster
Risk Profile
Data_Collected_Date
Disaster Risk Management and Food
Security Sector (DRMFSS)
Tuesday, December 2, 2014
Region S.N.N.P
Zone
GEDEO
Wereda WENAGO
Selected Indicator
Kebele Name
Interventions: Community Perception on Mediums to Influence DRM Actors - Community perception on the
effectiveness of institutional channels to use to influence DRM actors
Institution_1
Process_Description
Institution_2 Process_Description
Institution_3
Process_Description
TUMATA CHRECHA
HALEMO
SOKICHA
KELECHA
SUGALE
From farmer to
Wereda risk
management
institution
By assign Keble
committee to
Wereda DRM
agency
From house hold
to Wereda sector
From farmer to
Keble commute to
Wereda DRM
agencies
From community
Keble
For immediate
response
Keble leaders are
delay the
information
From Keble to
Wereda , the delay
of information
Keble leaders are
not facilitate
effectively
If problem of
community can not
solved at Keble level
they will go to apply
higher
administrative level,
( Wereda - zone -
Region )
237
Page 3 of 4

Wereda Disaster
Risk Profile
Data_Collected_Date
Disaster Risk Management and Food
Security Sector (DRMFSS)
Tuesday, December 2, 2014
Region S.N.N.P
Zone
GEDEO
Wereda WENAGO
Selected Indicator
Kebele Name
Interventions: Community Perception on Mediums to Influence DRM Actors - Community perception on the
effectiveness of institutional channels to use to influence DRM actors
Institution_1
Process_Description
Institution_2 Process_Description
Institution_3
Process_Description
DEKO
BANKO OKOTO
JEMJEMO
From community
Keble - Worde-
Zone- Region
From community
-Keble
administrative,
agricultural ,
health office,
police
From community,
Keble Wereda ,
zone, region
If the problem of
community cannot
be solved , they will
apply to higher
administrative level
If problem of
community cannot
be solved , they will
apply to higher level
of administrative (
Wereda - zone -
Region )
If problem of
community cannot
be give response,.
They will apply to
higher level of
government
238
Page 4 of 4
Data_Collected_Date
Region S.N.N.P
Zone
GEDEO
Tuesday, December 2, 2014
Wereda WENAGO
Selected Indicator
Interventions: Community Perception on their Knowledge used in DRM Process -
Perception of the community on how their knowledge influences the priorities
and measures of DRM actors
KebeleName
Community_Suggestions
KELECHA
The participatory is not enough
TOKOCHA
Yes, well
MEKONISA
Not enough
DABOTA
Helping is not enough
KERA SODITY
HASEHARO
Do not discuss more with community about their duty or plane, their idea is not
participatory
Support is not enough
BELE BUKISA
They not discuss with community about their duty plane it is not participatory
TUMATA CHRECHA
Most depend on our suggestions and knowledge
HALEMO
Farmer interest
SOKICHA
Based on the community suggestions and knowledge
KELECHA
Mostly bases on our need
SUGALE
Based on community interest and participation
DEKO
Based on community interest and participation
BANKO OKOTO
Based on community interest and participation
JEMJEMO
Based on community interest and participation
239
Page 1 of 1
Wereda Disaster
Risk Profile
Data_Collected_Date
Disaster Risk Management and
Food Security Sector (DRMFSS)
Tuesday, December 2, 2014
Region S.N.N.P
Zone GEDEO
Wereda WENAGO
Selected Indicator
Interventions: Suggestions to DRM Actors in the Area - Community suggested measures to DRM actors in the area
for effective DRM actions
Kebele Name Measure 1
Comment 1
Measure 2
Comment 2
Measure 3
KELECHA
Industry of coffee
DODORO
Pure water
TOKOCHA
MEKONISA
Coffee disease
Enset diseases
DABOTA
Pure water
KERA SODITY
Sustainable food
security plane
HASEHARO
Coffee diseases
Absence of for
distance area of
to get good price
To prevent
different kind of
disease
Because the basic
economic source
Because the basic
survival of life
Road construction
Road construction
Enset disease
CBD
To prevent water
born disease
Which participate
a committee and
should be more
accepted by
community
Because the
basic economic
sources
Road
Pure water
Enset disease
To meet each
other’s & to come
the investor
To meet different
kind of Kebele &
wereda
Because the basic
economic source
Because coffee is
the basic source
of Income
To communicate
each other
To care
sanitation, prevent
the diseases
To meet each
other’s & to come
the investor
Wage
Health centre
Electricity light
Because the back
bone of farmers
Road
construction
Comment 3
Pure water
Because the
back bone of the
farmers
To care a health
To use light &
to get
sustainable
industry
Because the big
problem of the
community
240
Page 1 of 4

Wereda Disaster
Risk Profile
Data_Collected_Date
Disaster Risk Management and
Food Security Sector (DRMFSS)
Tuesday, December 2, 2014
Region S.N.N.P
Zone GEDEO
Wereda WENAGO
Selected Indicator
Interventions: Suggestions to DRM Actors in the Area - Community suggested measures to DRM actors in the area
for effective DRM actions
Kebele Name Measure 1
Comment 1
Measure 2
Comment 2
Measure 3
WETIKO
pure water
BELE BUKISA
Sustainable food
security plane
TUMATA
CHRECHA
Enough supply of
medicine
sanitation
problem to have
clean water
Road construction on
bridge
Still the support
was weak should
be participator in
community
Road construction
To get
appropriate
medicine with list
price at a time
Effective awareness
creation program
above, health ,
increased productivity
To communicate
wereda and
other Keble For
market the Keble
have large
problem
community
Problem to
communicable
with other Keble
to market
government , Ngo's
did not support
enough
This is a
appropriate
method of
reducing disaster
risk
Electric light
Pure water
Enough supply of
improved
agricultural in put
Comment 3
To use new
technology
Sanitation
problem, the
women and
children suffer
material
To using disaster
resistant crop
and increasing
of productivity
241
Page 2 of 4

Wereda Disaster
Risk Profile
Data_Collected_Date
Disaster Risk Management and
Food Security Sector (DRMFSS)
Tuesday, December 2, 2014
Region S.N.N.P
Zone GEDEO
Wereda WENAGO
Selected Indicator
Interventions: Suggestions to DRM Actors in the Area - Community suggested measures to DRM actors in the area
for effective DRM actions
Kebele Name
HALEMO
Measure 1
Road construction
Comment 1
Facilitate the
actives of
reducing the risk
of disaster
Measure 2
Build health centre
Comment 2
To get appropriate
medical service
with list price at a
time
Measure 3
Build clean water
SOKICHA
KELECHA
SUGALE
DEKO
Supply of disease
resistant crop
Provide sustainable
aid
Electric light
Provide adequate
medicine, health
material service,
effective health
expert
To reduce
disasters cause
be coffee and
Enset disease
The people live in
under poverty
and disable
Supply of enough
medicinal and
educated health expert
Immediate response
before, during and
after disaster
Prevent eye
problem, adopt
new technology
Road and bridge
constructor
To minimize cost
pay for health
care, access to
health facilities
Provide safe and pure
drinking water
To reduce extra
cost and to get
medicinal access
easily in local
To control the
disaster before
Create to market
transaction,
linkage to
merchant and
market
To prevent or
control water born
disease
Build the clean
water
Enough supply
of medicine and
educated health
expert
Supply pure
drinking water
Give solution
for crop diseases
(Enset & coffee )
immediately
242
Comment 3
Access of
enough clean
water and
reducing water
born disease
To reduce water
pollution
Get health
service
effectively
Access to pure
drinking water,
prevent water
born disease
Develop
production &
productivity
Page 3 of 4
Wereda Disaster
Risk Profile
Data_Collected_Date
Disaster Risk Management and
Food Security Sector (DRMFSS)
Tuesday, December 2, 2014
Region S.N.N.P
Zone GEDEO
Wereda WENAGO
Selected Indicator
Interventions: Suggestions to DRM Actors in the Area - Community suggested measures to DRM actors in the area
for effective DRM actions
Kebele Name Measure 1
Comment 1
Measure 2
Comment 2
Measure 3
BANKO OKOTO
Employee effective
health expert,
provide enough
health medicine,
provide enough
health service,
materials
Access to health
facilities, to
decrease pay for
health care
Supply pure drinking
water, treatment of
water
To prevent or
control water,
born disease
Provide enough
support during
disaster, provide
improved and
disease resistance
seed
JEMJEMO
Road, bridge
To link from
Keble to Keble
and also wereda
, facilitate
transport,
increase
urbanization
Provide improved
drinking water,
develop spring
Lack of water
treatment, prevent
water born disease
Additional health
centre
Comment 3
Subsidized food
or cash to
increase
production and
productivity,
assure food
security at
household level
Provide an
adequate health
service,
compared to
beneficiaries
243
Page 4 of 4

Wereda Disaster
Risk Profile
Data_Collected_Date
Region S.N.N.P
Zone GEDEO
Disaster Risk Management and Food
Security Sector (DRMFSS)
Tuesday, December 2, 2014
Wereda WENAGO
Selected Indicator
Economic Vulnerability: Community Suggestions to Improve Economic Situation - Community suggested measures
to improve the economic situation of the area
KebeleName
Measure 1
Comment 1
Measure 2
Comment 2
Measure 3 Comment 3
KELECHA
DODORO
TOKOCHA
MEKONISA
DABOTA
KERA SODITY
To improve the price of
coffee
The price of coffee
Improve coffee price
The price of coffee
Improve the price of
coffee
To improve the price of
coffee
Because the back bone
of farmer
Because to decrease the
price
Because to decrease the
coffee price
The basic source of our
life
Because the back bone
of the farmer so to
increase the price
To improve economy
To improve the
price of input
To improve crop &
fertilizer price
Improve
agricultural Input
& improve the price
Because economic
hardship as a
farmer
Because
economically
hardship
Not balanced at
economic price
the people
To improve
the price of
fabricated
product
To improve
pure coffee
Improve the
price of goods
Because
economic
hardship
Because to
get good
price
Not
balanced at
economic
price the
people
Improve the price
of agricultural
input (seed
fertilizer )
To cope central
market
Because most of
the framers
economical
hardship so
improve the price
We have got good
price
Improve the
price of
crops & goods
Because not
balanced
people
economy
To improve
the price of
money
We have get
good price
244
Page 1 of 4

Wereda Disaster
Risk Profile
Data_Collected_Date
Region S.N.N.P
Zone GEDEO
Disaster Risk Management and Food
Security Sector (DRMFSS)
Tuesday, December 2, 2014
Wereda WENAGO
Selected Indicator
Economic Vulnerability: Community Suggestions to Improve Economic Situation - Community suggested measures
to improve the economic situation of the area
KebeleName
Measure 1
Comment 1
Measure 2
Comment 2
Measure 3 Comment 3
HASEHARO
WETIKO
BELE BUKISA
TUMATA
CHRECHA
HALEMO
To improve the price of
coffee
Because the back bone
the farmers
To improve the
price of input
(seed, fertilizer )
Disease resistant
coffee seedling
planting
Free from diseases
Farmer inputs
seed, fertilizer
Coffee - should be
planted diseases
Resistant, specially
coffee
House electric light
service
To get economy free from
diseases
Inset
Petty trading
Electric light
For petty trade
Establish market
centre
Because not
balanced farmer
economy
Modality is needed
To improve
the price of
fabricated
products
Coffee
market
exchange -
improvement
Coffee
market fair
price
Because
economic
hardship
Fairs market
price
Fare price
To reduce women
force, to reduce
extra cost, to
reduce time loss
For reduce extra
cost
Build health
centre
Mill
To get easily
health
service in
local
For reduce
extra cost ,
for reduce
time loss
women's
force
245
Page 2 of 4
Wereda Disaster
Risk Profile
Data_Collected_Date
Region S.N.N.P
Zone GEDEO
Disaster Risk Management and Food
Security Sector (DRMFSS)
Tuesday, December 2, 2014
Wereda WENAGO
Selected Indicator
Economic Vulnerability: Community Suggestions to Improve Economic Situation - Community suggested measures
to improve the economic situation of the area
KebeleName
Measure 1
Comment 1
Measure 2
Comment 2
Measure 3 Comment 3
SOKICHA
KELECHA
SUGALE
Opening of municipality
in the Keble
Urbanization
Road & Bridge
Wood work machine
Facilitate marketing
system
To work furniture
DEKO
BANKO OKOTO
organized un employed
youth by micro and
small scale enterprise
Electric light
To decrease
unemployment
Prevent eye problem,
children will be study
well , used to different
machineries
Opening of high
school
School build above
6th grade
Build additional
health centre
build mill
Build additional
health centre
To reduce extra
cost
Loss of extra cost
To decreased
women labour
pain, decreased
pay for health care
To minimize
women labour and
cost
To decrease
women labour
pains
Starting the
service of
build health
centre
Electric light
Organized
completed
grade 10th
youth
Road
construction
Build mill
Now used
health centre
in the Keble
For petty
trade
Decrease
unemployme
nt
Linkage
merchants to
market
To minimize
women
labour and
cost
246
Page 3 of 4

Wereda Disaster
Risk Profile
Data_Collected_Date
Region S.N.N.P
Zone GEDEO
Disaster Risk Management and Food
Security Sector (DRMFSS)
Tuesday, December 2, 2014
Wereda WENAGO
Selected Indicator
Economic Vulnerability: Community Suggestions to Improve Economic Situation - Community suggested measures
to improve the economic situation of the area
KebeleName
JEMJEMO
Measure 1
Increased price of
coffee
Comment 1
Not compensate, selling
and buying
Measure 2
Coffee, industry
Comment 2
Many question the
private
organization
Measure 3
Mill
Comment 3
Prevent
women to go
long
distance,
cost
minimize
247
Page 4 of 4

Wereda Disaster
Risk Profile
Disaster Risk Management and
Food Security Sector (DRMFSS)
Data_Collected_Date
Tuesday, December 2, 2014
Region S.N.N.P
Selected Indicator
Zone GEDEO
Community Awareness of Disaster Risk Management System and Actors
Wereda WENAGO
Kebele Name
Institution 1 Responsibility
Activity Institution 2 Responsibility
Activity
Institution 3 Responsibility Activity
GASELCHO
Agricultural
office
to security of
food
Give
training,
give input
(seed
fertilizer )
DODORO
Health
Protect
centre office diseases
Vaccinatio
n to
aware a
people at
army type
of disease
TOKOCHA
Agricultural
office
To secure food
Give
training,
supply in
puts,
give,
specialty
coffee
MEKONISA
Health
office
To prevent
diseases
To aware
the
people
vaccinatio
n to
give the
drug
248
Page 1 of 4
Wereda Disaster
Risk Profile
Data_Collected_Date
Disaster Risk Management and
Food Security Sector (DRMFSS)
Tuesday, December 2, 2014
Region S.N.N.P
Zone GEDEO
Selected Indicator
Community Awareness of Disaster Risk Management System and Actors
Kebele Name
Institution 1 Responsibility
Activity Institution 2 Responsibility
Wereda WENAGO
Activity
Institution 3 Responsibility Activity
DABOTA
KERA SODITY
HASEHARO
WETIKO
BELE BUKISA
Agricultural
office
Developmen
tal office
Agricultural
office
Developmen
tal office
E/w/r/r/f
security
Security of food
Increasing food
crop
to security of
food
Food security
Awareness,
food , grain
support aid
Give
training,
give
inputs
Adopt
new
technolog
y
Give
training,
give
inputs
Adapted
new
technolog
y farm
input
Give food
aid
249
Page 2 of 4
Wereda Disaster
Risk Profile
Data_Collected_Date
Disaster Risk Management and
Food Security Sector (DRMFSS)
Tuesday, December 2, 2014
Region S.N.N.P
Zone GEDEO
Selected Indicator
Community Awareness of Disaster Risk Management System and Actors
Kebele Name
TUMATA
CHRECHA
HALEMO
SOKICHA
KELECHA
Institution 1 Responsibility
Agricultural
office
Increase
production and
productivity
Agricultural
Increasing
production &
productivity
Health
office
Preventing
public health
Agricultural Food security
Activity Institution 2
Supply of
improved
in put &
extension
service
Supply of
improved
agricultur
al input
Curing
measure
and
access of
medicine
Supply of
improved
agricultur
al
technolog
y
Responsibility
Wereda WENAGO
Activity
Institution 3 Responsibility Activity
250
Page 3 of 4
Wereda Disaster
Risk Profile
Data_Collected_Date
Disaster Risk Management and
Food Security Sector (DRMFSS)
Tuesday, December 2, 2014
Region S.N.N.P
Zone GEDEO
Selected Indicator
Community Awareness of Disaster Risk Management System and Actors
Kebele Name
SUGALE
DEKO
BANKO OKOTO
JEMJEMO
Institution 1 Responsibility
Agricultural
Asset food
security &
increase
production
Agricultural
office
Health
office
Develop
agricultural
product
Prevision &
control disease
Health
office
Disease
prevention &
control
Activity Institution 2
Adopt
new
technolog
y,
fertilizer,
applicatio
n
Provide
improved
seed
Awareness
creation,
provide
medicine
Awareness
creation,
provide
medicine
Responsibility
Wereda WENAGO
Activity
Institution 3 Responsibility Activity
251
Page 4 of 4
Wereda Disaster
Risk Profile
Data_Collected_Date
Disaster Risk Management and Food
Security Sector (DRMFSS)
Tuesday, December 2, 2014
Region S.N.N.P
Zone GEDEO
Wereda WENAGO
Selected Indicator
Community Perception of DRM System and Actors - Perception of the community on the effectiveness of DRM
system in helping them to prevent, cope and recover from disasters
KebeleName
GASELCHO
DODORO
TOKOCHA
Prevention
Weak
Support is not enough
Weaken
Coping
Support is not sufficient
To help different kind of
crop get credit, All of them
are to help different
materials other things but
support is not enough
Support is not sufficient
Recovery
This is not enough
All of them are to help
the people but cannot
recover from the disaster
Overall_Effectiveness
The system is not
participatory
The system is not
participator
This is not enough
MEKONISA
DABOTA
KERA SODITY
HASEHARO
WETIKO
BELE BUKISA
Weak
Weak
Weak
Weak
Weak
Weak
Support is not sufficient
Support is not sufficient
The support is not
sufficient for a community
support is not sufficient
The support is not
sufficient for the community
the supports not sufficient
for community
This is not enough
This is not enough
This is not enough
This is not enough
This is not enough
If it sustainable food
security project to
increase production
The system is not
participatory
The system is not
participatory
The system was not
participatory
The system is not
participatory
The system was not
participatory
Because the system was
not participator in
community
252
Page 1 of 4

Wereda Disaster
Risk Profile
Data_Collected_Date
Disaster Risk Management and Food
Security Sector (DRMFSS)
Tuesday, December 2, 2014
Region S.N.N.P
Selected Indicator
Zone GEDEO
Wereda WENAGO
Community Perception of DRM System and Actors - Perception of the community on the effectiveness of DRM
system in helping them to prevent, cope and recover from disasters
KebeleName
TUMATA CHRECHA
HALEMO
SOKICHA
Prevention
Most actors are not
effective because if they
are effective the
magnitude of disaster
would be decreased
Mostly they were done on
awareness creation they
are not effective because
not enough
Coping
They are effective during
disaster by provide materials
& Food aid but they cannot
be cover all affected
community, Agricultural
office cannot be take
integrate pest management
systems due to the case of
organic coffee
production
They were done
something's during disasters
but not cover all exposed
community
They were done something
but not enough for
prevention , measure (only
done on awareness
creation )
They were done something
during disaster but not
cover all, disaster faced
community
Recovery
The support I of the
system are not enough
but Government al
agencies facilities credit
service , Ngo's provide
vegetable seed and Root
crop
Overall_Effectiveness
Information gap between
community and agencies
office, the economic level
of the institutions are not
competent to community
problems
They were done on
awareness creation and
supply of different input
and materials but not
participate all exposed
people
They were done on
awareness creation and
facilitate credit , but not
participate all disaster
faced community
Distance of Keble from
wereda, problem of on
time response , problem of
road
Problem of on time
response , problem at
selections of disaster,
faced community
253
Page 2 of 4
Wereda Disaster
Risk Profile
Data_Collected_Date
Disaster Risk Management and Food
Security Sector (DRMFSS)
Tuesday, December 2, 2014
Region S.N.N.P
Selected Indicator
Zone GEDEO
Wereda WENAGO
Community Perception of DRM System and Actors - Perception of the community on the effectiveness of DRM
system in helping them to prevent, cope and recover from disasters
KebeleName
KELECHA
SUGALE
DEKO
Prevention
If they are effective than
the disaster could be
decrease, they are done
something but not enough
for prevention measure
(only done on awareness
creation )
Weak
There was support but
inadequate
Coping
They were done something
during disasters but not
cover all affected people
There was not enough
response because not include
the whole affected
community
The response is not include
the whole affected
community
Recovery
They were done on
awareness creation , still
now the activities are not
participate all disaster
exposed community -
facilitate credit
There was not any
support, response and
follow up after disaster
There was not any
response, follow up after
disaster
Overall_Effectiveness
They were not done with
community nearly , they
are not give immediate
response on time , they
have a problem at selection
of disaster exposed
community
Provide sustainable support
until recover from disaster,
even they asked community
problems , they will not
give rapid response,
communicate in correct
information from
institution about disaster
Information gap between
community and institution
, not provide sustainable
support until recover from
disaster
254
Page 3 of 4

Wereda Disaster
Risk Profile
Data_Collected_Date
Disaster Risk Management and Food
Security Sector (DRMFSS)
Tuesday, December 2, 2014
Region S.N.N.P
Selected Indicator
Zone GEDEO
Wereda WENAGO
Community Perception of DRM System and Actors - Perception of the community on the effectiveness of DRM
system in helping them to prevent, cope and recover from disasters
KebeleName
BANKO OKOTO
Prevention
JEMJEMO
Weak
Coping
Inadequate response during
disasters because the
response not include the
whole affected community
Insufficient response during
disease because the
response not include the
whole affected community
Recovery
There is no any response
or follow up after
disaster,
There is no any support or
follow up after, disaster
Overall_Effectiveness
Even they asked
community problems , they
will not give rapid
response on time,
communicate incorrect
information from
organization about
disaster, information not
reached to properly to
government
Information gap not
provide sustainable support
until recover from disaster,
not give rapid response ,
communicate incorrect
information
255
Page 4 of 4
Data_Collected_Date
Tuesday, December 2, 2014
Region S.N.N.P
Zone GEDEO
Wereda WENAGO
Selected Indicator
Major Public Interventions Desired - Percentage of households by type of
intervention desired
Major public interventions desired by the community
Degree of Importance for the community
Better job
1st
13.30
2nd
12.37
3rd
13.15
Cash transfers/social assistance
1.02
2.32
2.19
Cash-for-work activities (not employment)
1.02
5.41
6.03
Food aid
51.41
9.28
5.21
Food-for-work activities
0.00
2.32
4.38
Medical assistance / access to health facilities
0.77
4.64
9.59
Micro-credit programmes
12.53
25.77
24.11
Other
0.00
0.00
0.55
Rental subsidies
0.00
1.80
0.27
School feeding for children
0.26
1.80
1.10
School fees for children
1.79
5.93
8.49
Subsidized food
10.23
11.86
5.48
Subsidized health care
5.12
10.05
10.41
Supplementary feeding for women and young children
2.56
5.93
4.93
256
Page 1 of 1
WDRP Indicators
Other Community Characteristics
257

Wereda Disaster
Risk Profile
Data_Collected_Date
Disaster Risk Management and Food
Security Sector (DRMFSS)
Tuesday, December 2, 2014
Region S.N.N.P
Selected Indicator
Kebele Name
Zone GEDEO
Capacity: Community Based Organizations in the Wereda
Name_Of_Organization
Est._Year
Formal/Informal
Wereda WENAGO
Type of Members
Activity
GASELCHO
Debo
Edir
1968
1987
Informal
Informal
Father & youth
Father & mother
To make any construction
to work any type of a
apiculture
To help each other
Ekub
1990
Informal
Mother
To help each other
Saving
2001
Formal
Father & mother
To use problem time
DODORO
Debo
Edir
1983
1985
Informal
Informal
fathers
Fathers & mothers
most of the work to do as
this system
To help each other
Ekub
Saving
1987
1987
Informal
Formal
younger's
Father & mother
To make house to fatling
bull to buy a motor
to use as a problem time
TOKOCHA
debo
Edir
1998
1972
Informal
Informal
Father & youth
Father
For agricultural to make
house , brief etc
To help each others
Ekub
2000
Informal
Mothers
To help each others
Saving
2002
Formal
Father & mother
To use a problem time
258
Page 1 of 6

Wereda Disaster
Risk Profile
Data_Collected_Date
Disaster Risk Management and Food
Security Sector (DRMFSS)
Tuesday, December 2, 2014
Region S.N.N.P
Selected Indicator
Kebele Name
Zone GEDEO
Capacity: Community Based Organizations in the Wereda
Name_Of_Organization
Est._Year
Formal/Informal
Wereda WENAGO
Type of Members
Activity
MEKONISA
Debo
Edir
1968
1972
Formal
Informal
fathers
Father
agricultural , make house
dam
to death, to make house
DABOTA
Co-operative
Debo
Edir
Ekub
Saving
1970
1962
1983
1998
2002
Formal
Informal
Informal
Informal
Formal
father
fathers youth
Father
Mother
Father & mother
The production to buy good
price
Do work to gather , make
house, together
To help each other at
sadness, marriage
You do the interest of him
self
We use at a problem, time
KERA SODITY
Debo
Equb
Saving & credit
1999
2000
1998
Informal
Informal
Formal
People men,
voluntary
Youth , to cultivate land
together each other
To help each other cover
economic problem
to buy form in puts
HASEHARO
Debo
1962
Informal
father's youth
for agricultural , to make
house & bridge
259
Page 2 of 6

Wereda Disaster
Risk Profile
Data_Collected_Date
Disaster Risk Management and Food
Security Sector (DRMFSS)
Tuesday, December 2, 2014
Region S.N.N.P
Selected Indicator
Kebele Name
HASEHARO
Zone GEDEO
Capacity: Community Based Organizations in the Wereda
Name_Of_Organization
Est._Year
Formal/Informal
Edir
1972
Informal
Wereda WENAGO
Type of Members
Father
Activity
To help each other
Ekub
2000
Informal
mothers
To help each other
Saving
2002
Formal
Father & mother
To use a problem time
WETIKO
BELE BUKISA
Debo
Equb
Saving & credit
Co -operative
Debo
Equb
Saving & credit
Co -operative
1964
1981
1999
1968
1998
2000
1986
1985
Informal
Informal
Informal
Formal
Informal
Informal
Informal
Formal
Volunteer / men
women / yout
Volunteer / men
women / yout
volunteer / men,
women, / yo
Volunteer / men
women / yout
voluntary men
Women, fathers,
mothers
Women, fathers,
mothers
Women, fathers,
mothers
Cultivated land working
together
The helping each other
Giving and task credit
Cultivate land or together
working together
Helping each other
Giving & took credit to each
other
Giving & took credit to each
other
260
Page 3 of 6

Wereda Disaster
Risk Profile
Data_Collected_Date
Disaster Risk Management and Food
Security Sector (DRMFSS)
Tuesday, December 2, 2014
Region S.N.N.P
Selected Indicator
Kebele Name
TUMATA CHRECHA
Zone GEDEO
Capacity: Community Based Organizations in the Wereda
Name_Of_Organization
Est._Year
Formal/Informal
Ekub
1962
Informal
Edir
1962
Informal
Debo ( gollo )
1964
Informal
Efango women association
1985
Informal
Wereda WENAGO
Type of Members
elders, working
group
elders , working
group
Elders , working
group
House wife
Activity
Saving money
Health each other during
disaster
Working together
Saving money
HALEMO
Edir
1957
Informal
Elders working
help each other
Ekub
1955
Informal
elders, working
saving
SOKICHA
Resa union co-operative
association
Lantano saving and credit
association
Edir
Ekub
1968
2003
From early
up to now
1945
Formal
Formal
Informal
Informal
elders working
All people
elders, working
elders, working
coffee industry
saving & credit
Help each other
Saving money
Debo
starting
from early
fathers
Informal
Elders, working
Working together
261
Page 4 of 6

Wereda Disaster
Risk Profile
Data_Collected_Date
Disaster Risk Management and Food
Security Sector (DRMFSS)
Tuesday, December 2, 2014
Region S.N.N.P
Selected Indicator
Kebele Name
SOKICHA
KELECHA
Zone GEDEO
Capacity: Community Based Organizations in the Wereda
Name_Of_Organization
Est._Year
Formal/Informal
Resa farmer cooperation
association
Ekub
1968
1962
Formal
Informal
Wereda WENAGO
Type of Members
Elders, working
Elders working
Activity
Saving & credit
Saving
Edir
Debo (gollo)
1945
1948
Informal
Informal
elders, working /
youth
All community
Helping each other
Working together
SUGALE
saving and credit
association
Edir
Ekub
2002
1945
1945
Formal
Informal
Informal
Elders, working ,
youth
Elders
elders, youth
Saving & credit
Help each other during
death
saving money
Cooperative, finch wuha,
association
Goll (debo)
1981
1968
Formal
Formal
Elders, youth
Youth, working
Saving and credit activities
Working farm activities
DEKO
Saving & credit institution
Cooperation union
1998
1972
Formal
Formal
Youth working
elders
Youth, working
Saving money
Saving money
262
Page 5 of 6
Wereda Disaster
Risk Profile
Data_Collected_Date
Disaster Risk Management and Food
Security Sector (DRMFSS)
Tuesday, December 2, 2014
Region S.N.N.P
Selected Indicator
Kebele Name
DEKO
Zone GEDEO
Capacity: Community Based Organizations in the Wereda
Name_Of_Organization
Edir
Est._Year
1952
Formal/Informal
Informal
Ekub
1987
Informal
BANKO OKOTO
Debo
early
Informal
Edir
1955
Informal
Ekub
1970
Informal
Wereda WENAGO
Type of Members
working elder
youth , working ,
elders
Elders, youth
Elders
Elders youth
Activity
help each other, during
illness, death
saving money
plough , farm land by mass
, build or repair old house
help each other, during
death illness
Saving money
JEMJEMO
Farmer union co-operative
association
Edir
Ekub
Debo ( golo )
1968
1950
1950
1940
Saving and credit
institution
1998
Formal
Informal
Informal
Informal
Formal
Elders, youth
Elders
elders, youth
Elders, youth
Elders, youth
Saving money
to support each other during
, hard ship
To save, money, to solve
temporary, problem
A group of farmers, plough
individual farm land , repair
house, fierce
Using to hard time
263
Page 6 of 6
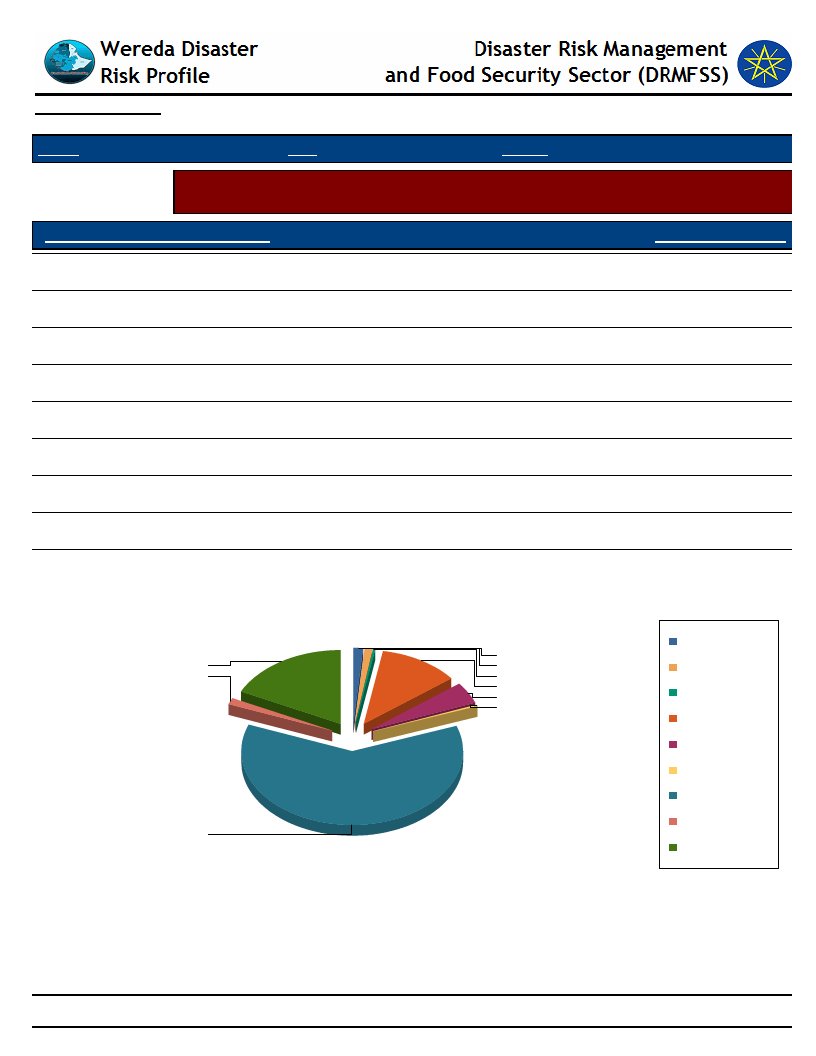
Data_Collected_Date
Tuesday, December 2, 2014
Region S.N.N.P
Zone GEDEO
Wereda WENAGO
Selected Indicator
Supporting Agencies against Disasters - Percentage of households by supporting
institutions to handle or recover from disaster damages
Supporting Agencies Against Disasters
Response_Percentage
National or local authorities
0.30
International NGOs (e.g. UN organizations, ICRC, etc.)
11.57
Family members in the same community
0.89
Family members outside the community
0.30
Support via contacts working for the authorities
17.51
Support via contacts working for NGOs
1.19
None
60.24
DK
1.48
NA
4.45
Supporting Agencies Against Disasters
1.5
17.5
0.9
1.2
0.3
11.6
4.5
0.3
60.2
DK
Family members in the
same community
Family members outside
the community
International NGOs (e.g.
UN organizations, ICRC,
etc.)
NA
National or local
authorities
None
Support via contacts
working for NGOs
Support via contacts
working for the
authorities
264
Page 1 of 1
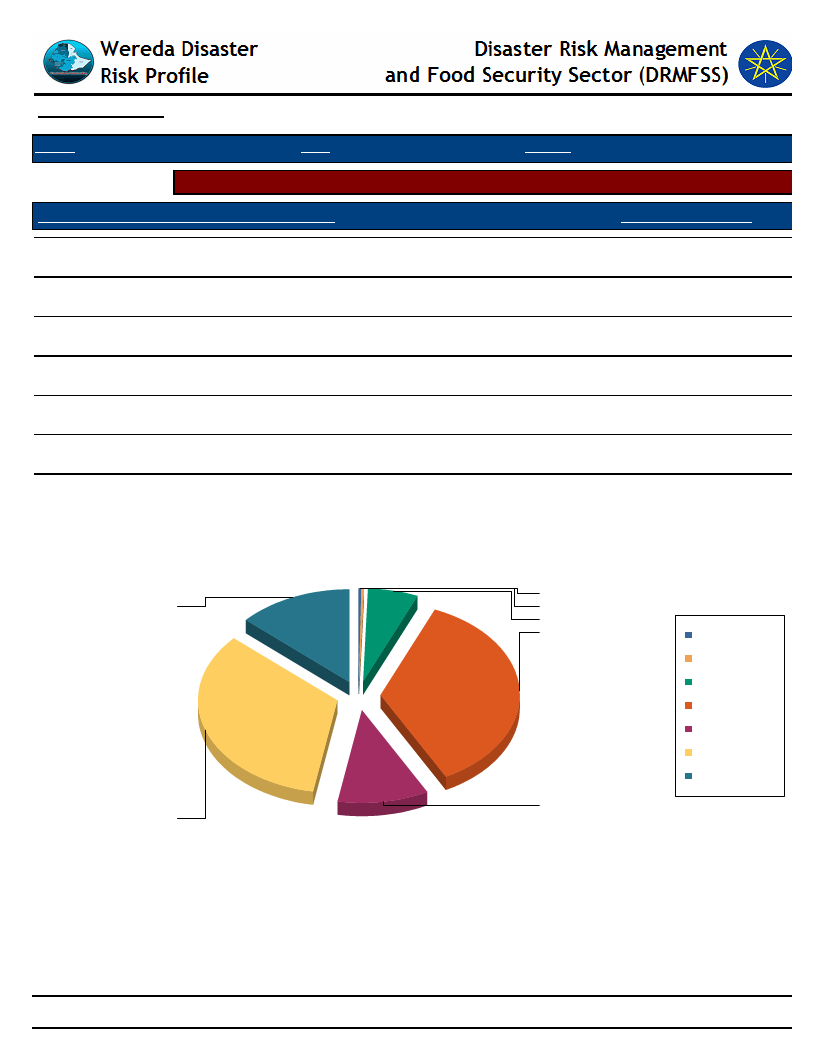
Data_Collected_Date
Tuesday, December 2, 2014
Region S.N.N.P
Zone GEDEO
Wereda WENAGO
Selected Indicator
Types of support received by households during disasters
Type of Support Provided By Supporting Agencies
Response_Percentage
Emergency aid (food, water, shelter, etc.)
9.91
Capital for re-construction of house and property
5.26
Access to capital or loan for adaptation/protection measures
0.31
Assets such as livestock replenishment
0.31
Other
12.38
DK
33.44
NA
31.58
Type of Support Provided By Supporting Agencies
0
12
0
5
Access to capital or loan
33
for adaptation/protection
measures
Assets such as livestock
replenishment
Capital for
re-construction of house
and property
DK
Emergency aid (food,
water, shelter, etc.)
NA
Other
10
32
265
Page 1 of 1
Wereda Disaster
Risk Profile
Data_Collected_Date
Disaster Risk Management and
Food Security Sector (DRMFSS)
Tuesday, December 2, 2014
Region S.N.N.P
Zone GEDEO
Wereda WENAGO
Selected Indicator
Government Actors in the Field of Disaster Risk Management - Government actors and their activities in the field
of Disaster Risk Managements
Government Institution
Activity
Description
Activity
Description Activity
Description Activity Description
Water Resource
Development Office
Agriculture Office
Awareness creation
Regular monitoring
Improve the
community
awareness about
using land,
handling of clean
water
Collecting
weekly
information,
collecting
monthly
information,
make analysis
and report the
information
Building of clean
water
Seasonal
monitoring
The building
clean water
by selection
most
problematic
areas and
the
distribution
of clean
water for all
community
Crop
production
current and
reference
year data,
livestock
data, market
price data,
input data
and labour
price
The
maintenance
of the farmer
water sector
Existent
and
continuous
of the
farmer
water sector
The
chemical
treatment
of build
and un
build
water
To keep
water,
sanitation
and quality
Disaster area
assessment
Nutrition
survey
Screen out
under
malnourish
children,
pregnant and
lactating
mothers
266
Page 1 of 2

Wereda Disaster
Risk Profile
Data_Collected_Date
Disaster Risk Management and
Food Security Sector (DRMFSS)
Tuesday, December 2, 2014
Region S.N.N.P
Zone GEDEO
Wereda WENAGO
Selected Indicator
Government Actors in the Field of Disaster Risk Management - Government actors and their activities in the field
of Disaster Risk Managements
Government Institution
Activity
Description
Activity
Description Activity
Description Activity Description
Health Office
Education Office
To do rest room
building water use,
make aw
Awareness
After control the
disaster the
community
enough
awareness at
prevention
preparedness at
future time
For the
community
To destroy the
collected water
to use Agober,
to use DDT
Building slight
school
The
community
awareness on
malaria
disease,
preparedness
& precaution
Can Priority
selected the
damage
children
Supply solar
light school
& inputs
Increasing
school,
education in
put
To get
additional
food
Supply
material
for so
chord
267
Page 2 of 2

Data_Collected_Date
Region S.N.N.P
Zone GEDEO
Tuesday, December 2, 2014
Wereda WENAGO
Selected Indicator
Non-Government Actors in the Field of Disaster Risk Management -
Non-government actors and their activities in the field of Disaster Risk
Management
Non Governmental Actors
in the Wereda
Activities
OXFAM
WASH
WFP
UNICEF
CRS
Give water, chemical, make quality of chicken, Give sleeping bag,
construct pure water facilities
Constructing clean water facilities, works on personal and environmental
sanitation activities
Assistance is finally targeted to the poorest and most malnourished, provide
certified food to malnourished child, pregnant and lasting women, provide
school feeding service to stimulate parents send their children to school
Constructing clean water facilities and supplies of water treatment
chemicals for this sector
Improve household income generating activities, build school, provide
inceptive to children who initiate to learn, support children by different
school materials
268
Page 1 of 1
Wereda Disaster
Risk Profile
Data_Collected_Date
Disaster Risk Management
and Food Security Sector (DRMFSS)
December 02, 2014
Region S.N.N.P
Selected Indicator:
Zone
GEDEO
Interventions: Community Suggestions to Development Actors
Wereda WENAGO
Kebele Name
Type Of Disaster 1
Early Warning Indicator
KELECHA
CBD
Heavy coldness, Snow
Type Of Disaster 3
Early Warning Indicator
Preparedness Measure
Type Of Disaster 2
Early Warning Indicator
Preparedness Measure
Find other job opportunity, saving food &
money
Soil erosion
A sloppy area, deforestation , "Tefa" bacteria,
Prepare additional seed & crop
Preparedness Measure
Type Of Disaster 4
Early Warning Indicator
Preparedness Measure
Kebele Name
Type Of Disaster 1
Early Warning Indicator
Preparedness Measure
Type Of Disaster 2
Early Warning Indicator
Preparedness Measure
DODORO
Seasonal production
If the dust & dry wind occurred on the sky
caused chemical change
The community should be awarded to keep crop
Drought
If the dust & dry wind occurred on the sky
caused chemical change
The community should be save crop
Type Of Disaster 3
Early Warning Indicator
Preparedness Measure
Type Of Disaster 4
Early Warning Indicator
Preparedness Measure
269
Page 1 of 9

Region S.N.N.P
Selected Indicator:
Zone
GEDEO
Interventions: Community Suggestions to Development Actors
Wereda WENAGO
Kebele Name
Type Of Disaster 1
Early Warning Indicator
TOKOCHA
Hungry
Elders seen moon
Type Of Disaster 3
Early Warning Indicator
Preparedness Measure
To save money, to save any production
Preparedness Measure
Type Of Disaster 2
Early Warning Indicator
Preparedness Measure
Human disease
Elders seen heavy sun shine
To prepare themselves, to save money
Type Of Disaster 4
Early Warning Indicator
Preparedness Measure
Kebele Name
Type Of Disaster 1
Early Warning Indicator
Preparedness Measure
Type Of Disaster 2
Early Warning Indicator
Preparedness Measure
MEKONISA
Enset disease
"Tefa" warm, Drought
To save money, save any production
Heavy snow
Unknown
To prepare themselves, save money
Type Of Disaster 3
Early Warning Indicator
Preparedness Measure
Type Of Disaster 4
Early Warning Indicator
Preparedness Measure
270
Page 2 of 9

Region S.N.N.P
Selected Indicator:
Zone
GEDEO
Interventions: Community Suggestions to Development Actors
Wereda WENAGO
Kebele Name
Type Of Disaster 1
Early Warning Indicator
DODORO
Heavy snow
Unknown
Type Of Disaster 3
Early Warning Indicator
Preparedness Measure
Sowing short time crop
Preparedness Measure
Type Of Disaster 2
Early Warning Indicator
Preparedness Measure
Shortage of rain fall
Decrease forest
Save the crop other food crop
Type Of Disaster 4
Early Warning Indicator
Preparedness Measure
Kebele Name
Type Of Disaster 1
Early Warning Indicator
Preparedness Measure
Type Of Disaster 2
Early Warning Indicator
Preparedness Measure
KERA SODITY
Malaria
Heavy rain continuous, water logged in the
surface pounds
Spraying DDT
Influenza
Dusts in air or on sky dry seasonal drought
keeping clean, wearing cloths well protection
from cold
Type Of Disaster 3
Early Warning Indicator
Preparedness Measure
Type Of Disaster 4
Early Warning Indicator
Preparedness Measure
271
Page 3 of 9

Region S.N.N.P
Selected Indicator:
Zone
GEDEO
Interventions: Community Suggestions to Development Actors
Wereda WENAGO
Kebele Name
Type Of Disaster 1
Early Warning Indicator
KELECHA
Human disease
High rain fall and Frost
Type Of Disaster 3
Early Warning Indicator
Preparedness Measure
No
Preparedness Measure
Type Of Disaster 2
Early Warning Indicator
Type Of Disaster 4
Early Warning Indicator
Preparedness Measure
Preparedness Measure
Kebele Name
Type Of Disaster 1
Early Warning Indicator
Preparedness Measure
Type Of Disaster 2
Early Warning Indicator
Preparedness Measure
SUGALE
Grass hopper
Influenza
Body headache, coughing, sneezing
Exculpates tree, use garlic
Type Of Disaster 3
Early Warning Indicator
Preparedness Measure
Type Of Disaster 4
Early Warning Indicator
Preparedness Measure
272
Page 4 of 9

Region S.N.N.P
Selected Indicator:
Zone
GEDEO
Interventions: Community Suggestions to Development Actors
Wereda WENAGO
Kebele Name
Type Of Disaster 1
Early Warning Indicator
DEKO
Malaria
A bad head ache, fever
Type Of Disaster 3
Early Warning Indicator
Preparedness Measure
Eat garlic
Preparedness Measure
Type Of Disaster 2
Early Warning Indicator
Preparedness Measure
Influenza
Coughing, sneezing, headache
Steam by boiled eucalyptus leaf
Type Of Disaster 4
Early Warning Indicator
Preparedness Measure
Kebele Name
Type Of Disaster 1
Early Warning Indicator
Preparedness Measure
Type Of Disaster 2
Early Warning Indicator
Preparedness Measure
BANKO OKOTO
War
The sun becomes dark red
Pray to god (keytala) Traditional shengo
War
Children's construct artificial gun and soughing
during plying
Type Of Disaster 3
Early Warning Indicator
Preparedness Measure
Type Of Disaster 4
Early Warning Indicator
Preparedness Measure
273
Page 5 of 9
Region S.N.N.P
Selected Indicator:
Zone
GEDEO
Interventions: Community Suggestions to Development Actors
Wereda WENAGO
Kebele Name
Type Of Disaster 1
Early Warning Indicator
KEBELE01
Famine
Heavy storm
Type Of Disaster 3
Early Warning Indicator
Preparedness Measure
Pray to god
Preparedness Measure
Type Of Disaster 2
Early Warning Indicator
War
Posting of stars
Type Of Disaster 4
Early Warning Indicator
Preparedness Measure
Preparedness Measure
Kebele Name
Type Of Disaster 1
Early Warning Indicator
Preparedness Measure
Type Of Disaster 2
Early Warning Indicator
Preparedness Measure
HASEHARO
Climatic change
Seasonal problem
To save the product, labour
Human diseases
Collected water, lack of awareness
Use Agober, density the collected water
Type Of Disaster 3
Early Warning Indicator
Preparedness Measure
Type Of Disaster 4
Early Warning Indicator
Preparedness Measure
274
Page 6 of 9

Region S.N.N.P
Selected Indicator:
Zone
GEDEO
Interventions: Community Suggestions to Development Actors
Wereda WENAGO
Kebele Name
Type Of Disaster 1
Early Warning Indicator
WETIKO
Climatically change
The forest decreasing
Type Of Disaster 3
Early Warning Indicator
Preparedness Measure
Type Of Disaster 2
Early Warning Indicator
Preparedness Measure
Planting trees / Adaption
needed /
Food shortage
of agro forestay
A fast growing population, loss of crop
production
To sowing short period crop
Preparedness Measure
Type Of Disaster 4
Early Warning Indicator
Preparedness Measure
Kebele Name
Type Of Disaster 1
Early Warning Indicator
Preparedness Measure
Type Of Disaster 2
Early Warning Indicator
Preparedness Measure
BELE BUKISA
Drought
Dry wind on cloud, on sky
Save preparedness, Awareness
Food shortage
Shortage of rain
Save preparedness, Awareness
Type Of Disaster 3
Early Warning Indicator
Preparedness Measure
Type Of Disaster 4
Early Warning Indicator
Preparedness Measure
275
Page 7 of 9

Region S.N.N.P
Selected Indicator:
Zone
GEDEO
Interventions: Community Suggestions to Development Actors
Wereda WENAGO
Kebele Name
Type Of Disaster 1
Early Warning Indicator
TUMATA CHRECHA
Drought
In January month cannot be rain
Type Of Disaster 3
Early Warning Indicator
Preparedness Measure
Type Of Disaster 2
Early Warning Indicator
Preparedness Measure
Without praying to god they cannot be take any
preparedness measures
Diseases
highest cold temperature at morning and night
Wear a cloth , pray to God
Preparedness Measure
Type Of Disaster 4
Early Warning Indicator
Preparedness Measure
Kebele Name
Type Of Disaster 1
Early Warning Indicator
Preparedness Measure
Type Of Disaster 2
Early Warning Indicator
Preparedness Measure
HALEMO
War
The sun become desk red
praying for god with group
War
The direction of moon towards to south
praying for god with group
Type Of Disaster 3
Early Warning Indicator
Preparedness Measure
Type Of Disaster 4
Early Warning Indicator
Preparedness Measure
276
Page 8 of 9
Region S.N.N.P
Selected Indicator:
Zone
GEDEO
Interventions: Community Suggestions to Development Actors
Wereda WENAGO
Kebele Name
Type Of Disaster 1
Early Warning Indicator
SOKICHA
Different human, animal and plant diseases
Heavy rain full and frosts
Type Of Disaster 3
Early Warning Indicator
Preparedness Measure
They not take preparedness measures
Preparedness Measure
Type Of Disaster 2
Early Warning Indicator
Preparedness Measure
Drought
Spider make their houses
Hard working
Type Of Disaster 4
Early Warning Indicator
Preparedness Measure
277
Page 9 of 9

Wereda Disaster
Risk Profile
Data_Collected_Date
Region S.N.N.P
Zone
GEDEO
Disaster Risk Management
and Food Security Sector (DRMFSS)
Tuesday, December 2, 2014
Wereda WENAGO
Selected Indicator
Wereda Strengths, weaknesses, opportunites and treats (SWOT) Analysis
Kebele Name
Strength
Weakness
Opportunity
Threat
GASELCHO
DODORO
TOKOCHA
MEKONISA
DABOTA
Literate
High social interaction
Saving
Literate people
Hard ship worker
High social interaction
Literate
High social interaction
Saving
Literate
High social interaction
Literate
High social interaction
Saving
Have awareness
KERA SODITY
Literate
High social interaction
To work by organizational
Not family plan
Have not new technology
Lack of awareness
Less saving method
Do not find job opportunity
Only depend up on coffee,
Enset
Lack of awareness
No family plan
No saving more
Lack of awareness
Lack of awareness
No family plan
Have not family
organization at work
Lack of technology to
increase production
Lack of awareness
No sowing more
Lack of family plan
278
School
Health center
Electric
Keble health center
School
Pure water
Light
School
Pure water
Light
Health center
School construction
FTC
School
Health center
Electric
Network construction
Soft net
Keble health center
School
FTC
Hungry
Population density
Have not road
Climatic change
Coffee & Enset disease
Population density
Deforestation
Human density
To increase thief
Lack of job opportunity
To decrease product
Have enough drug
Have not enough school
Have not pure water
Coffee disease
Hungry
Inflection
Dependency
Population density
Have not opportunity
work
Page 1 of 7

Wereda Disaster
Risk Profile
Data_Collected_Date
Region S.N.N.P
Zone
GEDEO
Disaster Risk Management
and Food Security Sector (DRMFSS)
Tuesday, December 2, 2014
Wereda WENAGO
Selected Indicator
Wereda Strengths, weaknesses, opportunites and treats (SWOT) Analysis
Kebele Name
Strength
Weakness
Opportunity
Threat
HASEHARO
WETIKO
Literate
High social interaction
Save
Equib
Debo
Saving &credit
Tread in small skill , hand
craft
Lack of awareness
No family plan
Do not use new technology
Do not find other
opportunity work
Social problem
Lack of awareness
Social problem
Lack of awareness
School
Health center
Hole city
Road
Road
Road
Road
BELE BUKISA
high school interaction
Deforestation, lack of
awareness, population size
Road
Lack of pure water
Have not road
Have not electric
Have additional school
Economic loss, climatic
change, shortage of rain
Loss of food crop
production, Enset disease,
coffee barley disease
Loss of food crop
production, Enset disease,
coffee barley disease
Loss of food crop
production, Enset disease,
coffee barley disease
Lack of funding
279
Page 2 of 7

Wereda Disaster
Risk Profile
Data_Collected_Date
Region S.N.N.P
Zone
GEDEO
Disaster Risk Management
and Food Security Sector (DRMFSS)
Tuesday, December 2, 2014
Wereda WENAGO
Selected Indicator
Wereda Strengths, weaknesses, opportunites and treats (SWOT) Analysis
Kebele Name
TUMATA
CHRECHA
HALEMO
Strength
We have a good culture to
help each other ( Debo )
We have a good agro
forestry agricultural
system
We have a good saving
culture
We have good cooperation
and participation through
Edir, Equib, church
We have a good community
conflicts solving way
/shongo/
We have good agricultural
system Agro forestry )
We have good way of
working together at farm
debo )
We have money way of
helping each other indri,
Ikub
Weakness
Poor family planning
Poor time using
Poor saving habited
Illiteracy
Weakness of not send a child
to school
Poor saving habit
Poor use improved,
technology
Poor time usage,
drunkenness
Opportunity
Road access (Asphalt)
Health extension
1st cycle school, electric light
Ngo's / Belaya child and family
association
School (1-6)
Clean water, sector
Health extension
Famer training center
Threat
Lack the access of
treatment, chemical for
coffee and Enset diseases
Lack of enough , access of
medicine
Over population
Land security
Poor access o improve
variety of coffee and Enset
Poor access of clean
water
Luck of enough access of
medicine and educated
health expert
Lack of road
280
Page 3 of 7

Wereda Disaster
Risk Profile
Data_Collected_Date
Region S.N.N.P
Zone
GEDEO
Disaster Risk Management
and Food Security Sector (DRMFSS)
Tuesday, December 2, 2014
Wereda WENAGO
Selected Indicator
Wereda Strengths, weaknesses, opportunites and treats (SWOT) Analysis
Kebele Name
SOKICHA
Strength
Debo , working together
Shongo , cultural method of
solving conflicts
Agro forestry Agricultural
systems
Edir, Ekub
Weakness
Weakness of saving habits
Poor time using
Poor hard working
Drunkenness
Opportunity
Electric light
Road
Health center
Primary school
KELECHA
Saving cooperation for
home construction
Debo ( gollo ) working
together at farm
Shango, conflicts peace
full, solving, method
Ago forestry agricultural
system
Weakness of not send a child
to school
Poor use of time
Over alcohol drunkenness,
Poor saving habit
Poor family planning, early
marriage
Health center
Electric light
School ( 1st cycle )
Clean water
Threat
Over population, land
scarcity, decreasing
income
Lack of alternative job
opportunity
Lack of enough access of
medicine and educated
health expert
Lack of the access of
treatment chemical for
disease
Lack of enough access, of
medicine & educated,
health expert
Lack of enough access of
improved variety of coffee
and Enset
Increasing of wild animals
( ape )
Poor access of clean water
281
Page 4 of 7

Wereda Disaster
Risk Profile
Data_Collected_Date
Region S.N.N.P
Zone
GEDEO
Disaster Risk Management
and Food Security Sector (DRMFSS)
Tuesday, December 2, 2014
Wereda WENAGO
Selected Indicator
Wereda Strengths, weaknesses, opportunites and treats (SWOT) Analysis
Kebele Name
SUGALE
Strength
Respect to elders
Co-operation / working
together during disaster
Strong organization like
Edir, Ekub, shengo, gollo (
Debo )
Strength of religion
Weakness
No work any early warning ,
activities before disaster
Unable to use working time,
properly
Poor saving , habit, lack of
initiation to adopt new
technology
Lack of awareness about
family planning ,
drunkenness
Opportunity
Road
Electric light
Additional health center
School
DEKO
Strength of religion
Respect to elders
Strong organization like
Edir, Ekub, shengo, gollo (
Debo )
Co operation / working
together/ during disaster
Cannot work any early
warning activity before
disaster
Cannot use working time,
properly
Poor saving habit,
drunkenness
Lack of awareness about,
family planning
School
Health center
Coffee market centre
Farmer training center
Threat
Not keep standard &
quality , may not be
completed
No access to individual
house hold, no facilities
Lack of medicine, distance
from health center
ineffective expert
Insufficient material
service, ineffective
teacher, unable to learn
above 6 the grade
Lack of materials, infective
teachers, children cannot
be learn above, grade 6th
Lack of medicine, distance
from health centre
ineffective health expert
Decreased price of coffee,
coffee disease
Lack of material service,
not completed, not provide
service
Improper utilization of
begets at the Keble and
wereda level
282
Page 5 of 7

Wereda Disaster
Risk Profile
Data_Collected_Date
Region S.N.N.P
Zone
GEDEO
Disaster Risk Management
and Food Security Sector (DRMFSS)
Tuesday, December 2, 2014
Wereda WENAGO
Selected Indicator
Wereda Strengths, weaknesses, opportunites and treats (SWOT) Analysis
Kebele Name
Strength
Weakness
Opportunity
Threat
BANKO OKOTO
Cooperating or working
together during disaster
Respect to elders
Ploughing together, farm
land ( Gollo )
Strength due to religion,
traditional, shenog,
Poor saving, habit
No more cooperation after
disaster
No work any early warning
activates before disaster
No use working time
properly, drunkenness
Health center
School
Farmer training center
Coffee, production and Agro
forestry
Supply inadequate
medicine and health
material service, in
effective health expert
Children cannot be learn
above grade 6th , no
access job opportunity
Lack of material service,
information gab
Road problem , decrease,
coffee, price,
deforestation
283
Page 6 of 7
Wereda Disaster
Risk Profile
Data_Collected_Date
Region S.N.N.P
Zone
GEDEO
Disaster Risk Management
and Food Security Sector (DRMFSS)
Tuesday, December 2, 2014
Wereda WENAGO
Selected Indicator
Wereda Strengths, weaknesses, opportunites and treats (SWOT) Analysis
Kebele Name
JEMJEMO
Strength
No conflict between ethnic
group
Working together
High level of organization
Edir, Ekub , Goal ( Debo )
Strength of a Religion
Weakness
Drunkenness, cannot use
working time properly
Poor saving habit, lack of
awareness, about family
planning
Lack of initiation to adopt
new technology
Unable to work any early
warning activities before
disasters occur
Opportunity
Coffee market centre
Farmer training centre
Health centre
School
Threat
Decrease price of coffee,
coffee thief, creating by
brokerage
Lack of material service ,
not completed
Ineffective health expert,
distance from health
centre, lack of medicine,
lack of health service and
materials
Lack of school service
materials , lack of
teachers, distance from
school, unable to learn
above 6thgrade
284
Page 7 of 7

SNNPR Livelihood Zone Reports
Wenago Woreda
Gedeo Administrative Zone
Sidama Maize Belt
Livelihood Zone
Much of the population
in this food insecure
zone obtain less than
half their food needs
from their own
production. The main
crop is maize, planted in
the spring or belg rainy
season, with shorter-
cycle crops such as
sweet potatoes grown in
the summer. Enset is a
backstop but is not as
important as elsewhere.
Cattle and goats are
important assets of the
better-off and cash is
also obtained from the
sale of coffee, chat and
chilli peppers. There is
good market access to
local towns and Awassa.
Sidama-Gedeo Highland
Enset and Barley
Livelihood Zone
This hilly zone is known for its
high quality enset production.
Rainfall is reliable, and the area
is food secure not only
because of its perennial stock
of enset in the field, but
because of reasonable
livestock numbers - even the
poor are able to make 40% of
their cash income from
livestock and butter sales.
Vegetables are the main cash
crop. Poor households
commonly send a member out
for migrant work on the coffee
harvest in neighboring
livelihood zones.
N
W
S
Gedeo Coffee Livelihood Zone
This densely-populated zone produces coffee famous for its
high quality, and wealthier households own coffee bushes in
thousands whilst poorer households have hundreds. Prices
were at good levels in 2005 and most farmers are in unions
which increase profits by organising international marketing
themselves. The poor also gain cash by casual work in coffee
plantations and in local pulping stations. In terms of cash
income amongst all wealth groups, this is the wealthiest zone
in the Region; but cash management by farmers is often
weak, and some still struggle to buy food in the period before
the green maize harvest. Food production comes second to
coffee production for all groups; enset is the main locally-
produced staple, but the zone is a net importer of grain.
E
Contents
Map & livelihood zone description
Population by livelihood zone
Livelihood zone profiles
Key parameters for monitoring
Non-food sector summaries
285
SNNPR Livelihood Profile
Population by Livelihood Zone and Kebele (2005)
Woreda:
Zone:
Wenago
Gedeo
Woreda population
268,621
Livelihood Zone:
Sidama Maize Belt LZ
LZ Population:
Population by Kebele:
Chichu
Heroriesa
Kara Sodit
Tumata Chirecha
Walemie Sefera Ta
Livelihood Zone:
Gedeo Coffee LZ
34,658 LZ Population:
Population by Kebele:
11,176 Akoshe Hefero
8,482 Amba
7,165 Andida
6,503 Banko Akoto
1,331 Belie Bukisa
Dalechana Shigido
Dedero
Gidicho
Gola
Hesie Hero
Jemjemo
Kelecha
Michilie Shakoa
Mokonisa
Sisota
Sokicha
Sugalie
Tokicha
Tumticha
Livelihood Zone:
Sidama-Gedeo Highland Enset and
Barley LZ
163,330 LZ Population:
70,633
Population by Kebele:
8,102 Aytilie Sukie
3,632
9,777 Bantisibu
6,666
7,926 Bula
8,307
9,261 Dobota
9,376
4,932 Gelelcho
8,213
7,264 Heliemo
6,388
8,292 Michilie Girsa
3,837
1,253 Michilie Holana
7,160
9,658 Otelchona Ledie
5,313
10,141 Wetiko
11,741
9,124
10,203
7,463
14,477
9,570
7,932
12,169
4,912
10,874
Note: The 2005 woreda population is that estimated by the Central Statistical Authority. The list of
kebeles in the woreda was taken from the 1994 census and each kebele's 2005 population
calculated by multiplying the 1994 census figure by the increase in total woreda population since
1994. Information from the 1994 census was used in preference to other sources of information
since this represents the main offical source of population data for the woreda. Difficulties were
encountered due to changes in woreda and kebele boundaries since 1994. A number of woredas
have been split since 1994. For as many of these as possible, kebeles existing in 1994 were
divided between the newly formed woredas, based upon information obtained at regional and/or
woreda level. Where kebeles have been renamed or split since 1994, woreda officials were asked
to assign the old 1994 kebele to one or other livelihood zone in the woreda. It was sometimes not
possible to locate a kebele (e.g. because woreda officials did not recognize the name or did not
include the kebele in their list). In these cases a 'not assigned' category has been included in the
population analysis.
286
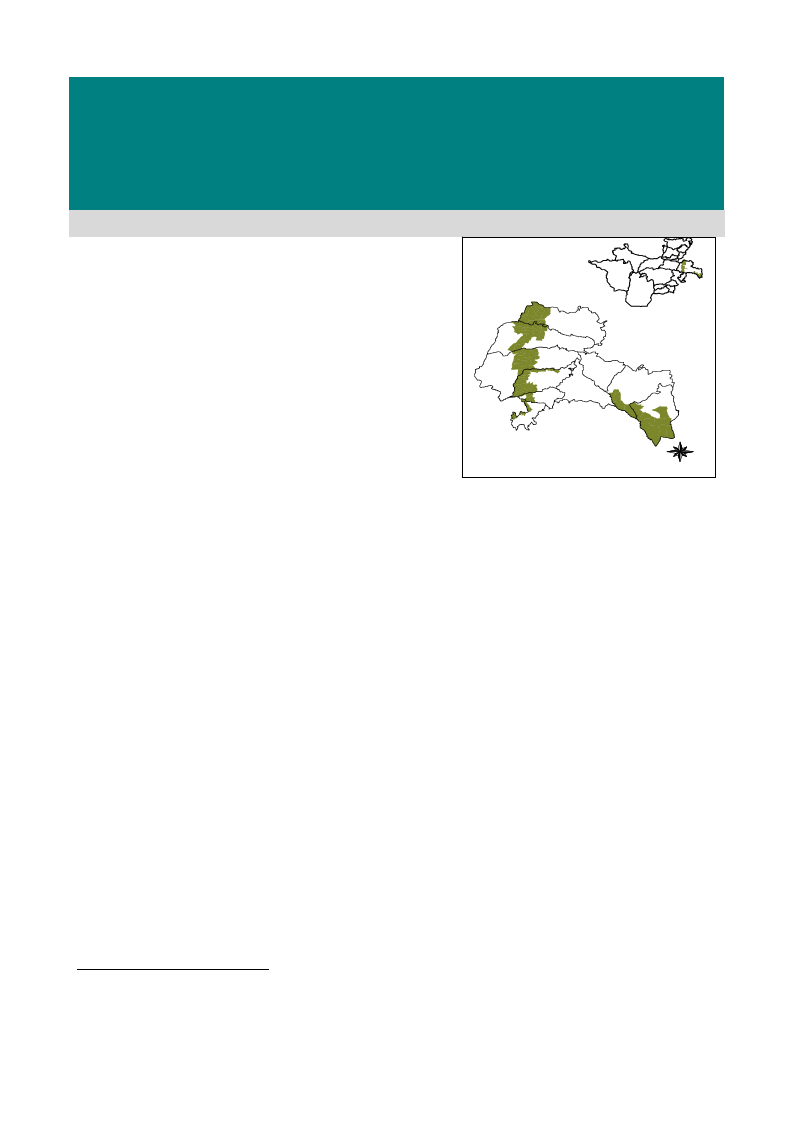
SNNPR Livelihood Profile
Sidama Maize Belt Livelihood Zone
March 20051
Zone Description
Once sparsely populated and considered to be food secure, the
Sidama Maize Belt has been facing difficulties in recent years due to
a combination of interrelated problems. These include population
growth, declining landholding sizes, deforestation, land degradation,
declining soil fertility, erratic and insufficient rainfall, and
dependency on relatively expensive agricultural inputs that require
regular and adequate rainfall for production. These problems need to
be tackled in a comprehensive manner if increased destitution and
food aid dependency are to be avoided. The livelihood zone would
benefit from long-term programs to address population growth,
deforestation and land degradation; from the provision of
appropriate, affordable and timely agricultural inputs; and from
short- inputs; and from short-term emergency relief assistance only
in years of poor crop and livestock production. Widespread dry
season water shortages in this livelihood zone also need to be
addressed.
Aw assa
Shebedino
Da le
Aleta W en do
D a ra
Arb e g o na
Hu lla
Bensa
W enago
Aro r esa
N
W
E
S
The Sidama Maize Belt covers the lowest areas of Sidama Administrative Zone, including parts of Awassa, Dale, Aleto
Wondo, Dara, Bensa and Aroresa woredas, and most of Boricha woreda. Although described by many officials as
lowland or kolla, it technically falls into the borderline area between the kolla and woina dega agro-ecological zones,
with altitudes in the range of 1400 – 1700 meters above sea level. Average annual rainfall is in the range of 700-
1200mm per year and falls during two rainy seasons, the belg and kremt rains (see seasonal calendar on next page).
The landscape varies between undulating hills and plain. As recently as one generation ago, the area was covered by
acacia forest, but these days it is increasingly bare. Very few rivers cross this livelihood zone, so the population largely
depends on man-made ponds and shallow wells for water for both humans and livestock. These tend to dry during the
period December - February, making water availability a major problem.
Farmers describe themselves as belg-dependent, since the belg rains in March – April are key for the production of
maize, the main crop, which is planted only once per year. Other food crops such as haricot beans, sweet potatoes and
teff can be planted twice per year, during each rainy season. When the belg rains are poor and maize production fails,
farmers intensify the area planted with these short-maturing crops during the subsequent meher season in order to
compensate for the lost maize. Enset is grown as a perennial food crop in most parts of the livelihood zone, but it is
less important here than in the neighboring midland and highland areas of Sidama. The main cash crops vary from one
part of the livelihood zone to another, but include coffee, chat and chilli peppers. Land preparation methods include
both hand cultivation and, for some better off households, plowing with oxen.
Livestock are important and cattle, goats and donkeys are the main livestock types reared in the Sidama Maize Belt.
Cattle and goats are often kept in the lower and more remote areas of the livelihood zone, where pasture and browse are
more readily available. Donkeys are essential for the transport of water and firewood and for trading.
Market access is relatively good in this livelihood zone, as it is bordered to the east by a major tarmac road and the
feeder roads are mostly of all-weather quality. In addition, major urban markets for crops and livestock are relatively
nearby. There is no tradition of labor migration out of this livelihood zone and poor households tend to find casual
work locally in most years. This work includes agricultural labor, enset processing, and the collection of water and
firewood for better off households. However, compared to the neighboring midland coffee livelihood zone, poor
households in the maize belt were inactive in the reference year, only working when they had to, which was primarily
when their own crops and food aid were unavailable.
1Fieldwork for the current profile was undertaken in February 2005. The information presented refers to the consumption year from
July 2003 to June 2004 (or Hamle 1995 – Sene 1996 in the Ethiopian calendar), which was a relatively average year by local
standards (i.e. a year that was neither especially good nor especially bad in terms of food security, when judged in the context of
recent years). Provided there are no fundamental and rapid shifts in the economy, the information in this profile is expected to
remain valid for approximately five years (i.e. until 2010).
Sidama Maize Belt Livelihood Zone
287
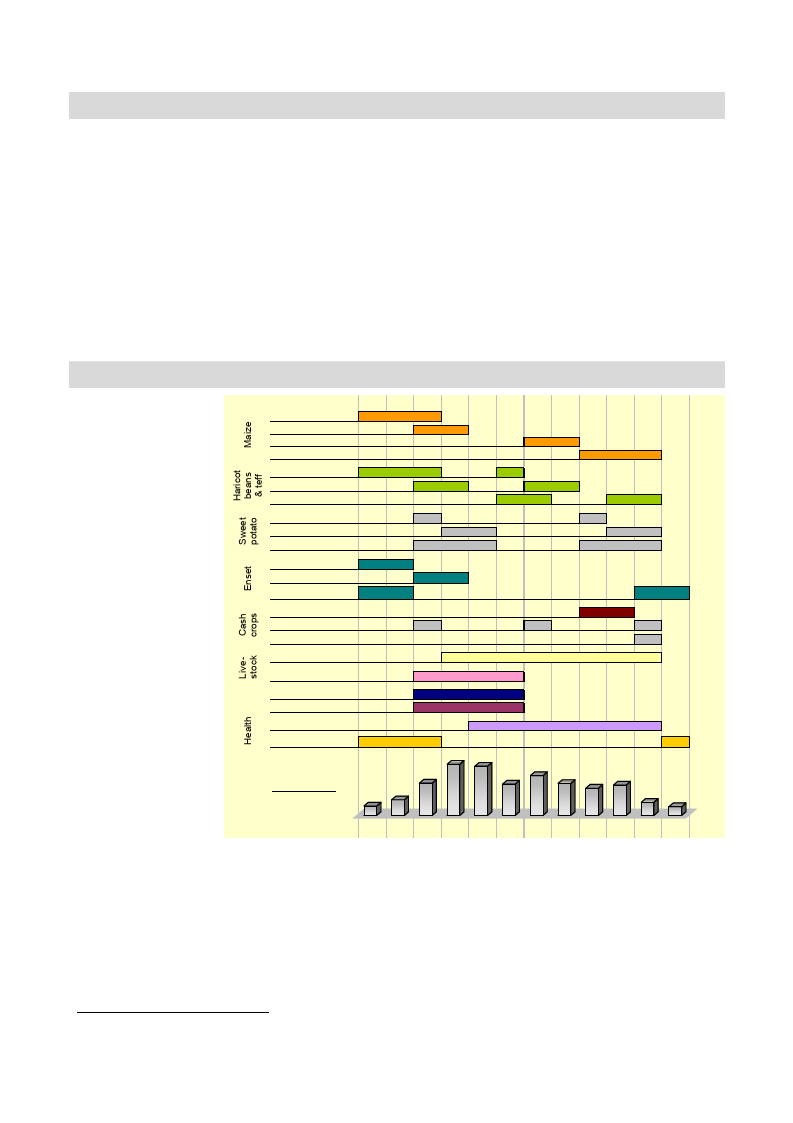
2
Markets
Market access in the Sidama Maize Belt is generally good due to the proximity of a tarmac road, all-weather feeder
roads and nearby major urban centres. There are numerous local markets spread throughout the zone.
In years of average or good production, maize is exported from the livelihood zone through local traders to nearby
towns and livelihood zones and to Awassa. Coffee is sold ‘wet’ to cooperatives and private pulpers or ‘dry’ to private
traders. Its ultimate destination, after processing, is the central coffee market in Addis Ababa. Chat is purchased by
traders and taken in the direction of either Moyale/Borana or Awassa/Addis Ababa. Chilli peppers are grown in the
maize belt areas of northern Boricha and Awassa woredas. The main markets for peppers are Awassa and other major
towns, including Addis Ababa.
The markets for livestock from this livelihood zone include the woreda towns and the nearby regional urban centres of
Awassa and Dilla. Livestock products like milk, butter and eggs are mostly sold in local markets for local
consumption.
Staple food is imported into the livelihood zone in bad years, when traders bring maize from the major maize producing
areas of Alaba, Shoa, and Oromiya via Shashamene, Awassa and the main woreda towns. Maize prices generally
fluctuate from about ETB 80-100 per quintal during normal years to about ETB 150 in bad years.
Seasonal Calendar
The two rainy seasons
are the belg rains, which
fall from late February –
May, and the kremt
rains, which fall from
late June to early
October. Most land
preparation work occurs
in the months before the
start of the belg rains
and most crops are
planted with the start of
the rains2. Maize and
haricot beans are
generally intercropped.
Although enset planting
and harvesting periods
are marked in diagram
below, enset takes 4-6
years to mature. While
it is often eaten before
full maturity, it is not
possible to plant an enset
stem and eat from it
within the same
agricultural year. This is
also true for coffee,
which is planted in the
belg season, but takes 3-
4 years to reach maturity
Land preparation
Planting
Green harvest
Dry harvest
Land preparation
Planting
Harvest
Land preparation
Planting
Harvest
Land preparation
Planting
Harvest (main period)
Coffee harvest
Chat harvest
Pepper harvest
Milk production
Livestock sales
Hunger season peak
Peak staple prices
Malaria
Diarrhoeal diseases
Jan Feb Mar Apr May Jun Jul Aug Sep Oct Nov Dec
Rainfall Pattern
Jan Feb Mar Apr May Jun Jul Aug Sep Oct Nov Dec
Source of rainfall data: National Meteorological Service Agency (NMSA) Data Archives (long-term average).
and can then yield berries for decades.
The hunger season and staple food prices peak in the months running up to the start of the green maize harvest. This is
also the main period for livestock sales, since households need cash during these months to purchase food.
Malaria occurs throughout the year, but is worst from May to November. Due to the shortage of water in this
livelihood zone during the dry season, diarrhoeal diseases are most common from December – March.
2 Maize is planted slightly later in Awassa woreda and the northern part of Boricha woreda (April) than in other parts of the Sidama
Maize Belt (March). Harvests are also slightly later in these woredas.
Sidama Maize Belt Livelihood Zone
288
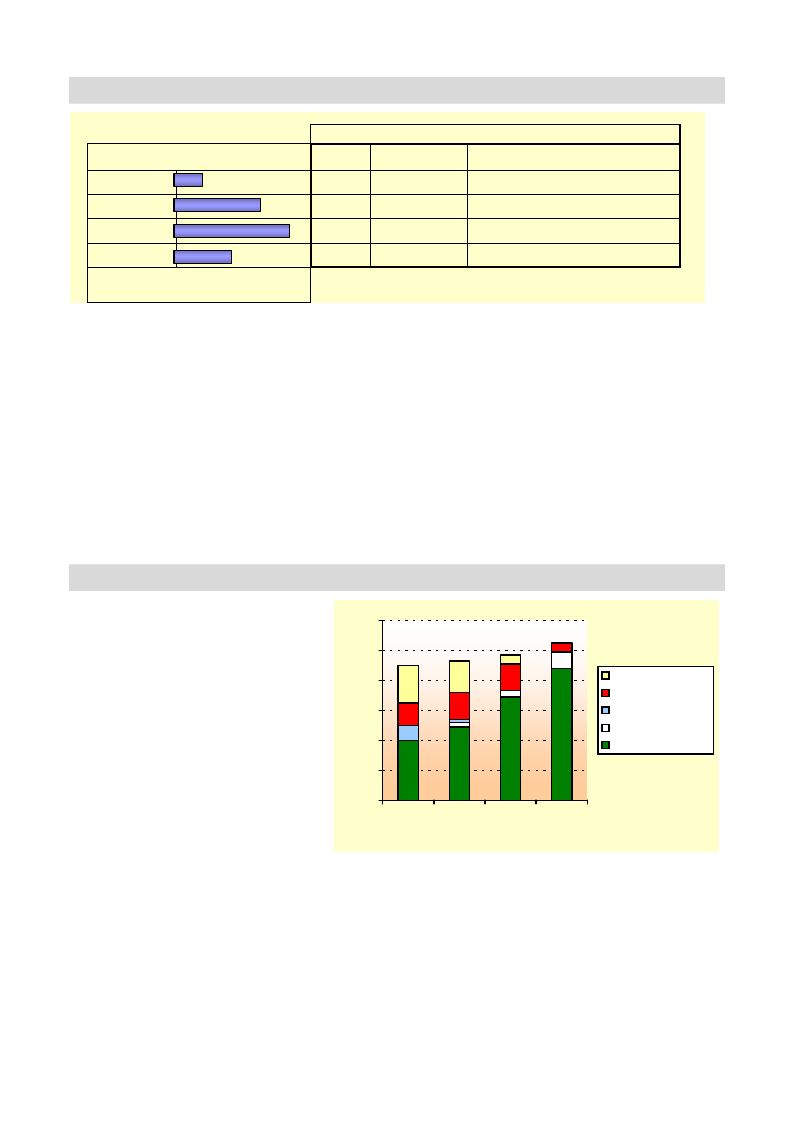
3
Wealth Breakdown
Very poor
Poor
M iddle
Better-off
0%
W ealth G ro up Info rm atio n
HH size
(per wife)
Land area owned
Livestock
5-7
0.25 ha
0 cattle, 0-2 shoats, 0 donkey
5-7
0.25 - 0.5 ha
1-2 cattle, '2-6 shoats, 0-1 donkey
6-8
0.75 - 1.25 ha
3-9 cattle, 2-7 shoats, 1 donkey
8-12
1.5 - 2+ ha
10-20+ cattle, 5-15 shoats, 1-2 donkeys
20%
40%
% of population
Wealth in the Sidama Maize Belt is determined primarily by the number of cattle owned and the land area owned (and
cultivated). Other characteristics (such as the number of goats, sheep or donkeys owned or the type of housing
inhabited) tend to result from these more basic characteristics. There is little difference between land areas owned and
cultivated in this livelihood zone since it is uncommon for households to rent or sharecrop land.
Very poor and poor households own and cultivate limited land areas and have limited access to improved seeds and
fertilizer. The main distinguishing feature between very poor and poor households is ownership of cattle and other
livestock, with very poor households rarely owning any livestock at all.
Better off households tend to be larger than other types of household for two reasons. First, they can support more
people and therefore tend to attract relatives from poorer households. It is quite common for very poor or poor
households to send a child to live with, and work for, their better off relatives. In this way, better off households are
able to send their own children to school and still have enough labor around the house for cultivation, enset processing
(which is very labor intensive), and fetching firewood and water. Second, better off households tend to be more
‘mature’, which means that the household head tends to be older, has had more time to accumulate large numbers of
children and may be polygamous. Very poor and poor households, in contrast, are often younger families that started
off with small landholdings when their parents’ land was subdivided.
Sources of Food – An average year (2003-04)
The graph presents the sources of food for
households in the Sidama Maize Belt for the
period July 2003 – June 2004. Food is
presented as a percentage of 2100
kilocalories per person per day for the 12-
month period starting with the 2003 green
harvest. In most areas of the livelihood
zone, this was a fairly average year.
120%
100%
80%
60%
The contribution of own crop production
increased with wealth. Very poor
households obtained 35-45% of their food
needs from their own production, whereas
better off households obtained 85-95% in
the reference year. The contribution of
livestock products (primarily milk) also
increased with wealth.
40%
20%
0%
Very
Poor
Poor Middle Better
off
relief food
purchase
payment in kind
livestock products
own crops
In contrast, the contribution of relief food
decreased with wealth, which suggests that
targeting is working to a certain extent.
Food access is expressed as a percentage of minimum food requirements, taken
as an average food energy intake of 2100 kcals per person per day.
What was surprising, however, was the large amount of relief food that was distributed in the reference year, which was
not a particularly bad year. The main explanation for this was that the previous year (2002-03) was a very bad year and
some of the relief was distributed with the aim of ‘recovery’.
Households made up any gap in food through a combination of purchase and labor exchange (which means working
directly for food). Maize was the cheapest source of purchased calories and made up the bulk of purchases for very
poor and poor households, supplemented by small quantities of kocho (processed enset) and haricot beans. Labor
exchange was more common for very poor than for poor households and generally took the form of meals paid to
Sidama Maize Belt Livelihood Zone
289
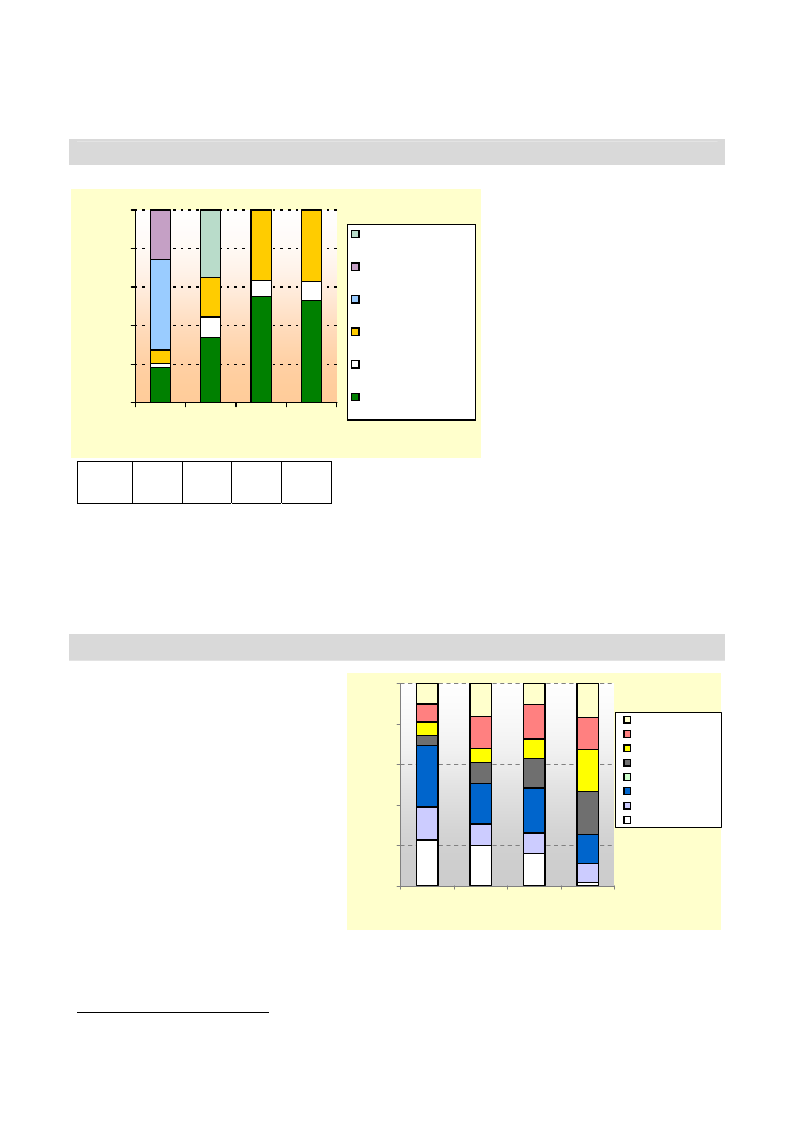
4
laborers on the days that they worked for the better off. Indeed, for many very poor households, the meals were as
important as the cash payment at the end of the working day.
Very poor and poor households are unable to fully cover 100% of their minimum food energy needs in most years.
Sources of Cash – An average year (2003-04)
The graph provides a breakdown of annual cash income according to income source. The graph presents the sources of cash
income for households in different
100%
wealth groups in the Sidama Maize Belt
for the period July 2003 – June 2004.
80%
other
Very poor households earned roughly
self-employment
ETB 800-900 in the reference year,
compared to ETB 3500-4800 for better
60%
off households.3 In general, the
casual employment contribution of income from crops and
40%
livestock sales
livestock increased with wealth.
Although middle and better off
20%
0%
Very
Poor
Poor Middle Better
off
livestock product
sales
crop sales
households had a very similar pattern of
income sources, their actual income
levels varied quite significantly, with
middle households earning less than half
that of better off households.
Very poor households obtained the bulk
of their cash income from casual labor
Annual
income
(ETB)
700-
1000
1000-
1500
1500-
2500
3500-
4500
and firewood sales (‘self-employment’
in the graphic). Casual labor was
obtained locally from better off
households and included agricultural labor, enset processing, and firewood and water collection. Firewood sales were a
separate income source, with the firewood often obtained from distant locations and transported manually or on a
borrowed or rented donkey. Poor households also obtained income from these sources, but the actual source (casual
labor versus firewood) varied from one household to the next and has been categorised under ‘other’ in the graphic
above.
Some households in each wealth group engage in trading activities (larger or smaller scale depending on the wealth
group). However, in no wealth group was this a common enough activity to include in the general pattern of cash
income sources for the reference year.
Expenditure Patterns – An average year (2003-04)
The graph presents the expenditure patterns
of households in the Sidama Maize Belt for
the period July 2003 – June 2004. The most
obvious difference between the wealth
groups is the percentage of expenditure on
staple food.
100%
80%
The category ‘household items’ includes
60%
salt, soap, grinding and kerosene. ‘Other’
includes tax, social obligations, ceremonies,
40%
investment in livestock and savings.
Expenditure on most items increases with
wealth.
20%
other
clothes
social serv.
inputs
water
HH items
non-staple food
staple food
The category ‘social services’ includes
spending on education and health. Better
0%
off households spend a large proportion of
their income on schooling, and are the only
wealth group that can afford to send
V.Poor Poor Middle Better
off
children to schools outside the livelihood zone. Although primary schools are reasonably accessible within the
livelihood zone, high schools are only available in the main woreda towns and this requires spending on
accommodation and food in addition to the expected fees and stationery. Most households cannot afford this. Indeed,
even primary schooling is beyond the means of most very poor households, who tend to only send one or two of their
3 In US dollars, poor households had an annual income of roughly $100, whereas better off households had an annual income of
roughly $500. The exchange rate was about US1 = ETB 8.65 in February 2005.
Sidama Maize Belt Livelihood Zone
290
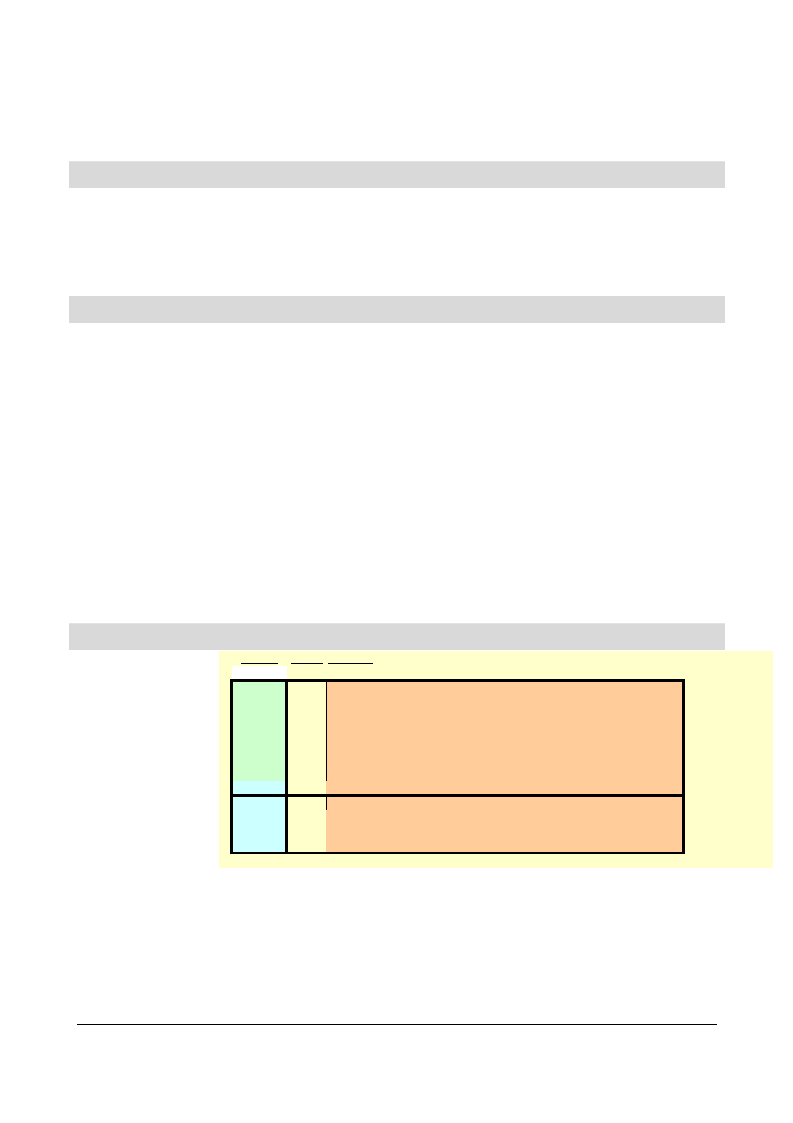
5
children to school.
Expenditure on agricultural inputs varies significantly by wealth group. Better off households can afford improved
seeds, fertilizer (DAP and urea), and livestock drugs. They may cultivate using plow oxen and can afford to employ
labor during the peak agricultural seasons. Very poor and poor households, in contrast, mainly use inferior seeds4 and
cannot afford adequate quantities of fertilizer.
Hazards
The main hazard that affects the zone is drought, which results in crop failure and increased staple food prices.
Drought used to be an irregular occurrence in this livelihood zone, but has recently become quite common, occurring
every other year since 2000. Livestock diseases are a chronic hazard, with trypanosomiasis leading the complaints of
farmers in all areas of the livelihood zone except Boricha and Awassa woredas. Malaria during the rainy season and
water shortages during the dry season are another two chronic complaints that affect health and labor availability at
household level.
Response Strategies
When faced with reduced crop production as a result of drought, households in this zone have a number of response
strategies. These strategies vary from potentially destructive strategies, such as the unsustainable sale of livestock, to
more neutral strategies such as the intensified cultivation of teff and haricot beans during the meher season.
One strategy that is commonly employed in bad years is to reduce non-essential expenditure. Households reported
reducing expenditure on clothes, grinding, kerosene and other non-staple items in bad years.
All wealth groups attempt to expand their food and income sources that are less directly affected by the hazard in bad
years. For example, livestock sales expand in bad years. Obviously, wealthier households are in a better position to
exploit this strategy since they own more livestock.
Migration of individual household members in search of employment outside the livelihood zone is a strategy for
poorer households in bad years. Women tend to migrate with their children to the main enset-producing areas and work
in return for meals. The success of this strategy partly depends on the extent to which neighboring zones are also
affected by the hazard (or a different hazard) in a particular year. For very poor and poor households that don’t migrate
to other livelihood zones, intensified firewood sales is the main response strategy.
Relief food has been used as a response strategy by outside organizations. However, this strategy, if used excessively,
may have potentially negative effects in terms of destroying the community’s own efforts to respond to crises.
Furthermore, this type of response does not offer solutions to the real problems of the zone, which require longer-term
strategies.
Indicators of Imminent Crisis
The main early warning
indicators include a
delayed start to the rainy
season or long periods
without rain at critical
stages during the rainy
season. If these are
followed by some of the
indicators mentioned in
the dry season section,
then serious
consequences can be
expected at household
level.
Season Month Indicator
Belg
season
Meher
season
Dry
season
Mar
Apr
May
Jun
Jul
Aug
Sep
Oct
Nov
Dec
Jan
Feb
Delayed start of rainy season
Long periods without rain at critical stages in rainy season -->
Delayed start of green maize harvest
High staple food prices during and after harvest -->
High staple food prices during and after harvest
Increased livestock sales and low livestock prices after harvest
Migration of women to main enset-producing areas to work
In terms of longer-term indicators, villagers expect the main belg season to be good or bad depending on when the
previous kremt rains ended. If the rains ended in October, then people expect the next belg to be good. If they ended in
November-December, then they expect the next belg to be poor.
Sidama Maize Belt Livelihood Zone
291
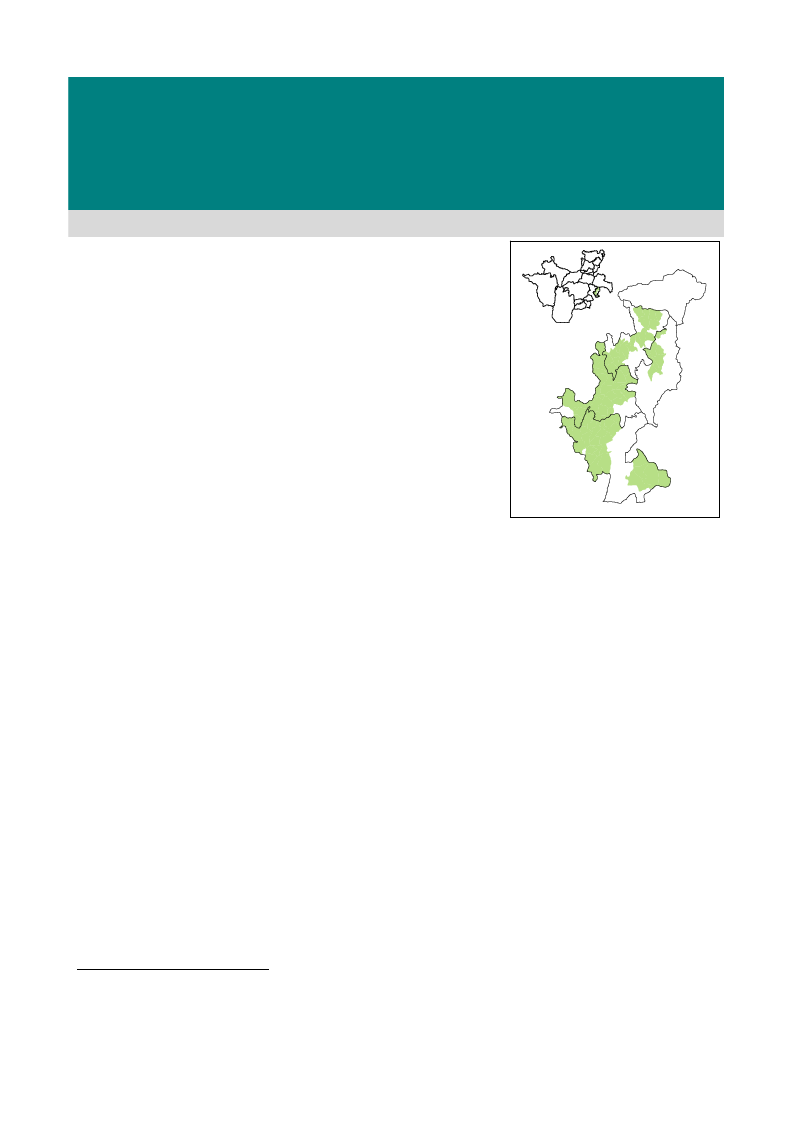
SNNPR Livelihood Profile
Gedeo Coffee Livelihood Zone
June 20051
Zone Description
The Gedeo Coffee Livelihood Zone is a food secure area of SNNPR that
produces some of the highest quality organic coffee in Ethiopia and is also
productive in terms of enset. Households are relatively wealthy, with poor
households in this zone earning more cash than better off households in some
other areas of SNNPR. The coffee livelihood zone has experienced few
hazards in recent years, with the exception of the extreme slump in
international coffee prices in 2002-03, which caused hardship for households
here and affected the entire economy of the region. Fortunately, prices have
now returned to more favourable levels, but some problems continue to
threaten livelihoods in the long term: high population density and population
growth, landholding fragmentation from one generation to the next, declining
pasture and livestock holdings, and endemic coffee plant diseases.
Dara
Oromiya Region
Wenago
Bule
Yirga Chefe
The Gedeo Coffee Livelihood zone is densely populated2 and covers the
midland (woina dega) agro-ecological areas of Gedeo Administrative Zone,
Kochere
Oromiya Region
including parts of Wenago, Yirgachefe, and Kochere woredas. The area is
hilly and quite well wooded, with coffee typically grown under indigenous
shade trees. It provides a good example of agro-forestry since it is a
productive area where agriculture has not resulted in the destruction of the
forest. There is no exploitation of the forest for timber or for firewood and there is no culture of cutting down trees.
Substantial income from coffee means that households do not need to sell firewood and the importance of shade for
coffee production means that shade trees are preserved. Firewood for Dilla town comes from near Lake Abaya and
timber from Sidama Administrative Zone.
Rainfall in this livelihood zone is bi-modal, falling during the belg and kremt rainy seasons, and is relatively plentiful
and reliable compared to many other parts of the region. There are numerous permanent springs and streams, draining
into the Legedara River, which forms the border between Gedeo and Sidama Administrative Zones and runs into Lake
Abaya.
Both food and cash crops are grown. Roughly three-quarters of cultivated land is used for cash crops, of which by far
the most important is coffee. Other less important cash crops grown in certain parts of the zone are mango, avocado,
bananas, sugar cane and chat. Enset is the main food crop, harvested throughout the year. Maize is a secondary food
crop, all of which is consumed green in July/August (at lower altitudes) and August/September (at higher altitudes).
Small quantities of sweet potatoes and yams are also grown, mainly in the meher season.
Much of the maize, wheat, barley, pulses and teff consumed in rural areas are imported into the zone. Maize, wheat,
barley and pulses come from the neighboring highland enset and barley livelihood zone. Teff comes from that part of
Oromiya bordering the west of the livelihood zone.
Fertilizer is not used in the livelihood zone. Instead people use vegetable compost, made from plant residues and waste
coffee pulp. Pesticides are also not used. Coffee berry disease is prevented by using wood ash around the coffee
bushes and by smoking the bushes.
Coffee production is labor intensive, mainly during harvesting and processing, and provides an important source of
casual labor income for poor households in the livelihood zone. There is also some seasonal migration into the
livelihood zone from Sidama for the coffee harvest. There is no migration out of the livelihood zone.
Small numbers of livestock are kept, mainly cattle and sheep. Livestock holdings are constrained by the general lack of
grazing land. Cattle are kept for milk. Fattening of oxen is common, for sale throughout the year, and especially at the
major festivals of New Year and Christmas. Consumption of meat is relatively high in the livelihood zone, and animals
1Fieldwork for the current profile was undertaken in May-June 2005. The information presented refers to August 2003-July 2004
(EC Nehase 1995 to Hamle 1996), a relatively average year by local standards (i.e. a year of average production and rural food
security, when judged in the context of recent years). Provided there are no fundamental and rapid shifts in the economy, the
information in this profile is expected to remain valid for approximately five years (i.e. until 2010).
2 Population density is 600-900 people per square kilometer.
292
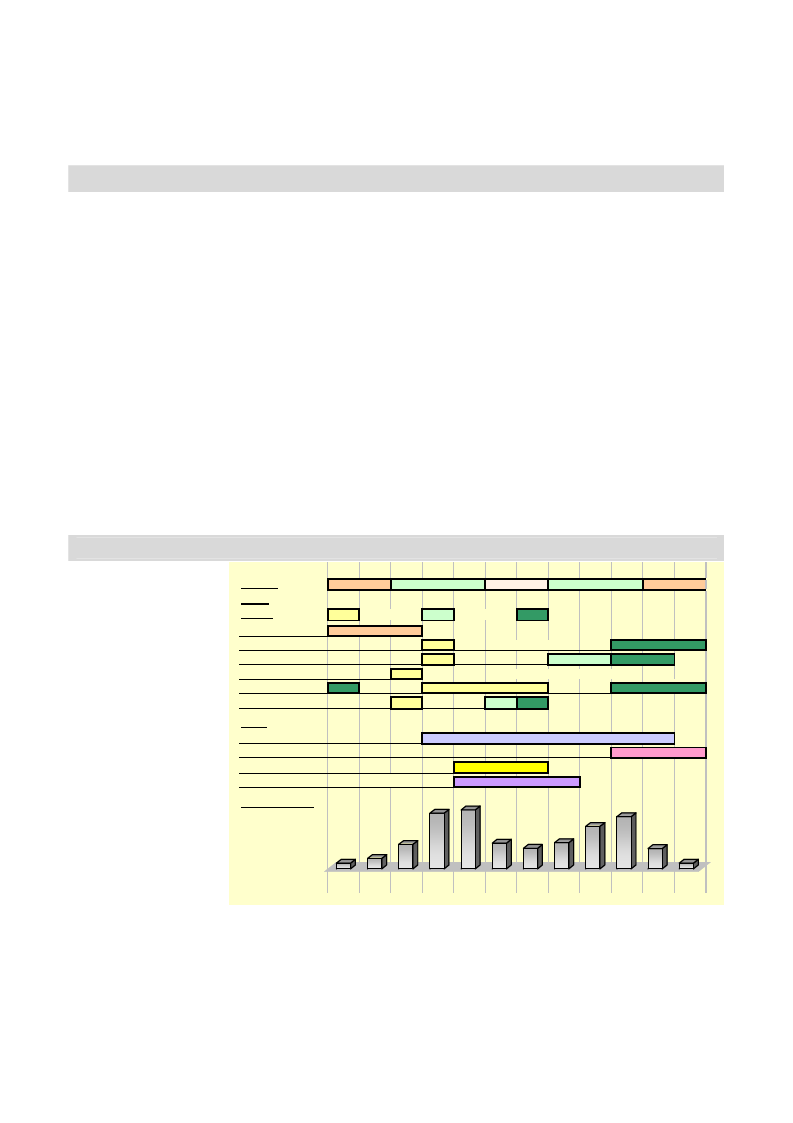
2
are imported into the livelihood zone for local consumption. There are no plow oxen in this zone, as the presence of
perennial crops and the small size of plots used for food crops do not suit ox plowing.
The livelihood zone has good market access. The main Addis-Moyale asphalt road crosses the zone, and there are
feeder roads to most of the kebeles or peasant associations (PAs). Although accessible throughout the year, the feeder
roads are in poor condition.
Markets
Farmers sell their coffee in two forms: wet red cherries and dry cherries. Wet coffee is sold during the harvest season
(September to December) to cooperatives or to private investors who own pulping stations. The coffee is processed
locally at the pulping stations, which involves pulping, fermenting, washing, drying and sorting. The remaining coffee
is dried by farmers and sold from January onwards, also to cooperatives and private traders. Although wet coffee
generally brings in more money, dry coffee acts as a saving mechanism for farmers because it can be sold at any time.
The coffee prices received by farmers within the livelihood zone are determined by the world market for coffee and
have little to do with local production conditions each year. However, most farmers in Gedeo belong to coffee unions,
established within the last 2-3 years, which organise the international marketing of coffee. This cuts out the middleman
in the central market in Addis Ababa, increasing the price paid directly to farmers. Farmers also share in the union
profits, which is an added benefit.
Although many crops are grown in the zone, most crops apart from enset are not grown in sufficient quantities to
satisfy local demand. Maize, wheat, barley and pulses are imported from the neighboring highland areas of Gedeo,
while teff comes from neighboring areas of Oromiya.
Markets are held in the woreda towns and the larger peasant associations once or twice a week, usually in the
afternoons and evenings. These are major events in the local calendar and many people are involved in the trade of
food and non-food items (often on a very small scale) and of livestock. The livelihood zone generally has good market
access, with a major tarmac road passing through the zone and all-weather roads feeding into it.
The main destination markets for livestock are local, due to the relatively high level of meat consumption in this
livelihood zone. The peak periods for the sale of livestock are the annual hunger period (May to July), when
households need cash, and the main religious holidays (Meskel and Christmas), when demand is high.
Seasonal Calendar
The two rainy seasons are
the belg rains, which fall
from March to May, and
the kremt rains, which fall
from July to October.
Some rainfall also occurs
in June, but this is known
as a hot and sunny month.
Most land preparation
work occurs in the months
before the start of the belg
rains and most crops are
planted with the start of
the rains. Annual food
crops are generally
intercropped amongst the
perennial coffee and enset
plants.
Seasons
Crops
Legend
Land Preparation
Coffee
Maize
Enset
Sweet potato
Haricot beans
Other
Milk production
Local labor (peak)
Hunger Season
Malaria season
Rainfall Pattern
Jan Feb Mar Apr May Jun Jul Aug Sep Oct Nov Dec
Dry
Belg
Meher
Dry
planting
cons. green
harvest
--> after 3-4 years -->
--> harvest any time after 4-6 years
The main coffee
harvesting period is
October to December, but
Jan Feb Mar Apr May Jun Jul Aug Sep Oct Nov Dec
there are some variations
from one area to the next
Source of rainfall data: National Meteorological Service Agency (NMSA) Data Archives (long-term average).
depending on altitude. Lower areas tend to harvest early, starting in September, while higher areas can harvest as late
as January.
The hunger season and staple food prices peak in May to July, the months running up to the start of the green maize
harvest. The main period for food purchases is variable, depending on how individual households manage their money.
Some households buy a large stock of food when they sell their coffee and have lots of money; others wait and
purchase food throughout the year (which causes problems if they have poor budgeting skills).
Gedeo Coffee Livelihood Zone
293
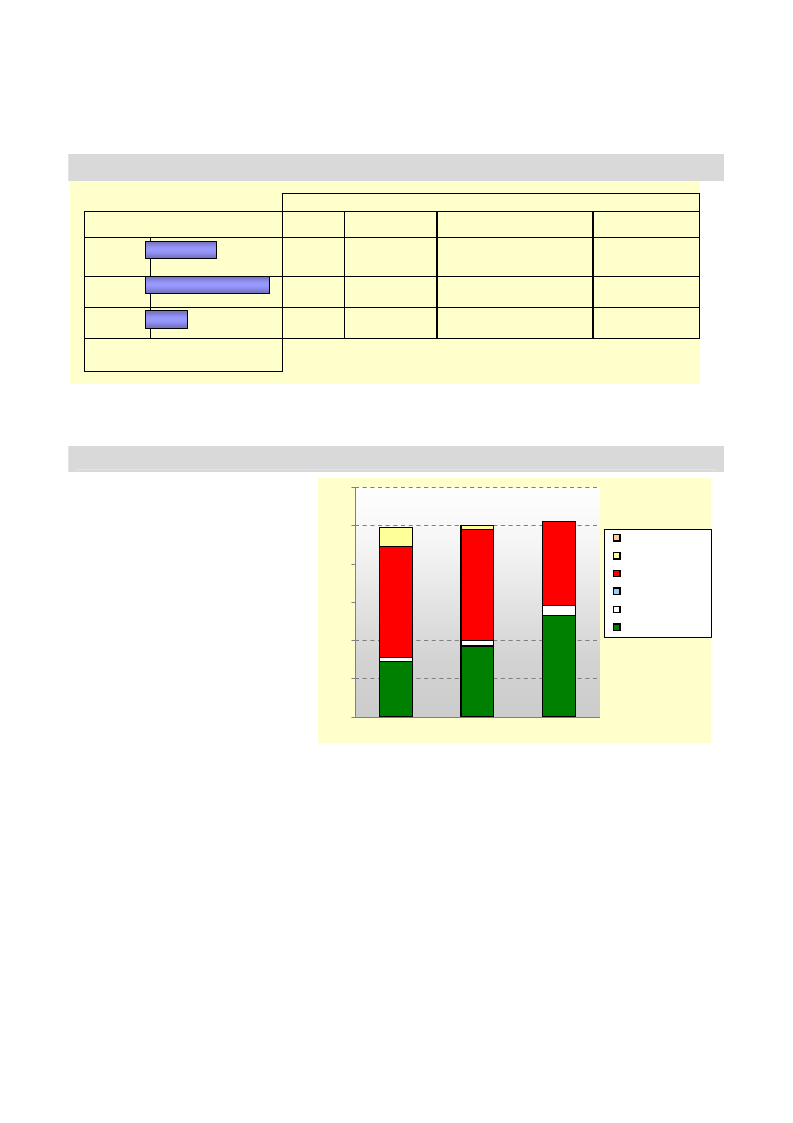
3
Livestock sales are similarly variable: some animals are sold during the hunger season when cash is required to
purchase food, while others are sold when demand and prices are high during the main holiday periods.
Although much less prevalent than in neighboring lowland areas, malaria occurs throughout the year, but is worst from
May to August. Other diseases tend not to show a distinct seasonal pattern.
Wealth Breakdown
Poor
Middle
Better-off
0%
2%0%of populatio4n0%
HH size
Wealth Group Information
Land area cultivated
Perennial crops
Livestock
6-8
7-9
9-11
60%
0.375 - 0.5 ha
0.75 - 1.5 ha
1.5 - 2.5 ha
200 - 700 coffee bushes; 50-200
enset stems
0-2 cows; 0-3 sheep; 1-
7 hens
900 - 2300 coffee bushes; 200-600 1-3 cows; 2-4 sheep; 4-
enset stems
6 hens
1800 - 3600 coffee bushes; 500- 2-6 cows; 3-6 sheep; 0-
1500 enset stems
4 goats; 4-8 hens
Wealth in the Gedeo Coffee Livelihood Zone is determined primarily by the area of land and the number of cattle that a
household owns. Other characteristics (such as the number of sheep owned or the type of housing inhabited) tend to
result from these more basic characteristics. Households that own relatively large areas of land also tend to have large
areas planted with mature coffee and enset.
Sources of Food – An average year (2003-04)
The graph presents the sources of food
for households in the Sidama Coffee
120%
Livelihood Zone for the period August
2003 – July 2004. August represents the 100%
start of the consumption year because
gifts/other
this is when the green maize harvests
80%
starts in earnest, marking the end of the
food aid
purchase
annual hunger season.
60%
The contribution of own crop production
payment in kind
livestock prod.
generally increases with wealth.
crops
However, it is worth noting that crop
40%
production is not the main priority in this
livelihood zone – households concentrate 20%
their efforts on coffee production,
knowing that they can then use the cash
they earn to purchase food. The main
0%
foods purchased are kocho (a preparation
Poor
Middle
Better off
of enset), maize, pulses, teff, meat and
vegetable oil.
Food access is expressed as a percentage of minimum food requirements, taken as
an average food energy intake of 2100 kcals per person per day.
The contribution of own livestock production (milk and meat) is small, but increases with wealth because richer
households typically have a larger number of milking animals.
Given the relative wealth of this livelihood zone, one might question why food aid was distributed in roughly half of
kebeles during the reference year, but there are a couple of possible explanations. The food aid could have been
planned during the previous year, when coffee prices were very low. Or it could be an attempt to offset the poor cash
management for which farmers in this area are well known, enabling poor households to make it through the year.
Savings schemes might be more effective and sustainable in this regard.
Gedeo Coffee Livelihood Zone
294
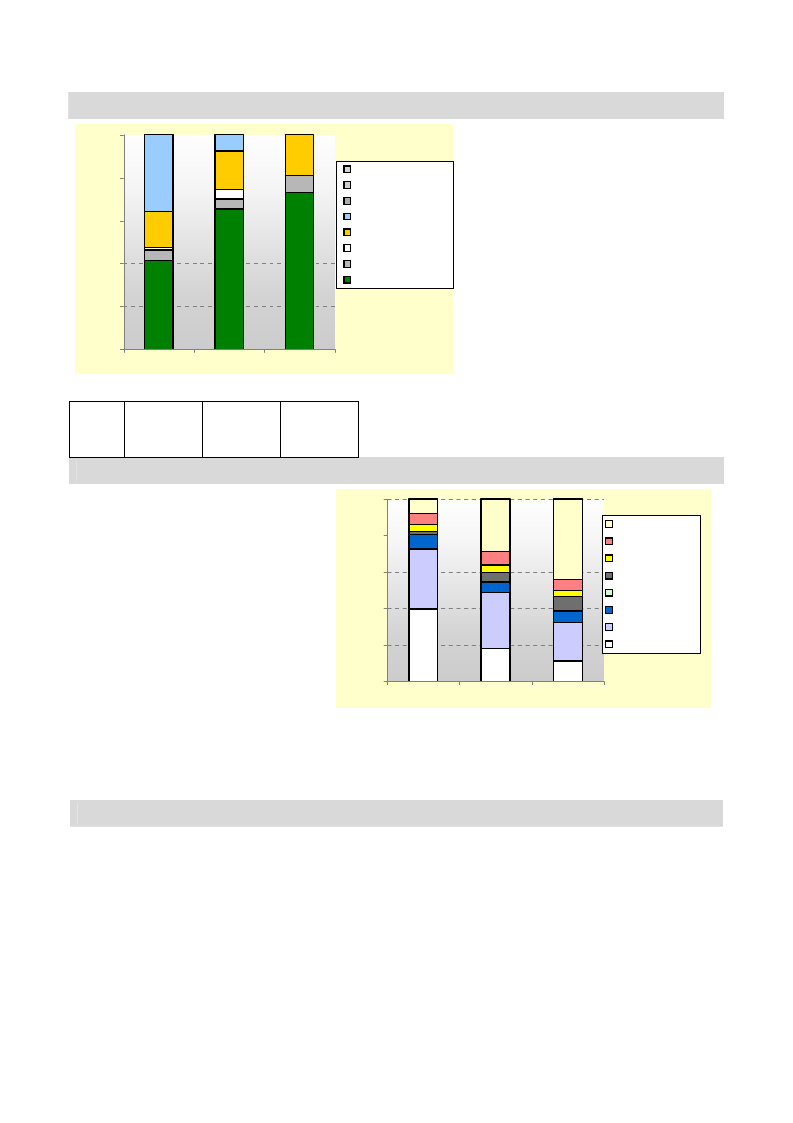
4
Sources of Cash – An average year (2003-04)
100%
80%
60%
40%
20%
other
petty trade
self-employment
employment
livestock sales
l/stock prod. sales
other crop sales
coffee sales
0%
Poor
Middle
Better off
The graph provides a breakdown of total cash income according to income
source.
Annual
income
(ETB)
2,500-
3,500
5.000-
7,000
8,000-
10,000
The graph presents the sources of cash
income for households in different wealth
groups for the period August 2003 – July
2004. The contribution of income from crops
and livestock increased with wealth. These
were the main income sources for all three
wealth groups.
Poor and middle households supplemented
their income from own production with local
casual work in the coffee fields of the better
off and in pulping stations. Casual work is
readily available in this livelihood zone, both
for local workers and for migrants from
neighboring areas.
Better off households earned almost three
times that of poor households in the reference
year. However, it should be noted that
income levels are generally very high in this
livelihood zone, with poor households
earning more than better off households in
many other livelihood zones of SNNPR.
Expenditure Patterns – An average year (2003-04)
The graph presents expenditure patterns for
the period August 2003 – July 2004.
Expenditure on staple food declined as a
proportion of income as wealth increases,
although the birr amounts that each group
spent on staple food in the reference year
were very similar.
All wealth groups in this livelihood zone
purchase meat regularly, again emphasizing
the relative wealth of the zone compared to
other areas in SNNPR.
100%
80%
60%
40%
20%
other
clothes
social serv.
inputs
water
HH items
non-staple food
staple food
The category ‘household items’ includes
salt, soap and kerosene. ‘Other’ includes
tax, social obligations, ceremonies and
0%
Poor
Middle Better off
savings. The category ‘social services’
includes spending on education and health.
The graph provides a breakdown of total cash expenditure according to category
of expenditure.
Expenditure on most items (except staple food) increased with wealth.
Expenditure on agricultural inputs varied significantly by wealth group. Better off households spent a considerable
amount of money employing local and migrant labor, especially for the coffee harvest period.
Hazards
This is a relatively food secure livelihood zone, which has experienced few serious hazards in the past. Rainfall is
generally plentiful and reliable. However, the following hazards are worth noting:
Hail and frost: These are possible hazards in April and May and can have a devastating effect on coffee production,
usually in localised areas.
Crop diseases: The main complaints for farmers are coffee berry disease and coffee wilt disease (or tracheomycosis).
The former reduces coffee production and, with the current emphasis on organic production, the only solution is to use
wood ash and smoke. In the case of the latter, the only solution is to uproot and burn the coffee tree and then replant,
with obvious consequences in terms of lost production.
Fluctuating international coffee prices: Coffee prices are determined on the international market and there is little
that farmers can do to protect themselves from this. Recent efforts to establish coffee unions, however, do mean that
farmers receive a larger proportion of the international price directly.
Gedeo Coffee Livelihood Zone
295
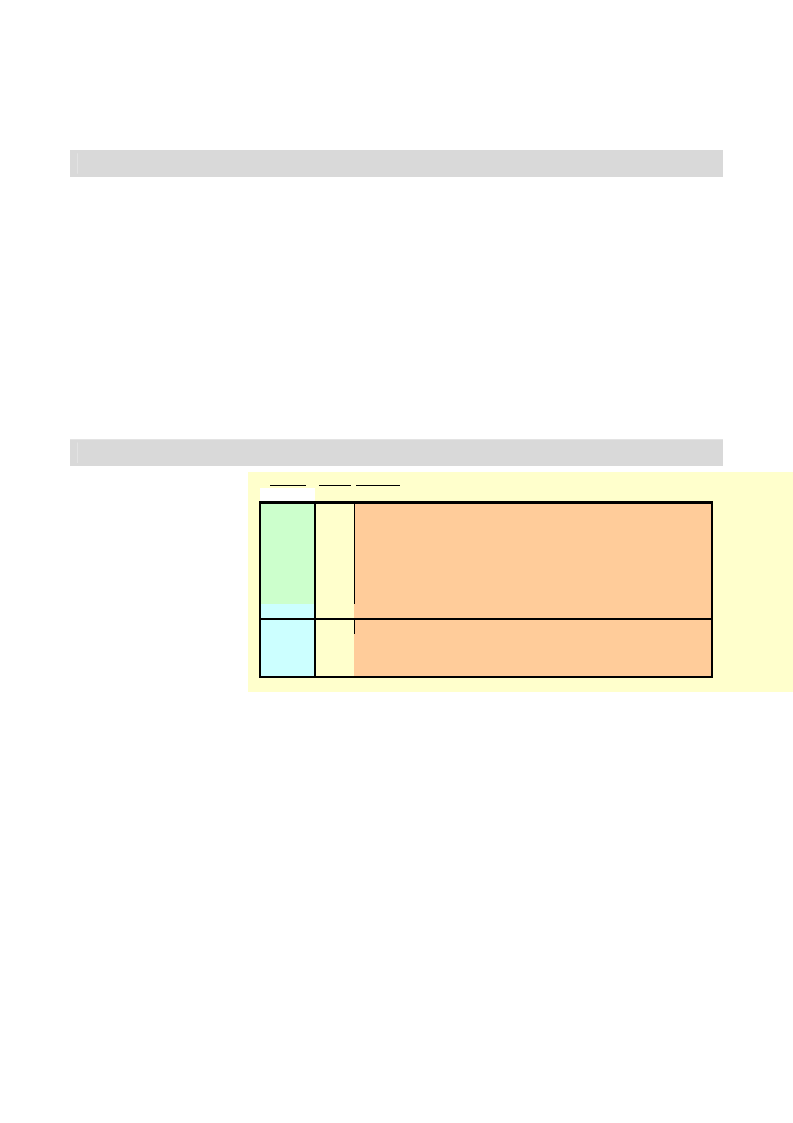
5
Increased staple food prices: Most households in this livelihood zone depend on the market for food purchases,
making them vulnerable to increased staple food prices. Since most staple food is imported into the livelihood zone,
the most common scenario is for prices to increase when there is crop failure in the areas that supply the coffee
livelihood zone.
Response Strategies
Households in this livelihood zone have a number of strategies to respond to hazards. These vary from potentially
destructive strategies, such as the unsustainable sale of livestock, to more neutral strategies, such as the reduction of
non-essential expenditure. The latter is a commonly employed strategy in difficult times. Households reported
reducing expenditure on clothes, kerosene, meat, ceremonies and other non-staple items.
All wealth groups attempt to expand their food and income sources that are less directly affected by the hazard. For
example, livestock sales expand in bad years. Obviously, wealthier households are in a better position to exploit this
strategy since they own more livestock, but even for them this strategy has strict limits if the sale of productive animals
is to be avoided.
Poor households seek out more local casual work in bad years. Daily wages are often lower in bad years, so this
means that able-bodied household members have to intensify the number of days per week that they work.
The increased consumption of enset is a bad year strategy for all households, but there are strict limits to this if
households are to avoid depleting their reserves and reducing future production.
Because of the high income levels in this livelihood zone, better off households may also have cash savings to help
them to manage in bad years.
Indicators of Imminent Crisis
Although rainfall is reliable in
this livelihood zone, its delay
would indicate an impending
problem, as would long
periods without rain at critical
stages in the agricultural
calendar. Frost or hail can
reduce coffee production.
Other indicators of future
difficulties for household in
the livelihood zone relate to
prices: low prices for the
items that households sell
(especially coffee) and high
prices for the things that they
buy (especially staple food).
Season Month Indicator
Belg
season
M eher
season
Dry
season
M ar
Apr
M ay
Jun
Jul
Aug
Sep
Oct
Nov
Dec
Jan
Feb
Delayed start of rainy season
Long periods without rain at critical stages in rainy season -->
Frost or hail during April - May is bad for coffee production
High staple food prices during and after maize harvest -->
Low coffee prices and low wage rates during the harvest period -->
High staple food prices during main enset production period -->
Rainfall in December is bad for coffee production
Gedeo Coffee Livelihood Zone
296
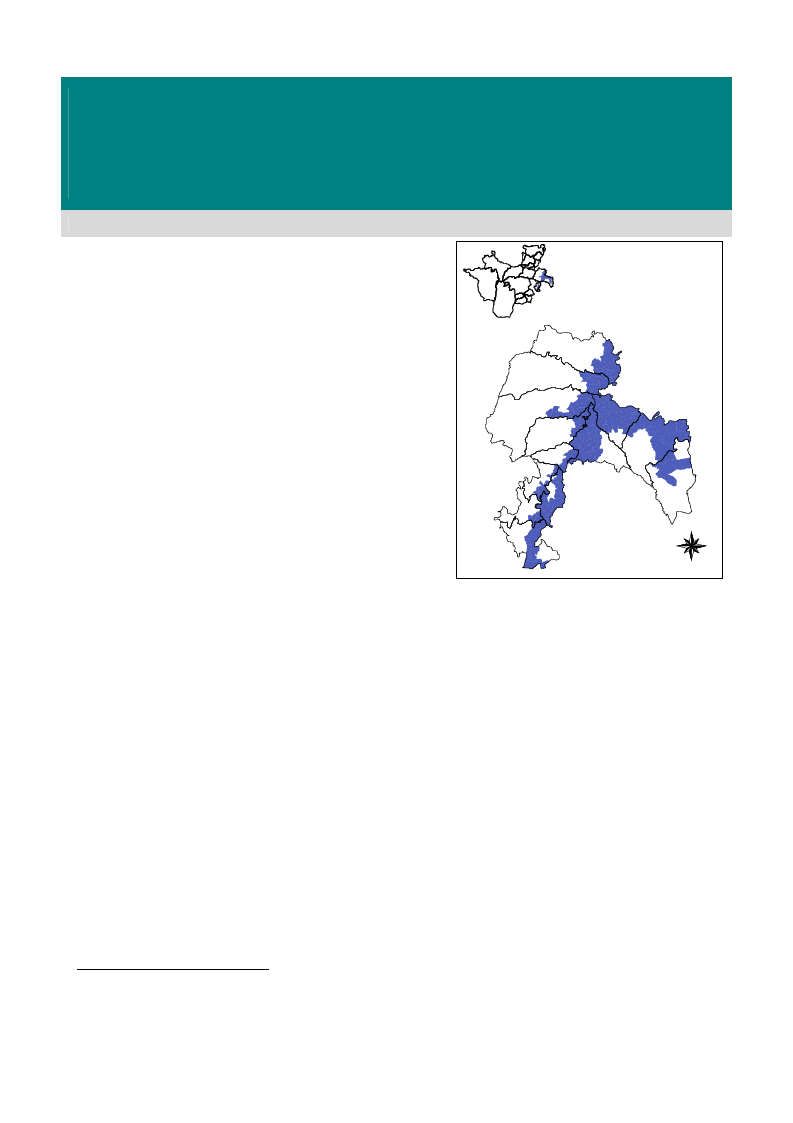
SNNPR Livelihood Zone
Sidama-Gedeo Highland Enset & Barley Zone
June 20051
Zone Description
The Sidama-Gedeo Highland Enset and Barley Livelihood Zone is
relatively food secure, with no history of food aid distributions. The
area is known for its high quality enset production and export.
Households have large reserves of mature enset and face only one
major hazard to their production: wheat rust. This disease has caused
a trend for farmers to replace wheat with maize, even though maize is
less suited to high altitudes. Households in all wealth groups obtain
the majority of their food from their own crop production and the
majority of their cash income from crop and livestock sales. A
relatively small percentage of income is spent on the purchase of
staple foods, and this expenditure is partly by choice, as households
prefer to purchase food when they have adequate cash, thus saving
their enset reserves for the future. The main issues that concern
households in this livelihood zone relate to long-term development
rather than quick-onset crises. These include the expense of
fertilizer, lack of appropriate improved seeds, poor road
infrastructure (which affects market access), and the lack of
electricity and clean water.
The Sidama-Gedeo Highland Enset and Barley Livelihood
Zone covers the highland (dega) agro-ecological areas of
Sidama and Gedeo Administrative Zones, including parts of
Awassa
Shebedino
Dale
Arbegona
Aleta Wendo
Hulla
Dara
Bensa
Wenago
Bule
Yirga Chefe
Kochere
Aroresa
N
W
E
S
Awassa, Shebedino, Hulla, Arbegona, Bensa, Aroresa, Bule and Kochere woredas. The topography is hilly, with slope
percentages ranging from 5-20%. Altitudes range from 2100 – 3200 meters above sea level and this keeps temperatures
quite low throughout the year. Vegetation cover is very sparse, and the soil type is mainly clay loam of brown colour.
The zone has many permanent streams and rivers, such as the Logita and the Ererte. Population density is moderate
compared to the neighboring midland coffee-producing areas, at about 350 people per square kilometer.
The agricultural system is mixed farming. Enset, barley, wheat, horse beans, peas and maize are the main food crops, in
descending order of importance. Shallots (locally called kitel shinkurt), cabbage (kale) and garlic are the major cash crop
in the zone. Although some farmers cultivate by hand, most use animal traction. The main livestock types reared are
cattle, sheep, and horses. Most farmers have their own grazing land and generally keep more livestock than in the adjacent
livelihood zones. This is partly because of larger landholdings, partly because there are waterlogged areas that can only be
used for grazing, and partly because rainfall (and therefore pasture) is relatively plentiful during most of the year. During
May and June, the two months when pasture and crop residues are less available locally, there is seasonal migration of
livestock to the valleys bordering Arsi and Bale Administrative Zones of Oromiya Region.
The zone has sand and rock mining along the major rivers during the dry seasons and in the months with relatively low
rainfall. Woreda officials reported that there is potential for mineral extraction, however this is not currently a major
source of income for households living in this livelihood zone.
Apart from the highland area of Arbegona woreda, market accessibility in the zone is poor due to the absence of all-
weather roads.
Local casual work is regarded as a humiliating activity in this community. As a result, poor households avoid working
locally and instead migrate to neighboring coffee-producing areas at harvest time or to the gold mining area of Shakiso
when they need cash income. Better off households use communal labor to cultivate their fields at peak periods, providing
food and drink to those who participate.
1Fieldwork for the current profile was undertaken in June 2005. The information presented refers to October 2003-September 2004
(Tikimt 1995 to Meskerem 1996 in the Ethiopian calendar), an average-to-above-average year by local standards (i.e. a year of
average-to-above-average production and rural food security, when judged in the context of recent years). Provided there are no
fundamental and rapid shifts in the economy, the information in this profile is expected to remain valid for approximately five years
(i.e. until 2010).
297
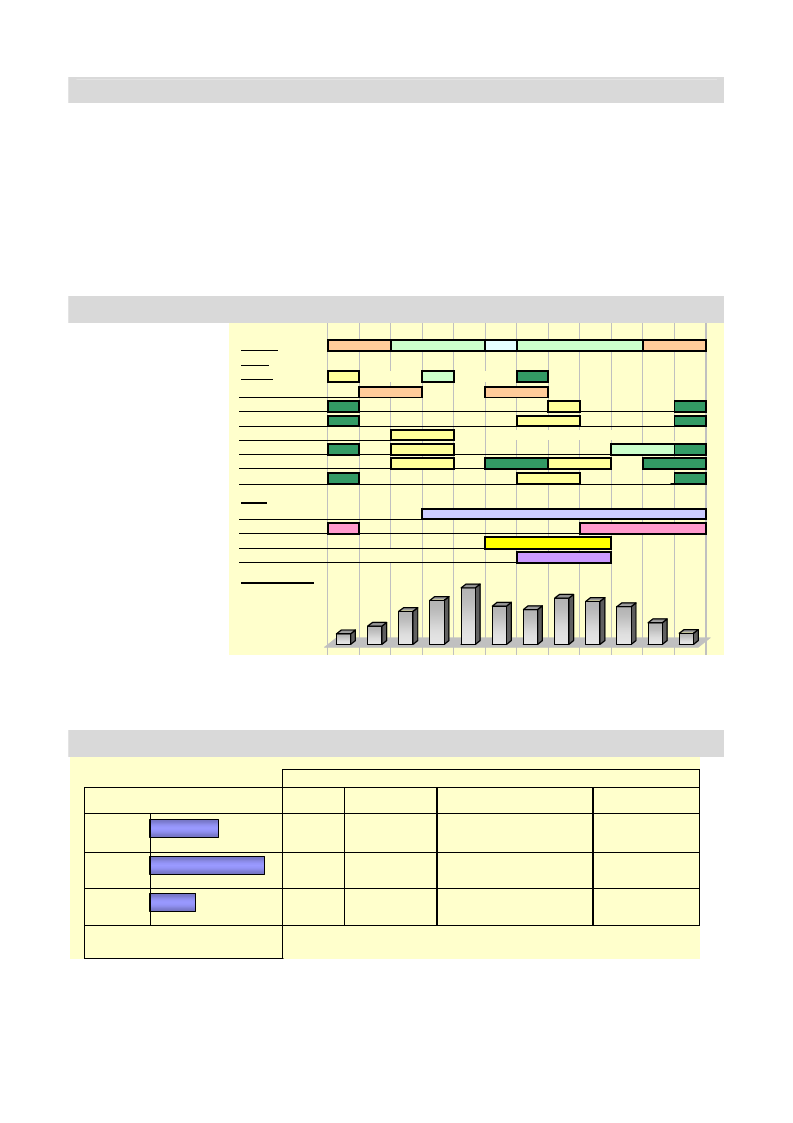
2
Markets
The road conditions in this livelihood zone are generally poor and this affects market exchanges. Most communities
point out that they are far from major urban centres and from tarmac roads and that connections to neighboring woredas
are difficult. This means that farmers obtain lower prices for their produce than they might otherwise. There are two
local market days every week in most parts of the zone.
The main items exported from the zone are kocho (produced from enset), barley, horse beans, shallots, cabbages, garlic
and livestock. Kocho is sold to the main woreda towns in this and neighboring livelihood zones and to major urban
centres like Dilla and even Addis Ababa. Barley and pulses are sold to Dilla, Yirgalem and to local markets. Shallots,
cabbages and garlic are sold from woreda market towns to Dilla, Awassa and Shashamene. Livestock follow a similar
route, sometimes making it as far as Addis Ababa.
The main items imported into the zone are maize and household items like salt, soap and the like. Maize is supplied to
local markets by traders from nearby maize-producing livelihood zones.
Seasonal Calendar
The two rainy seasons are
the belg rains, which fall
from March to May, and
the kremt rains, which fall
from July to October.
There is less rain in June,
which is a hot and sunny
month.
Maize and enset are
planted during the belg
rains, while barley, wheat
and pulses are planted
during the kremt rains.
The harvest period for
most crops is December –
January, although enset
can be harvested at any
time.
Seasons
Crops
Legend
Land Preparation
Barley
Wheat
Enset
Maize
Irish potatoes
Pulses
Other
Milk production
Labor migration
Food purchases
Hunger season
Rainfall Pattern
Jan Feb Mar Apr May Jun Jul Aug Sep Oct Nov Dec
Dry
Belg
Meher
Dry
planting
cons. green
harvest
--> harvest any time after 4-6 years
The hunger season falls in
July to September, the
months running up to the
start of the green maize
Source of rainfall data: National Meteorological Service Agency (NMSA) Data Archives (long-term average).
harvest. Local agricultural
labor is not common in this livelihood zone, but poor households seeking cash migrate to neighboring coffee-producing
areas during the September – January harvest period.
Wealth Breakdown
HH size
Wealth Group Information
Land owned
Perennial crops
Livestock
Poor
6-8
Middle
8-10
Better-off
0%
20%
40%
% of population
10-12
60%
0.25 - 0.75 ha
0.75 - 1.25 ha
1.5 - 2.5 ha
50 - 150 m ature enset stem s
1-3 cattle; 1-3 sheep; 0-
1 horse; 2-4 hens
200 - 500 m ature enset stem s; 50 - 4-6 cattle; 2-6 sheep; 0-
110 eucalyptus trees
2 goats; 1-3 horses; 3-5
hens
600 - 800 m ature enset stem s; 100 8-12 cattle; 4-10 sheep;
- 200 eucalyptus trees
0-4 goats; 2-4 horses; 3-
5 hens
Wealth in the Sidama-Gedeo Highland Enset and Barley Livelihood Zone is determined primarily by the area of land
and the number of cattle that a household owns. Households that own large areas of land also tend to have large areas
planted with mature enset stems, although all households in this livelihood zone have large amounts of mature enset
compared to other, less food secure, areas of SNNPR. Livestock holdings are somewhat higher than in neighboring
livelihood zones.
Sidama-Gedeo Highland Enset & Barley Livelihood Zone
298
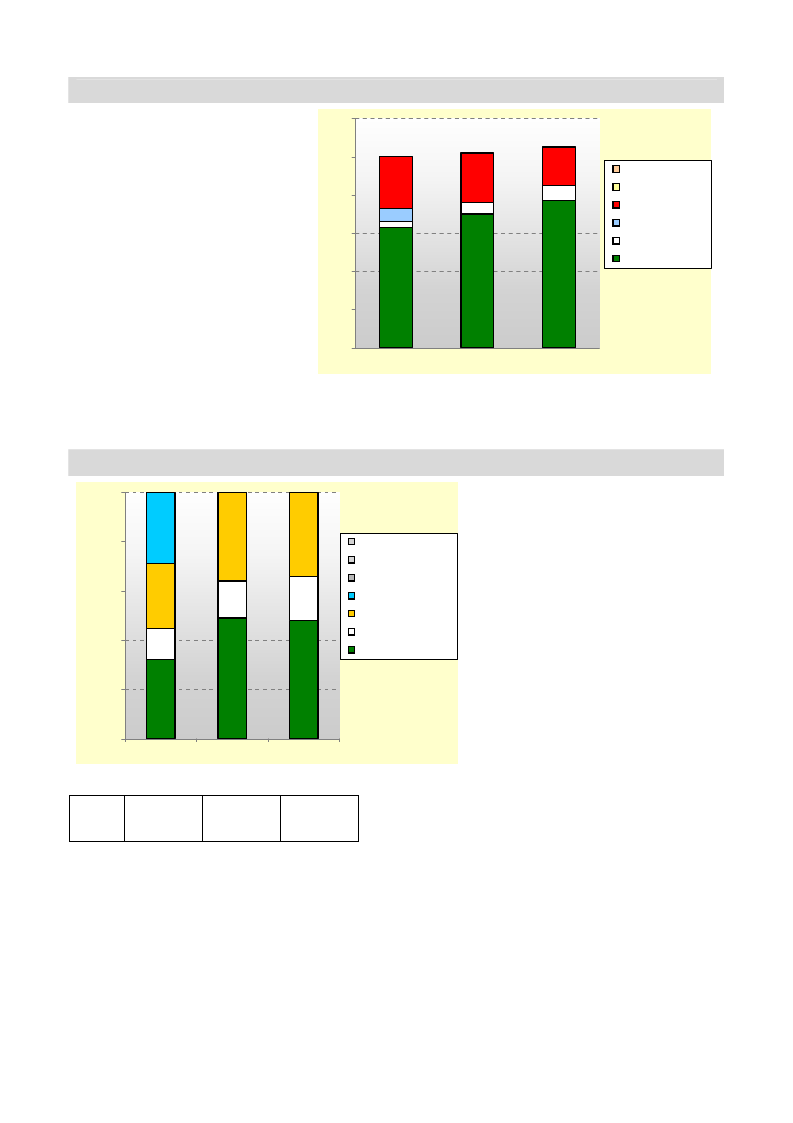
3
Sources of Food – An average year (2003-04)
The graph presents the sources of food
for households during the period October
2003 – September 2004. October
represents the start of the consumption
year because that is when the green
maize harvest begins, marking the end of
the annual hunger season.
The contribution of both own crop
production and own livestock production
(milk and meat) to annual food
requirements increased with wealth. In
contrast, food purchases declined with
wealth. The main foods purchased were
maize, kocho, meat and vegetable oil.
Households could purchase less kocho
by harvesting more of their own enset
stems, but often they chose to purchase
when they had cash in order to reserve
their own enset for the future.
120%
100%
80%
60%
40%
gifts/other
food aid
purchase
payment in kind
livestock prod.
crops
20%
0%
Poor
Middle
Better off
Food access is expressed as a percentage of minimum food requirements, taken as
an average food energy intake of 2100 kcals per person per day.
The ‘payment in kind’ category in the sources of food graph above represents the food that poor migrant laborers
consumed while they were away from home.
Sources of Cash – An average year (2003-04)
100%
80%
60%
40%
20%
other
petty trade
self-employment
employment
livestock sales
l/stock prod. sales
crop sales
0%
Poor
Middle
Better off
The graph provides a breakdown of total cash income according to income
source.
Annual
income
(ETB)
1,600-
2,100
2,500-
3,500
4,000-
6,000
The graph presents the sources of cash
income for households in different wealth
groups for the period October 2003 –
September 2004. The contribution to annual
income of crops and livestock increases with
wealth. These were the main income sources
for all three wealth groups in the reference
year.
Poor households supplemented their income
from own production with labor migration to
neighboring coffee-producing areas at harvest
time, earning 400-600 ETB per household
from this source in the reference year.
All three wealth groups cultivated the same
crops, only in different quantities. The main
crops sold included maize, kocho, wheat,
barley, pulses, shallots and cabbage. Most of
the income obtained from livestock product
sales was from the sale of butter.
Firewood sales and other forms of self-
employment are not common in this
livelihood zone
Sidama-Gedeo Highland Enset & Barley Livelihood Zone
299
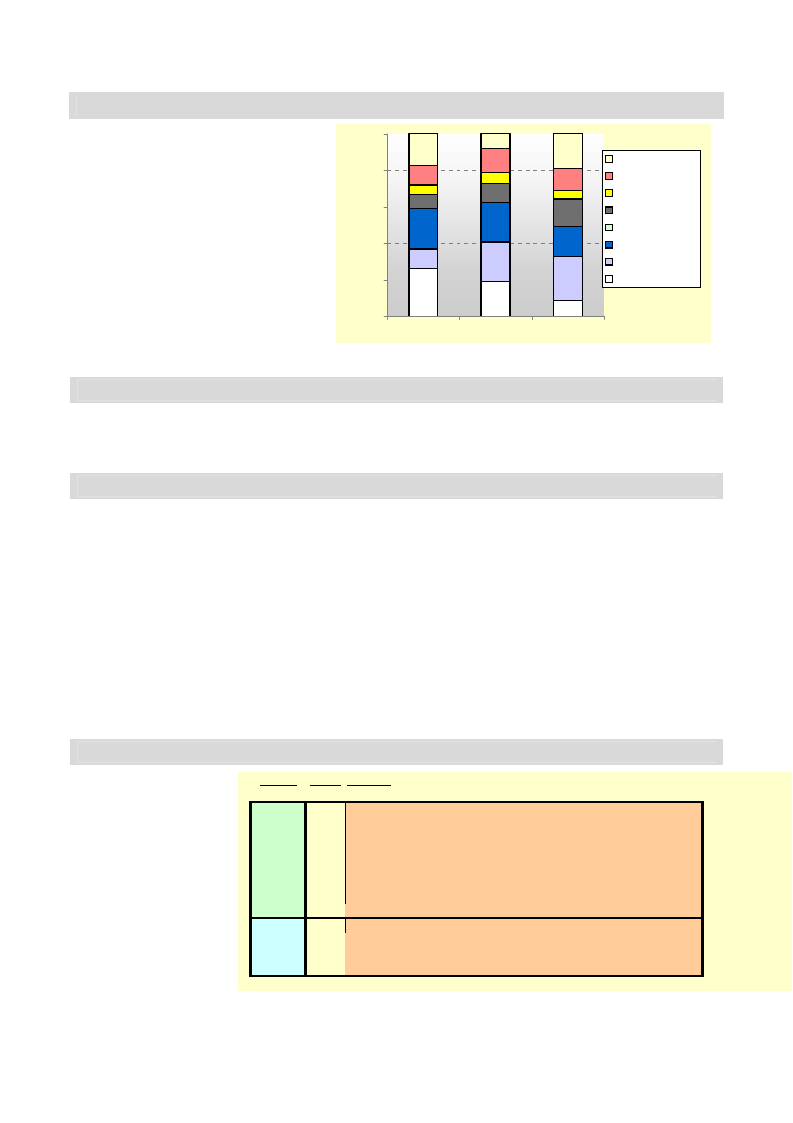
4
Expenditure Patterns – An average year (2003-04)
The graph presents expenditure patterns for
the period October 2003 – September 2004.
Expenditure on staple food declined as a
proportion of income as wealth increases.
All wealth groups spent a relatively small
percentage of their income on staple food
compared to other livelihood zones in the
region.
The category ‘household items’ includes
salt, soap and kerosene. ‘Other’ includes
tax, social obligations, ceremonies and
savings. ‘Social services’ includes spending
on education and health. Expenditure on
most items (except staple food) increased
with wealth in the reference year.
100%
80%
60%
40%
20%
other
clothes
social services
inputs
water
HH items
non-staple food
staple food
0%
Poor
Middle Better off
The graph provides a breakdown of total cash expenditure according to category
of expenditure.
Hazards
This is a relatively food secure livelihood zone, which has experienced few serious hazards in the past. Rainfall is
generally plentiful and reliable. However, wheat rust is a problem every year and is causing farmers to reduce the
amount of wheat that they plant, replacing it with maize, due to the unavailability of rust-resistant wheat-variety seed.
Bacterial wilt disease in enset is another hazard that threatens long-term food security.
Response Strategies
Households in this livelihood zone have not developed a wide range of strategies to cope with hazards because the
hazards they face are relatively few. However, the common strategies that are available in other livelihood zones are
also applicable here and represent the strategies that individual households employ when they face a crisis.
These vary from potentially destructive strategies, such as the unsustainable sale of livestock, to more neutral
strategies, such as the reduction of non-essential expenditure. The latter is a commonly employed strategy in
difficult times. Households can reduce expenditure on clothes, kerosene, meat, ceremonies and other non-staple items.
All wealth groups attempt to expand their food and income sources that are less directly affected by a particular
problem. For example, livestock sales expand in difficult times. Obviously, wealthier households are in a better
position to exploit this strategy since they own more livestock, but even for them this strategy has strict limits if the
sale of productive animals is to be avoided.
The increased consumption of enset is a strategy for all households, but there are limits to this if households are to
avoid depleting their reserves and reducing future production.
Labor migration to less affected areas is another possible response strategy, particularly for poor households.
Indicators of Imminent Crisis
Although rainfall is
relatively reliable in this
Season Month Indicator
livelihood zone, its delay
Mar Delayed onset or insufficient belg rains (March - May)
would indicate an
Belg
Apr
impending problem, as
season May
would long periods without
Jun Delayed onset or insufficient kremt rains (June - October)
sufficient rain at critical
M eher
Jul Delayed provision and high prices of agricultural inputs (June - July)
stages in the agricultural
season Aug Unusually high maize prices and low livestock prices (June - October)
calendar. Other indicators
of future difficulties include
the delayed provision of or
unusually high prices for
agricultural inputs at the
start of the main meher
Dry
season
Sep
Oct W idespread wheat rust infestation (October - November)
Nov
Dec Delayed green harvest of maize and beans
Jan Failure of meher season dry harvest (December - January)
Feb
season. The extent of the
wheat rust infestation in October – November is also an indicator of future prospects for that crop. Bacterial wilt
disease can affect enset at any time and, if unusually severe and widespread, could signal a crisis in the livelihood
zone.
Sidama-Gedeo Highland Enset & Barley Livelihood Zone
300

5
Sidama-Gedeo Highland Enset & Barley Livelihood Zone
301
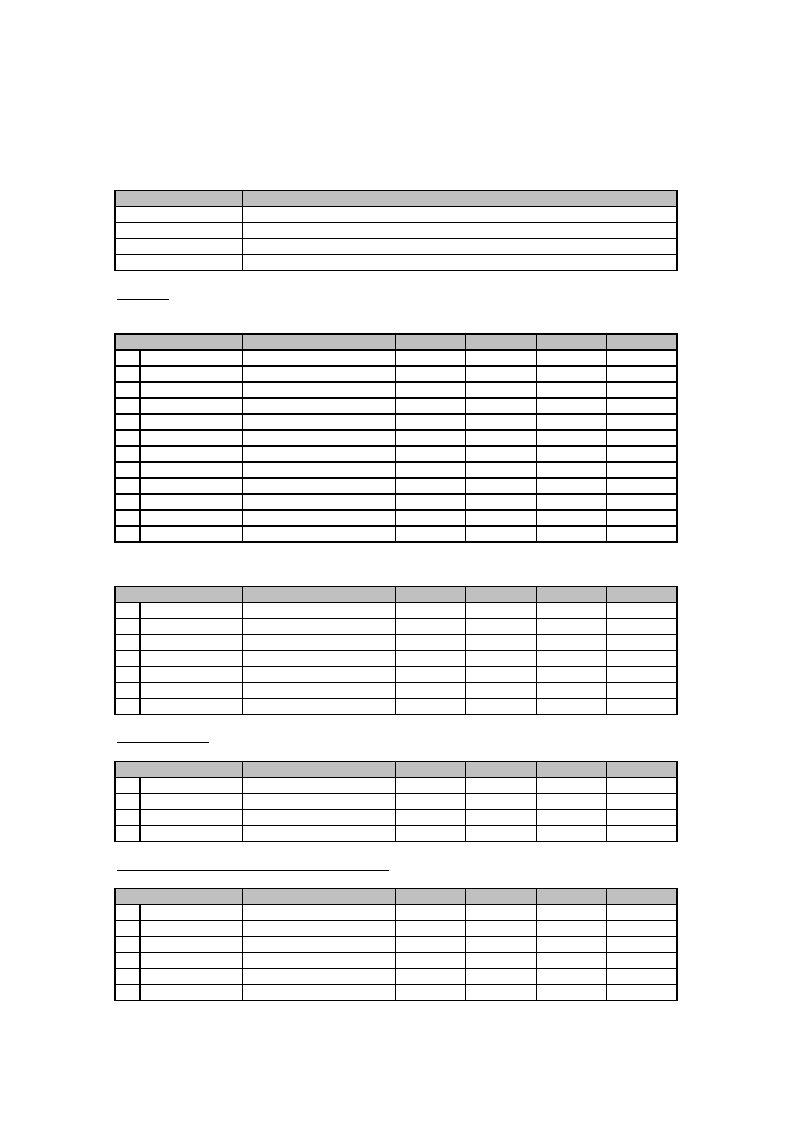
SNNPR Livelihood Profile
Key Parameters for Monitoring Livelihoods at Woreda Level
Woreda:
Zone:
Wenago
Gedeo
LIVELIHOOD ZONES IN THE WOREDA
LZ code
Livelihood Zone
SMB
Sidama Maize Belt LZ
GCO
Gedeo Coffee LZ
SEB
Sidama-Gedeo Highland Enset and Barley LZ
CROPS
A: MAIN CROPS GROWN, BY LIVELIHOOD ZONE
1= major crop for the LZ, 2 = minor crop
Importance for woreda Crop
SMB
GCO
SEB
1 Major
maize
1
2
1
2 Major
enset
2
1
1
3 Major
coffee
1
4 Minor
haricot beans - meher
2
5 Minor
wheat
2
6 Minor
barley
2
7 Minor
beans/peas/pulses
2
8
9
10
11
12
B: MAIN CROPS SOLD, BY LIVELIHOOD ZONE
1= major source of cash income for the LZ, 2 = minor source
Importance for woreda Crop
SMB
GCO
SEB
1 Major
coffee
1
2 Major
maize
2
1
3 Major
enset
2
1
4 Minor
beans/peas/pulses
2
5
6
7
LIVESTOCK - MAIN TYPES SOLD, BY LIVELIHOOD ZONE
1= major source of cash income for the LZ
Importance for woreda Livestock type
SMB
GCO
SEB
1 Major
cattle
1
1
1
2 Major
goats
1
3 Major
fattened oxen
1
4 Major
sheep
1
1
OTHER SOURCES OF CASH INCOME
1= major source of cash income for the LZ
Importance for woreda Source of cash income
SMB
GCO
SEB
1 Major
ag lab
1
2 Major
firewood
1
3 Major
butter sales
1
4 Major
lab migration
1
5
6
Note: A Key parameter is defined as a source that contributes significantly to total food/cash income, so that
a reducton in access to that source may have a significant effect on total income. A major source is one that
contributes 10% or more to minimum annual food energy needs for two or more wealth groups (either
directly as food or if used to purchase food). A minor source contributes 5%-10% to annual food needs.
302
Summary of non-food baseline information: Wenago Woreda
Livestock production
Main Diseases (and their seasonality):
o Internal parasites (May-July)
o Trypanosomiasis (May-September)
o Pneumonia (June-September)
o Mastitis (May-September)
o Coccidiosis (June-October)
Main feed sources (and their availability):
o Grass/browse (March to September)
o Crop Residues (July to November)
Woreda services:
o Periodic vaccination for Blackleg, Rabies,
Newcastle Disease and Peste des Petits
Ruminants (PPR)
Human health
Main diseases:
o Malaria (July to December)
o Intestinal parasites (not seasonal)
o Pneumonia/Respiratory Tract Infections
(September – November)
o Typhoid Fever (February-September)
o Sexually Transmitted Infections (September-
April)
Vaccination
o In 1996, there was a vaccination program against
polio (6911 children vaccinated); measles (4419);
BCG (7822); DPT3 (6911) and Tetanus Toxoid
(TT) (8658)
Woreda services:
o 25 health workers at the woreda town
o 57 health workers at the community level
o 2 health centres and access to 1 hospital at the
woreda town
o 15 health posts and 1 health centre at the
community level
Crop production
Inputs used:
o Seeds: maize (March)
o Fertilizer: DAP (March, April); Urea (April, May)
Main diseases and pests affecting crops:
o Stalkborer (affecting maize, April-May)
o Coffee Berry Disease (August-November)
o Coffee Wilt Disease (October – December)
o Enset Wilt Disease (June – July)
o Mole Root (April)
Water sources
Overview
o There is good availability of water throughout the
year except in the kola zone where there is
seasonal shortage in years of average and poor
rains
Rivers
o Major: Chechu, Derso, Suba Gelana, Supable
o Minor: Awala, Meko Galana, Deko, Mepep
Reservoirs:
o n/a
Deep wells:
o Chechu, Amiteita
Shallow wells
o Aroresa, Gempeno, Tokicha
Developed springs:
o Supale, Bukela
Nutrition
o In general, June and July are months of seasonal
food shortage
o The main causes of malnutrition in the area are
high population density, shortage of land for
cultivation, lack of suitable weaning foods for
infants, and poor sanitation leading to diarrhoea.
303