


NATIONAL
DISASTER RISK MANAGEMENT COMMISSION
(NDRMC)
WOREDA DISASTER RISK PROFILE (WDRP)
REGION: SNNP
ZONE: ALLE SPECIAL
WEREDA: ALLE SPECIAL
December, 2020
Addis Ababa

About the National Disaster Risk Management Commission (NDRMC)
The National Disaster Risk Management Commission (NDRMC) was reestablished in
December 2015 and recognized by an act of Council of Ministers (Regulation No.
363/2015) as an autonomous Federal Government office mandated to conduct
appropriate activities for the comprehensive implementation and realization of
the objectives of the National Disaster Risk Management Policy and Strategy and
to coordinate, monitor and provide appropriate support with respect to activities
carried out by the lead sector institutions.
Address: Kirkos Sub-city Behind Dembel City Center, Addis Ababa, Ethiopia.
P.O.Box: 5686
Tele: 0115524259/4272
Website: www.dppc.gov.et
© 2020 National Disaster Risk Management Commission. All rights reserved
Printed in Addis Ababa, Ethiopia.
Citation- This Document May be Cited as Follows:
National Disaster Risk Management Commission (2020),Alle Woreda Disaster Risk
Profile, Addis Ababa, Ethiopia.

PREFACE
Ethiopia is well aware of the impact that disasters can have on the
development goals that we are rigorously pursuing through our
Growth and Transformation Plan II. With this recognition we
started a paradigm shift a few years ago, largely triggered by the
revised National Policy and Strategy on Disaster Risk Management.
To make the DRM programme implementation in the country well-informed, a
comprehensive information management system is required. We have been
undertaking a comprehensive risk assessment exercise under which Disaster Risk
Profiles are being prepared for each district and at sub-district levels in the country.
This Wereda Disaster Risk Profile establishes an extensive database on disaster risk
elements that will help decision makers at all levels to be better informed at
community and Wereda level about the characteristics of potential hazards, their
potential exposure, vulnerabilities of communities, capacities and that can also be an
input for Wereda Disaster Risk Reduction Plans and area specific early warning tools.
Wereda Disaster Risk Profiles developed are publically available here for the use of all
development partners and government sectors at all levels. Also, other data sources
of NDRMC, such as Desinventar, Livelihood Baseline and the Early Warning information
will be integrated and harmonized with this Information Management System.
Finally, we need to acknowledge the support of partners who have funded this
programme and we also look for the support of donors and all development partners
in order to achieve the ambitious indicators of this risk information and providing
every district with the disaster risk profile and their respective risk-informed plans.
H.E. Ato Mitiku Kassa
Commissioner
National Disaster Risk Management Commission (NDRMC)
The Federal Democratic Republic of Ethiopia (FDRE)

PREFACE
Woreda Disaster Risk Profiling (WDRP) is a government owned
programme undertaken by the National Disaster Risk
Management Commission (NDRMC) in collaboration with
regional DRM offices and development partners to provide
baseline information for disaster risk management practices
and activities in the country. The programme is designed by
taking into account the experiences gained from the implementation of pervious
strategies and actions like the Hygo Framework for Action (2000-2015) and the Sendai
Framework for Disaster Risk Reduction (2015-2030).
WDRP is composed of diversified indicators including hazard related issues, crop and
livestock production, landholding and environmental issues, human and livestock
health issues, education and social issues at wereda and kebele level. It provides
basic and detailed indicators with both quantitative and qualitative information which
obtained from both primary and secondary data sources.
Moreover, two pages summary of profiles is also prepared to help users easily
understand WDRP results for each wereda without going into detail for all indicators.
In addition to this booklet, developed profiles are uploaded on WDRP website
(http://profile.ndrmc.gov.et) to be viewed by all users; we encourage all DRM actors
at all levels to use this profile as baseline information for all DRM initiatives.
This WDRP booklet was produced through exemplary collaboration of all concerned
bodies and I would like to give my deepest gratitude to all who directly or indirectly
contribute for the success of the programme particularly for data enumerators and
supervisors, data encoders and profile development teams, consultants and advisors,
partner ministries and all DRM stakeholders.
Abraham Abebe
Director
Disaster Risk Reduction and Rehabilitation Directorate (DRRRD)
National Disaster Risk Management Commission (NDRMC)
Contents
No. Indicator Name
Page
Preliminary Information
I.
Preface
II.
Wereda Location in Ethiopian Map
III.
Methodology
IV.
Summary Profile
Hazard Related Characteristics
1
1.
Biological Hazards of the Wereda
2
2.
Geological Hazards of the Wereda
3
3.
Hydro Metrological Hazards of the Wereda
4
4.
Socio Economic Hazards of the Wereda
5
5.
Technological Hazards of the Wereda
6
6.
Disaster Characteristics By Kebele
7
7.
Hazards: Conflict as an Issue
21
8.
Hazard Situation During Last Disaster - Characteristics of most recent disaster that
affected the community
23
9.
Frequency of Disaster Occurrence
27
10.
Household Exposure to Hazards
28
11.
Months of Occurrence of Frequent Disasters
29
12.
Conflicts: Perception of households on conflict issues - Is conflict an issue in this
community?
30
13.
Conflicts: Perception of households on conflict issues - Who do you turn to in case
of a conflict?
31
14.
Losses from Disasters - Losses from all disasters (household response in %)
32
No. Indicator Name
Page
15.
Losses from Disasters - Main Losses by Type of Disasters (household response in %) 33
16.
Losses from Disasters - Secondary Losses by Type of Disasters (household response
in %)
36
17.
Seasonal Calendar for Hazards, Activities and Income Level By Kebele
39
Infrastructure Access Characteristics
18.
Physical Vulnerability: Access to Roads & Urban Centres - Households access to
road and urban centre
57
Physical Vulnerability: Access to Electricity - Households’ access and utilization of
19.
electricity
58
20.
Physical Vulnerability: Type of Dwelling Units - Households’ type of dwelling houses 59
Socio Demographic Characteristics
21.
Economic Vulnerability: Level of Migration - Migration level and its characteristics
by Kebele
61
22.
Economic Vulnerability: Household Migration - Household migration and reason for 63
migration
23.
Economic Vulnerability: Household Migration - Disasters as a triggering factor for
migration (households response in %)
64
24.
Demography: Population Structure
65
25.
Demography: Population Trends and Ethnic Groups
67
Social Vulnerability: Household Demographic Characteristics - Demographic
26.
characteristics of households
68
Social Vulnerability: Level of Educational Attainment - Education status of
27.
household members
69
28.
Social Vulnerability: Gender Parity - Gender parity in education level (7+ years)
and household heading
70
Environmental Characteristics
29.
Environmental Situation: Environmental Problems - Major environmental problems
by Kebele
72
No. Indicator Name
Page
Environmental Situation: General Land Quality - Perceptions of the community
30.
on changes in the general quality of land over a decade
73
Environmental Situation: Changes in Landscape - Changes observed by the
31.
community on landscape and the problems due to the changes
74
32.
Environmental Situation: Land-Use other than crop production - Types of land use
other than crop production across Kebeles
76
33.
Environmental Situation: Deforestation - Observed changes over levels of
deforestation by the community and its problems
78
Environmental Situation: Natural Resources Availability - Natural resources
34.
available and changes observed by the community
79
35.
Environmental Situation: Rainfall & Temperature - Observed changes on rainfall
and temperature by the community over the last decade
88
36.
Environmental Situation: Reasons for Environmental Changes
90
37.
Environmental Situation: Soil Erosion - Observed changes on levels of soil erosion
by the community
91
Livelihood, Occupation and Source of food
Economic Vulnerability: Major Occupational Categories - Major categories of
38.
occupation and percent of population engaged in the occupation by Kebele
93
Economic Vulnerability: Livelihoods - Households important sources of
39.
livelihood (response in %)
96
40.
Economic Vulnerability: Occupational Categories - Percent of population above 15
years age by occupation categories
99
41.
Economic Vulnerability: Sources of Food - Households source for different food
items (response in %)
100
Crop Production
42.
Hazards: Change in Crop Damages - Proportion of total crop damage (percentage
response by households)
104
43.
Hazards: Change in Crop Damages - Major reasons for crop damage (percentage
response by households)
105
Hazards: Change in Crop Damages - Proportion of Damage for Major Crops
44.
(percentage response by households)
106
No. Indicator Name
Hazards: Change in Crop Damages - Reasons for Damage of Major Crops
45.
(percentage response by households)
Agricultural Situation: Change in Crops Grown - Five major crops grown by
46.
proportion of total cultivated land
47.
Agricultural Situation: Access to Extension - Perception of the community on
Access to Agricultural extension Services
Page
108
110
116
48.
Economic Vulnerability: Crops Grown - Types of crops grown by households
118
49.
Economic Vulnerability: Crops Grown - Proportion of households by amount of yield
of major crops (last year)
119
50.
Economic Vulnerability: Crops Grown - Proportion of households by amount of yield
of major crops (Five years ago)
120
51.
Economic Vulnerability: Land Ownership and Quality - Landownership of households 121
52.
Economic Vulnerability: Land Ownership and Quality - Farmers’ perception on the
quality of their agricultural land
122
53.
Agricultural Situation: Access to Inputs - Perception of the community on access
123
to improved agricultural inputs
54.
Agricultural Situation: Water for irrigation - Access to water for irrigation in the
community
124
55.
Agricultural Situation: Soil Fertility - Perception of the community on soil fertility
and its change over time
125
56.
Economic Vulnerability: Status of Agriculture - Methods of tillage, Irrigation and
other agricultural input utilization by households
126
57.
Economic Vulnerability: Change in Agricultural Situation - Households
perception on changes of crop type, size of cultivated area and crop yields
127
58.
Economic Vulnerability: Crops Grown - Number of crops grown by households
129
Livestock Production
59.
Agricultural Situation: Status of Livestock Disease - Change In Livestock Disease
Status By Kebele
131
60.
Livestock Prevalence- Types of livestock diseases affected households In last five
years diseases affected households in the last five year
131
No. Indicator Name
Page
Livestock Prevalent of Diseases & Veterinary Facility - Evaluation of Access to
61.
Veterinary Services and Livestock Drugs
132
62.
Agricultural Situation: Water Availability for Livestock - Water availability for
livestock in the community
134
63.
Agricultural Situation: Livestock Diversity - Type of livestock and their economic
importance in the community
134
Economic Vulnerability: Livestock Ownership and Changes - Percentage of
64.
households by number and type of livestock owned
139
65.
Economic Vulnerability: Livestock Ownership and Changes - Households’ perception 141
on changes in livestock number in the last five years (response in %)
66.
Economic Vulnerability: Livestock Ownership and Changes - Households
perception on changes in livestock number in the last five years (response in %)
144
67.
Agriculture (Livestock): Pasture Availability - Households’ perception on access and
quality of pasture
146
Agriculture (Livestock): Pasture Availability - Households’ perception on
68.
problematic months for pasture availability
147
Agriculture (Livestock): Water Availability - Households’ response on water
69.
availability for livestock
148
70.
Agriculture (Livestock): Water Availability - Households’ perception on problematic
months of water availability for livestock
149
Agriculture (Livestock): Water Availability - Sources of water for livestock
71.
(households response in %)
150
Access to Markets and Credit
Economic Vulnerability: Proportion of Produce Sold and Market - Proportion of
72.
crops and livestock sold from total production and markets
152
73.
Economic Vulnerability: Kebele Access to Markets - Access to market by Kebele
155
74.
Economic Vulnerability: Formal & Informal Transfers - Percentage of households
reporting received formal transfers
156
No. Indicator Name
Page
75.
Capacity: Access to Credit Facilities - Households access to credit facilities
158
76.
Capacity: Access to Credit Facilities - Percentage of households by major reasons
of borrowing money
159
Capacity: Access to Credit Facilities - Percentage of households by major sources
77.
of credit
160
78.
Capacity: Access to Credit Facilities - Percent of households with ability to raise
500 birr in one week
161
Health and Sanitation Characteristics
79.
Household Access to Health Facilities - Where do patients go for health care?
163
80.
Hazards: Health problems and changes over the last decade
164
81.
Household Health Status - Households’ health condition and major health problems 166
82.
Household Access to Sanitation - Percentage of households with access to different
kind of toilet facilities
168
Household Access to Drinking Water - Sources of drinking water for households
83.
(response in %)
169
84.
Household Access to Drinking Water - Households’ methods of treating drinking
water
170
85.
Household Access to Drinking Water - Number of times households fetch water in a
week
171
Household Access to Drinking Water - Time taken per day to fetch water for
86.
households
172
Coping Mechanisms and Preparedness Measures
87.
Capacity: Community Preparedness against Sudden Onset Disasters
174
88.
Capacity: Community Preparedness against Increase in Disaster Intensity
178
89.
Capacity: Community Preparedness against Disasters
180
90.
Hazard: Coping and recovering during last Disaster
184
91.
Capacity: Type Community Participation
193
No. Indicator Name
Page
Capacity: Recovery from Losses from Disasters - Percentage of Households who
92.
have managed to recover from losses of disasters
195
Capacity: Coping Strategies Adopted by Households - Main coping strategies
93.
adopted by households to recover from respective losses
196
94.
Capacity: Coping Strategies Adopted by Households - Percentage of households
by frequency of main coping strategies adopted
200
95.
Capacity: Alternative Livelihood Sources - Alternative livelihood sources suggested
by the community
202
96.
Capacity: Recovery from Losses from Disasters - Percentage of households
recovered from past disasters by type of Disasters
205
Capacity: Recovery from Losses from Disasters - Proportion of households
97.
recovered by type of Losses
206
98.
Capacity: Coping Options if More Resources Available - What coping strategy could
be adopted if more resource were available?
207
99.
Capacity: Coping Strategies Adopted by Households - Percentage of households by
major type of coping strategies adopted (at least once)
208
Capacity: Coping Strategies Adopted by Households - Main coping strategies
100.
adopted by households for respective disasters
210
101.
Capacity: Coping Strategies Adopted by Households - Secondary coping strategies
adopted by households for respective disasters
216
Community Perception and Suggestions
Interventions: Community Perception on Mediums to Influence DRM Actors -
102. Community perception on the effectiveness of institutional channels to use to
223
influence DRM actors
Interventions: Community Perception on their Knowledge used in DRM Process -
103. Perception of the community on how their knowledge influences the priorities and 225
measures of DRM actors
Interventions: Suggestions to improve preparedness - Interventions suggested by
104.
the community to development actors to improve preparedness in the area
227
No. Indicator Name
Page
Interventions: Suggestions to DRM Actors in the Area - Community suggested
105.
measures to DRM actors in the area for effective DRM actions
228
106.
Economic Vulnerability: Community Suggestions to Improve Economic Situation -
Community suggested measures to improve the economic situation of the area
232
107. Community Awareness of Disaster Risk Management System and Actors
235
Community Perception of DRM System and Actors - Perception of the community on
108. the effectiveness of DRM system in helping them to prevent, cope and recover
244
from disasters
Major Public Interventions Desired - Percentage of households by type of
109.
intervention desired
248
Others
110. Capacity: Community Based Organizations
251
Supporting Agencies against Disasters - Percentage of households by supporting
111.
institutions to handle or recover from disaster damages
255
112.
Type of Support Received From Supporting Agencies – Household responses of types
of support received from supporting agencies
256
113.
Government Actors in the Field of Disaster Risk Management - Government actors 257
and their activities in the field of Disaster Risk Managements
Non-Government Actors in the Field of Disaster Risk Management - Non-government
114.
actors and their activities in the field of Disaster Risk Management
261
115. Interventions: Community Suggestions to Development Actors
262
116. Wereda SWOT Analysis
271
METHODOLOGY
WDRP Content :
• Comprehensive information on disaster risk components
(Hazards, Vulnerability and Capacity)
• Multi-sectoral and multi-hazard information.
Research Approach:
• Mixed Approach
• Both quantitative and qualitative information
Data Sources:
• Primary Data:
Household Questionnaires: statistically significant number
(around 400 households).
Focus Groups Discussions: One per kebele
Key Informant Interviews: with major woreda level government
and non-government DRM actors
Problem Tree Analyses : to see the cause and effect of disasters
• Secondary Data:
collected relevant to WDRP indicators:
LIU, SERA Project, Risk baseline, other ministries…
Sampling Technique:
• Multistage cluster sampling
• Both Probability and Non-probability sampling
Methods of Analysis:
• Descriptive Statistics
• Textual Analysis
• Cispro and SPSS
• Automate WDRP software

WEREDA
SUMMARY DISASTER RISK PROFILE
INFORMATION
Wereda Disaster Risk Profiling Programme: SNNPR
Disaster Risk Profile: Alle special Wereda
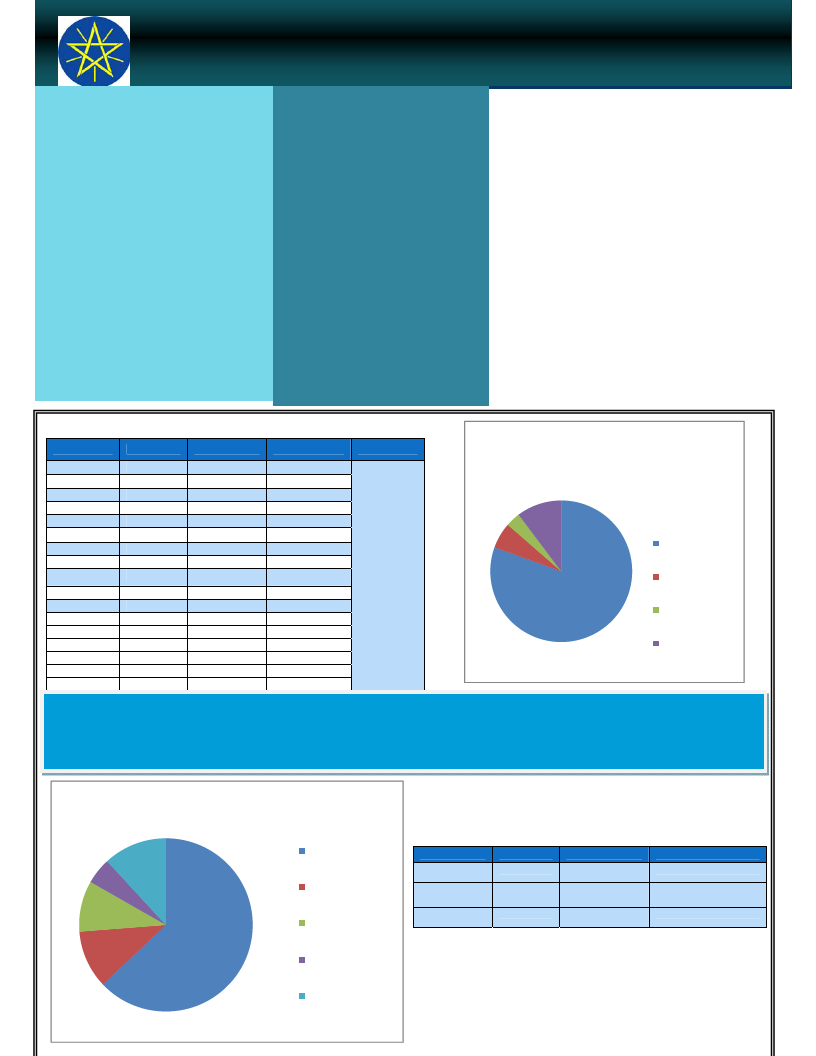
SUMMARY OF WEREDA PROFILE
Drought is the major disaster risk affecting the
livelihood of the community. Land slide and crop
pest are also the other risk in the wereda.
The environmental problems deforestation, land
degradation, soil erosion and pest infestation are
factors aggravating the occurrences of disasters in
the Wereda. Large family size (on average a
household has 6 members), climate change and
erratic rainfall, increasing temperature and
decreasing rain fall are also the other causes for
the vulnerability of the community in the wereda
In addition, lack of awareness and illiteracy are
also the major reasons that constrained to
undertake development activities in the Wereda.
Intervention measures might include: enhancing
irrigation scheme, availability of micro finance,
animal fattening, using improved seed Varity and
agricultural inputs, natural resource conservation,
constructing pond and improving infrastructures
like road, electricity, health center and veterinary
service.
MAJOR DISASTERS REPORTED IN WEREDA
Kebele
KERKERT
TURUBA
KOLANGO
EYANA
LOKITE
GUMA
GOROZE
DELBENA GAMA
TSEMEHA
ADIS OLETEMA
GEWADA
DIGINTY
DEGA MASHELE
BOLE
GERGEMA
DUGULO
LALCHO
Disaster 1
Drought
Drought
Drought
Drought
Drought
Drought
Drought
Drought
Drought
Drought
Drought
Drought
Drought
Drought
Drought
Drought
Drought
Disaster 2
Crop Pest
Human diseases
Livestock diseases
Flood
Flood
Disaster 3
Human disease
Conflicts
Human diseases
Human diseases
Flood
Human diseases
Flood
Flood
Livestock diseases
Flood
Crop Pest
Landslide
Crop Pest
Livestock diseases
Landslide
Livestock diseases
Conflicts
Crop diseases
Flood
Flood
Landslide
Flood
LIU Info
Chronic Hazards
Proportion of households by major disaster
suffered last five years
3%
10%
6%
81%
Drought
Landslide
Crop diseases
Others
SHORT NARRATIVE ON MAJOR DISASTERS:
Drought is the primary hazard in all kebeles is the most problematic hazard in the Wereda. Deforestation, overgrazing and natural resources (land) degradations
happened in the past are indicated as the root causes of drought and poor soil fertility. Drought mostly damage crop, livestock and reduce production resulting in
loss of income for the community. Moreover crop disease and land slide are also other disaster risks in the wereda which are the causes for crop damage, loss of
income and Physical damages on houses and property
Proportion of househods by major disaster losses
12%
5%
9%
11%
63%
Crop damage
Livestock damage
Physical damages
on houses and
property
Loss of income
Others
Disasters
Drought
Landslide
Crop disease
EFFECT OF DISASTERS
Loss 1
Loss 2
Loss 3
Crop damage Livestock damage Loss of income
Crop damage
Crop damage
Physical damages on
houses and property
Livestock damage
Livestock damage
Loss of income
Wereda Disaster Risk Profiling Programme: SNNPR
Disaster Risk Profile: Alle special wereda
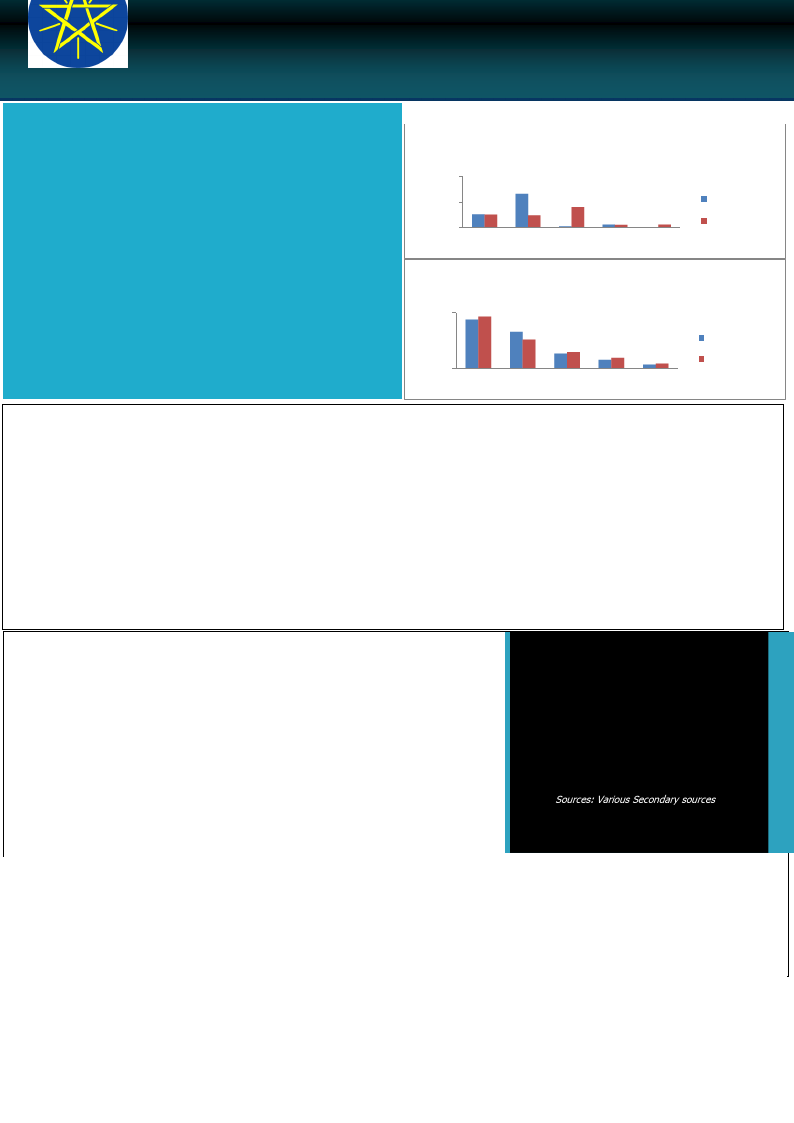
HOUSEHOLD AND COMMUNITY
VULNERABILITY
VULNERABILITY
Crop production is practiced on average by 80% of the households. The
production system is traditional and 97% of the households use oxen for tillage.
Maize, Teff, Barely and Sorghum are the main types of crops produced in the
wereda. Drought, flood and crop pests and diseases are the major reasons of
Proportion of reasons for crop damage for those crops cultivatred
by the households last year and last five years ago
100.00
crop damage in the area.
Livestock rearing is another important source of livelihood in the wereda next to
crop production even though poor access to veterinary service including
50.00
0.00
Last Year
Five Year Ago
vaccination and livestock drugs are reported. In addition lack of irrigation is also
Pests Drought Flood Frost Others
the other factor in reduction of crop production there by community vulnerable
to food shortage
Favourable condition for mosquito reproduction, typhoid lack of clean drinking
Proportion of households by major crops grown and changes last
year and last five years ago
water and hygiene severe shortage of water because of drought and lack water
treating methods or chemicals exposed households to different health problems.
50.00
Lack of awareness (high illiteracy level), large family size (on average a household
has 6 members) poor land use system, low access to infrastructures (such as road,
electricity, health centre, veterinary service and market) and poor natural
resource conservation are also among the factors making the community
vulnerable to disasters in the community.
0.00
Maize Teff Barley Sorghum Others
Last Year
Five Years Ago
Accessibility:
Access to road and urban center: From the surveyed households 99% reported either there is no road or dirty road that is difficult for car. The average
time taken to reach the nearest paved road in the woreda is 25 minutes and the average time to reach the nearest urban canter is 1 hour and 30
minutes.
Accesses to electricity: Of the household surveyed 3.10% are located in the community with electricity and 1.53% of the community located with
electricity are actually connected to electric power.
Access to Veterinary Services and Livestock Drug: 77% of the surveyed household has reported that they have very poor and poor access to both
veterinary services and livestock drug.
Access to market: Most kebeles reported that there is no access to market because of lack of road and far location of market place.
Access to water and sanitation: Most of the households use water for drinking from river or stream (33%), piped water outside the house (13%),
pond or lack (29%) and (22%) from communal tap, where 87% of them of them have no treating methods. Out of the surveyed households 95% of
them have out door latrine (hole on plot) and only 1% has no toilet facilities in the house and 1.53% of them are sharing toilets.
Access to credit: ‐ 82% of the surveyed households reported that they are using credit service mainly from bank/formal lending institution,
friends and neighbors mainly to buy food, to buy agriculture input, pay for health care and for other purposes.
Level of Awareness and Institutional Development
Literacy level The proportion of literate population above 7 years old is 12.25% out of which 60%
completed below 1st grade level, 32% and 7% of the population completed primary and secondary
school respectively. With regard to gender parity in education, proportion of female students is
higher than male students in completing 1st grade level, but dominated by male students in all other
education levels. Of the total households surveyed, 12% of them are female-headed households.
Community awareness about disaster risk management system and actors Is reported to be
good in all kebels except that there is lack of institutional integration, lack of fund and limited
number of skilled man power. There are formal and informal community based Organizations
such as farmers association, women associations, Omo micro finance institution and cooperatives
working on different activates and informal organizations Ider and ekub to help each in farm
activities, during problem and funeral. There are different NGOs such as AMREF (African medical
and research foundation), MERCY CORPS and Save the children supporting the community by
proving aid, improving mothers and child health care, constructing water source and job opportunity
or the community and environmental protection.
Info Bits:
Population
Sex ratio
Urban Population
Mean Altitude
Mean Slope
Road density
Measles caseload
: - (2007)
: - F/1000 M
: - (2007)
:-
:-
:-
: -- (2004-2009)
Sources: Various Secondary sources
WDRP Indicators
Hazard Related Characteristics
1

Wereda Disaster
Risk Profile
National Disaster Risk Management
Commission (NDRMC)
Data_Collected_Date
January 1900
Thursday, July 11, 2019
Region S.N.N.P
Zone
SEGEN PEOPLES
Wereda
ALLE SPECIAL
Selected Indicator
Biological Hazards of the Wereda
Hazard_Name
Hazard_Sub_Type
Crop pest and diseases
Cause_Of_Hazard
Crop pest and diseases
Climate change, vector born disease
increased
Effects_Of_Hazard
Loss of coffee plant, loss of enset plant,
loss of asset
Hazard_Sub_Type
- Malaria
- Chronic fever
- Stomach pain
- Headache
Hazard_Sub_Type
- Trypanosomiasis
- Black leg
- Faciolosis
Human diseases
Lack of sanitation and hygiene,
increased vector born disease
Lack of vaccination during childhood,
mosquito reproduction
Livestock diseases
Livestock disease out break, shortage of
animal feed
Death of human, loss of asset
Reduce the number of livestock, loss of
livestock dairy production
Page 1 of 1
2

Wereda Disaster
Risk Profile
National Disaster Risk Management
Commission (NDRMC)
Data_Collected_Date
January 1900
Thursday, July 11, 2019
Region S.N.N.P
Zone
SEGEN PEOPLES
Wereda
ALLE SPECIAL
Selected Indicator
Geological Hazards of the Wereda
Hazard_Name
Hazard_Sub_Type
Landslide
Cause_Of_Hazard
Landslide
The nature of land, over cultivation,
population growth, deforestation
Effects_Of_Hazard
Land degradation, loss of crop, leaving of
resident area
Page 1 of 1
3
Wereda Disaster
Risk Profile
National Disaster Risk Management
Commission (NDRMC)
Data_Collected_Date
January 1900
Thursday, July 11, 2019
Region S.N.N.P
Zone
SEGEN PEOPLES
Wereda
ALLE SPECIAL
Selected Indicator
Hydro Metrological Hazards of the Wereda
Hazard_Name
Hazard_Sub_Type
Drought
Cause_Of_Hazard
Drought
Lack of rain, deforestation, increasing
population, climate change
Hazard_Sub_Type
Flood
Flood
Sloppy sandy land, no terracing farm
land, lack of natural resource
management, deforestation, over
grazing
Effects_Of_Hazard
Shortage of food, animal death,
migration of people
School drop out, loss of crop production,
season disturbance
Loss of fertile soil (erosion), loss of crop
production, reduced yield production
both crops and animals
Loss of houses and asset, degradation of
land, decreasing grazing
Page 1 of 1
4

Wereda Disaster
Risk Profile
National Disaster Risk Management
Commission (NDRMC)
Data_Collected_Date
January 1900
Thursday, July 11, 2019
Region S.N.N.P
Zone
SEGEN PEOPLES
Wereda
ALLE SPECIAL
Selected Indicator
Socio Economic Hazards of the Wereda
Hazard_Name
Hazard_Sub_Type
Conflicts
Cause_Of_Hazard
Conflicts
Religious competition
Wereda boundary problem
Effects_Of_Hazard
Hating each other, death of people and
livestock
Page 1 of 1
5
Wereda Disaster
Risk Profile
National Disaster Risk Management
Commission (NDRMC)
Data_Collected_Date
January 1900
Thursday, July 11, 2019
Region S.N.N.P
Zone
SEGEN PEOPLES
Wereda
ALLE SPECIAL
Selected Indicator
Technological Hazards of the Wereda
Hazard_Name
Hazard_Sub_Type
No problem
Cause_Of_Hazard
No Technological hazard
Effects_Of_Hazard
Page 1 of 1
6

Wereda Disaster
Risk Profile
National Disaster Risk Management
Commission (NDRMC)
Data_Collected_Date
January 1900
Thursday, July 11, 2019
Region S.N.N.P
Zone SEGEN PEOPLES
Wereda ALLE SPECIAL
Selected Indictor:
Kebele Name
KERKERT
Disaster Characteristics By Kebele
Disaster_Type Common Period
Year
Worst_ Trends of
Occured Year Effects
Root Causes
Drought
April, May
1977,
2008,
2009,
2007,
2006,
1977,
2008,
2009
Increased
Lack of rain,
deforestation
, increasing
population,
climate
change
Crop Pest
March, April,
May
2002,
2009
2002
Decreased
Vector born
disease
increased
Effects
Shortage of
food, animal
death,
migration of
people
Loss of crop,
reduced
yield of crop
production,
reduced
assets
Vulnerability
Desertification,
depend on rain fed
agriculture
Most farmers
economic depend
on crop production
so that farmers
exposed to food gap
Human
diseases
February
2007
2007
Decreased
Lack of
sanitation
and hygiene,
increased
vector born
disease
Death of
human
Most community use
river, lack of
sanitation, lack of
water , lack of
awareness
Coping Strategy
Use short cycle crop,
use irrigation,
forestation, tracing
watershed program
Reduced pest
manual method by
farmer family
mobilizing, replace
by short season root
and tuber crops, use
chemical and killing
of army worm by
hand
Personal and
environmental
hygiene vaccination,
use clean water
7
Page 1 of 14

Wereda Disaster
Risk Profile
National Disaster Risk Management
Commission (NDRMC)
Data_Collected_Date
January 1900
Thursday, July 11, 2019
Region S.N.N.P
Zone SEGEN PEOPLES
Wereda ALLE SPECIAL
Selected Indictor:
Kebele Name
TURUBA
Disaster Characteristics By Kebele
Disaster_Type Common Period
Drought
February,
March, April
Year
Occured
2007,
2008,
2009
Worst_
Year
2008,
2009
Trends of
Effects
Increased
Root Causes
Lack of rain,
climate
change,
shortage of
grass
Human
diseases
March
Conflicts
May, June
2009
2009
2009
2009
Decreased
Lack of
sanitation,
lack of
hygiene in
local food
Decreased Religious
competition
Effects
Drop out of
school, loss
of crop
production,
season
disturbance,
death of
livestock,
shortage of
food( lack of
food)
Water
Hating each
other
Vulnerability
Farmers depending
on rain fed
agriculture
Households use
river water
Religious
KOLANGO
Drought
January,
February, March
1977,
2006,
2007,
2008,
2009
2009
Increased
Shortage of
rain
Reduction of
crop
production,
death of
livestock,
loss of asset
Farmer depend on
rain feed
agriculture, farmers
depend on livestock
production
Coping Strategy
Mass mobilization of
farmers to prevent
the drought and kill
army worm helping
each other by
sharing resource
Using water
treatment
Negotiation in local
religious
representative
Seeking job
opportunity, sharing
of food and money
each other, water
harvesting
8
Page 2 of 14

Wereda Disaster
Risk Profile
National Disaster Risk Management
Commission (NDRMC)
Data_Collected_Date
January 1900
Thursday, July 11, 2019
Region S.N.N.P
Zone SEGEN PEOPLES
Wereda ALLE SPECIAL
Selected Indictor:
Kebele Name
KOLANGO
Disaster Characteristics By Kebele
Disaster_Type Common Period
Livestock
diseases
April, May
Year
Occured
2009
Worst_
Year
2009
Trends of
Effects
Decreased
Root Causes
Climate
change,
better fly
Human
diseases
April
2009
2009
Decreased No
EYANA
Drought
Flood
February,
March, April,
January
April, May
2000,
2005,
2009
2000,
2005,
2006,
2009
2009
2005
Increased
Decreased
Lack of grain,
lowland
fertility,
deforestation
, lack of
irrigation,
land erosion
Our land is
sandy, our
land has
slope, loss of
grass, no
terracing
farm land,
lack of
natural
resource
management,
deforestation
, over grazing
Effects
Reducing the
crop
production
Death of
human
Death of
livestock,
loss of crop,
selling of
asset
Loss of
fertile soil,
loss of crop
production,
reduced
yield
production
both crops
and animals
Vulnerability
Farmers depend on
sowing cash crop
like maize, sorghum
Go to health center
and take
vaccination
Desert there is no
option to resist the
drought such as
poorest (
beneficiary of PSNP
and relief)
Land expose to
flood area near to
gully, the poorest
people are clear
forest, lack of cut
and carrying
animals feeding
system
Coping Strategy
Use chemicals and
killing with hand
Use vaccination,
keep hygiene
Using irrigation but
not effective due to
resource, using short
season crops, water
harvesting method.
Using terrace,
forestation, using
integrated water and
soil conservation
practices, using
plantation
9
Page 3 of 14

Wereda Disaster
Risk Profile
National Disaster Risk Management
Commission (NDRMC)
Data_Collected_Date
January 1900
Thursday, July 11, 2019
Region S.N.N.P
Zone SEGEN PEOPLES
Wereda ALLE SPECIAL
Selected Indictor:
Kebele Name
LOKITE
Disaster Characteristics By Kebele
Disaster_Type Common Period
Drought
April, May, June
Year
Occured
2001,
2003,
2005,
2007,
2008,
2009
Worst_
Year
2009
Trends of
Effects
Increased
Root Causes
Climate
change,
deforestation
, shortage of
rain
Flood
April
2007
2007
Decreased
Lack of soil
and water
conservation
GUMA
Drought
March, April
2005,
2007,
2009
2009
Increased
Lack of
rainfall,
deforestation
, climate
change
GOROZE
Drought
April. May
Human
May
diseases
2005,
2006,
2007,
2008,
2009
2007
2009
Increased
Lack of rain,
climate
change,
deforestation
Decreased
Lack of
vaccination
during
childhood
Effects
Vulnerability
Lack of food,
death of
livestock
Household depend
on agriculture
production example
livestock and crop
production
Loss of asset,
soil erosion,
house and
other asset
Death of
livestock,
decrease of
crop
production,
disease of
people
Death of
livestock,
lack of food,
failure of
crop
production
Death of
people
House near to river
Farmers depend on
rain feed
agriculture,
livestock production
Household depend
on agriculture,
household depend
on livestock
production
No vaccination
Coping Strategy
Sowing short season
crop, using desert
crops, selling
livestock
Shifting of house and
other assets
Sowing short season
crop, saving and
money and improving
integrated water and
soil conservation (
water harvesting )
afforestation
Select the severely
effected household,
sharing resource
example food,
money, use irrigation
Vaccination and
medicine aid
10
Page 4 of 14

Wereda Disaster
Risk Profile
National Disaster Risk Management
Commission (NDRMC)
Data_Collected_Date
January 1900
Thursday, July 11, 2019
Region S.N.N.P
Zone SEGEN PEOPLES
Wereda ALLE SPECIAL
Selected Indictor:
Kebele Name
GOROZE
Disaster Characteristics By Kebele
Disaster_Type Common Period
Year
Worst_ Trends of
Occured Year Effects
Root Causes
Crop Pest
May
2009
2009
Decreased Climate
change
Flood
DELBENA GAMA
Drought
April, May
May, March,
June
2004,
2006
1977,
1987,
2000,
2007,
2008,
2009
2006
2009
Decreased
There is no
tracing, lack
of water
division
canal, slope
land use for
farm land
Increased
Deforestation
and climate
change
Flood
April, March
1997,
2007
2007
Decreased
High rain and
deforestation
, over grazing
Effects
Vulnerability
Decrease of
crop
production
Decrease
crop
production,
erosion
Most community are
dependent on
agricultural
practice
Farmers use slop
land for farm land
Loss of
animal, loss
of crop,
migrant of
the
community,
shortage and
water and
food
Loss of crop,
loss of house,
soil erosion,
decrease soil
fertility
The community
livelihood depend
on agriculture
Settlement the
community
mountable, most of
farm land ploughing
of step slope land
Coping Strategy
Chemical and
mechanical
Shifting of household
from slope land
Sell more livestock
than usual, seek
alternative or
additional job,
aforestation activity,
plantation
Flood diversion
canal, soil and water
conservation
practices, planting
trees
11
Page 5 of 14

Wereda Disaster
Risk Profile
National Disaster Risk Management
Commission (NDRMC)
Data_Collected_Date
January 1900
Thursday, July 11, 2019
Region S.N.N.P
Zone SEGEN PEOPLES
Wereda ALLE SPECIAL
Selected Indictor:
Kebele Name
DELBENA GAMA
TSEMEHA
Disaster Characteristics By Kebele
Disaster_Type Common Period
Drought
May, April
Year
Occured
1977 up o
2009
Worst_
Year
2009
Trends of
Effects
Increased
Root Causes
Climate
change,
shortage of
rainfall,
favorable
weather
condition for
pest
Landslide
April and
October
1997,
2007
1997
Decreased
The nature of
land, over
cultivation,
over
population
growth,
deforestation
Drought
April, May,
1997,
2007,
2008,
2009
2008
Increased
Climate
change,
deforestation
, lack of rain
Human
diseases
April, May
2002,
2003,
2004,
2005,
2000,
2007,
2009
2002
Decreased
Vector born
disease,
mosquito
Effects
Vulnerability
Loss of crop,
loss of
income,
shortage of
food
Depend on crop
production
Land
degradation,
loss of crop,
leaving of
the resident
area
Nature of the land
structure, poor
watershed
management
practice
Loss of crop ,
loss of
animal,
shortage of
food, water
Death of
human
community depend
on agriculture
production and rain
fed agriculture
The community not
use lentil and until
mosquito chemical,
low sanitation
Coping Strategy
Use pesticides,
chemicals traditional
control method
Water diversion
canal establishment,
community
resettlement area
enclosure, soil and
water conservation
Watershed program,
selling more
livestock than usual,
forestation, avoid
over grazing
Distributed of bed
net use chemical
12
Page 6 of 14

Wereda Disaster
Risk Profile
National Disaster Risk Management
Commission (NDRMC)
Data_Collected_Date
January 1900
Thursday, July 11, 2019
Region S.N.N.P
Zone SEGEN PEOPLES
Wereda ALLE SPECIAL
Selected Indictor:
Kebele Name
TSEMEHA
Disaster Characteristics By Kebele
Disaster_Type Common Period
Year
Worst_ Trends of
Occured Year Effects
Livestock
diseases
April
2004
upto this
year
2004
Increased
Root Causes
ADIS OLETEMA
Drought
April, March
2008,
2009
2008
Increased
Climate
change, lack
of rain
GEWADA
Flood
September
Landslide
September
Drought
December,
January,
February
1998,
2007,
2008
1998,
2007,
2008
2003,
2005,
2007,
2009
2007
Decreased High rain
2007
2009
Decreased
Increased
Land stream,
lack of
natural
resource
practice
Elnino,
deforestation
, climate
change
Effects
Vulnerability
Death of goat
and sheep
Loss of crop,
death of
animal,
shortage of
water and
food
Land
degradation
The people do not
work on
conservation, poor
veterinary service
Most of the
community s
livelihood is
agriculture
Most of community
depend on
agriculture resource
Land
degradation,
loss of crop
house
Most of community
depend on
agriculture resource
Death of
livestock,
shortage of
water and
food, loss of
crops
People ( community
) depend on
agriculture in
rainfall.
Coping Strategy
Vaccination, selling
Migration, selling of
animal is getting
relief
Shifting of house
other place, area
enclosure
Shifting of house
other place, area
closure
Using irrigation,
Strategic usage of
short season crop,
harvesting rain
water, sell more
livestock than usual.
13
Page 7 of 14

Wereda Disaster
Risk Profile
National Disaster Risk Management
Commission (NDRMC)
Data_Collected_Date
January 1900
Thursday, July 11, 2019
Region S.N.N.P
Zone SEGEN PEOPLES
Wereda ALLE SPECIAL
Selected Indictor:
Kebele Name
GEWADA
Disaster Characteristics By Kebele
Disaster_Type Common Period
Flood
March, April,
September.
October
Year
Occured
1994,
2007,
2008
Worst_
Year
2007
Trends of
Effects
Decreased
Root Causes
High rain with
wind,
landscape,
slope of the
land, lack of
soil and
water
conservation
Effects
Erosion,
death of
livestock,
sheep, goat
etc,
destruction
of crops
DIGINTY
Livestock
diseases
Conflicts
Drought
July, August
April, May
2008
1976,
1977,
1986,
2000
1996,
2000,
2005,
2009
2008
Decreased Outbreak of
disease
2000
Decreased
Question of
wereda
boundary
Reduce the
number of
livestock,
loss of
livestock
dairy
production
Death of
people and
livestock
2009
Decreased
Deforestation
, lack of
enough rain
and water for
irrigation
Shortage of
food,
shortage of
water
because of
erratic rain
fall
Vulnerability
People live in the
slope land and
watershed ,
ploughing steep
slope land because
of shortage of
agricultural land
Farmers depend on
livestock
productivity, low
purchasing power of
veterinary drugs
People live in the
border of two
kebele
Most of people of
community depend
on agriculture
production depend
of rainfall
Coping Strategy
Individual protection
like terracing in
sloped land,
continuous plough,
planting grass, soil
and water
conservation,
construction of
gabion
Vaccination, sell
more livestock than
usual
Local king
negotiation,
government support
Deforestation,
forestation practice
reduce number of
eaten in a day etc
14
Page 8 of 14

Wereda Disaster
Risk Profile
National Disaster Risk Management
Commission (NDRMC)
Data_Collected_Date
January 1900
Thursday, July 11, 2019
Region S.N.N.P
Zone SEGEN PEOPLES
Wereda ALLE SPECIAL
Selected Indictor:
Kebele Name
DIGINTY
DEGA MASHELE
Disaster Characteristics By Kebele
Disaster_Type Common Period
Year
Worst_ Trends of
Occured Year Effects
Root Causes
Livestock
diseases
June
2007
2007
Decreased
Lack of
fodder and
water, lack of
pasture,
outbreak of
disease
Conflicts
January
2000
2000
Decreased
Question of
wereda
independency
Drought
Flood
April, March
1973,
1983,
2000,
2005,
2008,
March, October,
April
1999,
2004,
2006
1977
Increased
2004
Decreased High rain
Effects
Vulnerability
Reduce diary
production,
loss of
livestock
Poor veterinary
service (
vaccination),lack of
pasture, unwise use
of pasture land
Conflict
between
kebele and
Tukanu,
death of
people
Loss of crop,
death of
animal,
migration,
shortage of
food
Erosion of
soil, land
degradation,
loss of house,
loss of
animal
Peoples live on the
border of the Alle
wereda linked with
Derashe wereda
Rualo kebele
Depend on
agriculture
Agro ecology of the
kebele land is
mountable
Coping Strategy
Using modern
agriculture extension
program
Use enset as food,
forestation,
watershed program,
selling of animal
Watershed program,
forestation
15
Page 9 of 14

Wereda Disaster
Risk Profile
National Disaster Risk Management
Commission (NDRMC)
Data_Collected_Date
January 1900
Thursday, July 11, 2019
Region S.N.N.P
Zone SEGEN PEOPLES
Wereda ALLE SPECIAL
Selected Indictor:
Kebele Name
DEGA MASHELE
BOLE
Disaster Characteristics By Kebele
Disaster_Type Common Period
Crop diseases
February,
March, April,
May
Year
Occured
1977,
1996, up
to this
year
Worst_
Year
1996
Trends of
Effects
Increased
Root Causes
Unknown
Landslide
April, October
1977,
2006,
2008
1977
Decreased High rain
Drought
March
2004,
2007,
2008,
2009
2008
and
2009
Increased
Climate
change,
deforestation
, lack of rain
Crop Pest
May
2005,
2009
2009
Increased
Vector born
disease
increased
Effects
Vulnerability
Destroyed
enset trees,
loss of coffee
Most of the
community use
enset like food and
depend on coffee
Loss of crop
house
Ecological state
Death of
animal
shortage of
food, lack of
water,
migration of
the
community
Loss of crop,
reduced
yield of crop
yield, crop
production
community
livelihood depend
on agriculture
production practice
Most farmers
economic depend
on crop production
that farmers
exposure to food
gap
Flood
April
2008
2008
Decreased High rain
16
Soil erosion,
loss of crop
Repeatedly
ploughing of slope
land, the area is
highly degraded
area
Coping Strategy
No response
Shifting of house
Use of irrigation,
construction of small
scale irrigation,
watershed terracing
Reduced pest
manual method by
farmer family
mobilizing, replace
short season root
and specialized
seeds and crops
Using chemical and
killing, biological
and physical soil and
water conservation,
afforestation
Page 10 of 14

Wereda Disaster
Risk Profile
National Disaster Risk Management
Commission (NDRMC)
Data_Collected_Date
January 1900
Thursday, July 11, 2019
Region S.N.N.P
Zone SEGEN PEOPLES
Wereda ALLE SPECIAL
Selected Indictor:
Kebele Name
BOLE
Disaster Characteristics By Kebele
Disaster_Type Common Period
Year
Worst_ Trends of
Occured Year Effects
Root Causes
Livestock
diseases
January
2007,
2008
2008
Decreased Outbreak of
disease
GERGEMA
Human
diseases
April. May
Drought
May, April
2001,
2004,
2006,
2007
2004
Decreased Mosquito
1977,
2003,
2005,
2006,
2008,
1977,
2008,
2009
Increased
Deforestation
, climate
change, un
proper use of
land
Effects
Death of
animals, loss
of animal
production,
reduced
diary
production
Death of
human, loss
of asset
Loss of crop,
death of
animal, lack
of water,
shortage of
food, death
of human
Vulnerability
The people can not
conserve animal
health
The community
they have not
health center on
the kebele, the
community not use
bed net
Kebele people
depend on
agriculture
Coping Strategy
Use vaccination,
selling animal than
usual
Providing bed net,
using chemical
Forestation,
irrigation,
establishment, check
dam, water shed
17
Page 11 of 14

Wereda Disaster
Risk Profile
National Disaster Risk Management
Commission (NDRMC)
Data_Collected_Date
January 1900
Thursday, July 11, 2019
Region S.N.N.P
Zone SEGEN PEOPLES
Wereda ALLE SPECIAL
Selected Indictor:
Kebele Name
GERGEMA
Disaster Characteristics By Kebele
Disaster_Type Common Period
Landslide
October, April
Year
Occured
1966,
2000,
2008
Worst_
Year
2000
Trends of
Effects
Decreased
Root Causes
Deforestation
, nature of
land
Flood
April, October
2002,
2005
2005
Decreased deforestation
Livestock
diseases
Crop Pest
April, January
May
1997,
2002,
2008,
2009
2009
2008
Increased Rain
2009
Decreased Unknown
Effects
Vulnerability
Loss of land,
loss of house,
create
conflict,
death of
animal,
destroyed
coffee and
tree
Soil erosion,
loss of crop,
degradation
of land,
decreasing
grazing
Death of
animal
The settlement of
mountable and
stream in nature
Mountable area
Do not take
vaccination of
cattle
Loss of crop
Agricultural
producers
Coping Strategy
Shifting of house to
other place
Water diversion
canal, watershed,
tracing
Vaccination
Use chemical and kill
it by hand
18
Page 12 of 14
Wereda Disaster
Risk Profile
National Disaster Risk Management
Commission (NDRMC)
Data_Collected_Date
January 1900
Thursday, July 11, 2019
Region S.N.N.P
Zone SEGEN PEOPLES
Wereda ALLE SPECIAL
Selected Indictor:
Kebele Name
DUGULO
Disaster Characteristics By Kebele
Disaster_Type Common Period
Drought
February, March
Year
Occured
2004,
2005,
2006,
2007,
2008,
2009
Worst_
Year
2009
Trends of
Effects
Increased
Root Causes
Climate
change,
shortage of
rain,
unseasonal
rainfall
LALCHO
Drought
Landslide
March, April,
May
April, October
1977,
1998,
2007,
2008,
2009
2002,
2007,
2008
2007
2008
Increased
Loss of crop
death, death
of animal
shortage of
food
Decreased
The kebele
land
mountable
and nature of
land
Effects
Death of
livestock,
food
insecurity,
failure of
crop
production,
change of
weather
resource,
loss of
natural
resource
Loss of crop
death of
animal,
shortage of
food
Loss of crop
soil erosion,
loss of house
Vulnerability
Farmers depend on
livestock and crop
production
Community
livelihood depend
on agriculture
farming
The community
settlement,
mountain land
Coping Strategy
Short season crop
sowing, helping each
other by sharing
resource like food
Watershed program,
forestation
Shifting of house,
water canal
diversion forestation
19
Page 13 of 14

Wereda Disaster
Risk Profile
National Disaster Risk Management
Commission (NDRMC)
Data_Collected_Date
January 1900
Thursday, July 11, 2019
Region S.N.N.P
Zone SEGEN PEOPLES
Wereda ALLE SPECIAL
Selected Indictor:
Kebele Name
LALCHO
Disaster Characteristics By Kebele
Disaster_Type Common Period
Flood
April, October
Year
Occured
2005,
2007
Worst_
Year
2008
Trends of
Effects
Decreased
Root Causes
Deforestation
, high rain
Crop diseases
January,
September,
April, May ,
February
1989,
1992,
2000,
2001,
2008,
2009
1992,
2010
Increased
Climate
change
IMPORTANT: The years and months mentoned in this report are according to Ethiopian Calendar (EC).
Effects
Vulnerability
Loss of crop,
loss of
animal, loss
of house, soil
erosion
Loss of
coffee plant,
loss of enset
plant
Depend on
agricultural
production
livelihood and
settlement
mountable
All the community
planting coffee and
enset
Coping Strategy
Water diversion
canal, shifting water
tracing watershed
program
There is any
mitigation measure
20
Page 14 of 14

Wereda Disaster
Risk Profile
Data_Collected_Date
January 1900
Region S.N.N.P
Zone SEGEN PEOPLES
Selected Indictor:
KebeleName
KERKERT
TURUBA
Hazards: Conflict as an Issue
Description_Of_Conflict
Conflict with other wereda by the boundary of
the land
School and group of farmers
KOLANGO
EYANA
Conflict with boundary of land
Level of conflict on farm land and water shade
because of drought
LOKITE
There is conflict
GUMA
GOROZE
DELBENA GAMA
TSEMEHA
ADIS OLETEMA
GEWADA
There is no conflict
There is no conflict
Conflict forest
Conflict with other wereda by the boundary of
land
Level of conflict is medium
Less of conflict on public forest and pasture
National Disaster Risk Management
Commission (NDRMC)
Thursday, July 11, 2019
Wereda ALLE SPECIAL
Change_In_Last_Decade
In this year decreased
Loss of fodder and loss of farm land
Decrease
Increase in last decade
There is no conflict but it caused by
drought or climate change
Main_Causes_Of_Conflict
Boundary of neighboring
wereda create conflict
Farm land to school
construction
Boundary
Shortage of grass and
pasture land and grazing
livestock on watershed
Watershed demarcation
and delimitation and
grazing land seeking
Increasing
Decreased
Decreasing
No change
Deforestation of forest
Un demarcated land
Land resource and grazing
land shortage
Reduce of pasture and
expansion of water area
demarcation
21
Page 1 of 2
Wereda Disaster
Risk Profile
Data_Collected_Date
January 1900
Region S.N.N.P
Zone SEGEN PEOPLES
Selected Indictor:
KebeleName
DIGINTY
Hazards: Conflict as an Issue
Description_Of_Conflict
No change in resource but in political issues
DEGA MASHELE
BOLE
GERGEMA
DUGULO
LALCHO
Conflict to other the sake of wereda asking
establishment
Medium level of conflict
Land conflict
With other kebele
National Disaster Risk Management
Commission (NDRMC)
Thursday, July 11, 2019
Wereda ALLE SPECIAL
Change_In_Last_Decade
Freedom of the language and
culture for Alle nations
Wereda establishment , conflict
decreased
No change
Charging the people
Decrease
Main_Causes_Of_Conflict
Question of wereda ( the
question) Alle people
respect Alle wereda
administration and
dependently
To establish wereda alone
Alle ethnics group
Because of land shortage
Owner of land
Burden of two kebeles
22
Page 2 of 2

Wereda Disaster Risk
Profile
Data_Collected_Date
January 1900
National Disaster Risk Management
Commission (NDRMC)
Thursday, July 11, 2019
Region S.N.N.P
Zone
SEGEN PEOPLES
Wereda
ALLE SPECIAL
Selected Indicator: Hazard Situation During Last Disaster - Characteristics of most recent disasters that affected the community
KebeleName
Types of Disasters
Hazard_Description
Effect_Of_Disaster
Most_Severly_Affected
Reason
KERKERT
Drought
TURUBA
Drought
KOLANGO
Drought
EYANA
LOKITE
Drought
Drought
The most kebele community are
affected by drought during the last 3
year from this year the worst year in
2008 in this year most farmers asset
( crop and animals) are lost by
drought
The disaster mostly affected poorest
household depend on crop production
and livestock production and increase
year to year started from 2005 - 2009
The last 3 years drought affects
animal and human
Is very sever of last four year still this
year and increase year to year.
Highly affect the poorest household
by losing asset, death of livestock,
failure of crop production and leads
migration
Loss of asset, shortage
of food, lose of crop,
death of animal
All kebele community
are affected specially
children and women are
the most affected
Death of livestock,
decrease number of
livestock, lack of
food, loss of asset
Decrease of crop, loss
of animal production,
death of animal
shortage of food,
increasing disease
The household poorest
out of PSNP and other
aid and depend on crop
production
All people livelihood
depend on agriculture
The poorest household
Negative effect like
migration, lack of
food and pasture as
well as market
failures on livestock
The poorest depend on
agriculture activities
Because they have
low capacity to
cope the impact of
disaster and also
economically very
poor society.
The poorest
households have
not other option
and potential to
resist the disaster
People livelihood
depend on
agriculture
They have not
resource to resist
the disaster
They are most
vulnerable for
disaster
23
Page 1 of 4
Wereda Disaster Risk
Profile
Data_Collected_Date
January 1900
National Disaster Risk Management
Commission (NDRMC)
Thursday, July 11, 2019
Region S.N.N.P
Zone
SEGEN PEOPLES
Wereda
ALLE SPECIAL
Selected Indicator: Hazard Situation During Last Disaster - Characteristics of most recent disasters that affected the community
KebeleName
GUMA
GOROZE
DELBENA GAMA
TSEMEHA
Types of Disasters
Drought
Drought
Drought
Drought
Hazard_Description
Worst in 2009 due to lack of food and
lack of water for livestock and pure
water for drink for people
Moderate and started for 2004 - 2009
In this year most of animal died and
must of crops destroyed
Since 1997 up to this year the
drought many animal death and loss
of crops
Effect_Of_Disaster
Death of livestock,
loss of asset
Loss of asset,
economic hardship,
decrease of livestock,
food insecurity
Loss of crop and loss
of asset
Loss of crops, death of
animal
Most_Severly_Affected
Most farmer depend of
rain fed crop production
and livestock production
Poorest
Most of affected
children and women
All kebele community
are affected specially
children and mothers are
the most affected
Reason
Their daily
activities depend
on agriculture
production and they
have not additional
option income
generating
activities
They have not other
option
The children and
women s have low
capacity to resist of
the drought.
The reason most of
children and
mother can not
resist the effects
the people no other
opportunity with
out agriculture
livelihood depend
on farming and
livestock.
24
Page 2 of 4
Wereda Disaster Risk
Profile
Data_Collected_Date
January 1900
National Disaster Risk Management
Commission (NDRMC)
Thursday, July 11, 2019
Region S.N.N.P
Zone
SEGEN PEOPLES
Wereda
ALLE SPECIAL
Selected Indicator: Hazard Situation During Last Disaster - Characteristics of most recent disasters that affected the community
KebeleName
ADIS OLETEMA
GEWADA
DIGINTY
DEGA MASHELE
BOLE
Types of Disasters
Drought
Drought
Drought
Drought
Drought
Hazard_Description
In this year many animal death, crop
loss and assets of the community
diminished
Increase year to year from last year
still 2009
Effect_Of_Disaster
Loss of crops and
death of animals
Loss of asset
Severely affect for last four years
Lack of food and
shortage of pasture,
death of animals
In one year 300 livestock dead
Since 2004 the drought affected
human and animal
Loss of crop death of
livestock and
migration of people
Loss of crops, animal
death, lack of food,
loss of asset
25
Most_Severly_Affected
All the community have
not enset plant
People live in kalama
community who are the
poorest in community
Most of affected
children and lactating
mothers
Most of the community
affected specially
children are more
affected
Reason
All the people
livelihood depend
on agriculture
production.
There income
generation activity
depend on
agriculture
production.
They have not
enough asset to
resist the disaster,
they have not other
option to resist the
disaster by shifting
to other community
/ kebele the nature
of agro ecology in
the kebele
Most of people
livelihood depend
on agricultural
production
The children low
capacity to resist
the drought
Page 3 of 4

Wereda Disaster Risk
Profile
Data_Collected_Date
January 1900
National Disaster Risk Management
Commission (NDRMC)
Thursday, July 11, 2019
Region S.N.N.P
Zone
SEGEN PEOPLES
Wereda
ALLE SPECIAL
Selected Indicator: Hazard Situation During Last Disaster - Characteristics of most recent disasters that affected the community
KebeleName
Types of Disasters
Hazard_Description
Effect_Of_Disaster
Most_Severly_Affected
Reason
GERGEMA
Drought
DUGULO
LALCHO
Drought
Drought
Since 2003 still now most kebele
community are affected by drought
from this year the worst year is 2008
and 2009.
Increase through year to year last
five year up to 2009
May animal and a lot of crops loss in
this year
Loss of asset, shortage
of food, loss of crop
production death and
animals.
Children and mothers.
Decrease number of
livestock, decrease
crop production,
Migration
Loss of crops, animal
and loss of asset
Farmer depend on
agriculture product
Children and mothers
Because of they are
not to cope the
impact of disaster
and also
economically very
poor society.
Shortage of
irrigation water,
there is no other
income generation
activity
Most of the children
and mothers low
capacity to resist
the drought.
26
Page 4 of 4
Data_Collected_Date
January 1900
Region S.N.N.P
Zone SEGEN PEOPLES
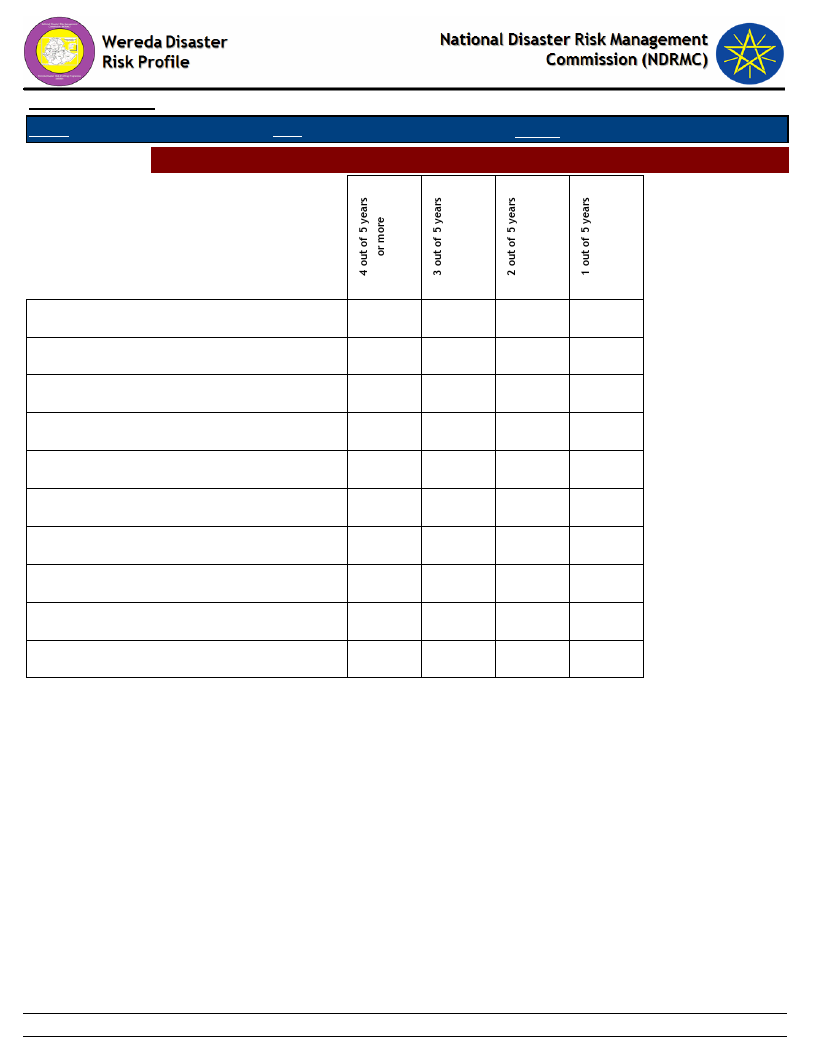
Selected Indictor: Frequency of Disaster Occurrence
Wereda
Thursday, July 11, 2019
ALLE SPECIAL
Conflicts
Crop diseases
Drought
Flood
Frost / Cold waves
Heavy Rain
Human diseases
Landslide
Livestock diseases
Storms / hail storm
14.29
22.44
70.00
8.70
14.29
38.46
41.35
50.00
30.00
33.33
39.13
16.67
33.33
42.86
30.77
18.91
33.33
100.00
50.00
26.09
83.33
33.33
28.57
30.77
16.99
16.67
16.67
26.09
33.33
27
Page 1 of 1
Data_Collected_Date
January 1900
Region S.N.N.P
Zone SEGEN PEOPLES
Selected Indictor: Household Exposure to Hazards
Thursday, July 11, 2019
Wereda ALLE SPECIAL
Disaster Type
Drought
General_Exposure
85.64
Last_Five_Years_Exposure
80.51
Landslide
3.59
5.90
Crop diseases
2.82
3.33
Human diseases
2.05
1.54
Livestock diseases
1.79
1.54
Flood
1.54
1.54
Conflicts
1.28
1.79
Frost / Cold waves
0.77
2.56
Heavy Rain
0.26
0.51
Storms / hail storm
0.26
0.77
28
Page 1 of 1
Wereda Disaster
Risk Profile
Data_Collected_Date
January 1900
Region S.N.N.P
Selected Indictor:
Zone SEGEN PEOPLES
Months of Occurrence of Frequent Disasters
National Disaster Risk Management
Commission (NDRMC)
Thursday, July 11, 2019
Wereda ALLE SPECIAL
Conflicts
Crop diseases
Drought
Flood
Frost / Cold waves
Heavy Rain
Human diseases
Landslide
Livestock diseases
Storms / hail storm
14.29
57.14
14.29
14.29
15.38
23.08
61.54
0.32
4.50
3.54
2.57
17.68
18.65
28.94
9.32
12.86
0.96
0.64
16.67
16.67
66.67
11.11
44.44
11.11
33.33
50.00
50.00
20.00
20.00
40.00
20.00
8.70
21.74
39.13
8.70
13.04
8.70
50.00
16.67
16.67
16.67
66.67
33.33
29
Page 1 of 1
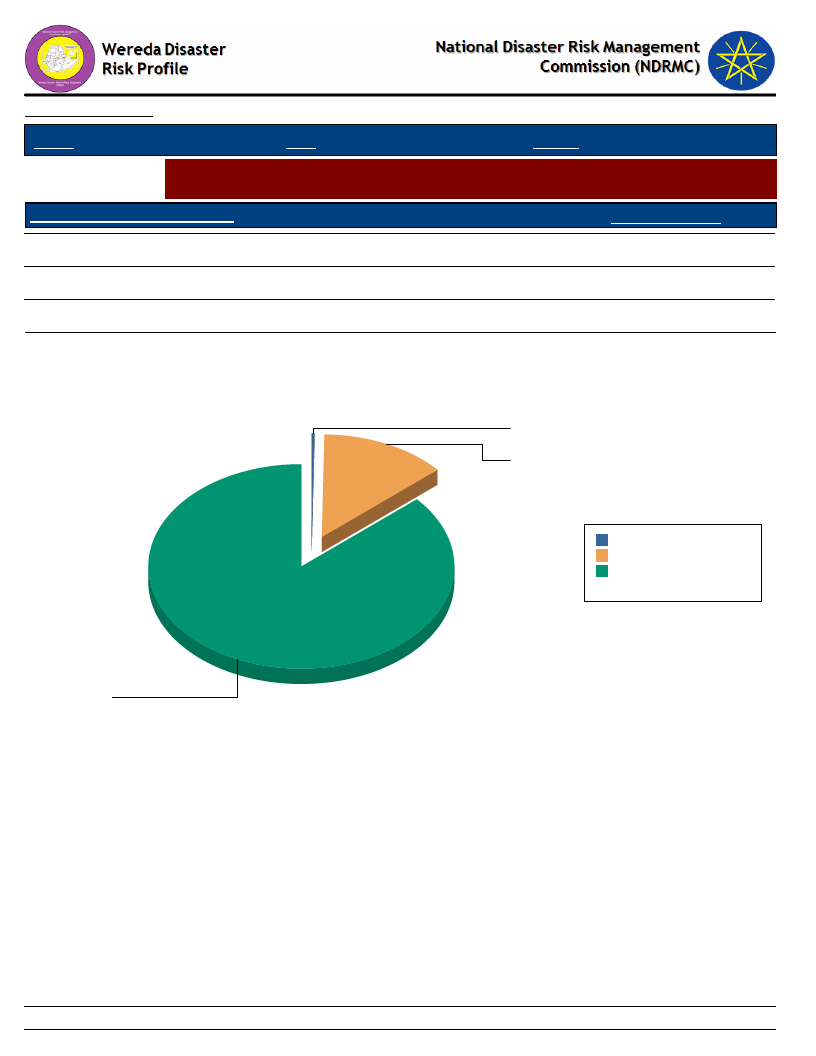
Data_Collected_Date January 1900
Thursday, July 11, 2019
Region S.N.N.P
Zone SEGEN PEOPLES
Wereda ALLE SPECIAL
Selected Indictor:
Conflicts: Perception of households on conflict issues - Is conflict an issue in this
community?
Is Conflict an Issue in Community?
Response_Percent
Yes
86.38
No
13.37
DK
0.26
Is Conflict an Issue in Community?
DK
0.3
No
13.4
DK
0.3 0.3%
No 13.4 13.4%
Yes 86.4 86.4%
Total: 100.0 100.0%
Yes
86.4
30
Page 1 of 1
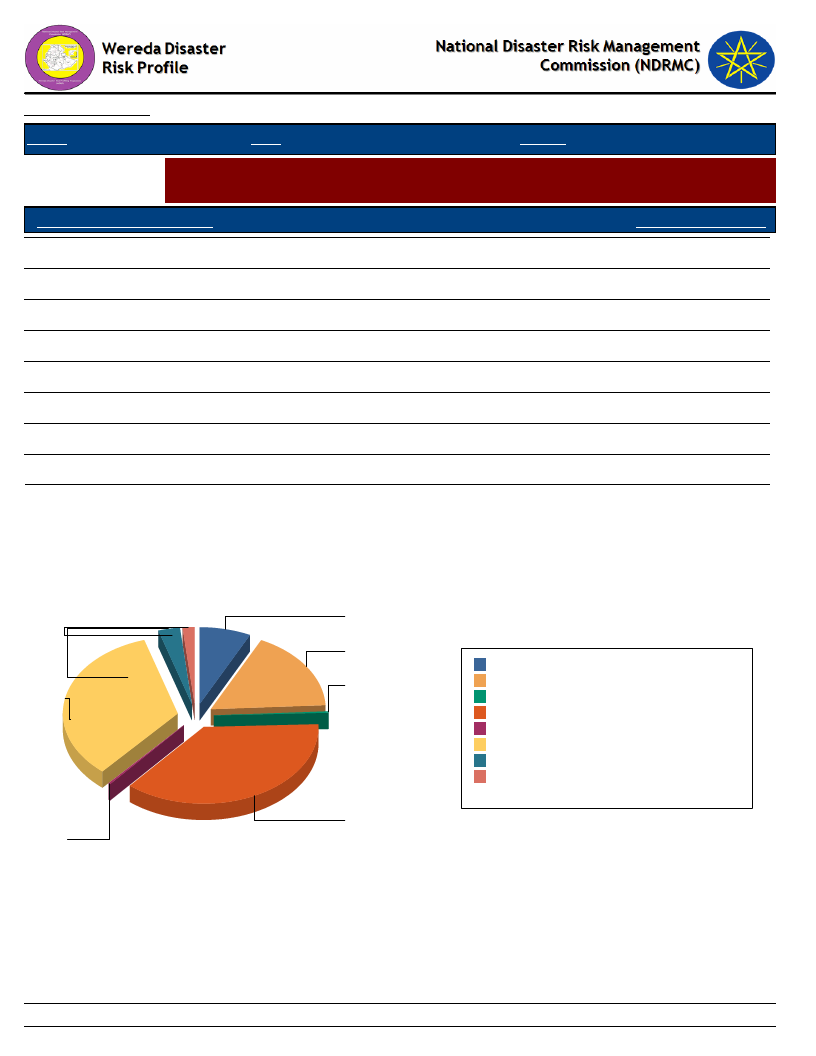
Data_Collected_Date
Region S.N.N.P
January 1900
Zone SEGEN PEOPLES
Thursday, July 11, 2019
Wereda ALLE SPECIAL
Selected Indictor:
Conflicts: Perception of households on conflict issues - Who To Turn To in case of
Conflict?
Who To Turn During Conflict?
Response_Percentage
Family members
0.30
Elders
16.96
Amakaris
7.14
Wereda administration
1.79
Police
33.93
Militia
36.61
Regional representatives
2.98
Other
0.30
Who To Turn During Conflict?
Wereda administration
2
Regional
representatives
3
Police
34
Other
0
Amakaris
7
Elders
17
Family members
0
Militia
37
Amakaris
Elders
Family members
Militia
Other
Police
Regional representatives
Wereda administration
7 7.1%
17 17.0%
0 0.3%
37 36.6%
0 0.3%
34 33.9%
3 3.0%
2 1.8%
Total:
100 100.0%
31
Page 1 of 1
Data_Collected_Date
Region S.N.N.P
January 1900
Zone SEGEN PEOPLES
Thursday, July 11, 2019
Wereda ALLE SPECIAL
Selected Indictor: Losses from Disasters - Losses from all disasters (household response in %)
Type of Loss
Main_Loss_Percent
Secondary_Loss_Percent
Physical damages on houses and property
9.49
6.23
Crop damage
62.82
7.86
Livestock damage
10.77
6.23
Death of household members
2.31
3.52
Illness/health problems
1.79
2.98
Loss of access to social services, including school
2.31
1.08
Loss of income
4.87
44.99
Loss of savings
1.03
1.36
Lost access to grazing land
1.03
7.32
Lost access to water source
2.31
12.47
Had to flee/change residence area
1.03
3.25
Other losses/damages
0.00
2.71
32
Page 1 of 1
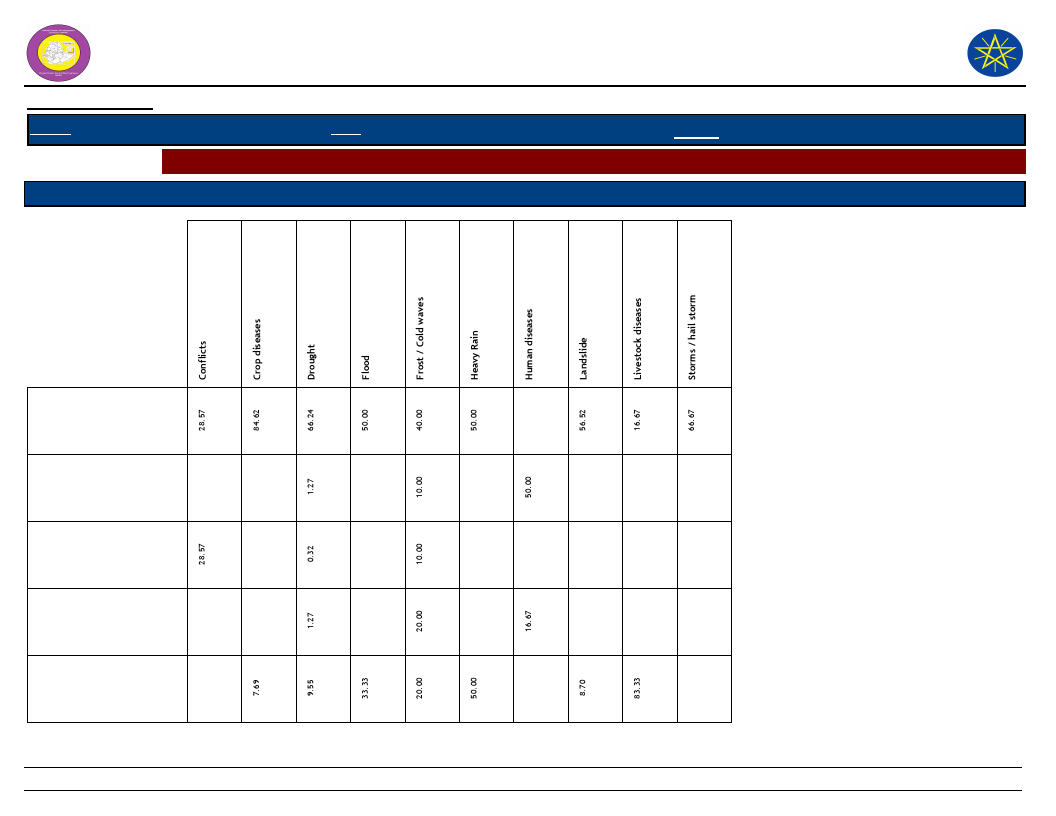
Wereda Disaster
Risk Profile
National Disaster Risk Management
Commission (NDRMC)
Data_Collected_Date
Region S.N.N.P
January 1900
Zone SEGEN PEOPLES
Wereda ALLE SPECIAL
Thursday, July 11, 2019
Selected Indictor: Losses from Disasters - Main Losses by Type of Disasters (household response in %)
Type of Loss
Type of Disasters which mainly caused Listed Losses
Crop damage
Death of household
members
Had to flee/change
residence area
Illness/health problems
Livestock damage
33
Page 1 of 3

Wereda Disaster
Risk Profile
National Disaster Risk Management
Commission (NDRMC)
Data_Collected_Date
Region S.N.N.P
January 1900
Zone SEGEN PEOPLES
Wereda ALLE SPECIAL
Thursday, July 11, 2019
Selected Indictor: Losses from Disasters - Main Losses by Type of Disasters (household response in %)
Type of Loss
Type of Disasters which mainly caused Listed Losses
Livestock were stolen
Loss of access to social
services, including
school
Loss of income
Loss of savings
Lost access to grazing
land
34
Page 2 of 3
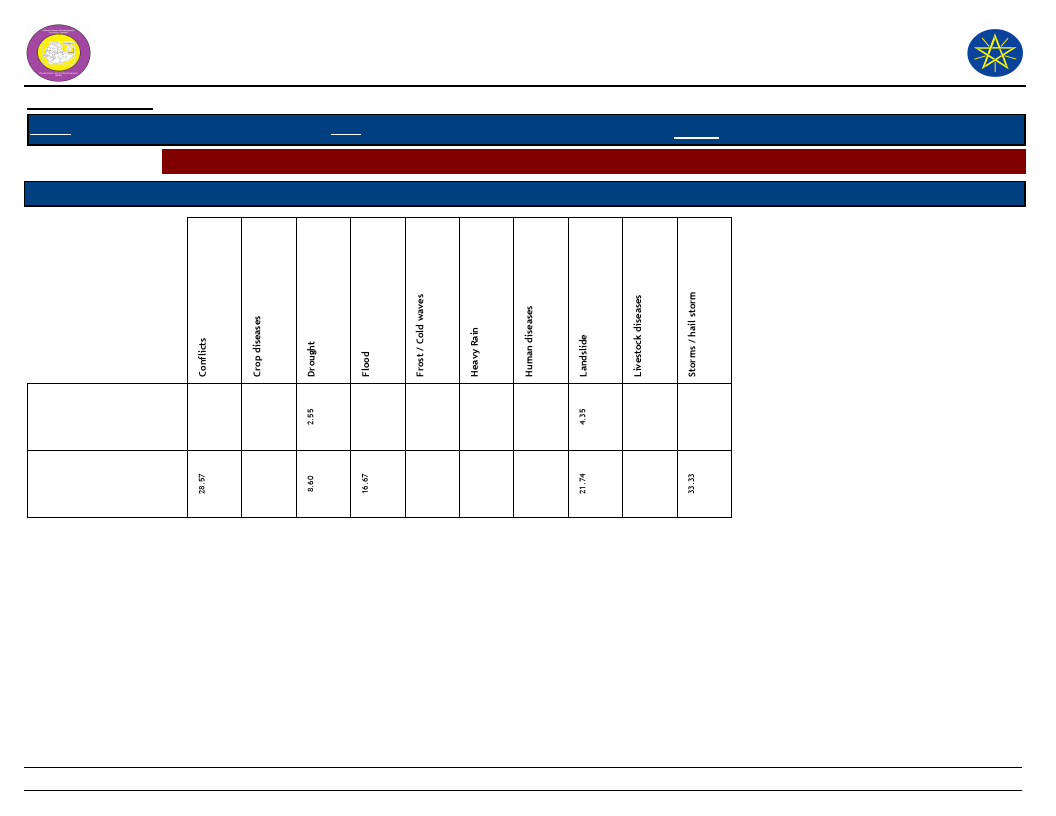
Wereda Disaster
Risk Profile
National Disaster Risk Management
Commission (NDRMC)
Data_Collected_Date
Region S.N.N.P
January 1900
Zone SEGEN PEOPLES
Wereda ALLE SPECIAL
Thursday, July 11, 2019
Selected Indictor: Losses from Disasters - Main Losses by Type of Disasters (household response in %)
Type of Loss
Type of Disasters which mainly caused Listed Losses
Lost access to water
source
Physical damages on
houses and property
35
Page 3 of 3

Wereda Disaster Risk
Profile
Data_Collected_Date
Region S.N.N.P
January 1900
Zone SEGEN PEOPLES
National Disaster Risk Management
Commission (NDRMC)
Wereda ALLE SPECIAL
Thursday, July 11, 2019
Selected Indictor: Losses from Disasters - Secondary Losses by Type of Disasters (household response in %)
Type of Loss
Type of Disasters which caused Listed Secondary Losses
Crop damage
Death of household
members
Had to flee/change
residence area
Illness/health problems
Livestock damage
14.29
8.75
28.57
2.69
40.00
2.02
22.22
8.33
1.35
6.73
11.11
4.55
16.67
18.18
50.00
13.64
4.55
36
33.33
33.33
Page 1 of 3

Wereda Disaster Risk
Profile
Data_Collected_Date
Region S.N.N.P
January 1900
Zone SEGEN PEOPLES
National Disaster Risk Management
Commission (NDRMC)
Wereda ALLE SPECIAL
Thursday, July 11, 2019
Selected Indictor: Losses from Disasters - Secondary Losses by Type of Disasters (household response in %)
Type of Loss
Type of Disasters which caused Listed Secondary Losses
Loss of access to social
services, including school
Loss of income
Loss of savings
Lost access to grazing land
Lost access to water source
8.33
1.01
28.57
50.00
47.47
40.00
55.56
100.00
16.67
1.01
8.33
6.73
15.15
37
18.18
66.67
27.27
16.67
Page 2 of 3
Wereda Disaster Risk
Profile
Data_Collected_Date
Region S.N.N.P
January 1900
Zone SEGEN PEOPLES
National Disaster Risk Management
Commission (NDRMC)
Wereda ALLE SPECIAL
Thursday, July 11, 2019
Selected Indictor: Losses from Disasters - Secondary Losses by Type of Disasters (household response in %)
Type of Loss
Type of Disasters which caused Listed Secondary Losses
Other losses/damages
Physical damages on houses
and property
14.29
8.33
1.35
11.11
14.29
5.72
20.00
33.33
4.55
9.09
16.67
33.33
38
Page 3 of 3

Wereda Disaster
Risk Profile
Data_Collected_Date
January 1900
National Disaster Risk Management
Commission (NDRMC)
Thursday, July 11, 2019
Region S.N.N.P
Zone SEGEN PEOPLES
Wereda ALLE SPECIAL
Selected Indictor: Seasonal Calendar for Hazards, Activities and Income Level By Kebele
Month of Hazard
Major_Problems /Disasters
Hazard Severity
Rank
Agricultural_Activities
Kebele Name ADIS OLETEMA
E - Jan (Tir)
Shortage of grazing land
2
Harvesting
Income
Level Rank
1st
F - Feb (Yekatit)
Lack of water
2
Harvesting
2nd
G - Mar (Megabit)
Shortage of food
2
Crop sowing
4th
H - Apr (Meazea)
Drought
3
Weeding
12th
I - May (Ginbot)
Shortage of food
3
Weeding
11th
J - Jun (Sene)
---------
Control crop
10th
K - Jul (Hamle)
---------
Land preparation
9th
L - Aug (Nehase)
---------
Crop sowing
8th
A - Sep (Meskerem)
Human disease
1
crop sowing
3rd
B - Oct (Tikimt)
Shortage of food
2
Weeding
7th
C - Nov (Hidar)
---------
Weeding
6th
D - Dec (Tahsas)
---------
5th
NOTE: Hazard Severity Rank helps prioritize the more severe hazards that have occurred in the months of disaster occurrence, 3 being the worst and 1
the least severe hazards.
39
Page 1 of 17

Wereda Disaster
Risk Profile
Data_Collected_Date
January 1900
National Disaster Risk Management
Commission (NDRMC)
Thursday, July 11, 2019
Region S.N.N.P
Zone SEGEN PEOPLES
Wereda ALLE SPECIAL
Selected Indictor: Seasonal Calendar for Hazards, Activities and Income Level By Kebele
Month of Hazard
Major_Problems /Disasters
Hazard Severity
Rank
Agricultural_Activities
Kebele Name BOLE
E - Jan (Tir)
Shortage of food and water
1
Livestock production
Income
Level Rank
4th
F - Feb (Yekatit)
Livestock disease, lack of fodder and water
3
crop sowing
8th
G - Mar (Megabit)
Human disease
---------
Crop sowing
10th
H - Apr (Meazea)
Drought
3
Weeding
12th
I - May (Ginbot)
Livestock disease
1
Weeding
12th
J - Jun (Sene)
---------
Keeping crop from pest
11th
K - Jul (Hamle)
---------
Harvesting
1st
L - Aug (Nehase)
---------
Land preparation
12th
A - Sep (Meskerem)
---------
Crop sowing
10th
B - Oct (Tikimt)
---------
Livestock production
2nd
C - Nov (Hidar)
Lack of food
3
Livestock production
3rd
D - Dec (Tahsas)
---------
Livestock production
4th
NOTE: Hazard Severity Rank helps prioritize the more severe hazards that have occurred in the months of disaster occurrence, 3 being the worst and 1
the least severe hazards.
40
Page 2 of 17

Wereda Disaster
Risk Profile
Data_Collected_Date
January 1900
National Disaster Risk Management
Commission (NDRMC)
Thursday, July 11, 2019
Region S.N.N.P
Zone SEGEN PEOPLES
Wereda ALLE SPECIAL
Selected Indictor: Seasonal Calendar for Hazards, Activities and Income Level By Kebele
Month of Hazard
Major_Problems /Disasters
Hazard Severity
Rank
Agricultural_Activities
Kebele Name DEGA MASHELE
E - Jan (Tir)
Shortage of grazing land
3
Harvesting, livestock activities
Income
Level Rank
1st
F - Feb (Yekatit)
---------
Harvesting
2nd
G - Mar (Megabit)
Shortage of food
2
Crop sowing
4th
H - Apr (Meazea)
Shortage of food, lack of grazing land
3
Weeding
12th
I - May (Ginbot)
Animal disease, shortage of food
3
Weeding
11th
J - Jun (Sene)
---------
Weeding
10th
K - Jul (Hamle)
---------
Livestock activity
9th
L - Aug (Nehase)
---------
Land preparation
8th
A - Sep (Meskerem)
---------
Land preparation
3rd
B - Oct (Tikimt)
Lack of food
2
Crop sowing
7th
C - Nov (Hidar)
---------
Crop sowing
6th
D - Dec (Tahsas)
---------
weeding
5th
NOTE: Hazard Severity Rank helps prioritize the more severe hazards that have occurred in the months of disaster occurrence, 3 being the worst and 1
the least severe hazards.
41
Page 3 of 17

Wereda Disaster
Risk Profile
Data_Collected_Date
January 1900
National Disaster Risk Management
Commission (NDRMC)
Thursday, July 11, 2019
Region S.N.N.P
Zone SEGEN PEOPLES
Wereda ALLE SPECIAL
Selected Indictor: Seasonal Calendar for Hazards, Activities and Income Level By Kebele
Month of Hazard
Major_Problems /Disasters
Hazard Severity
Rank
Agricultural_Activities
Kebele Name DELBENA GAMA
E - Jan (Tir)
Shortage of animal fodder
1
Livestock activity
Income
Level Rank
4th
F - Feb (Yekatit)
Shortage of water
2
Land preparation
5th
G - Mar (Megabit)
Shortage of water
3
Crop sowing
6th
H - Apr (Meazea)
---------
Weeding
11th
I - May (Ginbot)
Shortage of food of human disease
2
Weeding
1st
J - Jun (Sene)
3
Harvesting
1st
K - Jul (Hamle)
---------
Harvesting and land preparation
1st
L - Aug (Nehase)
---------
Crop sowing
1st
A - Sep (Meskerem)
---------
Weeding
1st
B - Oct (Tikimt)
---------
Weeding
1st
C - Nov (Hidar)
---------
Controlling the crop
1st
D - Dec (Tahsas)
---------
Harvesting
1st
NOTE: Hazard Severity Rank helps prioritize the more severe hazards that have occurred in the months of disaster occurrence, 3 being the worst and 1
the least severe hazards.
42
Page 4 of 17

Wereda Disaster
Risk Profile
Data_Collected_Date
January 1900
National Disaster Risk Management
Commission (NDRMC)
Thursday, July 11, 2019
Region S.N.N.P
Zone SEGEN PEOPLES
Wereda ALLE SPECIAL
Selected Indictor: Seasonal Calendar for Hazards, Activities and Income Level By Kebele
Month of Hazard
Major_Problems /Disasters
Hazard Severity
Rank
Agricultural_Activities
Kebele Name DIGINTY
E - Jan (Tir)
Lack of water, lack of grass ( pasture )
2
Harvesting/ livestock activities
Income
Level Rank
2nd
F - Feb (Yekatit)
Lack of water for irrigation, shortage of pasture
2
Preparation of land
5th
G - Mar (Megabit)
---------
Preparation and sowing crop
6th
H - Apr (Meazea)
---------
weeding
7th
I - May (Ginbot)
Flood, lack of food, warm
2
weeding
8th
J - Jun (Sene)
Fever ( death ) decrease of crop ( warm ) rust
3
Harvesting
12th
K - Jul (Hamle)
---------
Harvesting and preparation
1st
L - Aug (Nehase)
---------
Preparation of land
4th
A - Sep (Meskerem)
---------
sowing of crop
11th
B - Oct (Tikimt)
---------
Sowing of crop
9th
C - Nov (Hidar)
---------
weeding
10th
D - Dec (Tahsas)
---------
Green harvesting
3rd
NOTE: Hazard Severity Rank helps prioritize the more severe hazards that have occurred in the months of disaster occurrence, 3 being the worst and 1
the least severe hazards.
43
Page 5 of 17

Wereda Disaster
Risk Profile
Data_Collected_Date
January 1900
National Disaster Risk Management
Commission (NDRMC)
Thursday, July 11, 2019
Region S.N.N.P
Zone SEGEN PEOPLES
Wereda ALLE SPECIAL
Selected Indictor: Seasonal Calendar for Hazards, Activities and Income Level By Kebele
Month of Hazard
Major_Problems /Disasters
Hazard Severity
Rank
Agricultural_Activities
Kebele Name DUGULO
E - Jan (Tir)
Shortage of water and pasture
2
Preparation of land
Income
Level Rank
2nd
F - Feb (Yekatit)
Increase the shortage of water an food
3
Preparation
3rd
G - Mar (Megabit)
Shortage of pasture and food as well as water
---------
Crop sowing
4th
H - Apr (Meazea)
Livestock disease
---------
Weeding
5th
I - May (Ginbot)
Flood, shortage of food, pests, army worm
---------
Weeding
6th
J - Jun (Sene)
Damaging of crops and livestock rain and wind
---------
Green harvesting
7th
K - Jul (Hamle)
Crop disease
---------
Harvesting
8th
L - Aug (Nehase)
Unseasonal rain
---------
Harvesting and sowing of crop
9th
A - Sep (Meskerem)
Failure of production
---------
Crop sowing
10th
B - Oct (Tikimt)
-
---------
Weeding
11th
C - Nov (Hidar)
---------
Harvesting
12th
D - Dec (Tahsas)
---------
Harvest
1st
NOTE: Hazard Severity Rank helps prioritize the more severe hazards that have occurred in the months of disaster occurrence, 3 being the worst and 1
the least severe hazards.
44
Page 6 of 17

Wereda Disaster
Risk Profile
Data_Collected_Date
January 1900
National Disaster Risk Management
Commission (NDRMC)
Thursday, July 11, 2019
Region S.N.N.P
Zone SEGEN PEOPLES
Wereda ALLE SPECIAL
Selected Indictor: Seasonal Calendar for Hazards, Activities and Income Level By Kebele
Month of Hazard
Major_Problems /Disasters
Hazard Severity
Rank
Agricultural_Activities
Kebele Name EYANA
E - Jan (Tir)
lack of water, lack of grass for grazing
1
Livestock activities
Income
Level Rank
4th
F - Feb (Yekatit)
Lack of water, lack of grass ( pasture)
1
Land preparation
5th
G - Mar (Megabit)
Livestock disease
1
Land preparation and crop sowing
6th
H - Apr (Meazea)
Livestock disease
1
Crop sowing and weeding
7th
I - May (Ginbot)
Lack of food of human/ fall army worm
1
Weeding
8th
J - Jun (Sene)
Lack of food and fever, diarrhea
1
Harvesting
1st
K - Jul (Hamle)
Fall army worm, rust
1
Harvesting and land preparation
2nd
L - Aug (Nehase)
1
Land preparation and crop sowing
10th
A - Sep (Meskerem)
1
Crop sowing and weeding
9th
B - Oct (Tikimt)
1
Weeding and harvesting
4th
C - Nov (Hidar)
1
Harvesting and livestock activity
3rd
D - Dec (Tahsas)
1
livestock activity
4th
NOTE: Hazard Severity Rank helps prioritize the more severe hazards that have occurred in the months of disaster occurrence, 3 being the worst and 1
the least severe hazards.
45
Page 7 of 17

Wereda Disaster
Risk Profile
Data_Collected_Date
January 1900
National Disaster Risk Management
Commission (NDRMC)
Thursday, July 11, 2019
Region S.N.N.P
Zone SEGEN PEOPLES
Wereda ALLE SPECIAL
Selected Indictor: Seasonal Calendar for Hazards, Activities and Income Level By Kebele
Month of Hazard
Major_Problems /Disasters
Hazard Severity
Rank
Agricultural_Activities
Kebele Name GERGEMA
E - Jan (Tir)
Livestock disease ( Anthrax, FMD )
2
Land preparation
Income
Level Rank
10th
F - Feb (Yekatit)
Shortage of fodder
---------
---------
G - Mar (Megabit)
Anthrax, FMD
1
9th
H - Apr (Meazea)
Flood, shortage of food, malaria
3
Land preparation
12th
I - May (Ginbot)
Shortage of food
2
Weeding
11th
J - Jun (Sene)
Shortage of food
2
Harvesting
1st
K - Jul (Hamle)
Malaria
1
Livestock production
2nd
L - Aug (Nehase)
---------
Livestock production
3rd
A - Sep (Meskerem)
---------
---------
B - Oct (Tikimt)
flooding and shortage of food
2
Land preparation
11th
C - Nov (Hidar)
---------
Crop sowing
10th
D - Dec (Tahsas)
---------
Weeding
4th
NOTE: Hazard Severity Rank helps prioritize the more severe hazards that have occurred in the months of disaster occurrence, 3 being the worst and 1
the least severe hazards.
46
Page 8 of 17
Wereda Disaster
Risk Profile
Data_Collected_Date
January 1900
National Disaster Risk Management
Commission (NDRMC)
Thursday, July 11, 2019
Region S.N.N.P
Zone SEGEN PEOPLES
Wereda ALLE SPECIAL
Selected Indictor: Seasonal Calendar for Hazards, Activities and Income Level By Kebele
Month of Hazard
Major_Problems /Disasters
Hazard Severity
Rank
Agricultural_Activities
Kebele Name GEWADA
E - Jan (Tir)
---------
Preparation of land
Income
Level Rank
9th
F - Feb (Yekatit)
Lack of pasture and water
3
Crop sowing
10th
G - Mar (Megabit)
Livestock disease
2
crop sowing
11th
H - Apr (Meazea)
---------
Weeding
12th
I - May (Ginbot)
Human disease
1
Weeding
4th
J - Jun (Sene)
Human disease
2
Green harvesting
3rd
K - Jul (Hamle)
---------
Harvesting
2nd
L - Aug (Nehase)
---------
Harvesting
1st
A - Sep (Meskerem)
---------
Preparation for belg season
5th
B - Oct (Tikimt)
---------
Preparation of land, sowing of crop
6th
C - Nov (Hidar)
---------
Weeding
7th
D - Dec (Tahsas)
---------
Harvesting
8th
NOTE: Hazard Severity Rank helps prioritize the more severe hazards that have occurred in the months of disaster occurrence, 3 being the worst and 1
the least severe hazards.
47
Page 9 of 17

Wereda Disaster
Risk Profile
Data_Collected_Date
January 1900
National Disaster Risk Management
Commission (NDRMC)
Thursday, July 11, 2019
Region S.N.N.P
Zone SEGEN PEOPLES
Wereda ALLE SPECIAL
Selected Indictor: Seasonal Calendar for Hazards, Activities and Income Level By Kebele
Month of Hazard
Major_Problems /Disasters
Hazard Severity
Rank
Agricultural_Activities
Kebele Name GOROZE
E - Jan (Tir)
1
Land preparation
Income
Level Rank
1st
F - Feb (Yekatit)
1
Land preparation
12th
G - Mar (Megabit)
Lack of pasture
1
Crop sowing
6th
H - Apr (Meazea)
Lack of food, human disease, flood
1
Crop sowing
12th
I - May (Ginbot)
Lack of food, human disease, pest
1
Weeding
11th
J - Jun (Sene)
human disease /malaria /
1
Weeding
10th
K - Jul (Hamle)
1
Harvest/ green harvest/
1st
L - Aug (Nehase)
1
Livestock activity
3rd
A - Sep (Meskerem)
1
Land preparation
4th
B - Oct (Tikimt)
Flood
1
Land preparation / sowing
10th
C - Nov (Hidar)
1
Sowing crop
11th
D - Dec (Tahsas)
1
Weeding
11th
NOTE: Hazard Severity Rank helps prioritize the more severe hazards that have occurred in the months of disaster occurrence, 3 being the worst and 1
the least severe hazards.
48
Page 10 of 17

Wereda Disaster
Risk Profile
Data_Collected_Date
January 1900
National Disaster Risk Management
Commission (NDRMC)
Thursday, July 11, 2019
Region S.N.N.P
Zone SEGEN PEOPLES
Wereda ALLE SPECIAL
Selected Indictor: Seasonal Calendar for Hazards, Activities and Income Level By Kebele
Month of Hazard
Major_Problems /Disasters
Hazard Severity
Rank
Agricultural_Activities
Kebele Name GUMA
E - Jan (Tir)
Lack of water, Dryness of spring and other sources
3
Land preparation
Income
Level Rank
7th
F - Feb (Yekatit)
Lack of pasture, performance of livestock decrease
1
Land preparation
8th
G - Mar (Megabit)
Lack of pasture
---------
Crop sowing
9th
H - Apr (Meazea)
---------
Crop sowing
12th
I - May (Ginbot)
---------
Weeding
6th
J - Jun (Sene)
---------
Weeding
5th
K - Jul (Hamle)
---------
Livestock activity
4th
L - Aug (Nehase)
Outbreak of livestock disease like foot and mouth
2
Livestock activity
3rd
disease
A - Sep (Meskerem)
---------
Harvesting
1st
B - Oct (Tikimt)
---------
Harvesting
2nd
C - Nov (Hidar)
---------
Land preparation
10th
D - Dec (Tahsas)
---------
Land preparation
11th
NOTE: Hazard Severity Rank helps prioritize the more severe hazards that have occurred in the months of disaster occurrence, 3 being the worst and 1
the least severe hazards.
49
Page 11 of 17

Wereda Disaster
Risk Profile
Data_Collected_Date
January 1900
National Disaster Risk Management
Commission (NDRMC)
Thursday, July 11, 2019
Region S.N.N.P
Zone SEGEN PEOPLES
Wereda ALLE SPECIAL
Selected Indictor: Seasonal Calendar for Hazards, Activities and Income Level By Kebele
Month of Hazard
Major_Problems /Disasters
Hazard Severity
Rank
Agricultural_Activities
Kebele Name KERKERT
E - Jan (Tir)
Shortage of water for human and livestock
3
Land preparation
Income
Level Rank
12th
F - Feb (Yekatit)
Shortage of food and water
2
Livestock activities
8th
G - Mar (Megabit)
Crop worm
1
Crop sowing
10th
H - Apr (Meazea)
Drought
3
Weeding
6th
I - May (Ginbot)
Shortage of food
2
Weeding
7th
J - Jun (Sene)
---------
Controlling crop ( pest )
11th
K - Jul (Hamle)
---------
Harvesting
3rd
L - Aug (Nehase)
Livestock death
3
Harvesting
1st
A - Sep (Meskerem)
---------
Land preparation
2nd
B - Oct (Tikimt)
---------
Local drinking preparation
4th
C - Nov (Hidar)
---------
Honey preparation
5th
D - Dec (Tahsas)
---------
9th
NOTE: Hazard Severity Rank helps prioritize the more severe hazards that have occurred in the months of disaster occurrence, 3 being the worst and 1
the least severe hazards.
50
Page 12 of 17

Wereda Disaster
Risk Profile
Data_Collected_Date
January 1900
National Disaster Risk Management
Commission (NDRMC)
Thursday, July 11, 2019
Region S.N.N.P
Zone SEGEN PEOPLES
Wereda ALLE SPECIAL
Selected Indictor: Seasonal Calendar for Hazards, Activities and Income Level By Kebele
Month of Hazard
Major_Problems /Disasters
Hazard Severity
Rank
Agricultural_Activities
Kebele Name KOLANGO
E - Jan (Tir)
Shortage of pasture
3
Harvesting
Income
Level Rank
1st
F - Feb (Yekatit)
Shortage of food and pasture
2
Land preparation
11th
G - Mar (Megabit)
Shortage of water
1
Sowing
12th
H - Apr (Meazea)
Flood and livestock disease
3
Weeding
9th
I - May (Ginbot)
Flood, shortage of food
2
Weeding
8th
J - Jun (Sene)
Shortage of food
1
Livestock activity
3rd
K - Jul (Hamle)
---------
Livestock activity
2nd
L - Aug (Nehase)
---------
Harvesting
1st
A - Sep (Meskerem)
---------
Livestock activity
2nd
B - Oct (Tikimt)
Flood
3
Land preparation
3rd
C - Nov (Hidar)
---------
Land preparation
6th
D - Dec (Tahsas)
---------
Harvesting
2nd
NOTE: Hazard Severity Rank helps prioritize the more severe hazards that have occurred in the months of disaster occurrence, 3 being the worst and 1
the least severe hazards.
51
Page 13 of 17

Wereda Disaster
Risk Profile
Data_Collected_Date
January 1900
National Disaster Risk Management
Commission (NDRMC)
Thursday, July 11, 2019
Region S.N.N.P
Zone SEGEN PEOPLES
Wereda ALLE SPECIAL
Selected Indictor: Seasonal Calendar for Hazards, Activities and Income Level By Kebele
Month of Hazard
Major_Problems /Disasters
Hazard Severity
Rank
Agricultural_Activities
Kebele Name LALCHO
E - Jan (Tir)
Shortage of water
1
Preparation of land
Income
Level Rank
1st
F - Feb (Yekatit)
Enset disease
2
Crop sowing
6th
G - Mar (Megabit)
Animal disease, FMD
2
Weeding
10th
H - Apr (Meazea)
Shortage of food, malaria
3
Weeding
12th
I - May (Ginbot)
Shortage of food
3
Harvesting
11th
J - Jun (Sene)
---------
Harvesting
4th
K - Jul (Hamle)
---------
Preparation of land
3rd
L - Aug (Nehase)
---------
Crop sowing
5th
A - Sep (Meskerem)
FMD
2
Weeding
2nd
B - Oct (Tikimt)
---------
Weeding
9th
C - Nov (Hidar)
---------
Weeding
8th
D - Dec (Tahsas)
---------
Harvesting
7th
NOTE: Hazard Severity Rank helps prioritize the more severe hazards that have occurred in the months of disaster occurrence, 3 being the worst and 1
the least severe hazards.
52
Page 14 of 17

Wereda Disaster
Risk Profile
Data_Collected_Date
January 1900
National Disaster Risk Management
Commission (NDRMC)
Thursday, July 11, 2019
Region S.N.N.P
Zone SEGEN PEOPLES
Wereda ALLE SPECIAL
Selected Indictor: Seasonal Calendar for Hazards, Activities and Income Level By Kebele
Month of Hazard
Major_Problems /Disasters
Hazard Severity
Rank
Agricultural_Activities
Kebele Name LOKITE
E - Jan (Tir)
Shortage of pasture
2
Crop sowing / land preparation
Income
Level Rank
4th
F - Feb (Yekatit)
Shortage of pasture and lack of food
3
Crop sowing / land preparation
5th
G - Mar (Megabit)
Livestock disease foot and mouth, goat disease
2
Weeding, crop sowing
12th
H - Apr (Meazea)
Highest food shortage for human, malaria flood
2
Weeding
9th
I - May (Ginbot)
Highest shortage of food and disease
1
Green harvesting
2nd
J - Jun (Sene)
High food insecurity
3
Harvesting
1st
K - Jul (Hamle)
---------
Livestock activities / harvesting
11th
L - Aug (Nehase)
---------
Preparation of land
10th
A - Sep (Meskerem)
---------
Livestock activities
12th
B - Oct (Tikimt)
---------
Harvesting
1st
C - Nov (Hidar)
---------
Harvesting
2nd
D - Dec (Tahsas)
---------
Harvesting
3rd
NOTE: Hazard Severity Rank helps prioritize the more severe hazards that have occurred in the months of disaster occurrence, 3 being the worst and 1
the least severe hazards.
53
Page 15 of 17

Wereda Disaster
Risk Profile
Data_Collected_Date
January 1900
National Disaster Risk Management
Commission (NDRMC)
Thursday, July 11, 2019
Region S.N.N.P
Zone SEGEN PEOPLES
Wereda ALLE SPECIAL
Selected Indictor: Seasonal Calendar for Hazards, Activities and Income Level By Kebele
Month of Hazard
Major_Problems /Disasters
Hazard Severity
Rank
Agricultural_Activities
Kebele Name TSEMEHA
E - Jan (Tir)
Shortage of water
2
Livestock activity
Income
Level Rank
4th
F - Feb (Yekatit)
Shortage of animal departure
3
Crop sowing
5th
G - Mar (Megabit)
Flood
1
Crop sowing
10th
H - Apr (Meazea)
Drought, shortage of water
3
Weeding
12th
I - May (Ginbot)
Drought, shortage of food
2
Weeding
11th
J - Jun (Sene)
Drought
3
Keeping crop
9th
K - Jul (Hamle)
---------
Harvesting
1st
L - Aug (Nehase)
---------
Land preparation
2nd
A - Sep (Meskerem)
---------
Crop sowing
7th
B - Oct (Tikimt)
Crop pest
1
Livestock activity
6th
C - Nov (Hidar)
---------
Livestock activity
5th
D - Dec (Tahsas)
---------
Land preparation
3rd
NOTE: Hazard Severity Rank helps prioritize the more severe hazards that have occurred in the months of disaster occurrence, 3 being the worst and 1
the least severe hazards.
54
Page 16 of 17

Wereda Disaster
Risk Profile
Data_Collected_Date
January 1900
National Disaster Risk Management
Commission (NDRMC)
Thursday, July 11, 2019
Region S.N.N.P
Zone SEGEN PEOPLES
Wereda ALLE SPECIAL
Selected Indictor: Seasonal Calendar for Hazards, Activities and Income Level By Kebele
Month of Hazard
Major_Problems /Disasters
Hazard Severity
Rank
Agricultural_Activities
Kebele Name TURUBA
E - Jan (Tir)
Lack of water and pasture for livestock, lack of food
1
Land preparation
Income
Level Rank
12th
F - Feb (Yekatit)
Lack of pasture and water
2
Livestock production
8th
G - Mar (Megabit)
---------
9th
H - Apr (Meazea)
---------
Weeding
10th
I - May (Ginbot)
---------
Control pest
11th
J - Jun (Sene)
Stalk borer ( army worm ) crop disease
3
land preparation
12th
K - Jul (Hamle)
Stalk borer ( army worm ) crop disease
3
Harvesting
1st
L - Aug (Nehase)
---------
Harvesting
2nd
A - Sep (Meskerem)
---------
Livestock production
3rd
B - Oct (Tikimt)
---------
Local drinking preparation
4th
C - Nov (Hidar)
---------
5th
D - Dec (Tahsas)
---------
6th
NOTE: Hazard Severity Rank helps prioritize the more severe hazards that have occurred in the months of disaster occurrence, 3 being the worst and 1
the least severe hazards.
55
Page 17 of 17
WDRP Indicators
Infrastructure Access Characteristics
56
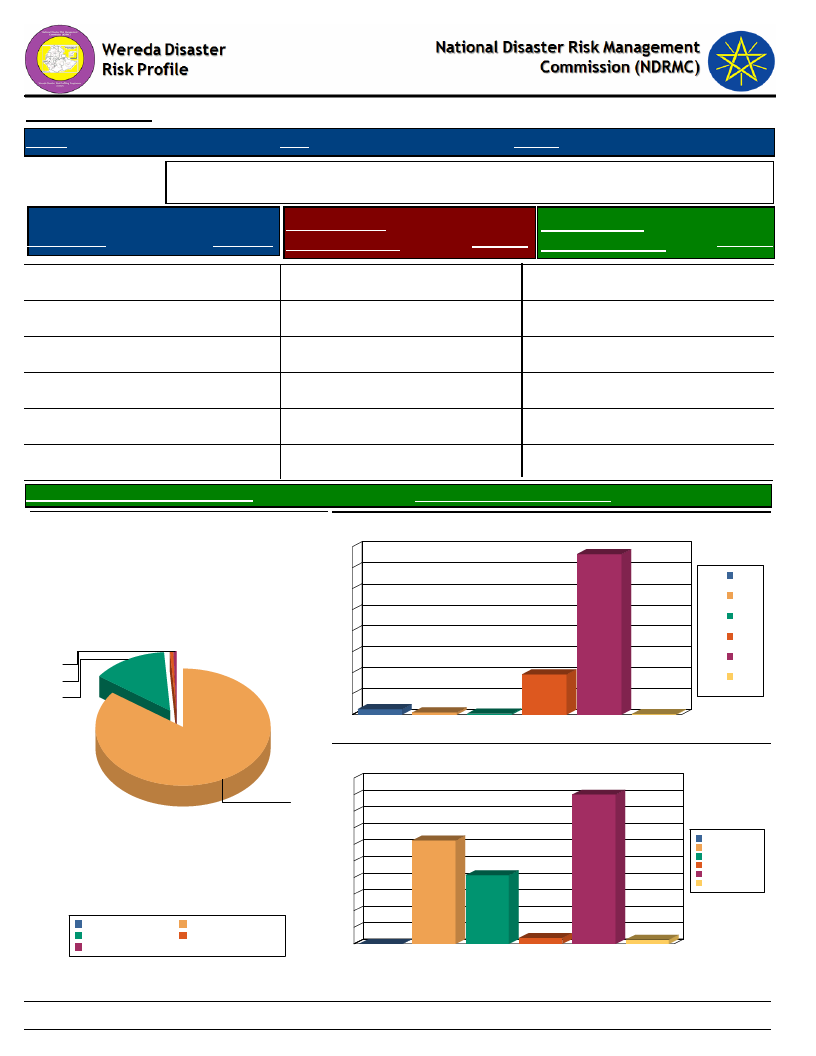
Data_Collected_Date
Region S.N.N.P
January 1900
Zone SEGEN PEOPLES
Thursday, July 11, 2019
Wereda ALLE SPECIAL
Selected Indicator
Type of Road
Physical Vulnerability: Access to Roads & Urban Centres - Households access to
road and urban centre
Time to Nearest
Response Paved Road (Mins.)
Time To Nearest
Response Urban Center (Mins.)
Response
Yes, partly paved road
0.51 30 – 60 min
19.18 1 - 2 hrs
31.20
Yes, gravel road
13.81 1 – 2 hrs
2.56 2 - 4 hrs
20.72
0.00 3 – 4 hrs
0.51 More than 6 hrs
1.28
0.00 More than 4 hrs
0.26
0.00
Yes, paved
0.51 Less than 30 min
76.47 Less than 1 hr
45.01
No road
84.65 2 – 3 hrs
1.02 4 - 6 hrs
1.79
Avg Time To Nearest Urban Center(Mins.)
Type of Road
1
1
14
85
Yes, gravel road
Yes, paved
No road
Yes, partly paved road
88.61
Avg_Time_To_Nearest_Paved_Road
25.02
Time to reach the nearest paved road from the HH
80
76
70
60
1 – 2 hrs
50
40
30
20
10
3
0
1 – 2 hrs
1
2 – 3 hrs
19
1
3 – 4 hrs
30 – 60 min
Less than 30
min
0
More than 4
hrs
2 – 3 hrs
3 – 4 hrs
30 – 60 min
Less than 30 min
More than 4 hrs
Time to reach nearest urban center from the HH
50
45
45
40
35
31
30
25
21
20
15
1 - 2 hrs
2 - 4 hrs
4 - 6 hrs
Less than 1 hr
More than 6 hrs
10
5
0
0
1 - 2 hrs
2 - 4 hrs
2
4 - 6 hrs
1
Less than 1 hr More than 6 hrs
57
Page 1 of 1
Data_Collected_Date
Region S.N.N.P
January 1900
Zone SEGEN PEOPLES
Thursday, July 11, 2019
Wereda ALLE SPECIAL
Selected Indicator
Physical Vulnerability: Access to Electricity - Households access and utilization
of electricity
Household_Located_In_Electricity
3.10
Household_Connected_To Electricity
1.53
58
Page 1 of 1
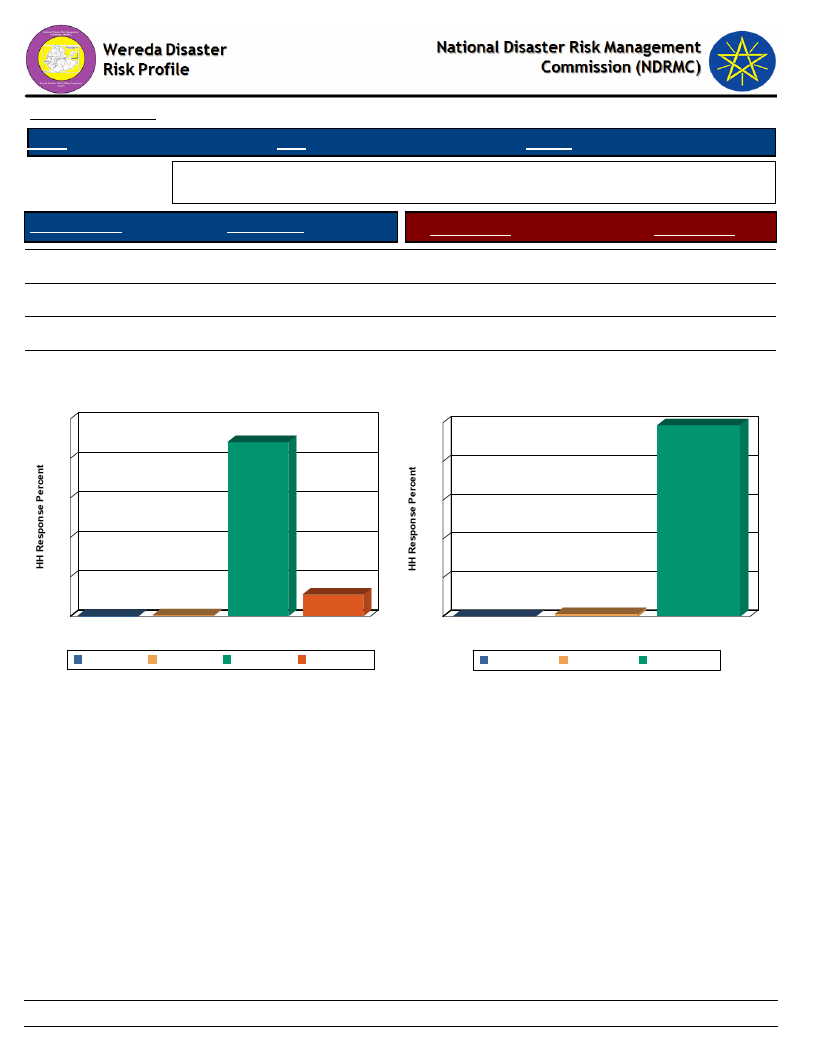
Data_Collected_Date
Region S.N.N.P
January 1900
Zone SEGEN PEOPLES
Thursday, July 11, 2019
Wereda ALLE SPECIAL
Selected Indicator
Floor Structure
Physical Vulnerability: Type of Dwelling Units - Households type of dwelling
houses
HH Response
Type of Floor
HH Response
Mobile home
0.51
Non-Concrete
98.71
Tin house
11.00
Concrete
1.29
Thatched
88.24
0.00
DK
0.26
0.00
Floor Structure
100
88
80
Type of Floor
100
99
80
60
60
40
40
20
0
0
DK
DK
1
Mobile home
Thatched
Floor Structure
Mobile home Thatched
11
Tin house
Tin house
20
0
0
1
Concrete
Type of Floor
Concrete
Non-Concrete
Non-Concrete
59
Page 1 of 1
WDRP Indicators
Socio Demographic Characteristics
60
Wereda Disaster
Risk Profile
National Disaster Risk Management
Commission (NDRMC)
Data_Collected_Date
January 1900
Thursday, July 11, 2019
Region S.N.N.P
Selected Indicator
Kebele Name
KERKERT
TURUBA
KOLANGO
EYANA
Zone SEGEN PEOPLES
Wereda ALLE SPECIAL
Economic Vulnerability: Level of Migration - Migration level and its characteristics by Kebele
Approx_No. Age_Group
Sex
Migration_Period
Migration Trend
Migration_Reason
Destination
17
Elderly, youth
Both
2004
Increased
Lack of food, loss of
asset, loss of crop
and death of animal
Rural area, going to south
Omo
40
Youth
Both
February, 2008
Increased
Economic hardship,
Job opportunities,
Loss of asset
Rural area
8
Youth
Both
1998
Decreased
The main reason of
migrant is loss of
crop and died of
animal, economic
hardship.
Rural area to south Omo
---------
LOKITE
GUMA
GOROZE
DELBENA GAMA
TSEMEHA
31
Youth
38
Youth
50
Youth
150
Youth
30
Youth
Both sex January- June
Increased
Both
January, 2007
Decreased
Male
2004
Increased
Both
1998
Decreased
Both
2008
Increased
61
Economic hardship,
loss of asset, job
opportunity
Economic hardship,
loss of asset, job
opportunity
Job opportunity, loss
of asset, economic
hardship
Loss of asset and
crop and seeking of
job opportunity.
Loss of crop and
death of animal.
Rural, South Omo
Rural area
Rural
Rural area to Molokoza
Gamo Gofa zone.
Most of migrants rural area
South Omo.
Page 1 of 2

Wereda Disaster
Risk Profile
National Disaster Risk Management
Commission (NDRMC)
Data_Collected_Date
January 1900
Thursday, July 11, 2019
Region S.N.N.P
Zone SEGEN PEOPLES
Wereda ALLE SPECIAL
Selected Indicator
Economic Vulnerability: Level of Migration - Migration level and its characteristics by Kebele
Kebele Name
ADIS OLETEMA
GEWADA
DIGINTY
DEGA MASHELE
BOLE
GERGEMA
DUGULO
LALCHO
Approx_No. Age_Group
120
Youth
Sex
Both
Migration_Period
2006, 2008
2000
Youth
Both
1994, 1996, 2009
7
Youth
Both
June, 2009
150
Youth
Male
1995, 1997, 2000
32
Worker age
Both
1992
20
Working group
Both
2000
40
Youth
Both sex 2007, 2008, 2009
100
Youth
Both
January
Migration Trend
Increased
Increased
Increased
Increased
Increased
Decreased
Increased
Decreased
Migration_Reason
Loss of animal and
asset due to the
drought and flood
Loss of asset,
economic hardship,
job opportunity
Economic hardship,
loss of asset ( loss of
livestock and crop) ,
seeking job
Loss of crops, loss of
asset
Loss of crop and
animal
Loss of asset and
livestock
Job opportunity, loss
of asset, economic
hardship
Loss of crop and
animal, economic
hardship
Destination
To the rural place of
Yabelo ( Oromia region )
Rural, South omo
Rural
Rural area to Teltele
Rural area, Daramalo
wereda
Rural area to Gumide
Urban area
Rural area to Teltele (
Oromia region )
62
Page 2 of 2
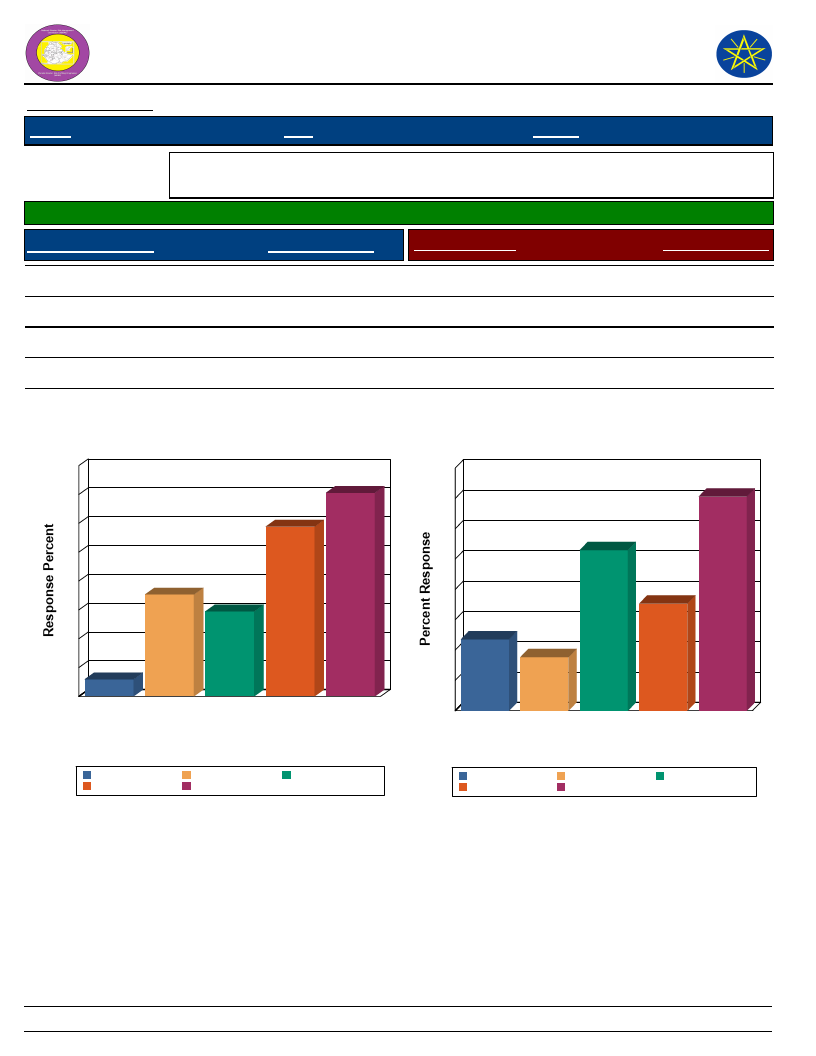
Wereda Disaster
Risk Profile
National Disaster Risk Management
Commission (NDRMC)
Data_Collected_Date
Region S.N.N.P
January 1900
Zone SEGEN PEOPLES
Thursday, July 11, 2019
Wereda ALLE SPECIAL
Selected Indicator
Economic Vulnerability: Household Migration - Household migration and reason
for migration
Households who migrated (%)
1.28
Duration of Migration
Response Percent
Migration Reason
Response Percent
Less than 2 weeks
Two weeks – month
3 – 6 months
> 6 months
A month – 3 months
29.41
35.29
17.65
2.94
14.71
Family reasons
Looking for work
Away at school
Other
Working elsewhere
8.82
26.47
11.76
17.65
35.29
Duration of Migration
40
35
35
30
29
25
20
18
15
15
10
53
0
>6
months
3 – 6 A month – Less than Two
months 3 months 2 weeks weeks –
month
Duration of Migration
> 6 months
Less than 2 weeks
3 – 6 months
Two weeks – month
A month – 3 months
Migration Reason
40
35
35
30
26
25
20
18
15
12
10
9
5
0
Away at Family Looking
school reasons for work
Other Working
elsewhere
Migration Reason
Away at school
Other
Family reasons
Working elsewhere
Looking for work
63
Page 1 of 1
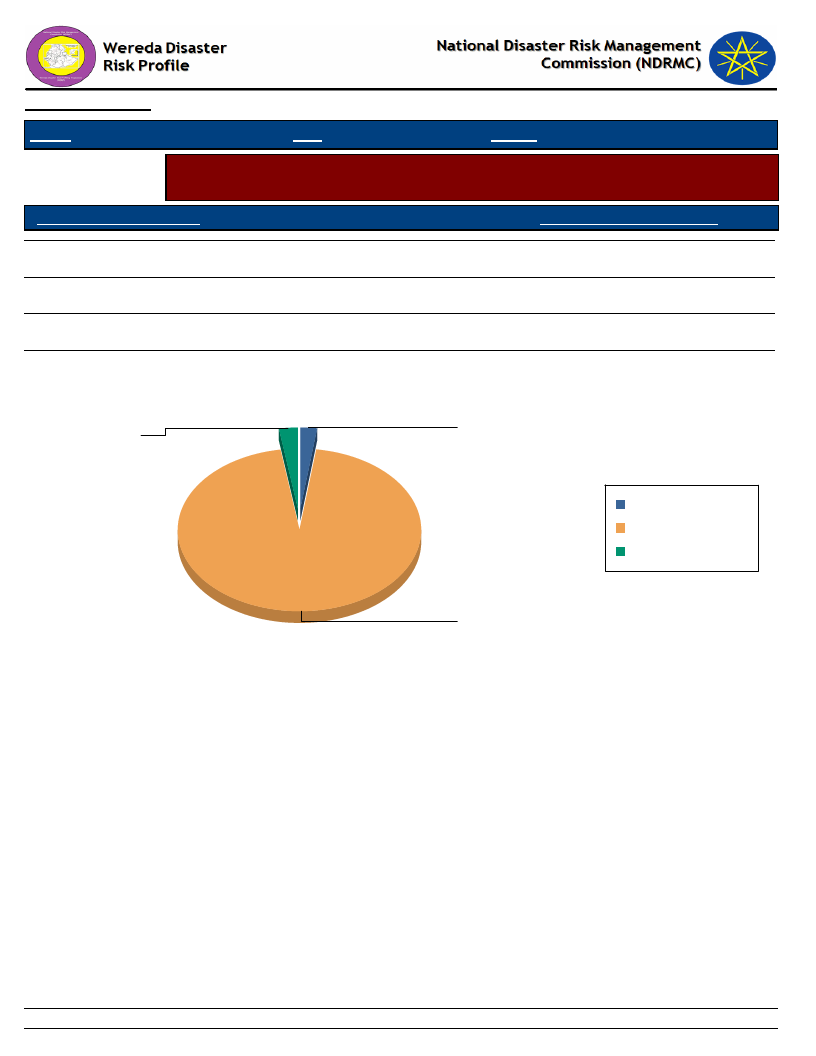
Data_Collected_Date
January 1900
Thursday, July 11, 2019
Region S.N.N.P
Zone SEGEN PEOPLES
Wereda ALLE SPECIAL
Selected Indicator
Economic Vulnerability: Household Migration - Disasters as a triggering factor for
migration (households response in %)
Is Migration Due to Hazard?
HH Response - Due To Hazard
No
97.33
Yes
2.67
Migration partly because of such impacts
2.13
Is Migration Due to Hazard?
Migration partly because of such
Yes
impacts
2.7
2.1
Migration partly because
of such impacts
No
Yes
No
97.3
64
Page 1 of 1
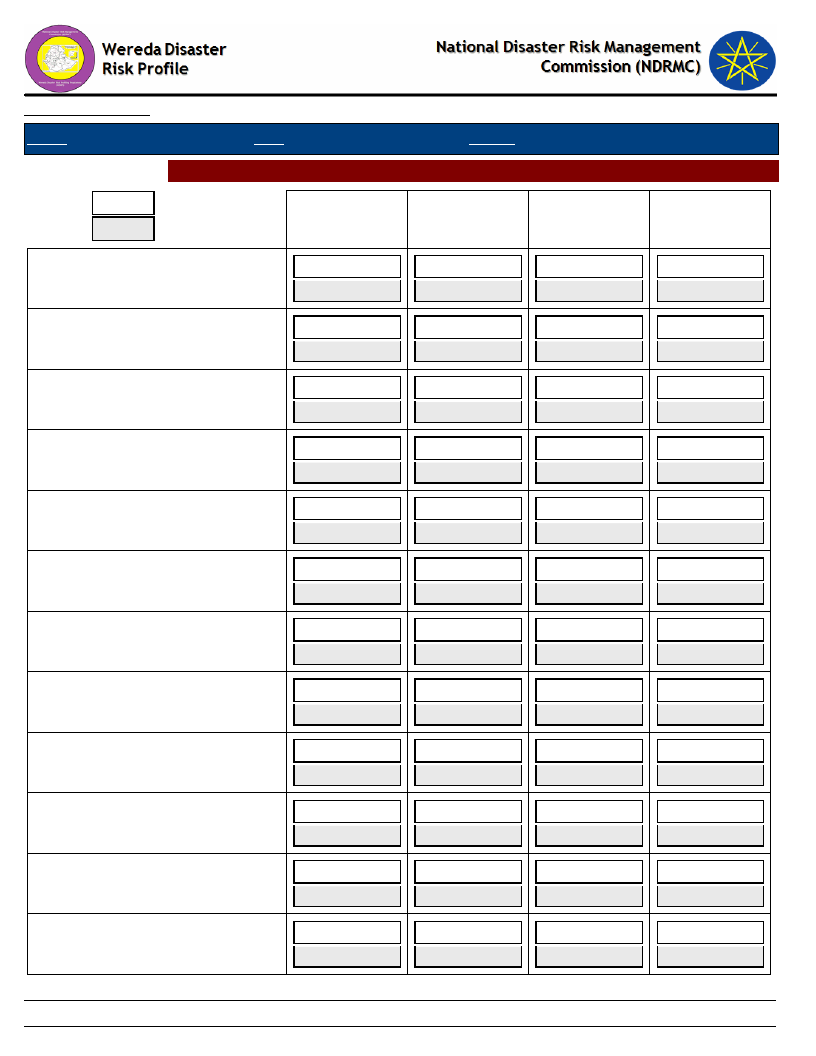
Data_Collected_Date
Region S.N.N.P
January 1900
Zone SEGEN PEOPLES
Selected Indictor: Demography: Population Structure
KEY:
Male
Female
A-Children
(0-12 yrs)
ADIS OLETEMA
-
-
BOLE
-
-
DEGA MASHELE
-
-
DELBENA GAMA
19
20
DIGINTY
46
54
DUGULO
49
51
EYANA
46
54
GERGEMA
-
-
GEWADA
49
51
GOROZE
45
55
GUMA
52
48
KERKERT
-
-
Wereda ALLE SPECIAL
Thursday, July 11, 2019
B-Youth
(12-25 yrs)
-
-
-
-
-
-
14
-
48
52
46
54
45
55
-
-
40
60
48
52
50
50
-
-
C-Working
(25-55 yrs)
-
-
-
-
-
-
-
-
50
50
50
50
50
50
-
-
46
54
50
50
49
51
-
-
D-Older
(Above 55
-
-
-
-
-
-
-
-
40
60
30
70
40
60
-
-
30
70
40
60
50
50
-
-
65
Page 1 of 2
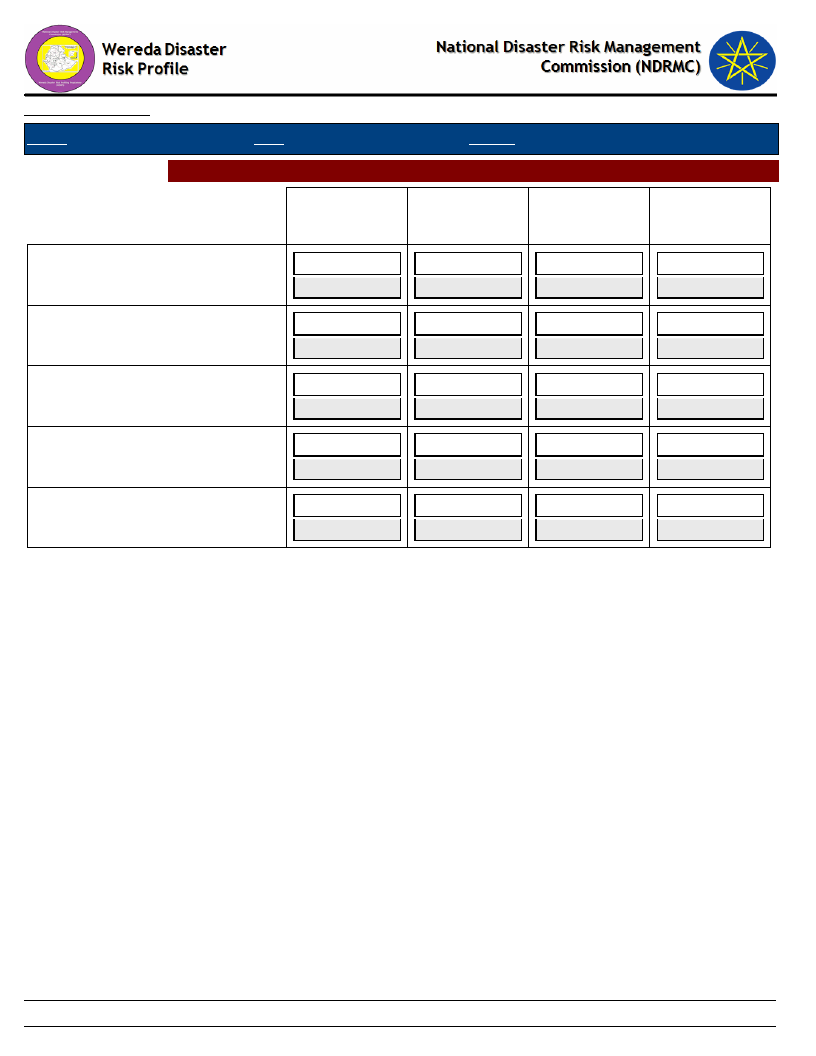
Data_Collected_Date
Region S.N.N.P
January 1900
Zone SEGEN PEOPLES
Selected Indictor: Demography: Population Structure
A-Children
(0-12 yrs)
KOLANGO
-
-
LALCHO
-
-
LOKITE
49
51
TSEMEHA
-
-
TURUBA
49
51
Wereda ALLE SPECIAL
Thursday, July 11, 2019
B-Youth
(12-25 yrs)
-
-
-
-
48
52
-
-
48
52
C-Working
(25-55 yrs)
-
-
-
-
50
50
-
-
44
56
D-Older
(Above 55
-
-
-
-
40
60
-
-
50
50
66
Page 2 of 2
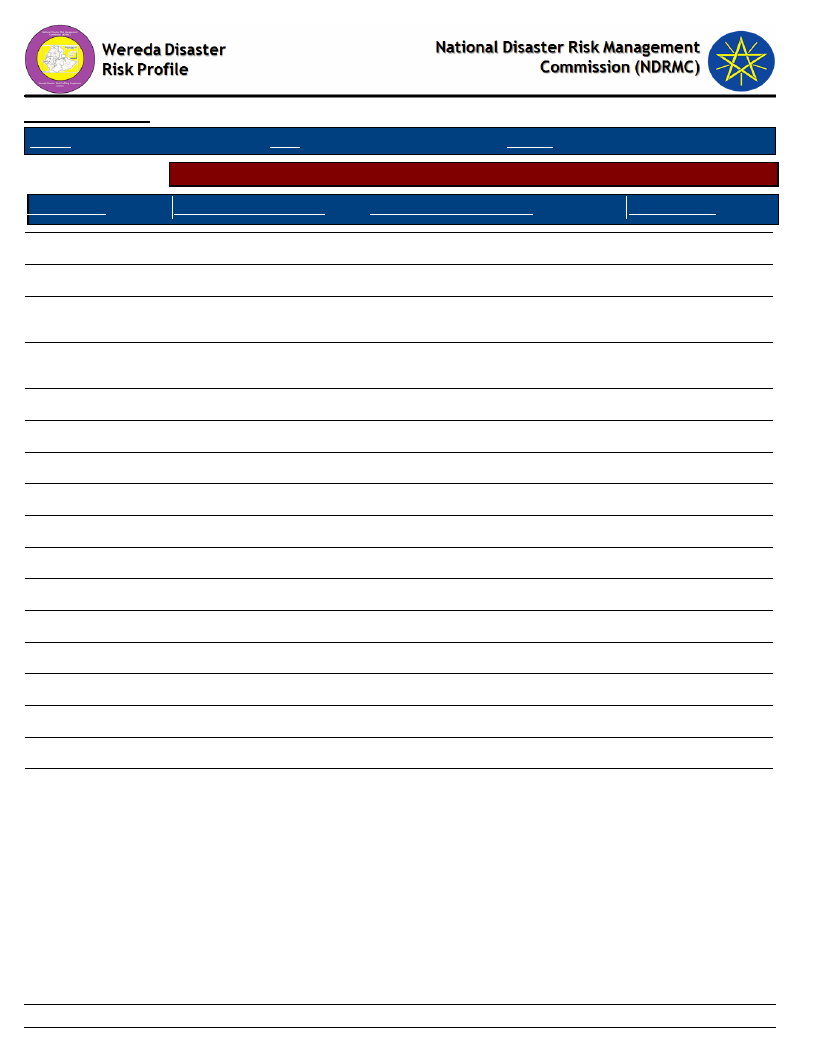
Data_Collected_Date
Region S.N.N.P
January 1900
Zone SEGEN PEOPLES
Thursday, July 11, 2019
Wereda ALLE SPECIAL
Selected Indicator
Demography: Population Trends and Ethnic Groups
Kebele Name
Population Change Trend
Population Change Reasons
Ethnic_Groups
KERKERT
TURUBA
KOLANGO
EYANA
LOKITE
GUMA
GOROZE
DELBENA GAMA
TSEMEHA
ADIS OLETEMA
GEWADA
DIGINTY
DEGA MASHELE
BOLE
GERGEMA
DUGULO
LALCHO
Increased
Increased
Increased
Increased
Increased
Increased
Increased
Increased
Increased
Increased
Increased
Increased
Increased
Increased
Increased
Increased
Increased
More children
Alle
More children
Alle
More children and in migration/
Alle
establishment of wereda center
More children and large local
Alle
families
More children
Alle
More children
Alle
More children
Alle
More children
Alle
More children
Alle
More young and children
Alle
More children
Alle
More children
Alle
More children
Alle
More children
Alle
More children
Alle
More children
Alle
More children
Alle
67
Page 1 of 1
Data_Collected_Date
January 1900
Thursday, July 11, 2019
Region S.N.N.P
Zone
SEGEN PEOPLES
Wereda ALLE SPECIAL
Selected Indicator
Social Vulnerability: Household Demographic Characteristics - Demographic
characteristics of households
Demographic Indicator
Indicator_Value Comments
Average household size
6.0
Sex ratio
877.0 Number of females per 1000 males
Child sex ratio (under 14 yrs)
882.0 Number of females per 1000 males
Adult sex ratio (18 & Above yrs)
930.0 Number of females per 1000 males
Dependency ratio ([(0-14)+(64+)] / (15-64)
1.1
yrs)
68
Page 1 of 1
Wereda Disaster
Risk Profile
Data_Collected_Date
January 1900
National Disaster Risk Management
Commission (NDRMC)
Thursday, July 11, 2019
Region S.N.N.P
Selected Indicator
General Awareness
Zone
SEGEN PEOPLES
Wereda ALLE SPECIAL
Social Vulnerability: Level of Educational Attainment - Education status of household members
Percentage Educational Level
Percentage
Read and understand text - Yes, easily
Read and understand text - Yes, with
difficulty
Can write letters - Yes, easily
Can write letters - Yes, with difficulty
General Literacy Rate
Proportion of literate population (7+) to total 7+
population
13.65
9.49
From Proportion of population (7+) - Less than 1st grade completed
Primary Education (Grade 1 - 6) Student
12.68
7.32
0.00
0.00
0.00
0.00
0.00
0.00
0.00
0.00
Secondary School Education (7 - 12) Student
From Proportion of population (7+) - Technical / vocational
certificate or diploma
From Proportion of population (15+) - Diploma
From Proportion of population (15+) - Pursuing or completed
University
From Proportion of population (7+) - University diploma
From Proportion of population (7+) - Pursuing University degree
From Proportion of population (15+) - Less than 1st grade
From Proportion of population (15+) - Primary (1-6)
From Proportion of population (15+) - Secondary (7-12)
From Proportion of population (15+) - Technical
Percentage
12.25
Adult Literacy Rate
Proportion of literate population (15+) to total 15+
population
59.90
31.88
7.49
0.11
0.09
0.17
0.06
0.11
62.41
26.48
10.07
0.17
Percentage
10.66
69
Page 1 of 1

Data_Collected_Date
January 1900
Thursday, July 11, 2019
Region S.N.N.P
Zone SEGEN PEOPLES
Wereda ALLE SPECIAL
Selected Indicator
Educational Level
Social Vulnerability: Gender Parity - Gender parity in education level (7+ years)
and household heading
Male_Percent
Female_Percent
From Proportion of population (7+) - Less than 1st grade
completed
From Proportion of population (7+) - Technical / vocational
certificate or diploma
From Proportion of population (7+) - University diploma
47.30
50.00
100.00
52.70
50.00
0.00
From Proportion of population (7+) - Pursuing University degree
100.00
0.00
From Proportion of population (7+) - University degree or higher
0.00
0.00
Primary Education (Grade 1 - 6) Student
57.93
42.07
Secondary School Education (7 - 12) Student
75.00
25.00
Male Head of HH
88.10
Female Head of HH
11.90
70
Page 1 of 1
WDRP Indicators
Environmental Characteristics
71
Data_Collected_Date
Region S.N.N.P
January 1900
Zone SEGEN PEOPLES
Thursday, July 11, 2019
Wereda ALLE SPECIAL
Selected Indicator
Environmental Situation: Environmental Problems - Major environmental
problems by Kebele
KebeleName
Problem_1
Problem_2
Problem_3
Problem4
KERKERT
Deforestation
Soil erosion
Pests
Animal death
TURUBA
Deforestation
land degradation
KOLANGO
Deforestation
Land degradation
EYANA
Deforestation
Soil erosion
LOKITE
Deforestation
Pest
Soil erosion
GUMA
Deforestation
Soil erosion
Pest
GOROZE
Soil erosion
Land slide
Deforestation
Pests
DELBENA GAMA
Soil erosion
Deforestation
Pests
Soil degradation
TSEMEHA
Soil erosion
Pest
Deforestation
ADIS OLETEMA
Soil erosion
Deforestation
Pest
GEWADA
Deforestation
Soil erosion
Pest
DIGINTY
Soil erosion
Deforestation
DEGA MASHELE
Land degradation
Pest
Deforestation
Soil erosion
BOLE
Soil erosion
Crop pests
Deforestation
GERGEMA
Soil erosion
Deforestation
Pest
Land degradation
DUGULO
Deforestation
Pest
Soil erosion
LALCHO
Soil erosion
Pest
Deforestation
72
Page 1 of 1
Data_Collected_Date
January 1900
Thursday, July 11, 2019
Region S.N.N.P
Zone SEGEN PEOPLES
Wereda ALLE SPECIAL
Selected Indicator
Environmental Situation: General Land Quality - Perceptions of the community
on changes in the general quality of land over a decade
KebeleName
Current_Situation
Change_Last_Decade
Comment
KERKERT
Low
Decreasing
Low productivity
TURUBA
KOLANGO
EYANA
LOKITE
Low
Most land use for agricultural
activities
Low quality of land
Less quality
Decreasing
Increased
Decrease
Decrease
The size of agricultural
land decrease
The size of population
per household is
increased
In case of low soil
fertility
Due to soil erosion
GUMA
Low equality
Decrease
In case of erosion of soil
GOROZE
Quality of land decrease
DELBENA GAMA
Low
Because agricultural activity
is increasing
Decreasing
The size of population
per household is
increased
Over grazing
TSEMEHA
Sandy
Decreasing
Low productivity
ADIS OLETEMA
GEWADA
DIGINTY
Most land cover by
agricultural activity
No wise use of farm land
Sandy soil but not fertile
agricultural activity
increased year to years
Increase year to year
Sand soil and fertile
The size of population
per house hold is
increased
Poor use land is main
cause
DEGA MASHELE
Fertile
Decreasing
Low productivity
BOLE
Sandy
Decreasing
Low production
GERGEMA
Medium
Decreased
Low production of yield
DUGULO
Low quality of land
Decrease
LALCHO
Low
Decreasing
73
Page 1 of 1

Data_Collected_Date
January 1900
Thursday, July 11, 2019
S.N.N.P
Region
Selected Indicator
Zone SEGEN PEOPLES
Wereda ALLE SPECIAL
Environmental Situation: Changes in Landscape - Changes observed by the
community on landscape and the problems due to the changes
KebeleName
Changes_Observed
Problems_Due_To_Changes
KERKERT
TURUBA
KOLANGO
EYANA
Deforestation and
increment of
desertification
Land use and land cover
land cover
Farmland coverage increase
Climate change
Most forest area are change to agricultural land
because of shortage of agriculture land
Forest land are change to agricultural land, not
have enough grazing land for livestock
Deforestation
LOKITE
Land cover
Fragmentation of farm land
GUMA
GOROZE
Poor land use, expansion of
land cover
Land use increase
Less use of agriculture inputs leads low crop
production comes expansion of farm land
For purpose farm land
DELBENA GAMA
TSEMEHA
ADIS OLETEMA
GEWADA
DIGINTY
DEGA MASHELE
land cover
Expansion of desertification
of fertility of soil
Land cover decline
Poor land use increase due
to expansion farm land,
fragment of farm land
Increasing of population
growth decrease of
livestock, lack of pasture
and lack of food
Population increased
Most land coverage and change in to agricultural
land so that not have enough grazing land for
livestock
Climate change
Most forest land change to agricultural land so
that not have enough grazing and forest land
Most forest and grazing land are change
agriculture land so that shortage of grazing land
for livestock
Death of livestock, migration, deforestation
increasing and climate change
Lack of farming land
BOLE
GERGEMA
Expansion of desertification
less of fertilizer
Over grazing and decrease
fertility of soil
Climate change year to year
Because of climate change
74
Page 1 of 2

Data_Collected_Date
January 1900
Thursday, July 11, 2019
S.N.N.P
Region
Selected Indicator
Zone SEGEN PEOPLES
Wereda ALLE SPECIAL
Environmental Situation: Changes in Landscape - Changes observed by the
community on landscape and the problems due to the changes
KebeleName
Changes_Observed
Problems_Due_To_Changes
DUGULO
LALCHO
Expansion of farm land is
increase
Over grazing and increasing
75
Page 2 of 2
Wereda Disaster Risk
Profile
Data_Collected_Date
January 1900
Region S.N.N.P
Zone SEGEN PEOPLES
National Disaster Risk Management
Commission (NDRMC)
Thursday, July 11, 2019
Wereda ALLE SPECIAL
Selected Indicator
Kebele Name
Environmental Situation: Land-Use other than crop production - Types of land use other than crop production
across Kebeles
Landuse_1
Comments_1
Landuse_2
Comments_2
Landuse_3
Comments_3
KERKERT
TURUBA
KOLANGO
EYANA
Grazing land
Forest land
Grazing land
Grazing land
The farmers grazing
animal on their own
land
For fuel wood and
other material
10 ha for livestock
feeding
50
Honey production
Grazing land
Forest land
Honey production
on their own land
trees ( locally)
Forest harvest
To preparation
charcoal of wood
For animal fodder
and grazed
26 ha for wood
production
Farm land
3
Forest harvesting
Greater than 60
ha for crop
production
20
LOKITE
Grazing land
Forest harvest
GUMA
GOROZE
DELBENA GAMA
TSEMEHA
ADIS OLETEMA
Grazing land
Grazing
Grazing land
Grazing land
Grazing land
For pasture service
40% for livestock
feeding
The purpose of
animal fodder
The farmers grazing
animals on their own
land
Forest harvest
Forest land
Honey production
Charcoal, fire
wood, household
20 % for fuel wood
and construct in
material
To increase
income
GEWADA
Grazing
Forest harvest
Honey production
76
Page 1 of 2

Wereda Disaster Risk
Profile
Data_Collected_Date
January 1900
Region S.N.N.P
Zone SEGEN PEOPLES
National Disaster Risk Management
Commission (NDRMC)
Thursday, July 11, 2019
Wereda ALLE SPECIAL
Selected Indicator
Kebele Name
Environmental Situation: Land-Use other than crop production - Types of land use other than crop production
across Kebeles
Landuse_1
Comments_1
Landuse_2
Comments_2
Landuse_3
Comments_3
DIGINTY
Cattle ( cow, ox, bull)
Goat
Sheep
DEGA MASHELE
Grazing land
BOLE
GERGEMA
DUGULO
Grazing land
Grazing land
Grazing land
The farmer grazing
animal their own
grass land
Used for grazing
animals
Honey production
Forest land
Forest
To increased
income
Used for fuel
wood and
construction
materials
LALCHO
Grazing land
Planting coffee
Planting enset
77
Page 2 of 2

Data_Collected_Date
Region S.N.N.P
January 1900
Zone SEGEN PEOPLES
Thursday, July 11, 2019
Wereda ALLE SPECIAL
Selected Indicator
KebeleName
Environmental Situation: Deforestation - Observed changes over levels of
deforestation by the community and its problems
Changes_Observed
Problems_Due_To_Changes
KERKERT
Increasing
Soil erosion increased
TURUBA
Increased
Shortage of fuel wood and shortage of rainfall
KOLANGO
Increased
Shortage of fuel wood, shortage of rainfall
EYANA
Increase
Climate change, season and sowing crops
LOKITE
Increase
Drought, shifting of crop sowing season
GUMA
GOROZE
Increase
Increase
For purpose of charcoal house, fire wood and forest
harvesting
For human consumption deforest
DELBENA GAMA
TSEMEHA
Increasing
Very high
Most forest land are removed for the purpose of fuel wood
and charcoal
Soil erosion increased
ADIS OLETEMA
Increase
Shortage of fuel wood, soil fertility decrease
GEWADA
Increase
Loss of species of wood
DIGINTY
Increase
Shortage of fuel wood, soil is removed by flood
DEGA MASHELE
Increased
Soil erosion increase
BOLE
GERGEMA
Very high
Highly
flood and soil erosion is increased because of lack of natural
resource management
Soil erosion is increased year to year
DUGULO
Increase
LALCHO
Decreasing
78
Page 1 of 1
Wereda Disaster
Risk Profile
National Disaster Risk Management
Commission (NDRMC)
Data_Collected_Date
Region S.N.N.P
January 1900
Zone SEGEN PEOPLES
Wereda ALLE SPECIAL
Thursday, July 11, 2019
Selected Indicator
KebeleName
Environmental Situation: Natural Resources Availability - Natural resources available and changes observed by
the community
ADIS OLETEMA
Resources_1
Land
Resources_3
Observed_Change_1
The size increased
Observed_Change_3
Problems_Changes_1
Grazing and land decline
Problems_Changes_3
Resources_2
Forest
Observed_Change_2
Deforestation increased
Problems_Changes_2
Shortage of rainfall and water for both
animal and people.
KebeleName
BOLE
Resources_1
Land
Observed_Change_1
Fertility of land decreased
Problems_Changes_1
Because of increasing population size
Resources_4
Observed_Change_4
Problems_Changes_4
Resources_3
Observed_Change_3
Problems_Changes_3
Resources_2
Observed_Change_2
Problems_Changes_2
Forest
Forest coverage decreased
Erratic rainfall and climate change
Resources_4
Observed_Change_4
Problems_Changes_4
KebeleName
DEGA MASHELE
79
Page 1 of 9

Wereda Disaster
Risk Profile
National Disaster Risk Management
Commission (NDRMC)
Data_Collected_Date
Region S.N.N.P
January 1900
Zone SEGEN PEOPLES
Wereda ALLE SPECIAL
Thursday, July 11, 2019
Selected Indicator
Resources_1
Observed_Change_1
Problems_Changes_1
Environmental Situation: Natural Resources Availability - Natural resources available and changes observed by
the community
Land
Resources_3
Decreased
Observed_Change_3
Problems_Changes_3
Resources_2
Observed_Change_2
Problems_Changes_2
Forest
Decreased
Resources_4
Observed_Change_4
Problems_Changes_4
KebeleName
DELBENA GAMA
Resources_1
Land
Observed_Change_1
Decreasing
Problems_Changes_1
Population increasing
Resources_3
Observed_Change_3
Problems_Changes_3
Resources_2
Observed_Change_2
Problems_Changes_2
Resources_4
Observed_Change_4
Problems_Changes_4
KebeleName
DIGINTY
80
Page 2 of 9

Wereda Disaster
Risk Profile
National Disaster Risk Management
Commission (NDRMC)
Data_Collected_Date
Region S.N.N.P
January 1900
Zone SEGEN PEOPLES
Wereda ALLE SPECIAL
Thursday, July 11, 2019
Selected Indicator
Resources_1
Observed_Change_1
Problems_Changes_1
Environmental Situation: Natural Resources Availability - Natural resources available and changes observed by
the community
Land
Resources_3
Forest
Increase of farm land
Observed_Change_3
Decrease
Problems_Changes_3
Resources_2
Observed_Change_2
Problems_Changes_2
Water
Decrease
Resources_4
Observed_Change_4
Problems_Changes_4
Wood
Decrease
KebeleName
DUGULO
Resources_1
Land
Observed_Change_1
Problems_Changes_1
Resources_3
Observed_Change_3
Problems_Changes_3
Wood
Resources_2
Observed_Change_2
Problems_Changes_2
Forest
Resources_4
Observed_Change_4
Problems_Changes_4
KebeleName
EYANA
81
Page 3 of 9
Wereda Disaster
Risk Profile
National Disaster Risk Management
Commission (NDRMC)
Data_Collected_Date
Region S.N.N.P
January 1900
Zone SEGEN PEOPLES
Wereda ALLE SPECIAL
Thursday, July 11, 2019
Selected Indicator
Resources_1
Observed_Change_1
Environmental Situation: Natural Resources Availability - Natural resources available and changes observed by
the community
Land
Resources_3
Wood
Increase
Observed_Change_3
Decrease
Problems_Changes_1
Resources_2
Small size farm land
Forest
Problems_Changes_3
Resources_4
Destructed the wood for house building and
fire wood
Observed_Change_2
Problems_Changes_2
Decrease
Deforestation
Observed_Change_4
Problems_Changes_4
KebeleName
GERGEMA
Resources_1
Land
Observed_Change_1
Fertility land decreased
Problems_Changes_1
Grazing land shortage for animals
Resources_3
Observed_Change_3
Problems_Changes_3
Resources_2
Water
Observed_Change_2
Shortage of rainfall
Problems_Changes_2
Because of climate change and erratic
rainfall
KebeleName
GEWADA
Resources_4
Observed_Change_4
Problems_Changes_4
82
Page 4 of 9

Wereda Disaster
Risk Profile
National Disaster Risk Management
Commission (NDRMC)
Data_Collected_Date
Region S.N.N.P
January 1900
Zone SEGEN PEOPLES
Wereda ALLE SPECIAL
Thursday, July 11, 2019
Selected Indicator
Resources_1
Observed_Change_1
Problems_Changes_1
Environmental Situation: Natural Resources Availability - Natural resources available and changes observed by
the community
Land
Resources_3
Wood
Increase
Observed_Change_3
Decrease
decrease fertility of farm land
Problems_Changes_3
Fire the wood use in home
Resources_2
Observed_Change_2
Problems_Changes_2
Forest
decrease
Deforestation
Resources_4
Observed_Change_4
Problems_Changes_4
KebeleName
GOROZE
Resources_1
Land
Observed_Change_1
Increase
Problems_Changes_1
Farmland shortage
Resources_3
Observed_Change_3
Problems_Changes_3
Water
Decrease
Shortage of rain
Resources_2
Observed_Change_2
Problems_Changes_2
Forest
Decrease
Wood for house building
Resources_4
Observed_Change_4
Problems_Changes_4
KebeleName
GUMA
83
Page 5 of 9
Wereda Disaster
Risk Profile
National Disaster Risk Management
Commission (NDRMC)
Data_Collected_Date
Region S.N.N.P
January 1900
Zone SEGEN PEOPLES
Wereda ALLE SPECIAL
Thursday, July 11, 2019
Selected Indicator
Resources_1
Observed_Change_1
Problems_Changes_1
Environmental Situation: Natural Resources Availability - Natural resources available and changes observed by
the community
Forest
Resources_3
Water
Decrease
Observed_Change_3
Decrease
Deforestation
Problems_Changes_3
Due to drought / lack of enough rain
Resources_2
Observed_Change_2
Problems_Changes_2
Land
Increase
Farm land expansion
Resources_4
Observed_Change_4
Problems_Changes_4
KebeleName
KERKERT
Resources_1
Land
Observed_Change_1
Fertility and decreased
Problems_Changes_1
Over grazing of land lack of land
Resources_3
Observed_Change_3
Problems_Changes_3
Resources_2
Observed_Change_2
Problems_Changes_2
Forest
Deforestation
The climate change
Resources_4
Observed_Change_4
Problems_Changes_4
KebeleName
KOLANGO
84
Page 6 of 9

Wereda Disaster
Risk Profile
National Disaster Risk Management
Commission (NDRMC)
Data_Collected_Date
Region S.N.N.P
January 1900
Zone SEGEN PEOPLES
Wereda ALLE SPECIAL
Thursday, July 11, 2019
Selected Indicator
Resources_1
Observed_Change_1
Problems_Changes_1
Environmental Situation: Natural Resources Availability - Natural resources available and changes observed by
the community
Land
Resources_3
The size of farming land increase
Observed_Change_3
Grazing and forest land decreased
Problems_Changes_3
Resources_2
Observed_Change_2
Problems_Changes_2
Water
Water quality decreased
Shortage of water
Resources_4
Observed_Change_4
Problems_Changes_4
KebeleName
LALCHO
Resources_1
Land
Observed_Change_1
Problems_Changes_1
Resources_3
Observed_Change_3
Problems_Changes_3
Enset plantation
Resources_2
Observed_Change_2
Problems_Changes_2
Forest
Resources_4
Observed_Change_4
Problems_Changes_4
Coffee
KebeleName
LOKITE
85
Page 7 of 9

Wereda Disaster
Risk Profile
National Disaster Risk Management
Commission (NDRMC)
Data_Collected_Date
Region S.N.N.P
January 1900
Zone SEGEN PEOPLES
Wereda ALLE SPECIAL
Thursday, July 11, 2019
Selected Indicator
Resources_1
Observed_Change_1
Problems_Changes_1
Environmental Situation: Natural Resources Availability - Natural resources available and changes observed by
the community
Land
Resources_3
Increase
Observed_Change_3
Deforestation to expansion farm land
Problems_Changes_3
Resources_2
Observed_Change_2
Problems_Changes_2
Forest
Decrease
Loss of natural forestation
Resources_4
Observed_Change_4
Problems_Changes_4
KebeleName
TSEMEHA
Resources_1
Land
Observed_Change_1
Fertility land decreased
Problems_Changes_1
Resources_2
Over grazing of land because of population
increase
Forest
Observed_Change_2
Deforestation
Problems_Changes_2
The climate change
Resources_3
Observed_Change_3
Problems_Changes_3
Resources_4
Observed_Change_4
Problems_Changes_4
KebeleName
TURUBA
86
Page 8 of 9
Wereda Disaster
Risk Profile
National Disaster Risk Management
Commission (NDRMC)
Data_Collected_Date
Region S.N.N.P
January 1900
Zone SEGEN PEOPLES
Wereda ALLE SPECIAL
Thursday, July 11, 2019
Selected Indicator
Resources_1
Observed_Change_1
Problems_Changes_1
Environmental Situation: Natural Resources Availability - Natural resources available and changes observed by
the community
land
Resources_3
agricultural land increased
Observed_Change_3
Shortage of grazing land
Problems_Changes_3
Resources_2
Observed_Change_2
Problems_Changes_2
Forest
Deforestation increased
Shortage of fuel wood and construction
material and shortage of rainfall
Resources_4
Observed_Change_4
Problems_Changes_4
87
Page 9 of 9

Wereda Disaster
Risk Profile
National Disaster Risk Management
Commission (NDRMC)
Data_Collected_Date
January 1900
Region S.N.N.P
Selected Indicator
Zone SEGEN PEOPLES
Wereda ALLE SPECIAL
Environmental Situation: Rainfall & Temperature - Observed changes on rainfall and temperature by the
community over the last decade
Rainfall
Temperature
Thursday, July 11, 2019
Kebele Name
Changes Observed Problems
Changes Observed
Problems
KERKERT
TURUBA
KOLANGO
EYANA
LOKITE
GUMA
GOROZE
DELBENA GAMA
TSEMEHA
ADIS OLETEMA
GEWADA
Decreasing
Decreased
Low/ decline
Decrease
Decrease
Decrease
Decrease
Decreasing
Decreasing
Decrease
Decrease
Drought or climate change
Erratic rainfall and fluctuation
month to month
Erratic rainfall
Failure of crop and reduction
lack of water and pasture for
livestock, food insecurity
Climate change leads change of
rainfall level
Decrease the rainfall
Erratic rainfall and fluctuation
month s to month
Drought or climate change
Erratic rainfall/ shortage of rainfall
year to year
Crop production reduction
Increasing
Increased
Increased
Increase
Increase
Increase
Increase
Increasing
Increasing
Increase
Increase
Expansion of desertification
Semi - arid area change to arid area
Humidity decreased year to year
Change the kebele climate and weather
Change the weather condition of the
kebele
Climate change leads change of weather
condition
Weather condition change the
temperature increase
Most semi- arid area are change to arid
and humidity decreased years to years.
Expansion of desertification
Semi arid area are change to arid area,
humidity decreased
Season change
88
Page 1 of 2
Wereda Disaster
Risk Profile
National Disaster Risk Management
Commission (NDRMC)
Data_Collected_Date
January 1900
Region S.N.N.P
Selected Indicator
Zone SEGEN PEOPLES
Wereda ALLE SPECIAL
Environmental Situation: Rainfall & Temperature - Observed changes on rainfall and temperature by the
community over the last decade
Rainfall
Temperature
Thursday, July 11, 2019
Kebele Name
DIGINTY
DEGA MASHELE
BOLE
GERGEMA
DUGULO
LALCHO
Changes Observed Problems
Decrease
Fluctuation month to month and also
erratic rainfall
Decreasing
Climate change
Decreased
Low
Decrease
Drought is increased and erratic
rainfall is increased because of
climate change and deforestation
Erratic rainfall because of climate
change
Decreased
Changes Observed
Problems
Increase
Semi arid area are change to arid area
Increasing
Increasing
The expansion of desert
Expansion/ increased desertification
High
Increase
Increasing
Expansion of desertification year to year
89
Page 2 of 2
Data_Collected_Date
Region S.N.N.P
January 1900
Zone SEGEN PEOPLES
Thursday, July 11, 2019
Wereda ALLE SPECIAL
Selected Indicator
KebeleName
Environmental Situation: Reasons for Environmental Changes
Reason_For_Environmental_Changes
KERKERT
Deforestation increasing of desertification increasing
TURUBA
KOLANGO
EYANA
LOKITE
Deforestation is increased year to year so that most farm land are
exposed to soil erosion and also the production and productivity of farm
land decline.
Deforestation is increased the last decade so that most farm lands are
exposed to soil erosion and also decline the production and productivity,
over population / increased the size of people year to year.
GUMA
Deforestation for purpose of farm land, charcoal, house build, fire wood
GOROZE
Deforestation, increase of population
DELBENA GAMA
TSEMEHA
Increasing of desertification year to year because of lack of natural
resource management and also the population numbers increased
Expansion of deforestation, soil erosion and flood also increasing
ADIS OLETEMA
GEWADA
The main change of the environment is climate change, most forest land
change is to agricultural land because of shortage of farming land.
Climate change
DIGINTY
DEGA MASHELE
Increasing of population in community, increasing of deforestation
farmlands, over grazing, unwise use of watershed.
The kebele land before last decade covering by forest.
BOLE
GERGEMA
DUGULO
The size of population is increasing and also increasing deforestation year
to year, soil erosion and also increasing year to years
The main cause of climatic change the level of deforestation increase and
the population increase in the kebele.
Deforestation, over grazing in small are by mass of livestock
LALCHO
Deforestation because of in a last decade most of land covers with forest.
90
Page 1 of 1
Data_Collected_Date
Region S.N.N.P
January 1900
Zone SEGEN PEOPLES
Thursday, July 11, 2019
Wereda ALLE SPECIAL
Selected Indicator
KebeleName
KERKERT
Environmental Situation: Soil Erosion - Observed changes on levels of soil
erosion by the community
Changes_Observed
Problems_Observed
Increased
Productivity of crop decreasing
TURUBA
Increased
Loss of fertile soil year to year
KOLANGO
Increased
Loss of fertile soil year to year
EYANA
Increase
Decrease fertility of the farm land
LOKITE
Increase
Decrease the fertility of the soil
GUMA
GOROZE
Increase
Decrease
Outcome of deforestation, loss of forest leads to soil
erosion
Lack of forest erosion is increase
DELBENA GAMA
Increasing
Loss of fertile soil years to years
TSEMEHA
Increasing
Productivity of crop decreasing
ADIS OLETEMA
GEWADA
Increased
Increase
The production and productivity of the land is decline
and also the level of soil fertility decline
Decrease soil fertility
DIGINTY
Increase
Decline soil fertility year to year
DEGA MASHELE
Decreasing
Lack of rainfall
BOLE
Increasing
The production and productivity of land is decreased
GERGEMA
High
Yield production decline year to year
DUGULO
Increase
LALCHO
Increasing
91
Page 1 of 1
WDRP Indicators
Livelihood, Occupation and Source
of Food Characteristics
92

Wereda Disaster
Risk Profile
Data_Collected_Date
January 1900
National Disaster Risk Management
Commission (NDRMC)
Thursday, July 11, 2019
Region S.N.N.P
Zone
SEGEN PEOPLES
Wereda ALLE SPECIAL
Selected Indicator
Economic Vulnerability: Major Occupational Categories - Major categories of occupation and percent of population
engaged in the occupation by Kebele
Occupational Categories and Percent of Population engaged within these occupational categories
Percent (%) of Population
KebeleName
Occupation 1
Population Occupation 2
Population Occupation 3
Population Occupation 4
Population
KERKERT
Farming activity - Crop
production
80
Livestock production -
Fattening and diary
production
10
Honey production -
5
Off farm activity -
5
Honey production
Local drink
preparation
TURUBA
Agriculture - crop
70
Livestock - Fattening and
30
-
-
production
dairy production
KOLANGO
Agriculture` - Crop
production
70
Animal husbandry -
Fattening and other
livestock production
20
Honey production -
Honey production
10
-
EYANA
Agricultural activity -
70
Livestock production -
30
-
-
Crop production
Fattening and diary
production
LOKITE
Crop production - Crop
70
Livestock production -
30
-
-
sowing and harvesting
Animal husbandry, milk
cow and butter
GUMA
Agriculture - Crop
70
Livestock - Animal
30
-
-
production
husbandry, fattening, milk
honey
GOROZE
Crop production - Crop
70
livestock activity -
30
-
-
production
Livestock production, like
dairy production
DELBENA GAMA
Crop production -
Livestock activity -
-
-
93
Page 1 of 3
Wereda Disaster
Risk Profile
Data_Collected_Date
January 1900
National Disaster Risk Management
Commission (NDRMC)
Thursday, July 11, 2019
Region S.N.N.P
Zone
SEGEN PEOPLES
Wereda ALLE SPECIAL
Selected Indicator
Economic Vulnerability: Major Occupational Categories - Major categories of occupation and percent of population
engaged in the occupation by Kebele
Occupational Categories and Percent of Population engaged within these occupational categories
Percent (%) of Population
KebeleName
Occupation 1
Population Occupation 2
Population Occupation 3
Population Occupation 4
Population
TSEMEHA
ADIS OLETEMA
GEWADA
DIGINTY
Farming - Crop
production
Farming - Crop
production
Agriculture - Crop
production
Crop production -
70
Livestock activity -
Fattening and dairy
farming
Livestock - Fattening and
dairy production
85
Livestock production -
Fattening and dairy
production
60
Livestock production -
20
Off farming activity -
10
-
Honey production,
local drinking
production
Off farming -
-
Preparing local drink (
cheka )
15
-
-
40
-
-
DEGA MASHELE
BOLE
GERGEMA
DUGULO
Farming - Crop
production
Farming - Crop
production
Farming - Crop
production
Agriculture - Crop
production and
livestock production
75
Livestock - Fattening and
diary production
60
Livestock activities -
Livestock productionand
diary production
60
Livestock - Fattening and
diary production
100
-
15
Off farming activity -
Preparation of local
drink ( cheka )
35
Off farming - Honey
production activity
40
-
-
10
-
5
-
-
-
94
Page 2 of 3
Wereda Disaster
Risk Profile
Data_Collected_Date
January 1900
National Disaster Risk Management
Commission (NDRMC)
Thursday, July 11, 2019
Region S.N.N.P
Zone
SEGEN PEOPLES
Wereda ALLE SPECIAL
Selected Indicator
Economic Vulnerability: Major Occupational Categories - Major categories of occupation and percent of population
engaged in the occupation by Kebele
Occupational Categories and Percent of Population engaged within these occupational categories
Percent (%) of Population
KebeleName
Occupation 1
Population Occupation 2
Population Occupation 3
Population Occupation 4
Population
LALCHO
Farming -
Livestock activity -
-
-
95
Page 3 of 3

Data_Collected_Date
Region S.N.N.P
January 1900
Zone SEGEN PEOPLES
Thursday, July 11, 2019
Wereda ALLE SPECIAL
Selected Indicator
Economic Vulnerability: Livelihoods - Households important sources of
livelihood (response in %)
Type of Livelihood Activity
Order of Importnce
Agricultural laborer
1st
2nd
3rd
2.82
1.67
8.80
Animal herder
0.00
0.00
0.46
Basket-making, Mat-making
1.03
1.11
0.93
Buying and selling livestock (cattle, sheep, goats, camels)
1.28
10.86
29.17
Counselor (disputes, marriage)
0.00
1.11
1.39
Daily laborer
1.79
3.34
0.46
Henna (decoration)
0.00
0.28
0.46
Making jewellery
0.00
0.84
0.00
Making traditional utensils or farm tools
0.00
4.46
0.46
Others
0.00
1.39
1.39
Rearing & selling animals (camels, cattle, sheep, goats)
4.36
44.57
6.94
Religious teacher
0.00
0.00
0.46
Restaurant or hotel worker
0.00
0.00
0.46
96
Page 1 of 3

Data_Collected_Date
Region S.N.N.P
January 1900
Zone SEGEN PEOPLES
Thursday, July 11, 2019
Wereda ALLE SPECIAL
Selected Indicator
Economic Vulnerability: Livelihoods - Households important sources of
livelihood (response in %)
Type of Livelihood Activity
Order of Importnce
1st
2nd
3rd
Salaried job
0.26
0.84
0.46
Sale_Of_Natural_Products - Animal feed (grass, fodder, forage, salty
sand, etc.)
Sale_Of_Natural_Products - Charcoal
0.00
0.28
0.93
0.00
0.84
0.00
Sale_Of_Natural_Products - Construction materials (sand, grass,
wooden poles, etc.)
Sale_Of_Natural_Products - Firewood
0.00
0.28
0.00
0.00
0.56
0.46
Sale_Of_Natural_Products - Incense, frankincense, and natural gum
0.00
0.28
0.46
Sale_Of_Natural_Products - Precious stones (gold, gem-stones)
0.26
0.00
0.00
Sale_Of_Natural_Products - Water
0.00
0.00
0.46
Sale_Of_Natural_Products - Wild fruits
0.26
0.00
0.00
Selling Building materials and hardware
0.26
0.84
1.39
Selling Cereal food crops (sorghum, maize, wheat, barley)
83.33
5.29
4.17
Selling Clothes and shoes
0.00
0.84
0.00
Selling dairy products (milk, butter, ghee, cheese)
0.26
0.00
0.46
97
Page 2 of 3
Data_Collected_Date
Region S.N.N.P
January 1900
Zone SEGEN PEOPLES
Thursday, July 11, 2019
Wereda ALLE SPECIAL
Selected Indicator
Economic Vulnerability: Livelihoods - Households important sources of
livelihood (response in %)
Type of Livelihood Activity
Order of Importnce
1st
2nd
3rd
Selling eggs (from own chickens) Beekeeping (selling honey
bees-wax, or bee-hives)
1.79
11.98
26.85
Selling fruit juice (orange, etc) or soft drink (Fanta, etc)
0.00
0.00
0.93
Selling Fruits (mango, papaya, banana, orange, lemon, etc.)
0.51
1.67
2.31
Selling hides and skins (from goats, sheep, cattle)
0.00
0.28
0.00
Selling meat (from own livestock)
0.26
0.00
0.93
Selling Other foods (sugar, flour, coffee, etc.)
0.00
0.00
0.46
Selling Pulses (beans, cow-pea, chick-pea)
0.26
0.28
0.46
Selling Root crops (Irish potato, sweet potato)
0.00
1.11
6.94
Selling Vegetables (onion, tomato, cabbage, pumpkin, etc.)
0.77
1.67
0.46
Water-carrier, Porter
0.00
0.56
0.46
Weaving, Knitting, Embroidery, Tailoring
0.51
2.79
0.00
98
Page 3 of 3

Data_Collected_Date
Region S.N.N.P
January 1900
Zone
SEGEN PEOPLES
Thursday, July 11, 2019
Wereda ALLE SPECIAL
Selected Indicator
Economic Vulnerability: Occupational Categories - Percent of population
above 15 years age by occupation categories
Type of Livelihood Activity
Main Occupation
Secondary Occupation
B)Student
C)Unemployed & seeking work
D)Neither studying nor working nor seeking work
E)Retired/ Old
F)Cultivator
G)Agricultural labourer
H)Livestock rearing
I)Non-agricultural labour
J)Craftsman
K)Shopkeeper and Petty trade
L)Home-maker (housewife)
M)Salaried
N)Chronically ill
O)Physically disabled
P)Others (specify)
Q)None
R)Herder
S)Herder
1st Occupation
21.02
1.40
0.19
1.40
59.44
0.19
1.67
1.02
0.65
0.93
10.33
0.19
0.09
0.28
1.21
2nd Occupation
1.30
1.06
0.12
0.83
5.56
1.06
23.40
2.13
4.96
6.97
28.25
1.30
18.91
0.12
4.02
99
Page 1 of 1

Wereda Disaster Risk
Profile
National Disaster Risk Management
Commission (NDRMC)
Data_Collected_Date
Region S.N.N.P
January 1900
Zone
SEGEN PEOPLES
Wereda ALLE SPECIAL
Thursday, July 11, 2019
Selected Indictor: Economic Vulnerability: Sources of Food - Households source for different food items (response in %)
Source of Food
Types of Food Item
A)Own
cultivation/production
B)Casual labor
C)Borrowed
D)Gifts from
friends/neighbors
E)Purchases from main
shop
100
Page 1 of 3

Wereda Disaster Risk
Profile
National Disaster Risk Management
Commission (NDRMC)
Data_Collected_Date
Region S.N.N.P
January 1900
Zone
SEGEN PEOPLES
Wereda ALLE SPECIAL
Thursday, July 11, 2019
Selected Indictor: Economic Vulnerability: Sources of Food - Households source for different food items (response in %)
Source of Food
Types of Food Item
F)Free meals/Food
assistance
G)Purchase from
roadside vendor/tuck
shop
H)Purchase subsidized
food from Kebele shop
I)Gathering catching
J)Begging
101
Page 2 of 3
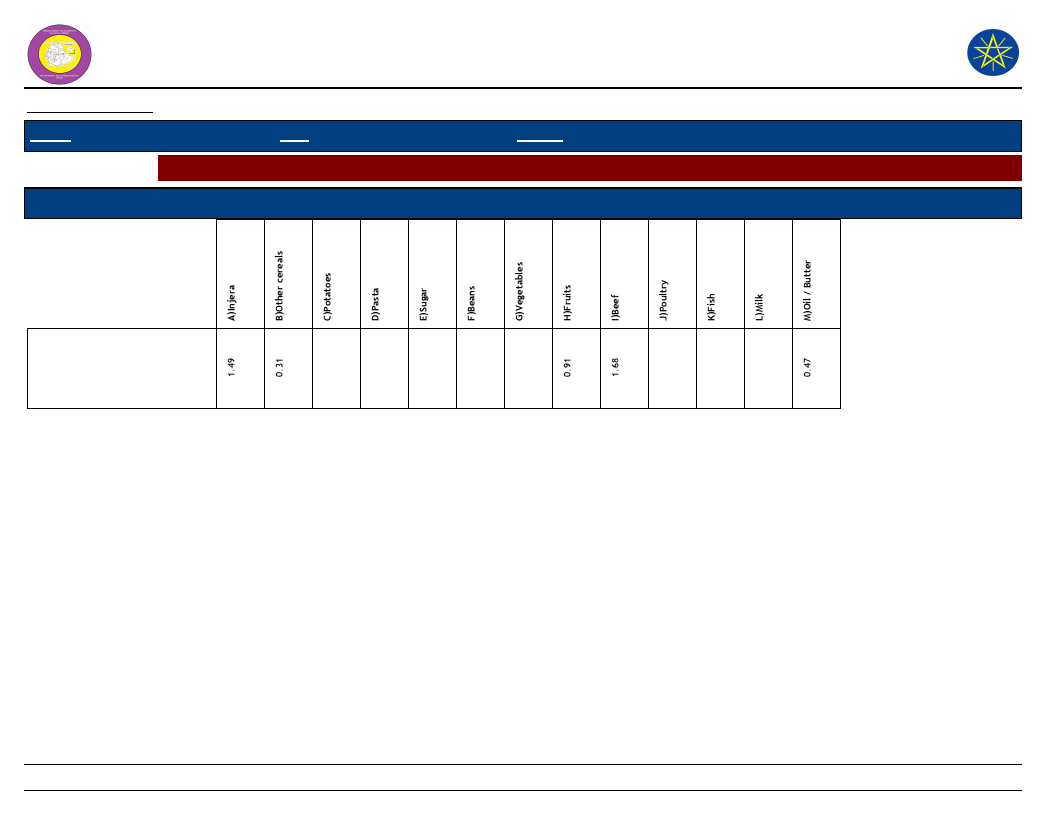
Wereda Disaster Risk
Profile
National Disaster Risk Management
Commission (NDRMC)
Data_Collected_Date
Region S.N.N.P
January 1900
Zone
SEGEN PEOPLES
Wereda ALLE SPECIAL
Thursday, July 11, 2019
Selected Indictor: Economic Vulnerability: Sources of Food - Households source for different food items (response in %)
Source of Food
Types of Food Item
K)Other
102
Page 3 of 3
WDRP Indicators
Crop Production Characteristics
103
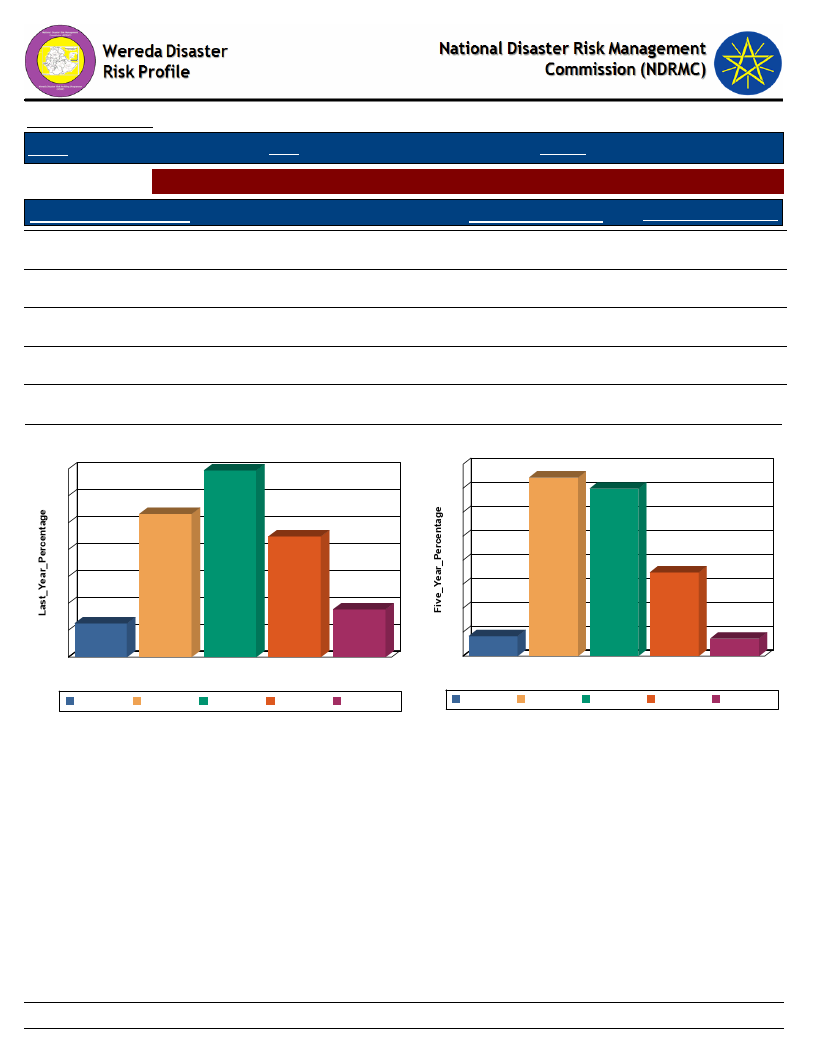
Data_Collected_Date
Region S.N.N.P
January 1900
Zone SEGEN PEOPLES
Thursday, July 11, 2019
Wereda ALLE SPECIAL
Selected Indictor: Hazards: Change in Crop Damages - Proportion of Total Crop Damage
Extent of Crop Damage (%)
0%
Last_Year_Percentage
6.27
Five_Year_Percentage
4.17
1 - 25 %
26.63
37.24
26 - 50 %
34.73
34.90
51 - 75 %
22.45
17.45
76 - 100 %
8.88
3.65
Extent of Crop Damage Last_Year
35
35
30
27
25
22
20
15
10
9
6
5
0
0%
0%
1 - 25 %
26 - 50 %
51 - 75 %
Extent of Crop Damage
1 - 25 %
26 - 50 %
51 - 75 %
76 - 100 %
76 - 100 %
Extent of Crop Damage Five Years Ago
40
37
35
35
30
25
20
17
15
10
5
4
4
0
0%
0%
1 - 25 %
26 - 50 % 51 - 75 %
Extent of Crop Damage
76 - 100 %
1 - 25 %
26 - 50 %
51 - 75 %
76 - 100 %
104
Page 1 of 1
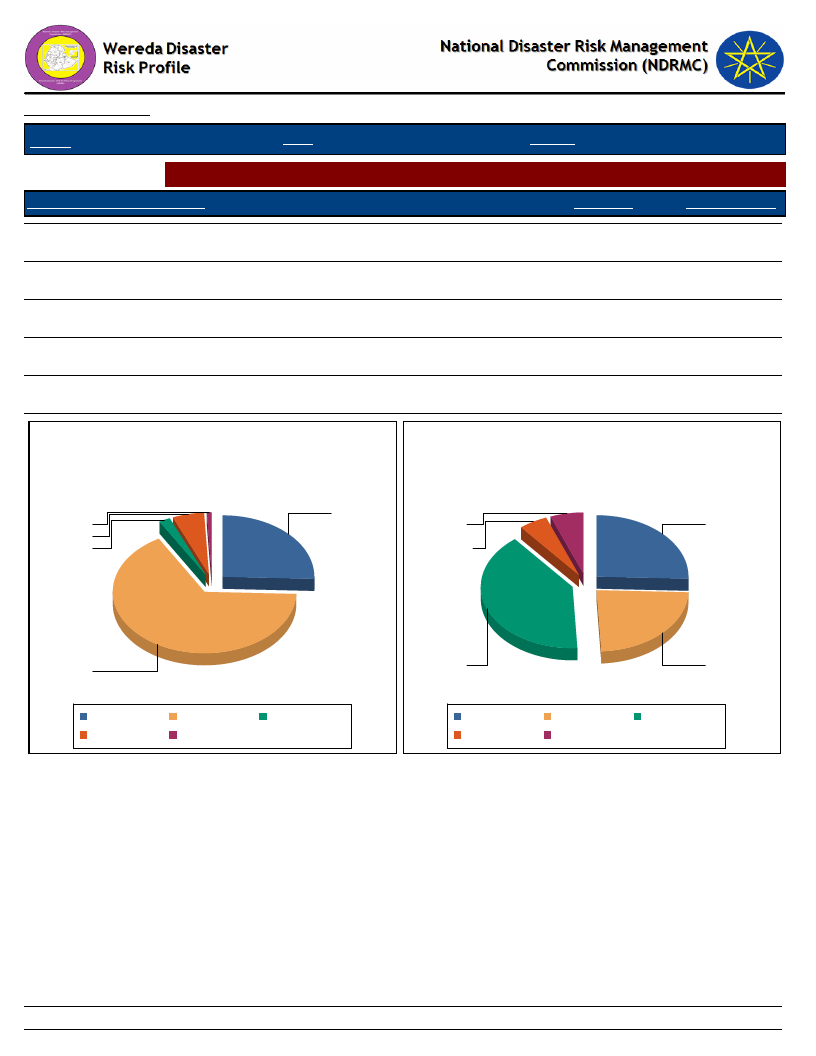
Data_Collected_Date
January 1900
Thursday, July 11, 2019
Region S.N.N.P
Zone SEGEN PEOPLES
Wereda ALLE SPECIAL
Selected Indictor: Hazards: Change in Crop Damages - Major reasons for crop damage
Major Reason of Crop Damage
Last_Year
Five_Year_Ago
A - Pests, Insects, Weeds
25.59
25.46
B - Drought
65.96
23.62
C - Flood
2.11
40.16
D - Frost/ Cold wave
5.54
4.99
E - Others (specify)
0.79
5.77
Major Reason of Crop Damage -
Last Year
25.6
0.8
5.5
2.1
Major Reason of Crop Damage -
Five Years Ago
E - Others
(specify)
D - Frost/ Cold
wave
A - Pests,
Insects,
Weeds
66.0
A - Pests, Insects,
Weeds
D - Frost/ Cold wave
B - Drought
E - Others (specify)
C - Flood
C - Flood
A - Pests, Insects,
Weeds
D - Frost/ Cold wave
B - Drought
E - Others (specify)
C - Flood
B-
Drought
105
Page 1 of 1
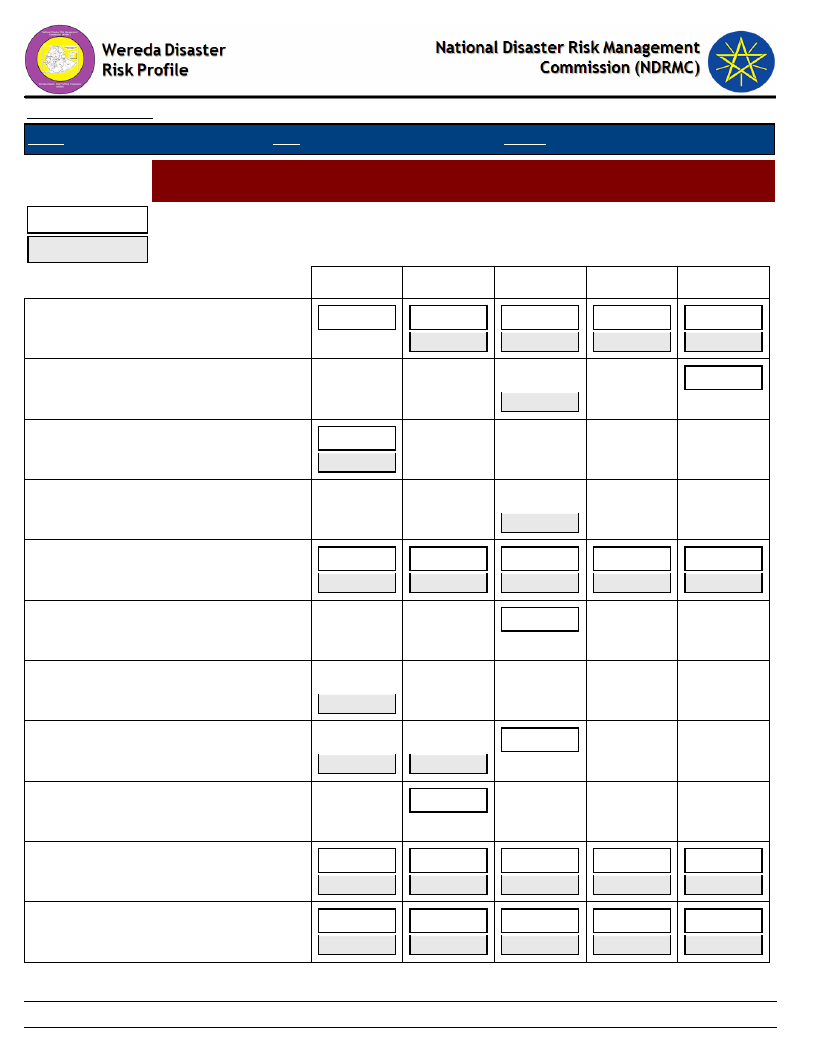
Data_Collected_Date
Region S.N.N.P
January 1900
Zone SEGEN PEOPLES
Thursday, July 11, 2019
Wereda ALLE SPECIAL
Selected Indictor:
Last Year
Hazards: Change in Crop Damages - Proportion of Damage for Major Crops
(percentage response by households)
Five Years Ago
0%
1-25%
26-50%
51-75%
76-100%
Barley
8.00
38.00
24.00
28.00
2.00
40.00
32.73
23.64
3.64
Beans
100.00
100.00
Enset
100.00
100.00
Linseed
100.00
Maize
7.19
32.34
29.34
18.56
11.38
5.62
33.71
37.08
16.85
5.62
Millet
100.00
Other grain (specify)
Other pulses
Peas
100.00
50.00
50.00
100.00
100.00
Sorghum
Teff
6.90
13.79
24.14
34.48
17.24
2.78
30.56
38.89
16.67
2.78
3.20
16.80
48.80
24.80
5.60
1.01
45.45
29.29
18.18
1.01
106
Page 1 of 2
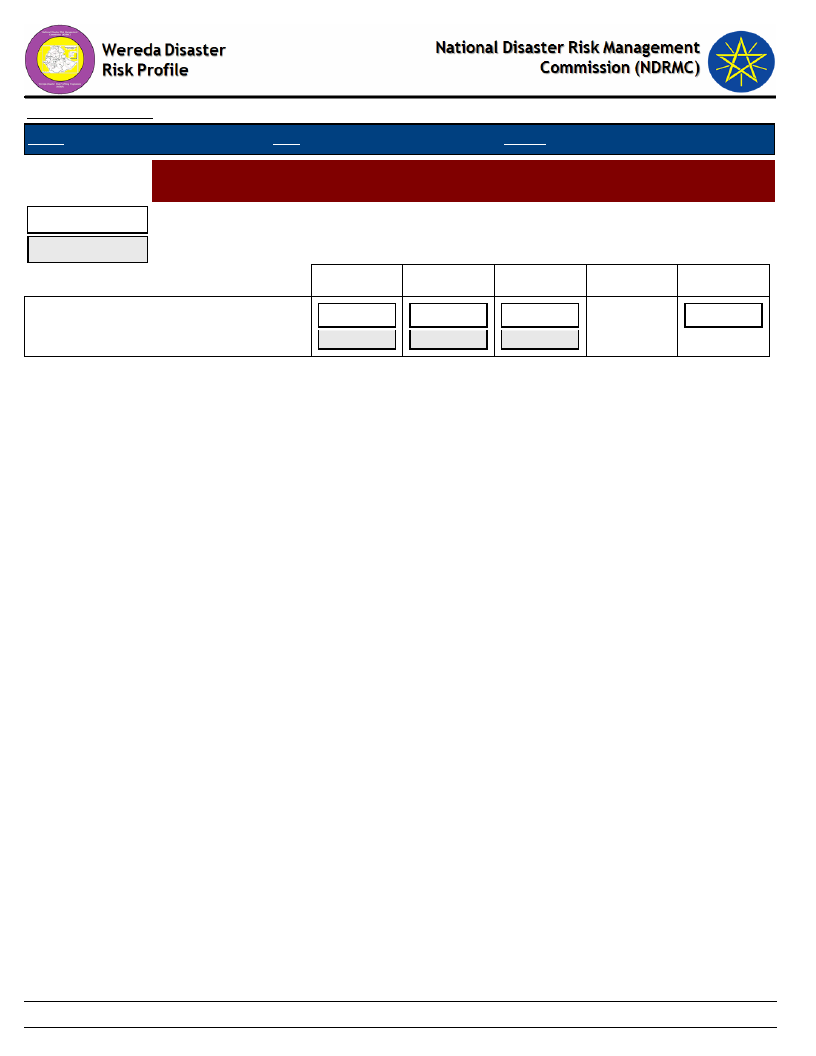
Data_Collected_Date
Region S.N.N.P
January 1900
Zone SEGEN PEOPLES
Thursday, July 11, 2019
Wereda ALLE SPECIAL
Selected Indictor:
Last Year
Hazards: Change in Crop Damages - Proportion of Damage for Major Crops
(percentage response by households)
Five Years Ago
0%
1-25%
26-50%
51-75%
76-100%
Wheat
16.67
10.00
50.00
40.00
16.67
50.00
16.67
107
Page 2 of 2
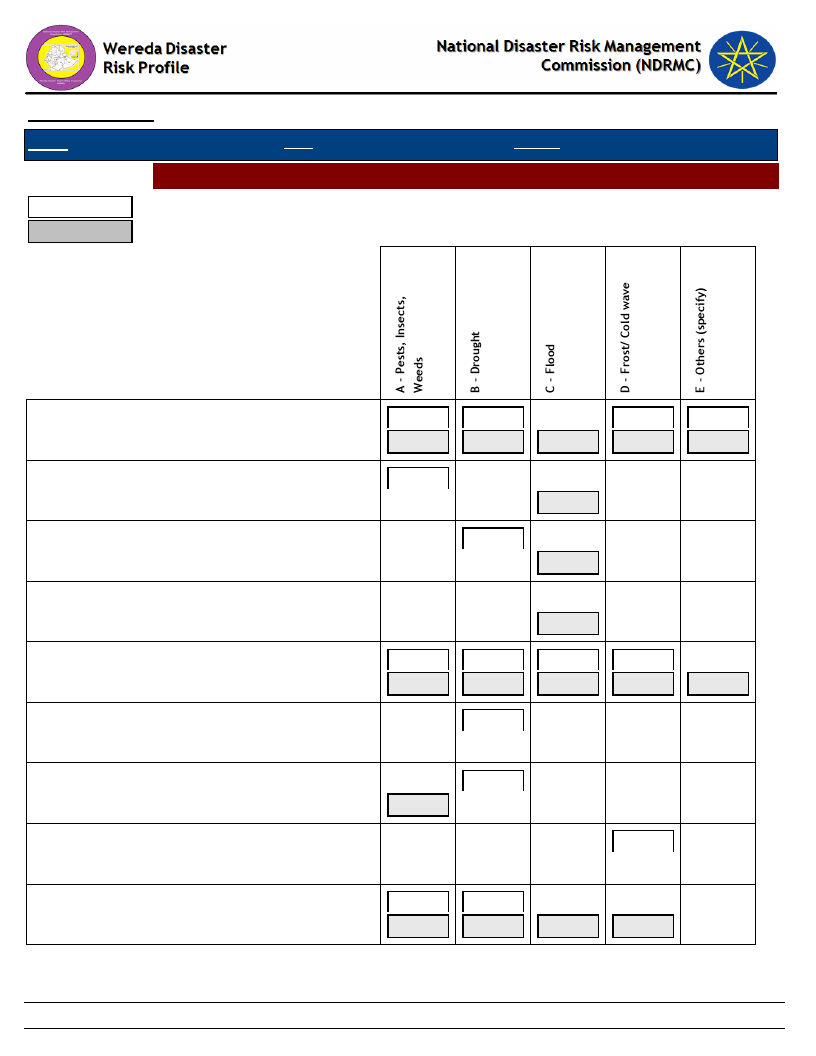
Data_Collected_Date
Region S.N.N.P
January 1900
Zone SEGEN PEOPLES
Thursday, July 11, 2019
Wereda ALLE SPECIAL
Hazards: Change in Crop Damages - Reasons for Damage of Major Crops
Last Year
Five Years Ago
Barley
Beans
Enset
Linseed
Maize
Millet
Other pulses
Peas
Sorghum
22.45
21.82
100.00
46.94
25.45
100.00
27.27
100.00
100.00
28.57
1.82
2.04
23.64
100.00
33.73
62.65
2.41
1.20
33.90
17.51
42.94
2.26
3.39
100.00
100.00
100.00
100.00
31.03
14.29
68.97
45.71
20.00
20.00
108
Page 1 of 2
Data_Collected_Date
Region S.N.N.P
January 1900
Zone SEGEN PEOPLES
Thursday, July 11, 2019
Wereda ALLE SPECIAL
Hazards: Change in Crop Damages - Reasons for Damage of Major Crops
Last Year
Five Years Ago
Teff
Wheat
13.93
13.13
50.00
50.00
77.87
26.26
50.00
30.00
3.28
52.53
3.28
6.06
10.00
1.64
2.02
10.00
109
Page 2 of 2
Wereda Disaster
Risk Profile
Data_Collected_Date
January 1900
Region
S.N.N.P
Zone
SEGEN PEOPLES
National Disaster Risk Management
Commission (NDRMC)
Thursday, July 11, 2019
Wereda
ALLE SPECIAL
Selected Indictor:
Kebele Name
KERKERT
Agricultural Situation: Change in Crops Grown - Five major crops grown by proportion of total cultivated land
Major Crops
Main Season
Present
Cropped Area
Five_Years_Ago
Reason_For_Change
Maize
Belg
35
30
Accessing of fertilizer
Haricot Bean
Belg
10
10
No change
Sorghum
Belg
30
35
Teff
Belg
20
15
Access of fertilizer
TURUBA
Sorghum
Belg
20
5
Access of seed and fertilizer
KOLANGO
Teff
Haricot Bean
Maize
Maize
Belg and
30
Meher
Belg and
10
Meher
Belg and
40
Meher
Belg
50
40
Access of seed and fertilizer
5
Access of seed and fertilizer
50
Access of seed and fertilizer
40
Increases cultivated land
Teff
Meher
60
50
Increases cultivated land
EYANA
Teff
Sorghum
Haricot Bean
Soya Bean
Belg and
Meher
Belg and
Meher
Belg and
Meher
Belg and
Meher
30
20
20
10
5
10
5
10
110
Page 1 of 6
Wereda Disaster
Risk Profile
Data_Collected_Date
January 1900
Region
S.N.N.P
Zone
SEGEN PEOPLES
National Disaster Risk Management
Commission (NDRMC)
Thursday, July 11, 2019
Wereda
ALLE SPECIAL
Selected Indictor:
Kebele Name
EYANA
LOKITE
Agricultural Situation: Change in Crops Grown - Five major crops grown by proportion of total cultivated land
Major Crops
Main Season
Present
Cropped Area
Five_Years_Ago
Reason_For_Change
Maize
Belg and
40
Meher
50
Because of climate condition
Maize
Belg and
30
Meher
50
Shortage of rain
Sorghum
Belg
10
20
Shortage of rain
GUMA
Haricot Bean
Teff
Teff
Haricot Bean
Sorghum
Belg and
30
Meher
Belg and
30
Meher
Belg and
30
Meher
Belg and
25
Meher
Belg
5
20
Shortage of rain
20
Shortage of rain
20
20
10
GOROZE
Maize
Maize
Sorghum
Haricot Bean
Belg and
40
Meher
Belg
50
Belg and
10
Meher
Belg and
10
Meher
50
Change of the climate comes drought to resist
the drought use short season crop production
50
Climate change most farming is depending on
rain fed agricultural production
5
Climate change most farming is depending on
rain fed agricultural production
5
Climate change most farming is depending on
rain fed agricultural production
111
Page 2 of 6

Wereda Disaster
Risk Profile
Data_Collected_Date
January 1900
Region
S.N.N.P
Zone
SEGEN PEOPLES
National Disaster Risk Management
Commission (NDRMC)
Thursday, July 11, 2019
Wereda
ALLE SPECIAL
Selected Indictor:
Kebele Name
GOROZE
DELBENA GAMA
Agricultural Situation: Change in Crops Grown - Five major crops grown by proportion of total cultivated land
Major Crops
Main Season
Present
Cropped Area
Five_Years_Ago
Reason_For_Change
Teff
Belg and
30
40
Climate change most farming is depending on
Meher
rain fed agricultural production
Haricot Bean
Belg
35
30
Short season crop
Maize
Belg
20
25
Lack of rain
Sorghum
Belg
15
15
Lack of rain
Teff
Belg
45
30
Short season crop
TSEMEHA
ADIS OLETEMA
Maize
Haricot Bean
Teff
Sorghum
Wheat
Belg and
35
Meher
Belg and
10
Meher
Belg and
20
Meher
Belg and
30
Meher
Belg
30
Access of fertilizer
10
15
Access of fertilizer
35
Teff
Meher
Maize
Haricot Bean
Barley
Belg and
Meher
Belg and
Meher
Belg
112
Page 3 of 6

Wereda Disaster
Risk Profile
Data_Collected_Date
January 1900
National Disaster Risk Management
Commission (NDRMC)
Thursday, July 11, 2019
Region
S.N.N.P
Zone
SEGEN PEOPLES
Wereda
ALLE SPECIAL
Selected Indictor:
Kebele Name
GEWADA
Agricultural Situation: Change in Crops Grown - Five major crops grown by proportion of total cultivated land
Major Crops
Main Season
Present
Cropped Area
Five_Years_Ago
Reason_For_Change
Maize
---------
Millet
---------
Haricot Bean
---------
Sorghum
---------
Teff
---------
DIGINTY
Haricot Bean
Teff
Maize
Belg and
30
Meher
Belg and
30
Meher
Belg
40
10
Is one of short season
20
Shortage of rain
50
Shortage of rain and irrigation
DEGA MASHELE
BOLE
Barley
Teff
Wheat
Maize
Beans
Belg and
Meher
Belg and
Meher
Belg and
Meher
Belg and
Meher
Belg and
5
Meher
Decreased
Decreased
113
Page 4 of 6
Wereda Disaster
Risk Profile
Data_Collected_Date
January 1900
Region
S.N.N.P
Zone
SEGEN PEOPLES
National Disaster Risk Management
Commission (NDRMC)
Thursday, July 11, 2019
Wereda
ALLE SPECIAL
Selected Indictor:
Kebele Name
BOLE
Agricultural Situation: Change in Crops Grown - Five major crops grown by proportion of total cultivated land
Major Crops
Sorghum
Main Season
Belg and
Meher
Present
20
Cropped Area
Five_Years_Ago
10
Reason_For_Change
Teff
Meher
25
15
GERGEMA
Maize
Maize
Belg and
50
Meher
Meher
40
40
Improved seed and also access of fertilizer
50
Food access of fertilized and improved seed
Haricot Bean
Belg and
10
5
Meher
Teff
Belg
30
40
Sorghum
Meher
10
5
DUGULO
Sorghum
Belg
20
LALCHO
Wheat
Teff
Haricot Bean
Maize
Maize
Belg and
10
Meher
Belg and
10
Meher
Belg and
20
Meher
Belg and
40
Meher
Belg
Teff
Meher
114
Page 5 of 6
Wereda Disaster
Risk Profile
Data_Collected_Date
January 1900
National Disaster Risk Management
Commission (NDRMC)
Thursday, July 11, 2019
Region
S.N.N.P
Zone
SEGEN PEOPLES
Wereda
ALLE SPECIAL
Selected Indictor:
Kebele Name
LALCHO
Agricultural Situation: Change in Crops Grown - Five major crops grown by proportion of total cultivated land
Major Crops
Main Season
Present
Cropped Area
Five_Years_Ago
Reason_For_Change
Haricot Bean
Belg
Wheat
Meher
Barley
Meher
115
Page 6 of 6
Data_Collected_Date
January 1900
Thursday, July 11, 2019
Region S.N.N.P
Zone SEGEN PEOPLES
Wereda ALLE SPECIAL
Selected Indictor:
Agricultural Situation: Access to Extension - Perception of the community on
Access to Agricultural extension Services
KebeleName
Current_Level
Change_In_Last_Decade
Comments
KERKERT
TURUBA
KOLANGO
Access agricultural extension
Good
The farmers awareness
increase
Increased
Good
increased
EYANA
Less access
Increase
The farmers know the
advantage of agricultural
inputs
Development agents are
support farmers by
extension but not enough
Development agents are
supporting farmers by
extension services but not
enough
Increase year to year
LOKITE
Less access
Increase
GUMA
Better
GOROZE
DELBENA GAMA
TSEMEHA
Moderate
Access to agriculture
extension
Use agricultural extension
Increase
Increase
Increasing
Increasing
Related with climate
change government
support agriculture
extension services.
Both livestock and
agriculture offices helps
our communities
Give kebele development
agents
High awareness creation
Use extension program
ADIS OLETEMA
Good
GEWADA
Better access
Increased
Less access
Development agents are
support female by
extension but not enough
DIGINTY
Less access
DEGA MASHELE
Use agriculture extension
Increasing
The farmers aware the
advantage of modern
technology
116
Page 1 of 2
Data_Collected_Date
January 1900
Thursday, July 11, 2019
Region S.N.N.P
Zone SEGEN PEOPLES
Wereda ALLE SPECIAL
Selected Indictor:
Agricultural Situation: Access to Extension - Perception of the community on
Access to Agricultural extension Services
KebeleName
BOLE
GERGEMA
DUGULO
Current_Level
Use agriculture extension
Good
Increase
Change_In_Last_Decade
Increasing
Increased
Increase
Comments
Use agricultural extension
service
The farmer knowledge is
increased year to year
LALCHO
Good
Increasing
Use extension
117
Page 2 of 2
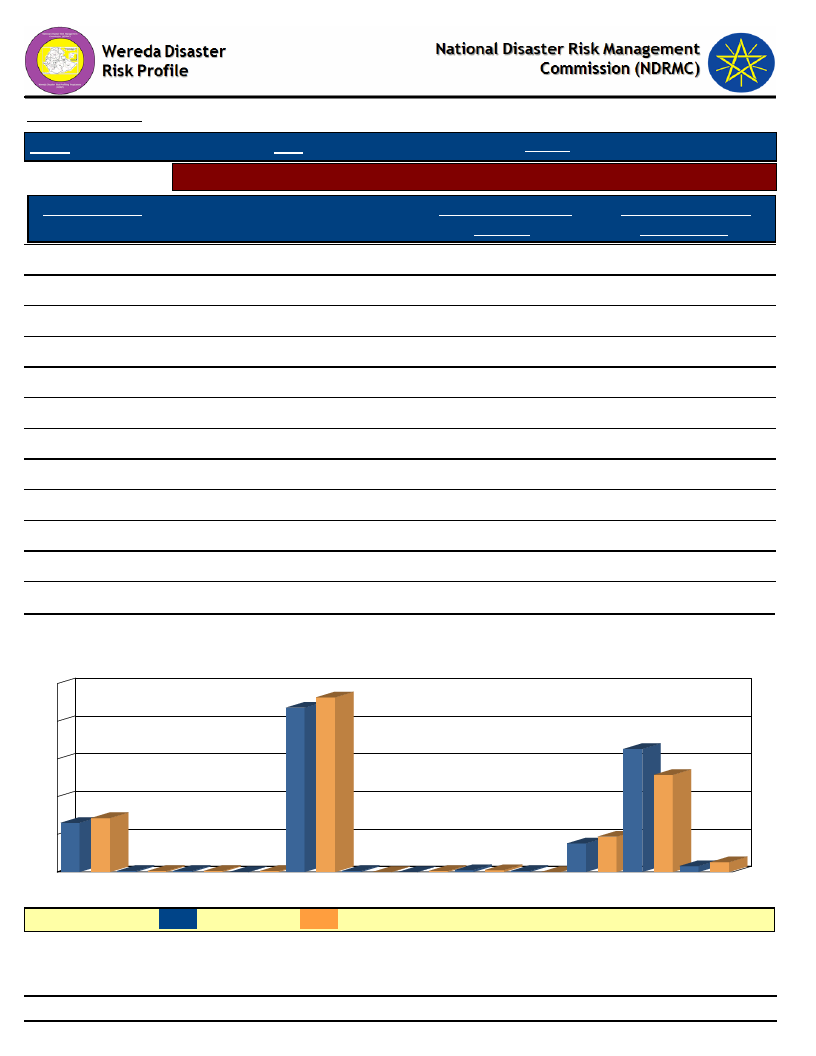
Data_Collected_Date
Region S.N.N.P
January 1900
Zone SEGEN PEOPLES
Wereda
Thursday, July 11, 2019
ALLE SPECIAL
Selected Indicator
Economic Vulnerability: Crops Grown - Types of crops grown by households
Major Crop Type
Maize
Type of Crops Grown
Last Year
43.60
Type of Crops Grown
Five Years Ago
46.35
Teff
32.64
25.78
Barley
13.05
14.32
Sorghum
7.57
9.38
Wheat
1.57
2.60
Other pulses
0.52
0.52
Enset
0.26
0.26
Beans
0.26
0.26
Peas
0.26
0.00
Millet
0.26
0.00
Other grain (specify)
0.00
0.26
Linseed
0.00
0.26
Types of Crops Grown - Percent Responses of HHs for Last Year as compared to
Five Years Ago
50
46
44
40
33
30
26
20
13 14
10
9
8
0
00
00
0
0
0
00
01
10
0
2
3
Barley
Beans
Enset
Linseed
Maize
Millet
Other grain
(specify)
Other
pulses
Peas
Sorghum
Teff
Wheat
LEGEND :
Last year
Five Years Ago
118
Page 1 of 1
Data_Collected_Date
Region S.N.N.P
January 1900
Zone
SEGEN PEOPLES
Thursday, July 11, 2019
Wereda ALLE SPECIAL
Selected Indictor:
Economic Vulnerability: Crops Grown - Proportion of households by amount of
yield of major crops (last year)
Barley
44.00
50.00
6.00
Beans
100.00
Enset
100.00
Linseed
Maize
29.34
65.87
3.59
1.20
Millet
100.00
Other grain (specify)
Other pulses
50.00
50.00
Peas
100.00
Sorghum
37.93
55.17
3.45
3.45
Teff
26.40
62.40
10.40
0.80
Wheat
33.33
66.67
119
Page 1 of 1
Data_Collected_Date
Region S.N.N.P
January 1900
Zone SEGEN PEOPLES
Thursday, July 11, 2019
Wereda ALLE SPECIAL
Selected Indictor:
Economic Vulnerability: Crops Grown - Proportion of households by amount of
yield of major crops (Five Years Ago)
Types of Major Crops
Category of Yield used to be obtained five years ago
Barley
Beans
Enset
Linseed
Maize
Millet
Other grain (specify)
Other pulses
Peas
Sorghum
Teff
Wheat
34.55
61.82
3.64
100.00
100.00
100.00
19.66
71.91
8.43
100.00
100.00
19.44
69.44
11.11
31.31
63.64
4.04
1.01
20.00
80.00
120
Page 1 of 1
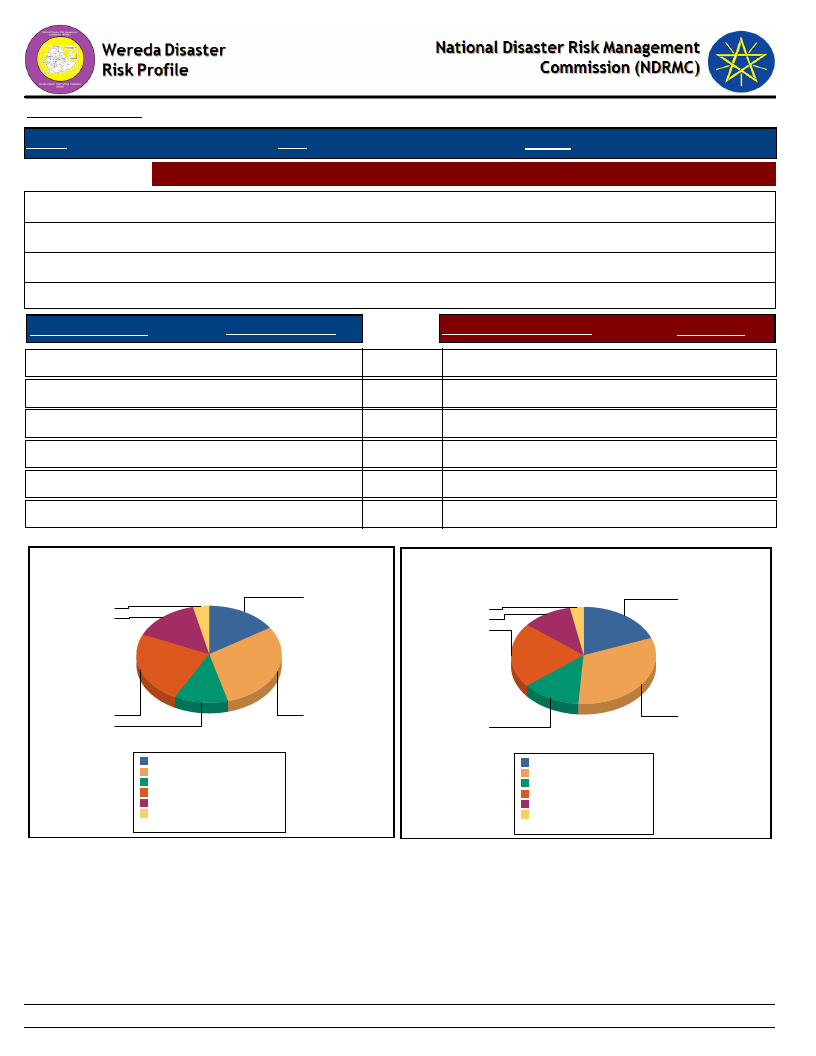
Data_Collected_Date
January 1900
Thursday, July 11, 2019
Region S.N.N.P
Zone SEGEN PEOPLES
Wereda ALLE SPECIAL
Selected Indictor: Economic Vulnerability: Land Ownership and Quality - Landownership of HHs
Households owning land (%)
Average landholding (in Hectares)s
Households cultivating land in last 12 months (%)
Average quantity of land cultivated (in hectares)
97.16
0.75
93.01
2.53
Range Land Holding
Percent_Response
Range of Cultivated Land
% Response
A - Less than 0.25 ha
16.0
B - 0.25 - 0.50 ha
30.0
D - 0.75 - 1 ha
24.0
E - 1 - 2 ha
15.0
C - 0.5 - 0.75 ha
12.0
F - More than 2 ha
4.0
IMPORTANT: ha = Hectars
Household Responses to Range Land Holding
A - Less than 0.25 ha
19.0
B - 0.25 - 0.50 ha
32.0
D - 0.75 - 1 ha
21.0
E - 1 - 2 ha
11.0
C - 0.5 - 0.75 ha
13.0
F - More than 2 ha
3.0
Household Responses to Range Cultivated Land
15.9
19.1
3.7
2.9
14.6
11.1
21.5
24.1
11.9
30.0
A - Less than 0.25 ha
B - 0.25 - 0.50 ha
C - 0.5 - 0.75 ha
D - 0.75 - 1 ha
E - 1 - 2 ha
F - More than 2 ha
15.9%
29.9%
11.9%
24.1%
14.6%
3.7%
Total:
100.0%
31.8
13
A - Less than 0.25 ha 19.1
B - 0.25 - 0.50 ha
31.8
C - 0.5 - 0.75 ha
13
D - 0.75 - 1 ha
21.5
E - 1 - 2 ha
11.1
F - More than 2 ha
2.9
Total:
99.5
121
Page 1 of 1
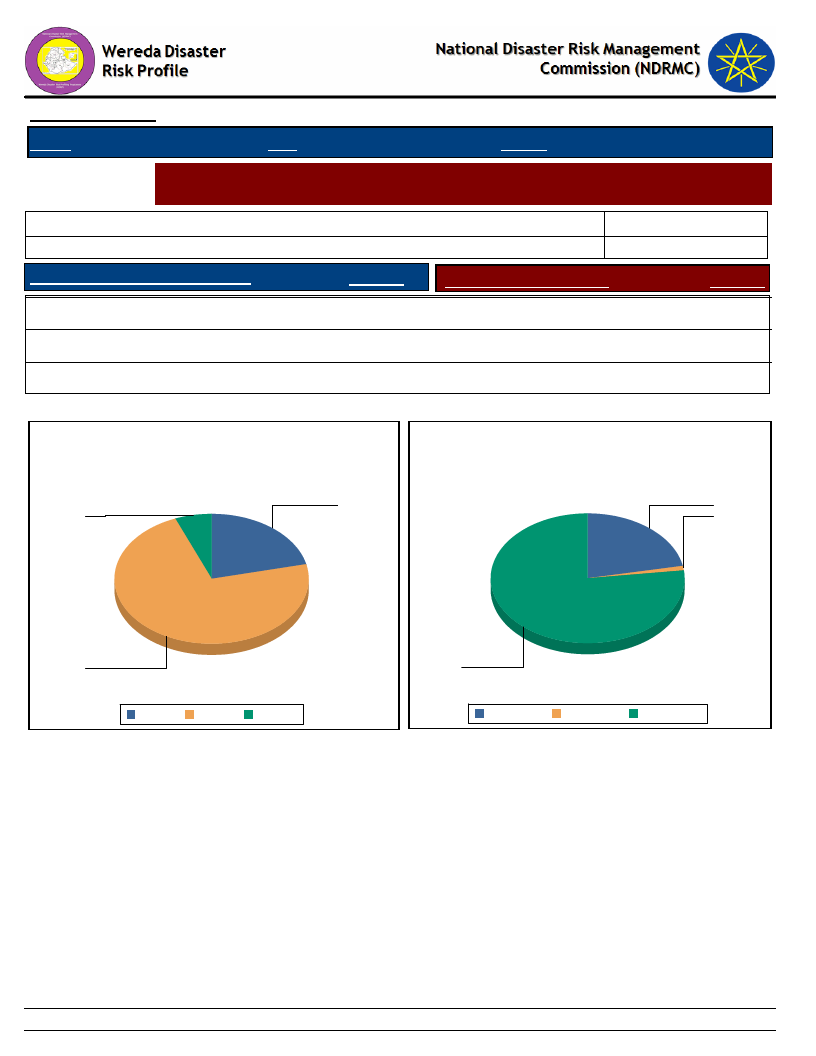
Data_Collected_Date
January 1900
Thursday, July 11, 2019
Region S.N.N.P
Zone SEGEN PEOPLES
Wereda ALLE SPECIAL
Selected Indictor:
Economic Vulnerability: Land Ownership and Quality - Farmers’ perception on
the quality of their agricultural land
Cropping_Intensity *
Households with enough land for farming
HHs with favourable location of farm
Response
Households with fertile soil
0.47
31.33
Response
Yes
5.99
Highly fertile
1.04
Partially
72.66
Fertile
21.88
No
21.35
Not fertile
77.08
* Cropping Intensity = (Gross Cropped Area / Net Cropped Area )x 100%
Household responses to the type of farm
location
Household responses tp the type of soil
fertility
21
22
6
1
73
No
Partially Yes
Gross Cropped Area = Irrigated Area + Unirrigated
Area
77
Fertile
Highly fertile Not fertile
Net Cropped Area = Total Cultivated Area in last
12 months
122
Page 1 of 1
Data_Collected_Date
January 1900
Thursday, July 11, 2019
Region S.N.N.P
Selected Indictor:
KebeleName
KERKERT
TURUBA
KOLANGO
EYANA
LOKITE
GUMA
GOROZE
DELBENA GAMA
TSEMEHA
ADIS OLETEMA
GEWADA
DIGINTY
DEGA MASHELE
BOLE
GERGEMA
DUGULO
LALCHO
Zone SEGEN PEOPLES
Wereda ALLE SPECIAL
Agricultural Situation: Access to Inputs - Perception of the community on access
to improved agricultural inputs
Current_Level
Change_In_Last_Decade
Comments
Accessin g inputs but
productivity decreasing
Good
Good
Less access
Better access
Better
Moderate access
Fertilizer seeds pesticides
Use seeds and fertilizer
Yes
Better access
Less
Partially use fertilizer
Use seed and fertilizers
Fertilizer, seeds
Less access
Good
Most of kebele suffering
with drought since last 5
years
Increased
Increased
Increase
Increase
Increase
Increase
Increasing
Increasing
Increased
Less access
Increase
Increasing
Increasing
Increased
Increase
Increasing
Climate change and the
expansion of
desertification
Increased improved seed
and fertilizer use
increased extension
service in the area
Increase time to time
Increase the access of
agriculture input like DAP,
UREA and drugs for
livestock
Agriculture office some
where better supply
Supplied by agriculture
Use improved seed
No change because of lack
of rain
Because of increased
agriculture extension
services
Awareness of farmer
No change because of
shortage of rainfall
Farmer used more
fertilizer and seed
Improve production
123
Page 1 of 1
Data_Collected_Date
Region S.N.N.P
January 1900
Zone SEGEN PEOPLES
Thursday, July 11, 2019
Wereda ALLE SPECIAL
Selected Indictor:
Agricultural Situation: Water for irrigation - Access to water for irrigation in the
community
KebeleName
Current_Level
Change_In_Last_Decade
Comments
KERKERT
TURUBA
KOLANGO
EYANA
LOKITE
GUMA
GOROZE
DELBENA GAMA
TSEMEHA
ADIS OLETEMA
GEWADA
DIGINTY
DEGA MASHELE
BOLE
GERGEMA
DUGULO
LALCHO
Low
No
No access
There is no access
Little irrigation water
Less
Less
Low
Low
Low
Most parts of community
have not access
Low
Low
Low
Less
Very low
Decreasing
No change
No change
Decrease
Decrease
Decrease
No change
Decreasing
Decreasing
No change
Decrease but better less
decade
No change
Decreasing
Decreased
Decrease
Decreasing
Drying river water year to year
No change
Poor/ lack of irrigation access
Loss of water potential
Due to lack of drought
Drought out comes
The production and productivity
is decline
Lack of water
Lack of water
Lack of small scale irrigation
access
Low soil fertility
Lack of small scale irrigation
access
Erratic rainfall because of
climate change
Lack of water
124
Page 1 of 1
Data_Collected_Date
January 1900
Thursday, July 11, 2019
Region S.N.N.P
Zone SEGEN PEOPLES
Wereda ALLE SPECIAL
Selected Indictor:
Kebele Name
Agricultural Situation: Soil Fertility - Perception of the community on soil fertility
and its change over time
Current_Level
Change_In_Last_Decade
Comments
KERKERT
Very low
Decreasing
low soil fertility
TURUBA
KOLANGO
Low
Poor
Decreasing
Decreased
Poor land management and
lack of soil and water
conservation
Poor land management
EYANA
LOKITE
Low fertility
Low fertility
Decrease
Decrease
High soil erosion and
deforestation
Due to deforestation
GUMA
Low
Decrease
Deforestation
GOROZE
Less
DELBENA GAMA
Low
Decrease
Decreasing
Because of land
management is poor and
lack of soil and water
conservation
Soil erosion
TSEMEHA
Partially fertile
Decreasing
Soil erosion
ADIS OLETEMA
Partially fertile
Decreased
Decreased
GEWADA
DIGINTY
Less fertile it needs
fertilizer
Low
Decrease year to year
High
DEGA MASHELE
Partially fertile
Decreasing
Because of drying of rivers
BOLE
Low fertility
Decreasing
Soil erosion and flooding
GERGEMA
Low
Decreased
Low soil fertility
DUGULO
Low fertility
Decrease the fertility
LALCHO
Low
Decreasing
125
Page 1 of 1
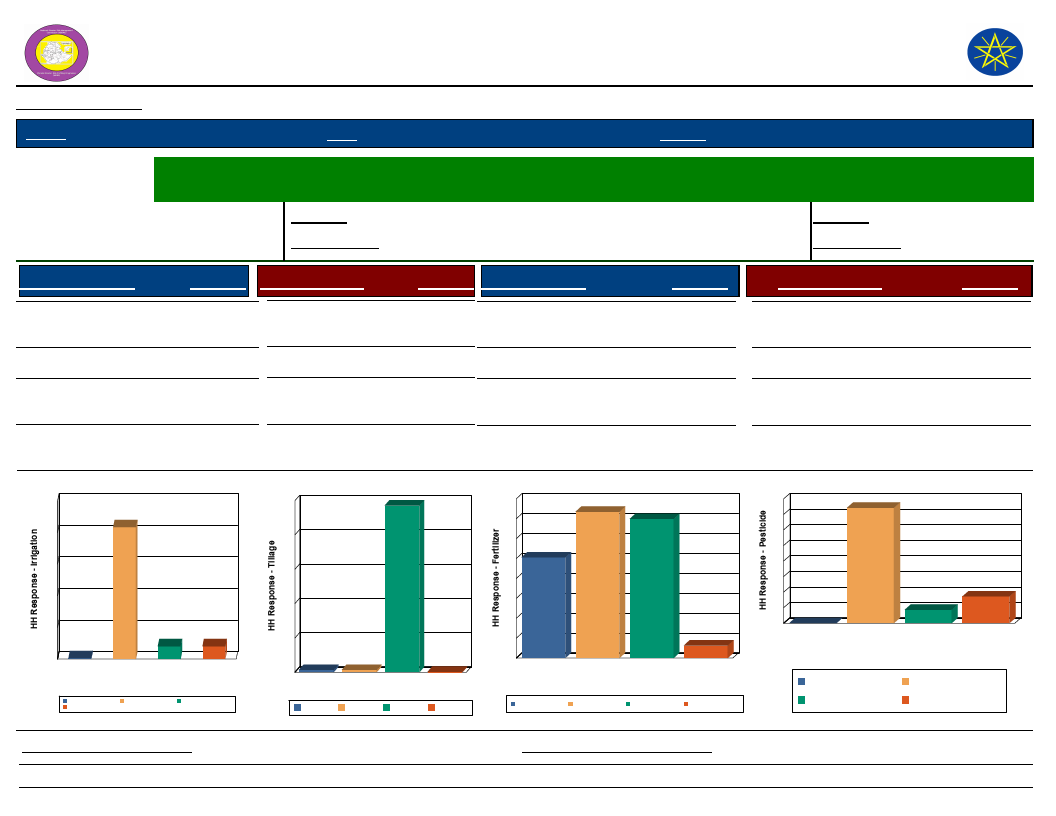
Wereda Disaster
Risk Profile
Data_Collected_Date
January 1900
Region S.N.N.P
Zone SEGEN PEOPLES
National Disaster Risk Management
Commission (NDRMC)
Thursday, July 11, 2019
Wereda ALLE SPECIAL
Selected Indictor:
Economic Vulnerability: Status of Agriculture - Methods of tillage, Irrigation and other agricultural input utilization
by households
Percentage of
Last Year
0.00
Irrigated Area
Five Years Ago
0.00
Percentage of households
Last Year
0.64
with irrigated area
Five Years Ago
0.99
Source of Irrigation
Response Method of Tillage
Response Type of Fertilizer
Response
Type of Pesticide
Response
River/Lake/Pond
8.07 Oxen
97.14 Chemical
36.72
Birkas (tanks)
0.52
Other (specify)
8.07
No Irrigation
(Rain-fed)
Source of Irrigation
100
83
80
83.33
60
40
20
8
8
1
0
Birkas (tanks)
Other (specify)
No Irrigation (Rain-fed)
River/Lake/Pond
Source of Irrigation
Birkas (tanks)
River/Lake/Pond
No Irrigation (Rain-fed)
Other (specify)
Tractor
Manual
None
0.26 Natural/Animal manure
1.30 Both Chemical and
Natural
1.30 None
34.90
25.26
3.12
Method of Tillage
100
97
80
60
40
20
1
0
Manual
Manual
1
None
Oxen
Method of Tillage
None
Oxen
0
Tractor
Tractor
Type of Fertilizer
40
37
35
35
30
25
25
20
15
10
5
3
0
Both
Chemical and
Natural
Chemical Natural/Animal
manure
Type of Fertilizer
None
Both Chemical and
Natural
Chemical
Natural/Animal manure
None
Chemicals (insecticides,
fungicide, etc)
Natural methods
None
74.19
8.60
17.20
0.00
Type of Pesticide
80
74
70
60
50
40
30
20
10
0
0
9
Chemicals
(insecticides,
fungicide, etc)
Natural
methods
Type of Pesticide
17
None
Natural methods
Chemicals (insecticides,
fungicide, etc)
None
Proportion_Improved_Seeds
73.39
Proportion_Agriculture_Service
126
93.82
Page 1 of 1
Data_Collected_Date
Region S.N.N.P
January 1900
Zone SEGEN PEOPLES
Thursday, July 11, 2019
Wereda ALLE SPECIAL
Selected Indictor:
Economic Vulnerability: Change in Agricultural Situation - Households perception
on changes of crop type, size of cultivated area and crop yields
Proportion of households reporting change in crops grown
Adequate fertilizer
16.06
%
1st
2nd
1.61
11.43
Adequate rainfall
1.61
2.86
Insufficient irrigation available
2.86
Less rainfall
54.84
8.57
More drought resistant crop
4.84
More Market Availability
8.06
More pest resistant crop
3.23
More yielding crop
22.58
Other
3.23
Proportion of households reporting change in size of area cultivated
6.48
%
Addition of area
1st
2nd
3rd
16.00
Adequate rainfall
14.29
Insufficient rainfall
12.00
Landslides
12.00
Loss of area
44.00
60.00
More yielding crop
4.00
20.00
Other
28.57
20.00
127
Page 1 of 2
Data_Collected_Date
Region S.N.N.P
January 1900
Zone SEGEN PEOPLES
Thursday, July 11, 2019
Wereda ALLE SPECIAL
Selected Indictor:
Economic Vulnerability: Change in Agricultural Situation - Households perception
on changes of crop type, size of cultivated area and crop yields
1st
2nd
3rd
Salinity problem
12.00
Water logging
57.14
Proportion of households reporting change in crop yield
Adequate fertilizer
Adequate irrigation available
Adequate rainfall
Better yielding crop
Improved variety of seeds
Insufficient fertilizer
Insufficient irrigation available
Insufficient rainfall
Other
69.35
1st
%
2nd
3.37
1.50
0.94
0.75
1.88
16.48
20.60
0.37
3.75
4.69
52.43
0.75
128
Page 2 of 2
Data_Collected_Date
Region S.N.N.P
January 1900
Zone SEGEN PEOPLES
Thursday, July 11, 2019
Wereda ALLE SPECIAL
Selected Indicator
Economic Vulnerability: Crops Grown - Number of crops grown by households
Number of Crops Grown
Crops Grown Last Year
Crops Grown Five Years Ago
One type
100.00
100.00
Two types
0.00
0.00
Three types
0.00
0.00
Four types
0.00
0.00
Five types
0.00
0.00
Avg Crops Grown Last Year
Avg Crops Grown Five Years Ago
0.99
0.99
Number of Crops Grown Last Year
100
100
Number of Crops Grown five years ago
100
100
80
80
60
60
40
40
20
0
0
Five types
0
0
Four types One type Three types
Number of Crops Grown
0
Two types
Five types
Two types
Four types
One type
Three types
20
0
0
Five types
0
0
Four types One type Three types
Number of Crops Grown
0
Two types
Five types
Two types
Four types
One type
Three types
129
Page 1 of 1
WDRP Indicators
Livestock Production Characteristics
130
Data_Collected_Date
January 1900
Thursday, July 11, 2019
Region S.N.N.P
Zone SEGEN PEOPLES
Wereda ALLE SPECIAL
Selected Indictor:
Kebele Name
KERKERT
TURUBA
KOLANGO
Agricultural Situation: Status of Livestock Disease - Change in Livestock Disease
Status
Current_Level
Change_Over_Last_Decade
Comment
livestock disease
Anthrax
Anthrax, FMD
Increasing
Decreased
Increased
lack of grazing land and
fodder
Increased animals
veterinary service
Climate change
EYANA
LOKITE
GUMA
Anthrax, foot and mouth
disease
Faculosis, anthrax, foot
and mouth disease
Foot and mouth disease
Different season
Decrease
Increase
Increase summer season
and decrease winter season
Due to lack of rainfall,
water spring and pond loss
Climate change
GOROZE
DELBENA GAMA
Foot and mouth, black
leg, anthrax
Anthrax FMD
Increase
Decreasing
Government organization
supply
Vaccination
TSEMEHA
CCPP, anthrax, FMD
Decreasing
Use vaccination
ADIS OLETEMA
GEWADA
DIGINTY
Anthrax, FMD
There is no out break
Anthrax
Decreased
There is some out break like
foot and mouth
Decrease
Because of increased
agricultural extension
service
DEGA MASHELE
Anthrax, FMD
Increasing
Lack of fodder and grazing
BOLE
GERGEMA
DUGULO
Anthrax and FMD
Anthrax, FMD
Anthrax
Decreasing
Increased
Decrease
Use vaccination and
treatment services
Lack of grazing and fodder
shortage
LALCHO
Low
Decreasing
Vaccination of animal
131
Page 1 of 1
Data_Collected_Date
January 1900
Thursday, July 11, 2019
Region S.N.N.P
Zone SEGEN PEOPLES
Wereda ALLE SPECIAL
Selected Indictor: Livestock Diseases Prevalece
Type of livestock diseases affected households in the last five years (households reporting in %)
1st
2nd
3rd
African horse disease
1.29
4.66
0.86
Anthrax affecting cattle
3.35
10.68
6.30
Black leg
35.05
41.37
10.60
CBPP
0.52
2.87
Contagious Caprine PLeuropneumonia (CCPP)
0.77
3.29
4.01
DK
0.26
0.55
0.86
Faciolosis
5.67
8.22
30.09
Foot and mouth disease
1.80
6.85
7.45
Heart water
0.52
0.27
0.57
Internal & External Parasites (Tick, mange, helminthiasis, fasci
0.52
0.55
5.16
Liverfluke (Sheep and cattle)
1.80
2.47
7.74
Lumpy Skin Disease (LSD)
0.52
1.37
2.87
Lymphangitis
0.27
Newcasle disease (Chicken)
0.77
0.27
2.29
No Disease
0.55
4.87
NR
1.03
Pasteurellosis
1.92
1.43
PPR
0.27
0.57
Sheep pox
0.27
Tick born diseases
0.86
Trypanosomiasis
45.88
15.89
10.60
132
Page 1 of 1
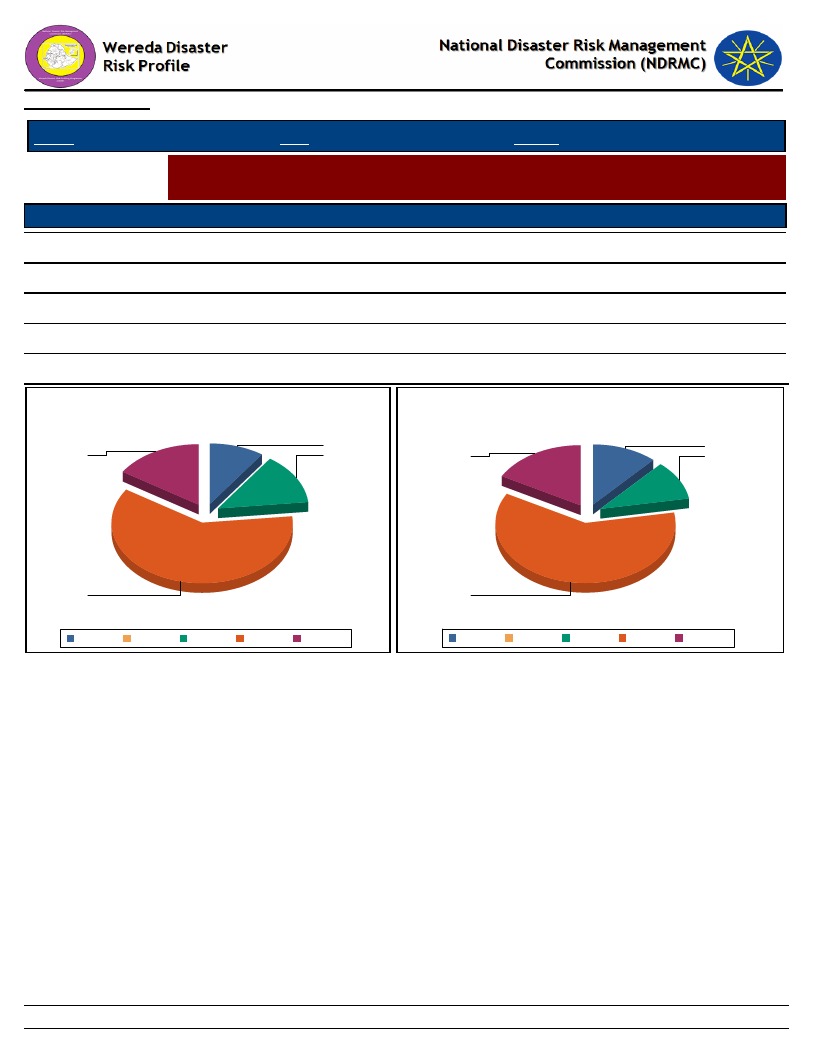
Data_Collected_Date
January 1900
Thursday, July 11, 2019
Region S.N.N.P
Selected Indictor:
Level of Access
Excellent
Good
Adequate
Poor
Very poor
Zone SEGEN PEOPLES
Wereda ALLE SPECIAL
Evaluation of Access to Veternary Services and Livestock Drugs
Households’ evaluation on access to drugs and veterinary services
Veternary Service
Livestock_Drugs
13.87
9.60
60.80
15.73
10.64
11.70
60.64
17.02
Level of Access to Veternary Services
Access Level of Livestock Drugs
10
12
16
14
17
11
61
Adequate Excellent
Good
Poor
Very poor
61
Adequate Excellent
Good
Poor
Very poor
133
Page 1 of 1

Data_Collected_Date
January 1900
Thursday, July 11, 2019
Region S.N.N.P
Selected Indictor:
Zone SEGEN PEOPLES
Wereda ALLE SPECIAL
Agricultural Situation: Water Availability for Livestock - Water availability for
livestock in the community
KebeleName
Current_Level
Change_In_Last_Decade
Comments
KERKERT
TURUBA
KOLANGO
EYANA
LOKITE
GUMA
GOROZE
DELBENA GAMA
TSEMEHA
ADIS OLETEMA
GEWADA
DIGINTY
DEGA MASHELE
BOLE
GERGEMA
DUGULO
LALCHO
Very low
Poor
Good
Less access
Less access
Less
Better
Low
Shortage of water to
animal
Low
Various season to season
better current situation
Not accessible
Low
Shortage of water
Low
Less access
Low
Decreasing
Decreased
Decreased
Decrease
Decrease
Decrease
Decrease
Decreasing
Increasing
Decline water access
Better access
Decrease
No change
Increasing
Decreased
Decrease
Decreasing
lack of water
Shortage of water access
The last decade water
access decline
Loss of river water and
rainfall
Drought outcomes
Shortage of water source
Lack of water
Drying of river and stream
water
Because erratic rainfall ( no
have rain )
Drought and climate change
Lack of water source river
etc
Drying of river
134
Page 1 of 1
Data_Collected_Date
January 1900
Thursday, July 11, 2019
Region S.N.N.P
Zone SEGEN PEOPLES
Wereda ALLE SPECIAL
Selected Indictor:
Agricultural Situation: Livestock Diversity - Type of livestock and their economic
importance in the community
Kebele Name
ADIS OLETEMA
Type of Livestock
Sheep
Avg_Number
3
Economic_Importance_Rank
Selling and meat production
Goats
1
Selling and meat
Poultry
2
Selling and food
Cattle
1
Farming practice and selling
---------
0
BOLE
Cattle
3
For farming activity
Donkeys
2
For transportation
Sheep
7
Selling and for meat purpose
Goats
8
Selling and for meat purpose
Poultry
10 Selling and egg production
DEGA MASHELE
---------
0
Cattle
1
Farming and selling
Poultry
2
Selling and egg consumption
Goats
1
Selling and meat consumption
Sheep
3
Selling and meat production
DELBENA GAMA
Cattle
1
Farming
---------
0
Poultry
2
Selling
Goats
1
Selling
---------
0
DIGINTY
Cattle
10 Farm land , market, flood
Bee keeping
3
Farm land , market, flood
Sheep
5
Farm land , market, flood
135
Page 1 of 4

Data_Collected_Date
January 1900
Thursday, July 11, 2019
Region S.N.N.P
Zone SEGEN PEOPLES
Wereda ALLE SPECIAL
Selected Indictor:
Agricultural Situation: Livestock Diversity - Type of livestock and their economic
importance in the community
Kebele Name
DIGINTY
Type of Livestock
Goats
Avg_Number
15
Economic_Importance_Rank
Farm land , market, flood
Poultry
10 Farm land , market, flood
DUGULO
Cattle
10
Donkeys
2
Sheep
3
Goats
5
---------
0
EYANA
Cattle
1
For agricultural purpose
Poultry
3
Selling purpose
Sheep
2
Selling purpose
Goats
2
Selling purpose
---------
0
GERGEMA
---------
0
Goats
3
For selling activity
Sheep
1
For selling activity
---------
0
Cattle
2
For farming activity
GEWADA
Donkeys
0
Cattle
0
Sheep
0
Poultry
0
Goats
0
GOROZE
---------
0
136
Page 2 of 4

Data_Collected_Date
January 1900
Thursday, July 11, 2019
Region S.N.N.P
Zone SEGEN PEOPLES
Wereda ALLE SPECIAL
Selected Indictor:
Agricultural Situation: Livestock Diversity - Type of livestock and their economic
importance in the community
Kebele Name
GOROZE
Type of Livestock
Cattle
Avg_Number
3
Economic_Importance_Rank
For farming activity
Poultry
5
For selling purpose
Sheep
1
For selling purpose
Goats
5
For selling purpose
GUMA
Cattle
1
Milk and butter
---------
0
Sheep
1
For sell
Goats
1
For sell
---------
0
KERKERT
---------
0
Goats
5
Selling and meat consumption
Sheep
1
Selling and meat consumption
Poultry
2
Selling and egg
KOLANGO
Cattle
---------
3
Most of farmers ploughing their land
with cattle
0
Goats
2
For selling purpose
Sheep
1
For selling purpose
Cattle: Female
1
For milk production
Cattle: Mature Male
1
For farming activity
LALCHO
---------
0
Sheep
2
Goats
1
Poultry
2
137
Page 3 of 4
Data_Collected_Date
January 1900
Thursday, July 11, 2019
Region S.N.N.P
Zone SEGEN PEOPLES
Wereda ALLE SPECIAL
Selected Indictor:
Agricultural Situation: Livestock Diversity - Type of livestock and their economic
importance in the community
Kebele Name
LALCHO
Type of Livestock
Cattle
Avg_Number Economic_Importance_Rank
2
LOKITE
---------
0
Goats
4
For selling purpose
Poultry
5
For selling purpose
---------
0
Cattle
2
For agriculture activity
TSEMEHA
Bee keeping
0
Production of honey
Cattle
2
Farming milk and meat production
Poultry
3
Selling and egg production
Sheep
1
Selling and food
Goats
10 Selling and production of meat
TURUBA
Cattle
1
For farming activity
---------
0
Sheep
2
For selling purpose
Goats
4
For selling purpose
---------
0
138
Page 4 of 4
Wereda Disaster
Risk Profile
Data_Collected_Date
January 1900
National Disaster Risk Management
Commission (NDRMC)
Thursday, July 11, 2019
Region S.N.N.P
Zone SEGEN PEOPLES
Wereda ALLE SPECIAL
Selected Indictor:
Economic Vulnerability: Livestock Ownership and Changes - Percentage of households by number and type of
livestock owned
Bee keeping
A - None
74.94
B - 1 to 5
2.56
C - 6 to 10
5.12
D - 11 to 50
5.12
E - 51 to 100
3.84
F - More
than 100
2.30
Camels: Female
100.00
Camels: Male
100.00
Camels: Young Female
100.00
Camels: Young Male
98.98
0.26
0.51
0.26
Cattle: Female
53.71
18.67
15.60
5.88
2.30
1.28
Cattle: Male bulls
45.52
20.20
19.44
6.65
3.07
1.02
Cattle: Mature Female
32.99
21.23
17.90
7.42
4.60
3.07
Cattle: Mature Male
30.43
21.48
27.88
10.74
5.37
1.53
Cattle: under 1 year
50.13
18.41
16.11
7.67
3.07
2.05
Donkeys
77.75
10.74
6.14
3.07
1.53
Goats
40.92
8.18
11.76
6.91
5.63
5.88
Horses
96.68
0.51
1.53
0.26
0.26
0.51
139
Page 1 of 2
Wereda Disaster
Risk Profile
Data_Collected_Date
January 1900
National Disaster Risk Management
Commission (NDRMC)
Thursday, July 11, 2019
Region S.N.N.P
Zone SEGEN PEOPLES
Wereda ALLE SPECIAL
Selected Indictor:
Economic Vulnerability: Livestock Ownership and Changes - Percentage of households by number and type of
livestock owned
A - None
B - 1 to 5
C - 6 to 10
D - 11 to 50
E - 51 to 100
Mules
97.95
1.53
0.26
0.26
F - More
than 100
Poultry
19.44
4.60
8.18
8.44
8.44
9.21
Sheep
56.52
8.18
12.02
4.86
4.86
3.32
140
Page 2 of 2
Data_Collected_Date
Region S.N.N.P
January 1900
Zone SEGEN PEOPLES
Thursday, July 11, 2019
Wereda ALLE SPECIAL
Selected Indicator
Economic Vulnerability: Livestock Ownership and Changes - Households
perception on changes in livestock number in the last five years (response in %)
Type of Livestock Owned
Changes Observed By Households
Bee keeping
A - Decreased
45.92
B - Remained the Same
47.96
C - Increased
6.12
Camels: Young Male
100.00
Cattle: Female
64.09
33.15
2.76
Cattle: Male bulls
61.03
35.68
3.29
Cattle: Mature Female
73.18
24.52
2.30
Cattle: Mature Male
61.99
37.27
0.74
Cattle: under 1 year
66.50
28.43
5.08
Donkeys
43.68
50.57
5.75
Goats
79.57
16.52
3.91
Horses
40.00
53.33
6.67
Mules
42.86
57.14
Poultry
69.43
23.57
7.01
Sheep
65.09
30.18
4.73
141
Page 1 of 3
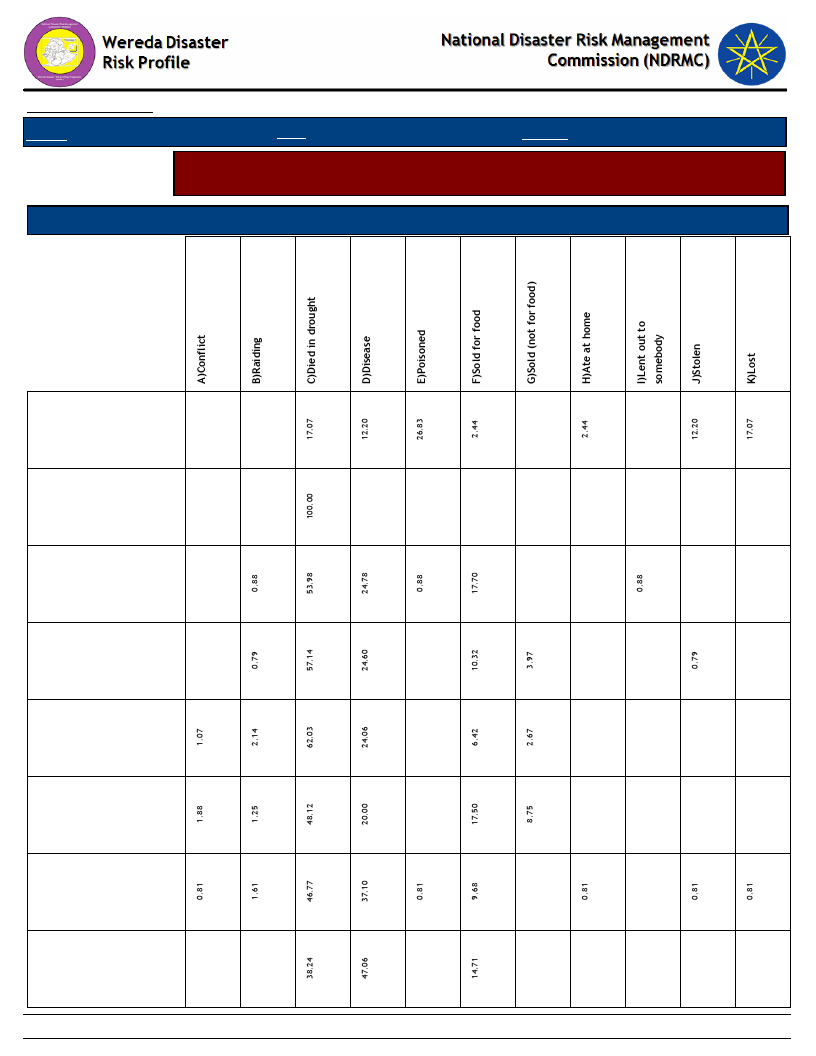
Data_Collected_Date
Region S.N.N.P
January 1900
Zone SEGEN PEOPLES
Thursday, July 11, 2019
Wereda ALLE SPECIAL
Selected Indicator
Economic Vulnerability: Livestock Ownership and Changes - Households
perception on changes in livestock number in the last five years (response in %)
Type of Livestock Owned
Reason for Decrease in Livestock Number
Bee keeping
Camels: Young
Male
Cattle: Female
Cattle: Male bulls
Cattle: Mature
Female
Cattle: Mature
Male
Cattle: under 1
year
Donkeys
142
Page 2 of 3
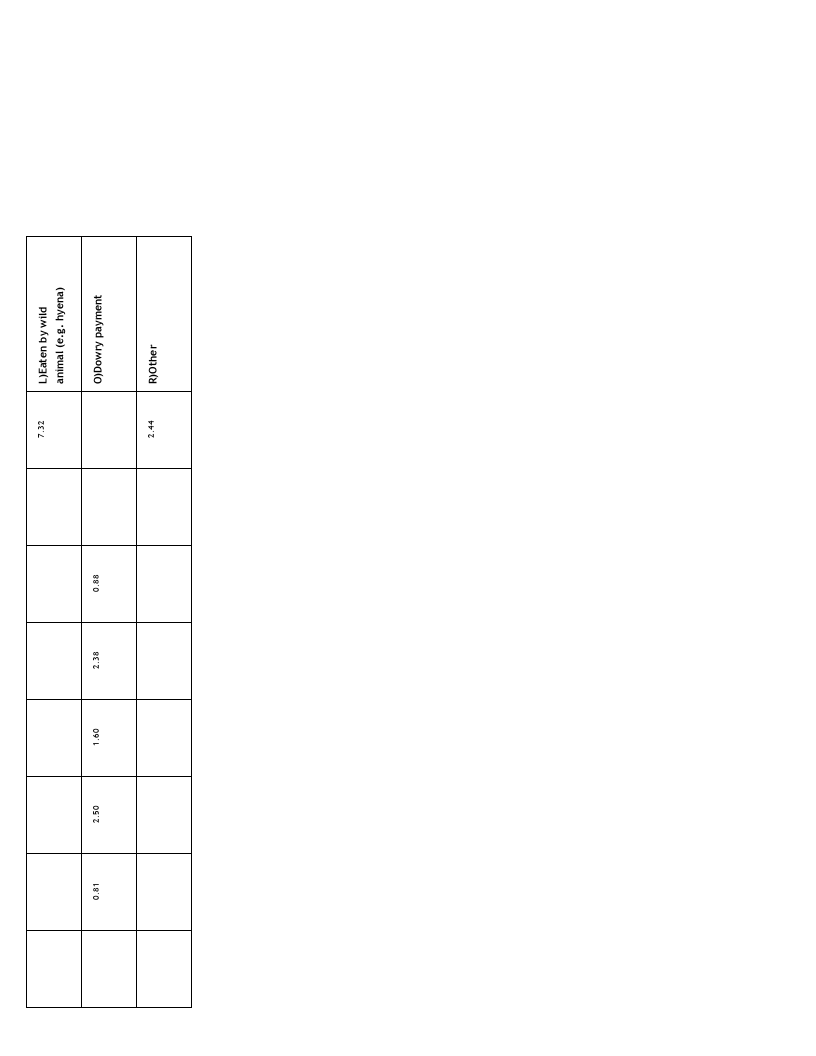
143
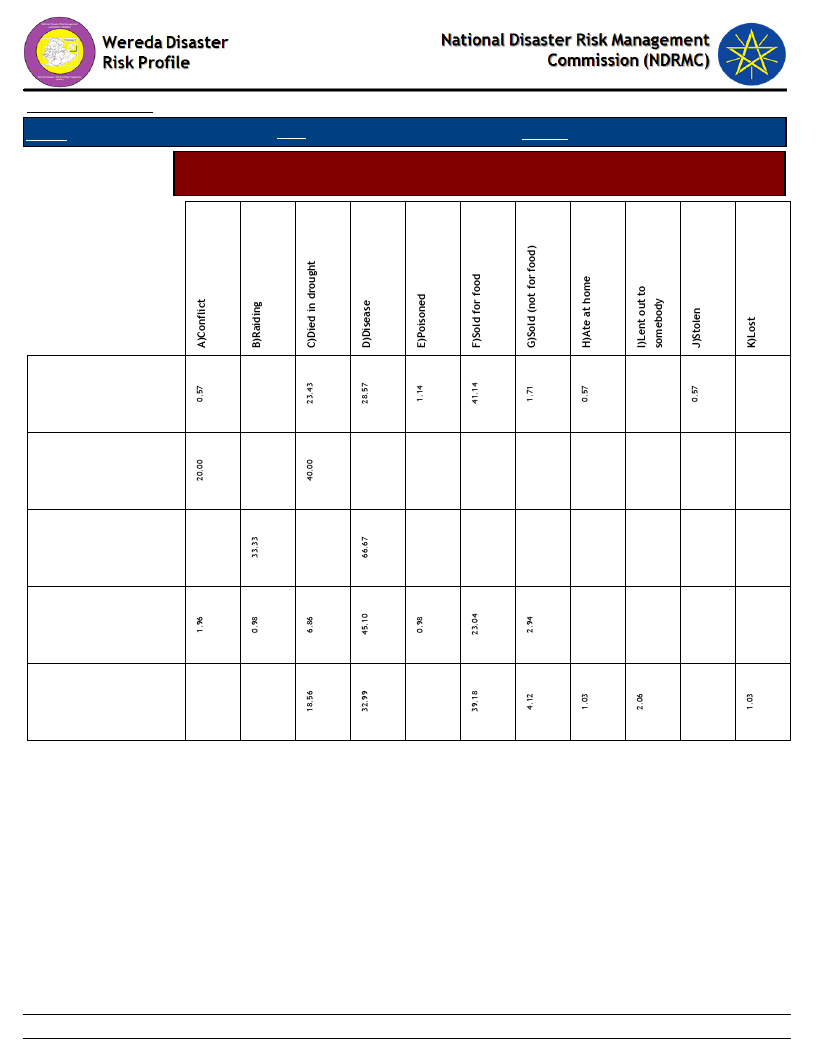
Data_Collected_Date
Region S.N.N.P
January 1900
Zone SEGEN PEOPLES
Thursday, July 11, 2019
Wereda ALLE SPECIAL
Selected Indicator
Economic Vulnerability: Livestock Ownership and Changes - Households
perception on changes in livestock number in the last five years (response in %)
Goats
Horses
Mules
Poultry
Sheep
144
Page 3 of 3
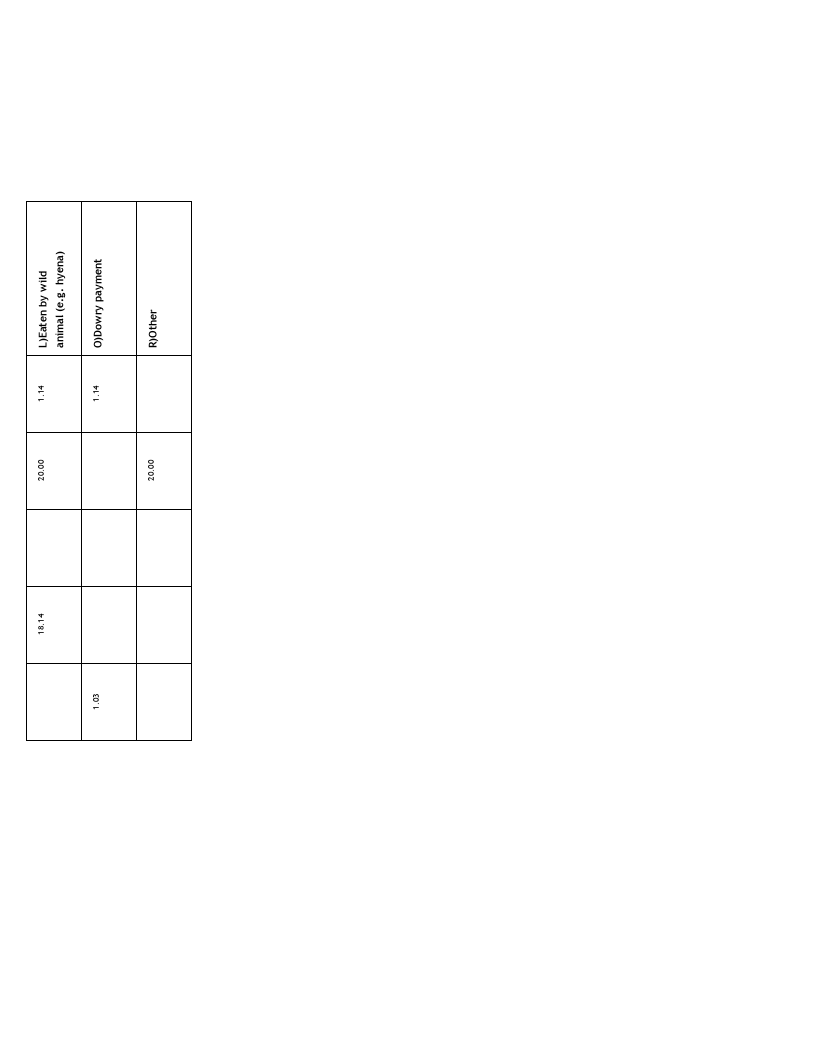
145
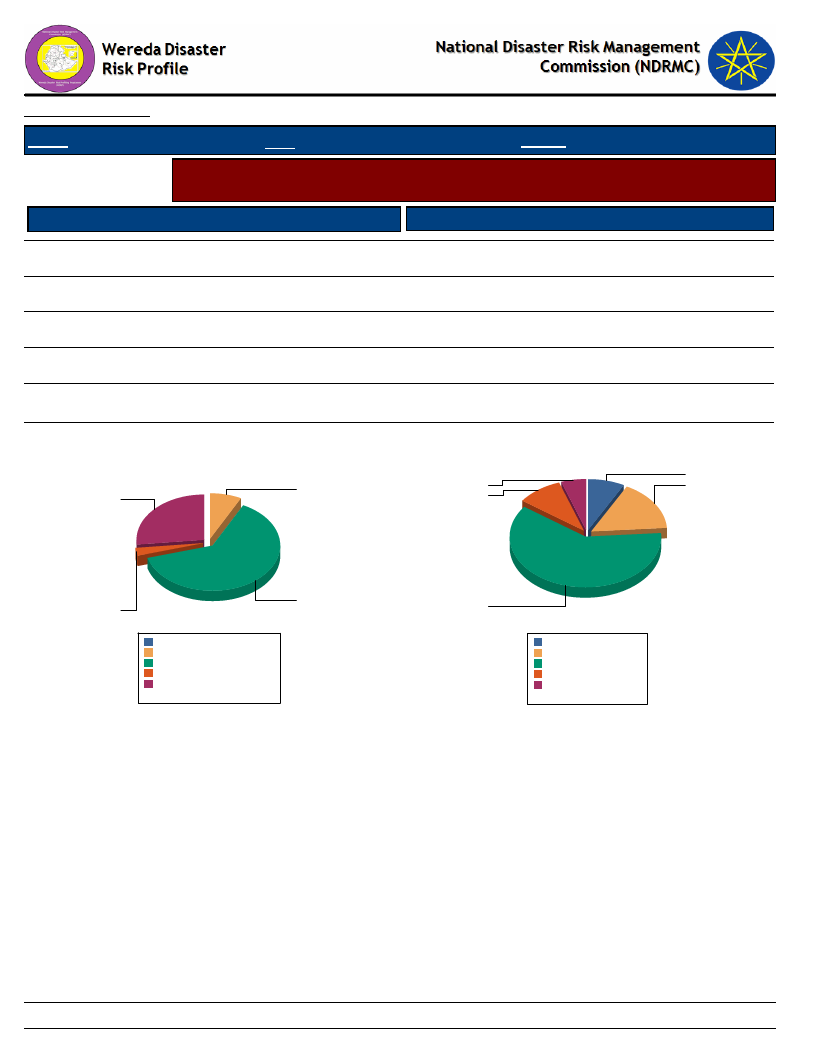
Data_Collected_Date
January 1900
Thursday, July 11, 2019
Region S.N.N.P
Zone SEGEN PEOPLES
Wereda ALLE SPECIAL
Selected Indicator
Agriculture (Livestock): Pasture Availability - Households perception on access
and quality of pasture
Access to Pasture
Response Percent
Quality of Pasture
Response Percent
Occasionally
63.24
C - Adequate
17.07
Seldom available
26.74
D - Poor
64.50
0.00
F - DK
5.69
Regularly available
2.57
B - Good
8.13
Never available
7.46
E - Very poor
10.30
Household responses to Access to Pasture for
Livestock
7.5
26.7
Household responses to Quality of Pasture
8.1
5.7
17.1
10.3
63.2
2.6
Never available
Occasionally
Regularly available
0.0%
7.5%
63.2%
2.6%
Seldom available 26.7%
Total:
100.0%
64.5
B - Good
7.7%
C - Adequate 16.2%
D - Poor
61.0%
E - Very poor 9.7%
F - DK
5.4%
Total:
100.0%
146
Page 1 of 1
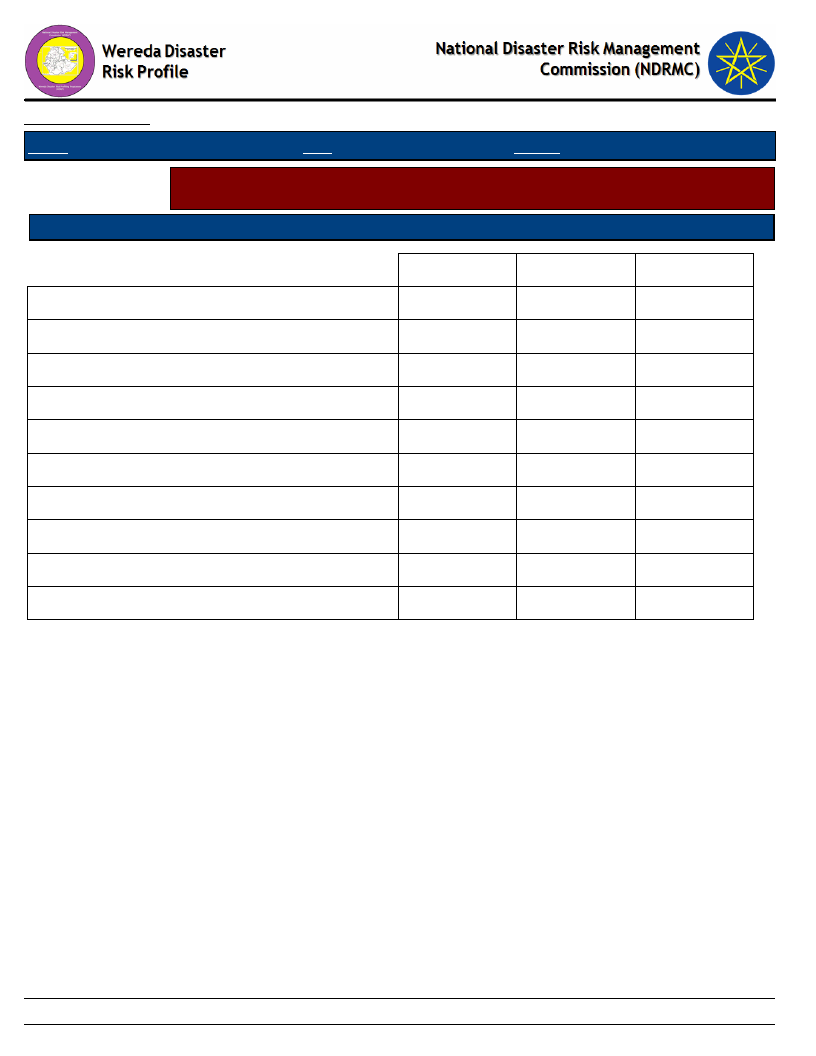
Data_Collected_Date
Region S.N.N.P
January 1900
Zone SEGEN PEOPLES
Thursday, July 11, 2019
Wereda ALLE SPECIAL
Selected Indicator
Agriculture (Livestock): Pasture Availability - Households perception on
problematic months for pasture availability
Problematic Months
Order of Severity
A - Sep (Meskerem)
B - Oct (Tikimt)
C - Nov (Hidar)
D - Dec (Tahsas)
E - Jan (Tir)
F - Feb (Yekatit)
G - Mar (Megabit)
H - Apr (Meazea)
I - May (Ginbot)
J - Jun (Sene)
1st
15.25
42.64
27.91
13.70
0.52
2nd
0.26
0.78
18.54
52.22
25.07
2.87
0.26
3rd
0.54
0.54
0.80
3.49
14.21
16.62
40.75
20.11
2.68
0.27
147
Page 1 of 1
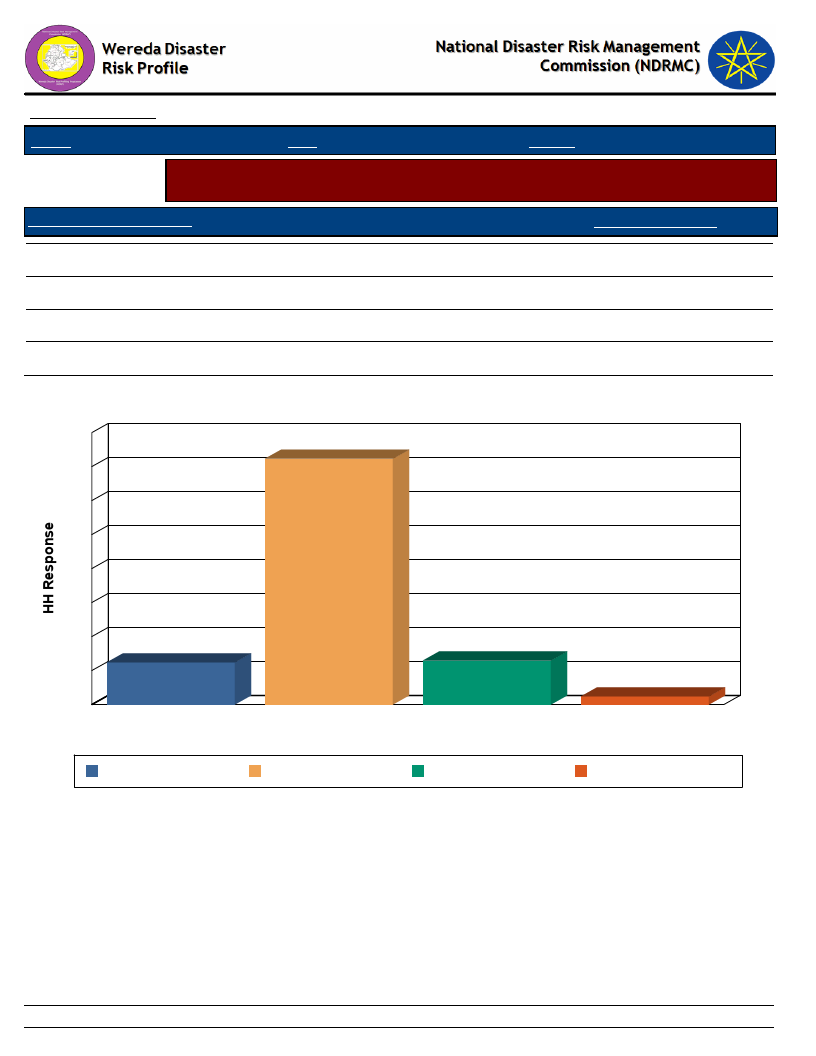
Data_Collected_Date
Region S.N.N.P
January 1900
Zone SEGEN PEOPLES
Thursday, July 11, 2019
Wereda ALLE SPECIAL
Selected Indicator
Agriculture (Livestock): Water Availability - Households response on water
availability for livestock
Access to Water - Livestock
Household Response
A - Regularly available
B - Occasionally
C - Seldom available
D - Never available
12.40
72.30
12.93
2.37
Household Access to Water for Livestock
80
72
70
60
50
40
30
20
12
10
0
A - Regularly available
A - Regularly available
13
B - Occasionally
C - Seldom available
Access to Water - Livestock
B - Occasionally
C - Seldom available
2
D - Never available
D - Never available
148
Page 1 of 1
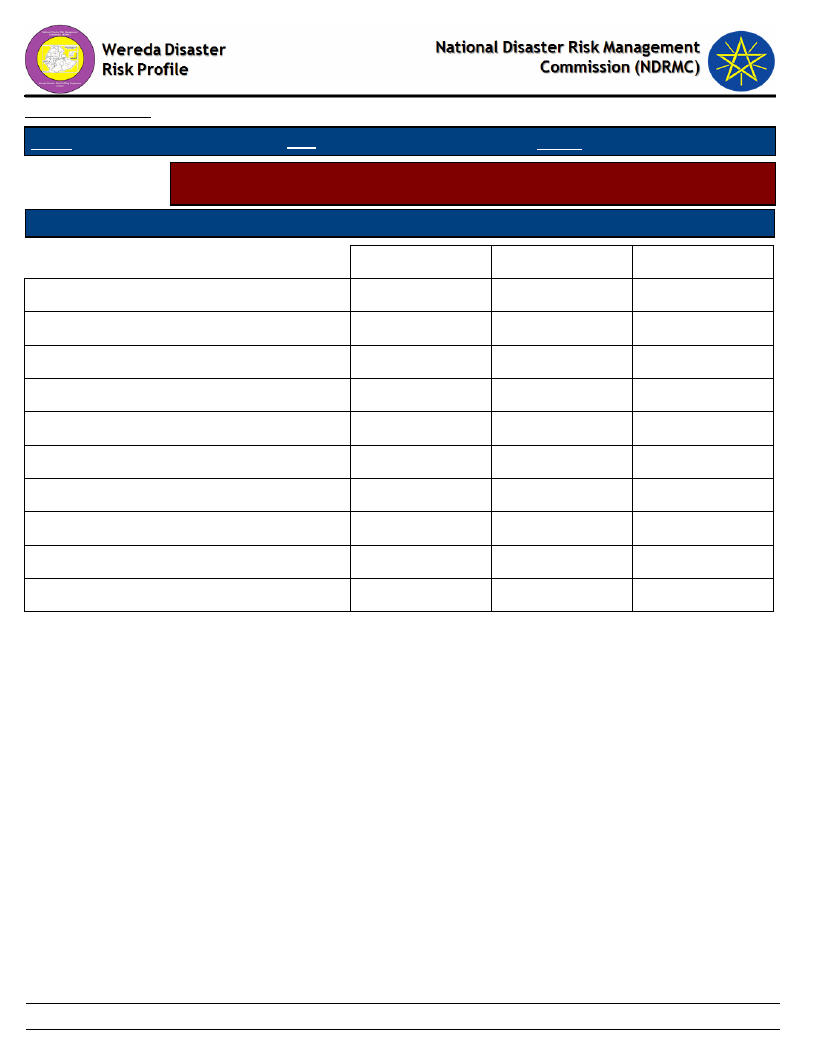
Data_Collected_Date
Region S.N.N.P
January 1900
Zone SEGEN PEOPLES
Thursday, July 11, 2019
Wereda ALLE SPECIAL
Selected Indicator
Agriculture (Livestock): Water Availability - Households perception on
problematic months for water availability for Livestock
Problematic Months
Order of Severity
A - Sep (Meskerem)
B - Oct (Tikimt)
C - Nov (Hidar)
D - Dec (Tahsas)
E - Jan (Tir)
F - Feb (Yekatit)
G - Mar (Megabit)
H - Apr (Meazea)
I - May (Ginbot)
J - Jun (Sene)
1st
0.54
1.34
0.27
12.10
54.84
18.55
12.37
2nd
0.54
2.16
17.84
65.68
12.70
1.08
3rd
0.28
1.14
4.83
14.77
14.77
55.97
6.53
1.42
0.28
149
Page 1 of 1
Data_Collected_Date
Region S.N.N.P
January 1900
Zone SEGEN PEOPLES
Thursday, July 11, 2019
Wereda ALLE SPECIAL
Selected Indicator
Sources of water for livestock (households response in %)
Type of Livestock Owned
Changes Observed By Households
Birka
Communal tap (Bono)
Open/Deep well
Piped water into dwelling or plot
Piped water outside the house
Pond or lake (fenced)
Pond or lake (open access)
Rainwater harvesting
River, stream
Dry Season
1.86
9.02
0.27
0.27
3.18
0.53
0.53
84.35
Wet Season
0.54
6.50
0.27
1.90
0.54
2.17
88.08
Household Responses to Type of Water Source and Season for Livestock
100
88
84
80
60
40
20
9
7
2
1
0
0
0
3
2
1
1
1
2
0
Birka
Communal tap Open/Deep Piped water Piped water Pond or lake Pond or lake Rainwater River, stream
(Bono)
well
into dwelling outside the
(fenced) (open access) harvesting
or plot
house
Type of Water Source & Season
Dry Season
Wet Season
150
Page 1 of 1
WDRP Indicators
Access to Market and Credit
151
Wereda Disaster
Risk Profile
Data_Collected_Date January 1900
National Disaster Risk Management
Commission (NDRMC)
Thursday, July 11, 2019
Region S.N.N.P
Zone SEGEN PEOPLES
Wereda ALLE SPECIAL
Selected Indictor:
KebeleName
KERKERT
TURUBA
KOLANGO
EYANA
LOKITE
GUMA
Economic Vulnerability: Proportion of Produce Sold and Market - Proportion of crops and livestock sold from total
production and markets
Market_For_Crops
Market_For_Livestock_Produce
Percent
Livestock_Sold
Total_% Comments
Sold
Gewada
Gewada
20
10
For most farmers crop and
livestock production are not
selling because of most assets are
lost by drought and also the
remaining productions are used
for their own consumption
purpose.
Gewade
Gewade and Kolango
60
90
More livestock and crops
production are selling use of
shortage of money
Kolango and
Gewada market
Gewada
90
30
Most farmer are selling and most
crop production are keeping for
their own consumption.
Gewade
Gewade
90
10
For most farmers crop production
are not selling because of most
asset are lost by drought the
remaining production are used
only their own consumption
purpose
Tosho
Tosho
90
80
Crop production and livestock
production are selling because
they need income
Kolang, Gewlade
Gewlade
80
60
152
Page 1 of 3

Wereda Disaster
Risk Profile
Data_Collected_Date January 1900
National Disaster Risk Management
Commission (NDRMC)
Thursday, July 11, 2019
Region S.N.N.P
Zone SEGEN PEOPLES
Wereda ALLE SPECIAL
Selected Indictor:
KebeleName
GOROZE
DELBENA GAMA
TSEMEHA
ADIS OLETEMA
GEWADA
DIGINTY
Economic Vulnerability: Proportion of Produce Sold and Market - Proportion of crops and livestock sold from total
production and markets
Market_For_Crops
Market_For_Livestock_Produce
Percent
Livestock_Sold
Total_% Comments
Sold
Toro, kolange
Gewade
70
40
Most of farmer are keep the crops
production and selling more
livestock.
Gato, Derashe
Wereda
Duro
30
25
Most of community production
uses consumption purpose than
selling.
Tosho
Tosho
50
20
Most farmers crop production 20%
selling and 80% of consumption
purpose but, the livestock
production equal consumption and
selling purpose.
Tosho
Tosho
40
20
Most of farmers use their
production for their own
consumption purpose
Gewada
Gewada
90
20
Most farmers are selling livestock
production than crop production
because of crop production are
used for their own consumption
purpose.
Kolarge
Gewada and Tosho
60
25
DEGA MASHELE
Deguma Shele
Deguma Shele
10
5
Most farmers use for their own
consumption than selling.
153
Page 2 of 3

Wereda Disaster
Risk Profile
Data_Collected_Date January 1900
National Disaster Risk Management
Commission (NDRMC)
Thursday, July 11, 2019
Region S.N.N.P
Zone SEGEN PEOPLES
Wereda ALLE SPECIAL
Selected Indictor:
KebeleName
BOLE
GERGEMA
DUGULO
Economic Vulnerability: Proportion of Produce Sold and Market - Proportion of crops and livestock sold from total
production and markets
Market_For_Crops
Market_For_Livestock_Produce
Percent
Livestock_Sold
Total_% Comments
Sold
Tosho
Tosho
10
30
Most farmers crop production 30%
selling and 70% of crops are used
for consumption and also livestock
production 10% are selling and 90%
of livestock production used for
consumption
Gewada
Gewada
25
25
Most livestock and crop
production are farmers used for
keeping purpose because of used
their own consumption
Addis Olitema
Addis Olitema
90
20
LALCHO
Welang and Tosho
Tosho
50
25
Most of the farmer 25% sell and
75% consume purpose of the
production livestock production
equally sell and consumption
purpose.
154
Page 3 of 3
Data_Collected_Date
Region S.N.N.P
Selected Indicator
Kebele Name
KERKERT
TURUBA
KOLANGO
EYANA
LOKITE
GUMA
GOROZE
DELBENA GAMA
TSEMEHA
ADIS OLETEMA
GEWADA
DIGINTY
DEGA MASHELE
BOLE
GERGEMA
DUGULO
LALCHO
January 1900
Zone SEGEN PEOPLES
Thursday, July 11, 2019
Wereda ALLE SPECIAL
Economic Vulnerability: Kebele Access to Markets - Access to market by Kebele
Market_Access_Comments
In the rain season road accesses is not good, so that market problems exist and also
linkage is limited
Seasonal problem live road and market price inflation
There is seasonal problem depends of climate change.
In the rain season road access is not good, so that market problems is exist and also to
link from one kebele to others are limited due to poor road access.
Season problem due to drought the livestock market linkage is not good
Season problem related with road access
In the rain season road access is not good so that market problems exist and also to link
from one kebele to other is limited.
Low because of lack of road and far distance of the markets.
Lack of road access
The road is constructed locally and no linkage to the market place
There is problem on normal market linkage it depend on season.
Main problem- transpiration, far away from community to market center, flood in wet
season is a problem
The main problem is seasonal fluctuation/ climatic change/ the access of road and
market linkage is low.
lack of road and linkage problem
Better than other kebele but on the rainy season road access is limited but better from
other kebele to kebele and wereda.
There is problem because of lack of access road and limited linkage
Low linkage to market because of lack of road.
155
Page 1 of 1
Data_Collected_Date
Region S.N.N.P
January 1900
Zone SEGEN PEOPLES
Thursday, July 11, 2019
Wereda ALLE SPECIAL
Selected Indicator
Economic Vulnerability: Formal & Informal Transfers - Percentage of
households reporting received formal transfers
Type of Formal Transfer
Food aid
HH Response Type of Informal Transfer
Formal
38.87 Remittances (from relative living elsewhere)
HH Response
1.28
Food-for-Work project
13.04 Zakaat
11.03
Cash-for-Work project
25.32 Other cash gift
5.66
Faffa
23.08 Cash loan (no interest)
8.48
Free cash
5.38 Food or grain gift
13.40
Seeds
36.41 Grain loan (no interest)
16.24
Credit support
4.87 Seed gift
25.32
Livestock
0.51 Seed loan
20.67
Tools
0.26 Free labour
2.33
Donation or loan of milking animals to a relative or
friend
Dowry given to bride’s parents
7.31
27.03
Donations of cash or animals to disaster stricken
4.97
people
Blood money – compensation
0.60
Free use of pack animals (camels or donkeys)
0.78
Restocking of poorer relatives
3.12
Distribution of meat to neighbours after a slaughter
takes place
Sacrifice made to feed the poor
22.34
3.91
Cash or kind gift to married daughters when they
visit parents or relatives
Gift of livestock to newly-weds
31.69
20.89
Free use of oxen or plough
1.30
156
Page 1 of 2
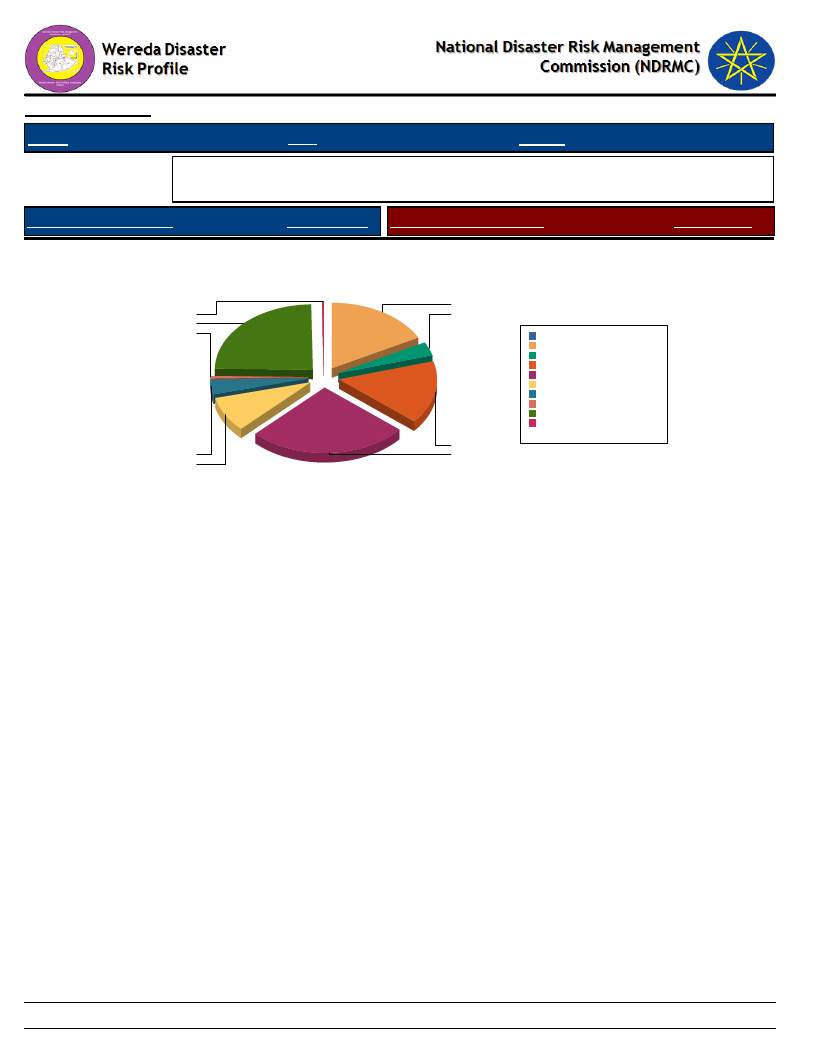
Data_Collected_Date
Region S.N.N.P
January 1900
Zone SEGEN PEOPLES
Thursday, July 11, 2019
Wereda ALLE SPECIAL
Selected Indicator
Economic Vulnerability: Formal & Informal Transfers - Percentage of
households reporting received formal transfers
Type of Formal Transfer
HH Response Type of Informal Transfer
Formal
Type of Formal Transfer Received By Households
HH Response
25.3
0.3
4.9
36.4
0.5
0.0%
Cash-for-Work project 17.1%
Credit support
Faffa
Food aid
3.3%
15.6%
26.3%
Food-for-Work project 8.8%
Free cash
Livestock
Seeds
3.6%
0.3%
24.6%
Tools
0.2%
Total:
100.0%
23.1
5.4
38.9
13.0
157
Page 2 of 2
Data_Collected_Date
Region S.N.N.P
January 1900
Zone
SEGEN PEOPLES
Thursday, July 11, 2019
Wereda ALLE SPECIAL
Selected Indicator
Capacity: Access to Credit Facilities - Households access to credit facilities
Type of Access To Credit Facilities
Indicator_Value
Households with membership in any credit /micro finance society (%)
Households who borrowed any money in the last one year (%)
Households who tried to borrow 1-2
Households who tried to borrow 3-4
Households who tried to borrow 5 & Above
Households who managed to get credit 1-2
Households who managed to get credit 3-4
Households who managed to get credit 5 & Above
Average No. of HHs Tried to get Credit
Average No. HHs Managed to get Credit
30.08
16.75
68.97
27.59
3.45
90.48
4.76
4.76
5.57
2.01
158
Page 1 of 1
Data_Collected_Date
Region S.N.N.P
January 1900
Zone
SEGEN PEOPLES
Thursday, July 11, 2019
Wereda ALLE SPECIAL
Selected Indicator
Capacity: Access to Credit Facilities - Percentage of households by major
reasons of borrowing money
Type of Borrowing Reason
Degree of Importance of the Borrowing Reasons - HH Respones
Buy agricultural input
Buy food
Buy or rent land
Others (specify)
Pay for education
Pay for health care
Pay for social event
1st
Important
12.50
60.94
3.12
9.38
1.56
10.94
1.56
2nd
Important
23.68
13.16
13.16
2.63
42.11
5.26
3rd
Important
33.33
11.11
11.11
11.11
11.11
22.22
159
Page 1 of 1

Data_Collected_Date
January 1900
Thursday, July 11, 2019
Region S.N.N.P
Zone SEGEN PEOPLES
Wereda ALLE SPECIAL
Selected Indicator
Capacity: Access to Credit Facilities - Percentage of households by major
sources of credit
Major Sources of Credit for Households
Degree of Importance of the Credit Source
Bank/formal lending institution
Friends/relatives
1st
Important
31.75
31.75
2nd
Important
28.57
3rd
Important
10.00
Help associations (Edir)
4.76
30.00
Informal savings group (Ekub)
Local shops / moneylenders
Neighbors
Others (specify)
6.35
1.59
17.46
6.35
28.57
42.86
40.00
20.00
160
Page 1 of 1
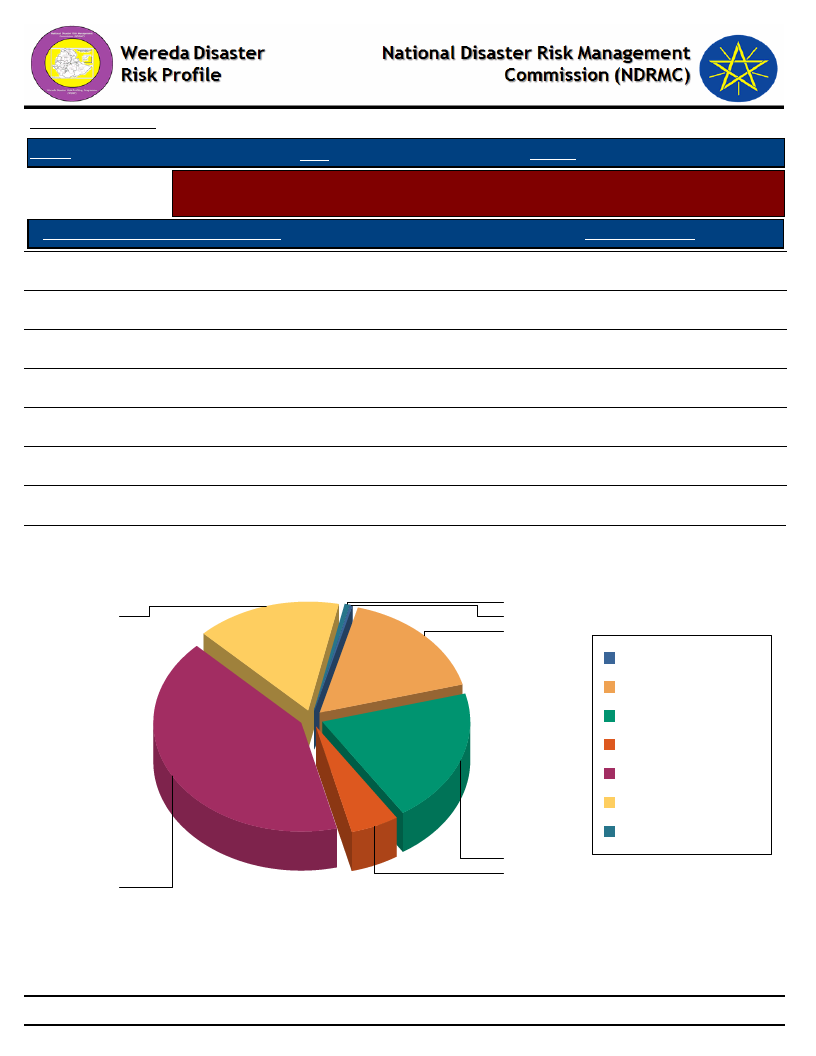
Data_Collected_Date
January 1900
Thursday, July 11, 2019
Region S.N.N.P
Zone SEGEN PEOPLES
Wereda ALLE SPECIAL
Selected Indicator
Capacity: Access to Credit Facilities - Percent of households with ability to raise
500 birr in one week
HH Ability To Raise 500 Br in One Week
Response_Percent
Yes, we would use our savings
15.92
Yes, by borrowing money
5.31
Yes, with some help from others
0.53
Yes, by selling asset or livestock
41.38
Perhaps, but I doubt it
20.16
No, it would be impossible
16.71
DK
0.27
Households' Ability To Raise 500 Br in One Week
1
16
0
17
DK
No, it would be
impossible
Perhaps, but I doubt it
Yes, by borrowing
money
Yes, by selling asset or
livestock
Yes, we would use our
savings
Yes, with some help
from others
20
5
41
161
Page 1 of 1
WDRP Indicators
Health and Sanitation
Characteristics
162
Data_Collected_Date
Region
Zone
Wereda
Thursday, July 11, 2019
Selected Indicator
Household Access to Health Facilities - Where do patients go for health care?
Constraints to adequate healthcare
Where do Patients Go for Healthcare
HH Response Constraints to Adequate Health Care
Response
163
Page 1 of 1
Data_Collected_Date
Region S.N.N.P
January 1900
Zone SEGEN PEOPLES
Thursday, July 11, 2019
Wereda ALLE SPECIAL
Selected Indicator
Hazards: Health problems and changes over the last decade
Kebele Name
Health_Problems
Changes_In_Last_Decade
KERKERT
TURUBA
Most of the community health situation suffering malaria
and typhoid disease occurring at this time is caused by
lack of clean water, most of the community drinking
cheka ( local drink )and together in one glass
Normal health condition caused by adequate health
service
KOLANGO
EYANA
LOKITE
GUMA
GOROZE
DELBENA GAMA
TSEMEHA
ADIS OLETEMA
GEWADA
Better health situation ( good health care) but some area
there is malaria caused by favorable condition of
mosquito production
No health problems
There is no health problem but there is measles
Better than three years
Malaria caused by Weather change
Human disease( Typhoid and malaria,) caused by lack of
clean water, use anti malaria chemical, lack of hygiene
and sanitation, favorable climate condition for mosquito
production
Malaria and typhoid disease caused by not using bed net
and anti mosquito chemical, lack of clean water, lack of
hygiene
The health situation is good
Health is normal
DIGINTY
DEGA MASHELE
BOLE
Better than previous years
Malaria caused by mosquito
Malaria and other disease caused by favorable condition
of mosquito production, lack of hygiene and sanitation
164
In this year compared to
last year typhoid is
increased.
Construction of health
post and expanding of 16
health extension
packages.
Decrease
Increase year to year
Increase
Increasing
Increased
Increasing because of
clinic service is increased
Already it is under control
by health center/ clinic (
decline year to year )
Decrease
Decreased
Already it is under control
by health center clinic
Page 1 of 2
Data_Collected_Date
Region S.N.N.P
January 1900
Zone SEGEN PEOPLES
Thursday, July 11, 2019
Wereda ALLE SPECIAL
Selected Indicator
Hazards: Health problems and changes over the last decade
Kebele Name
Health_Problems
Changes_In_Last_Decade
GERGEMA
DUGULO
LALCHO
Malaria, typhoid, caused by favorable condition of
mosquito production
Less health care caused by lack of vaccination
Typhoid, Typhus, malaria caused by lack of sanitation,
lack of clean water
Decline
165
Page 2 of 2
Wereda Disaster
Risk Profile
Data_Collected_Date
January 1900
National Disaster Risk Management
Commission (NDRMC)
Thursday, July 11, 2019
Region S.N.N.P
Zone SEGEN PEOPLES
Wereda ALLE SPECIAL
Selected Indicator
Household Health Status - Households health condition and major health problems
Health Condition
HH Response Population Sickness
HH Response Children Sickness
HH Response
Good health
Ill for <3 months
Ill for more than three months
93.68
5.28
1.04
Chronic fever
Malaria
Diarrhea
Others
Eye problems
Back ache
HIV/AIDS
Stomach pain
Asthma
Mental illness
Headache
Meningitis
Pneumonia/ lung problem
Hyper tension
20.69
25.52
6.90
6.90
1.38
5.52
1.38
13.79
1.38
1.38
8.97
3.45
2.07
0.69
Chronic fever
Malaria
Diarrhea
Hyper tension
42.11
21.05
26.32
5.26
166
Page 1 of 2
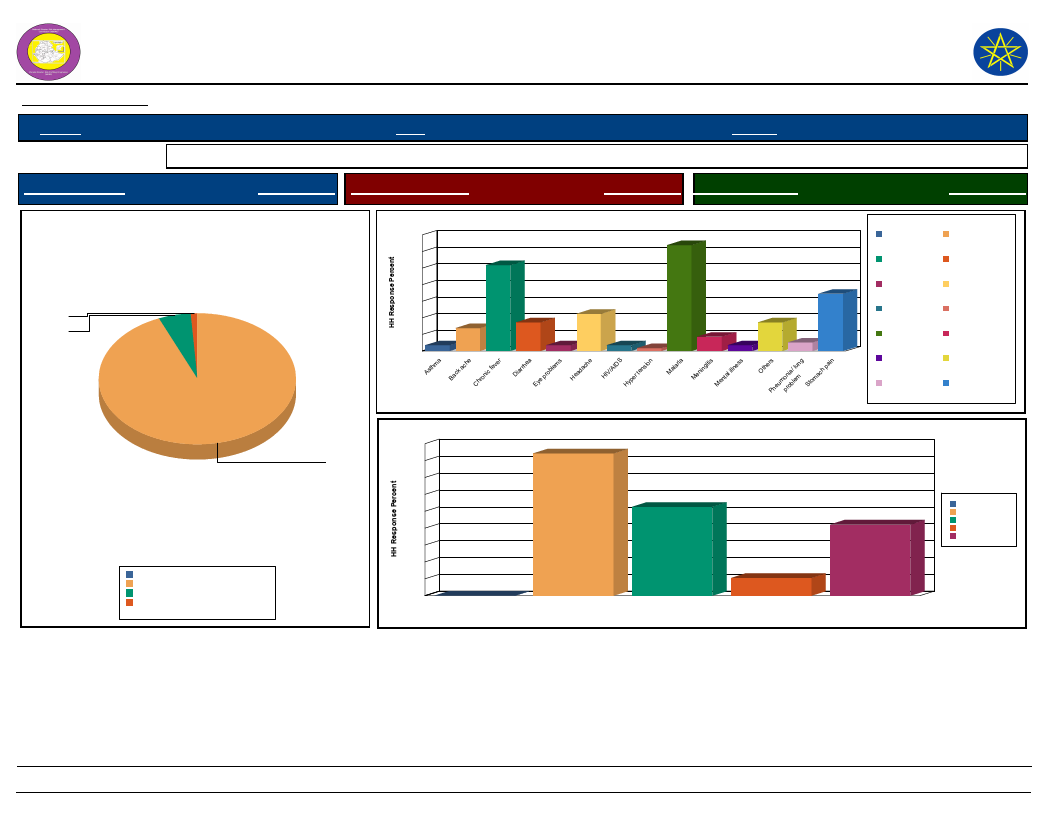
Wereda Disaster
Risk Profile
Data_Collected_Date
January 1900
National Disaster Risk Management
Commission (NDRMC)
Thursday, July 11, 2019
Region S.N.N.P
Zone SEGEN PEOPLES
Wereda ALLE SPECIAL
Selected Indicator
Household Health Status - Households health condition and major health problems
Health Condition
HH Response Population Sickness
HH Response Children Sickness
HH Response
Health Condition of the Community
1.0
5.3
93.7
Good health
Ill for <3 months
Ill for more than three months
0.0%
93.7%
5.3%
1.0%
Total:
100.0%
28
24
21
20
Population Sickness in the Community
26
16
12
8
6
4
1
0
a
Asthm
Back ache Chronic fever
9
7
1
1
1
Diarrhea
s
problem
Eye
Headache
S
HIV/AID
Hyper tension
3
1
alaria
M
eningitis
M
ental illness
M
Population Sickness
14
7
2
OtherPsneumopnroiab/lelumng
pain
ach
Stom
Asthma
Back ache
Chronic fever
Diarrhea
Eye problems
Headache
HIV/AIDS
Hyper tension
Malaria
Meningitis
Mental illness
Pneumonia/ lung
problem
Others
Stomach pain
45
40
35
30
25
20
15
10
5
0
0
Children Sickness in the Community
42
26
Chronic fever
Diarrhea
Children Sickness
5
Hyper tension
21
Malaria
Chronic fever
Diarrhea
Hyper tension
Malaria
167
Page 2 of 2
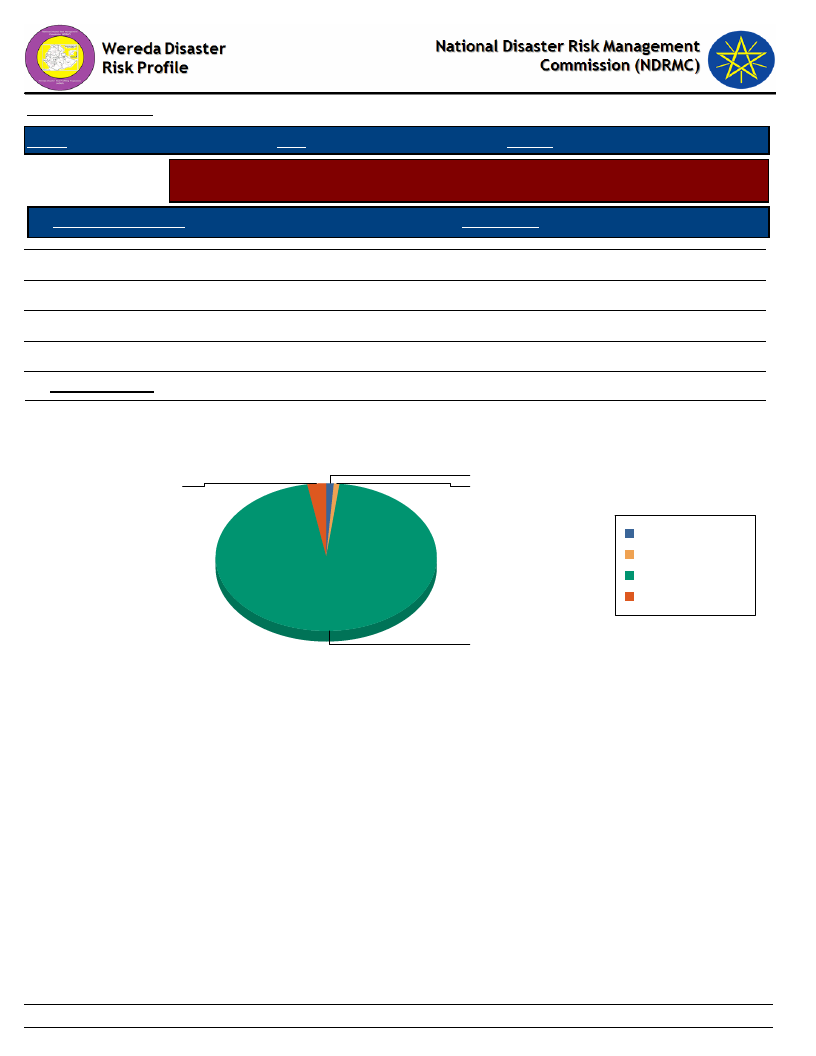
Data_Collected_Date
January 1900
Thursday, July 11, 2019
Region S.N.N.P
Zone SEGEN PEOPLES
Wereda ALLE SPECIAL
Selected Indicator
Household Access to Sanitation - Percentage of households with access to
different kind of toilet facilities
Type of Toilet Facility
HH Response
Modern water closet
Ventilated, build in latrine
Outdoors latrine/hole on plot
No facilities/Open Space
HH Sharing Toilet
1.02
2.81
95.14
1.02
1.53
Household Responses to the type of toilet facilities in the community
1.0
2.8
1.0
Modern water closet
No facilities/Open Space
Outdoors latrine/hole on
plot
Ventilated, build in latrine
95.1
168
Page 1 of 1
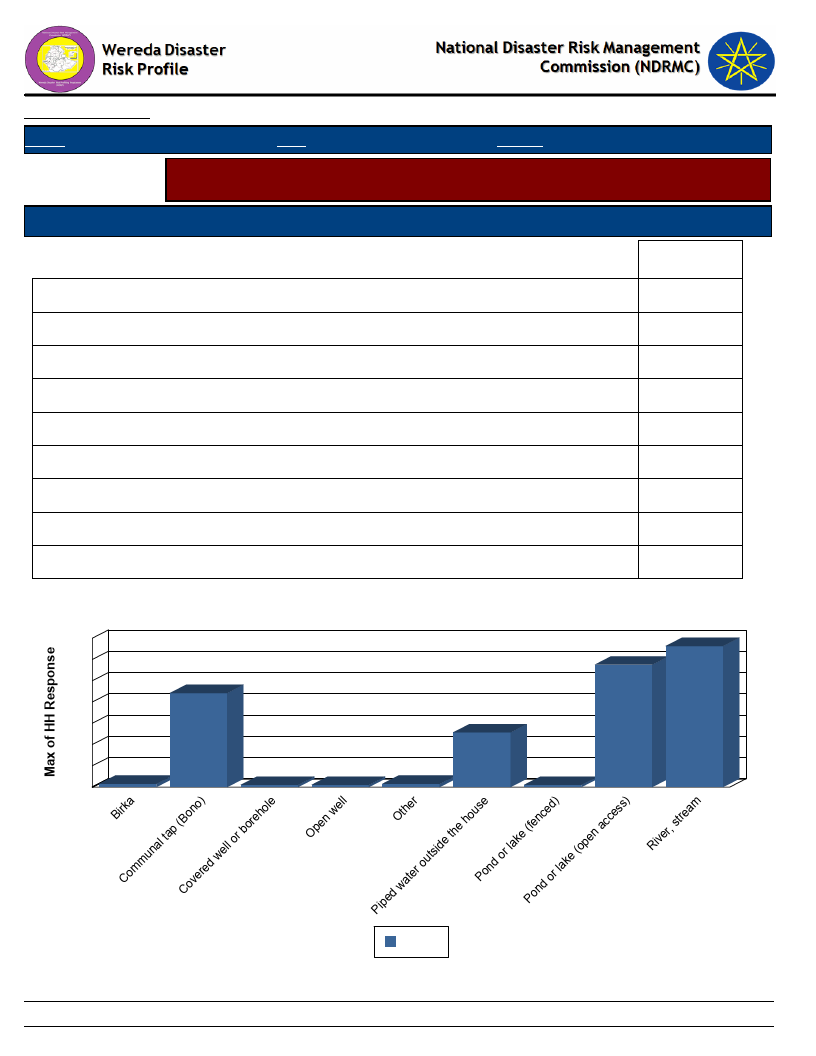
Data_Collected_Date
Region S.N.N.P
January 1900
Zone SEGEN PEOPLES
Thursday, July 11, 2019
Wereda ALLE SPECIAL
Selected Indicator
Household Access to Drinking Water - Sources of drinking water for households
(response in %)
Sources of drinking water for Households
Priority of the Water Source
Main
Birka
Communal tap (Bono)
Covered well or borehole
Open well
Other
Piped water outside the house
Pond or lake (fenced)
Pond or lake (open access)
River, stream
0.77
22.11
0.51
0.51
0.77
12.85
0.51
28.79
33.16
Source of Drinking Water & Type of Source
35
33
30
29
25
22
20
15
13
10
5
1
1
1
1
1
0
Main
169
Page 1 of 1
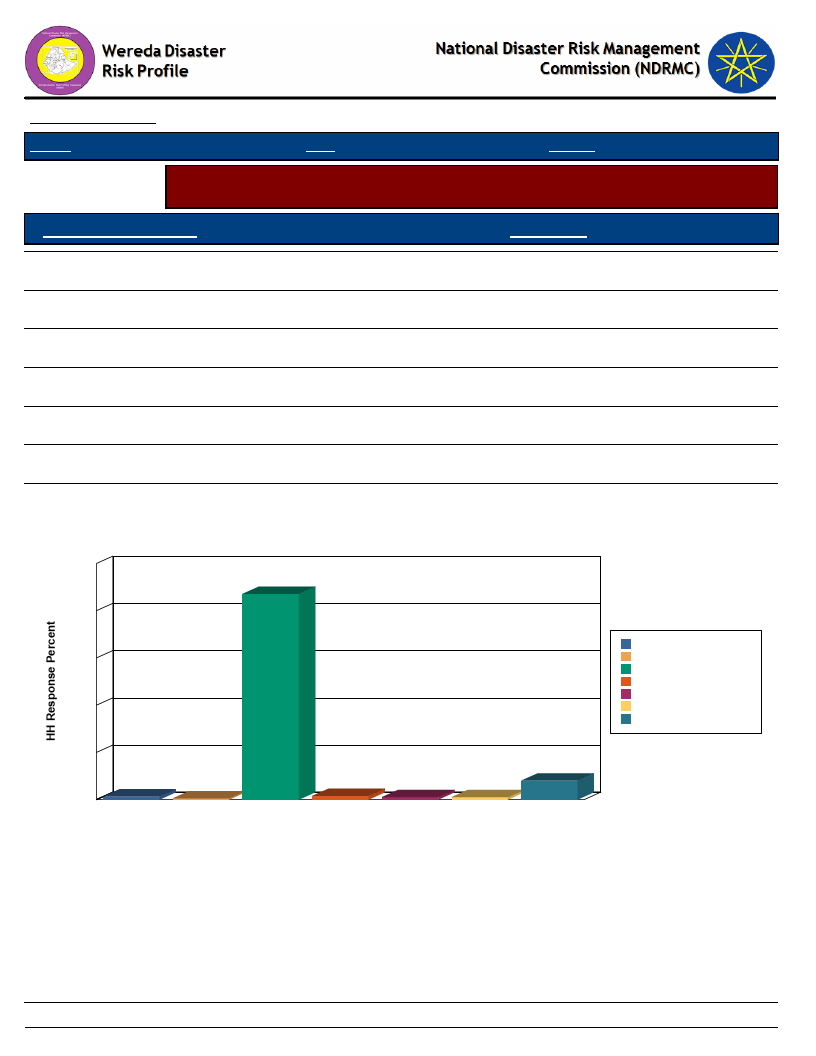
Data_Collected_Date
Region S.N.N.P
January 1900
Zone SEGEN PEOPLES
Wereda
Thursday, July 11, 2019
ALLE SPECIAL
Selected Indicator
Household Access to Drinking Water - Households methods of treating drinking
water
Method of Treating Water
HH Response
Boil
1.29
Water Guard
8.01
Use filter
1.03
Other chemicals
1.55
Other Method (specify)
1.03
None
87.08
DK
0.52
100
80
60
40
20
1
0
Boil
Method of Treating Water by Households
87
8
1
2
1
1
DK
None
Other
Other
Use filter Water Guard
chemicals
Method
Water Treatment Meth(ospdecify)
Boil
DK
None
Other chemicals
Other Method (specify)
Use filter
Water Guard
170
Page 1 of 1
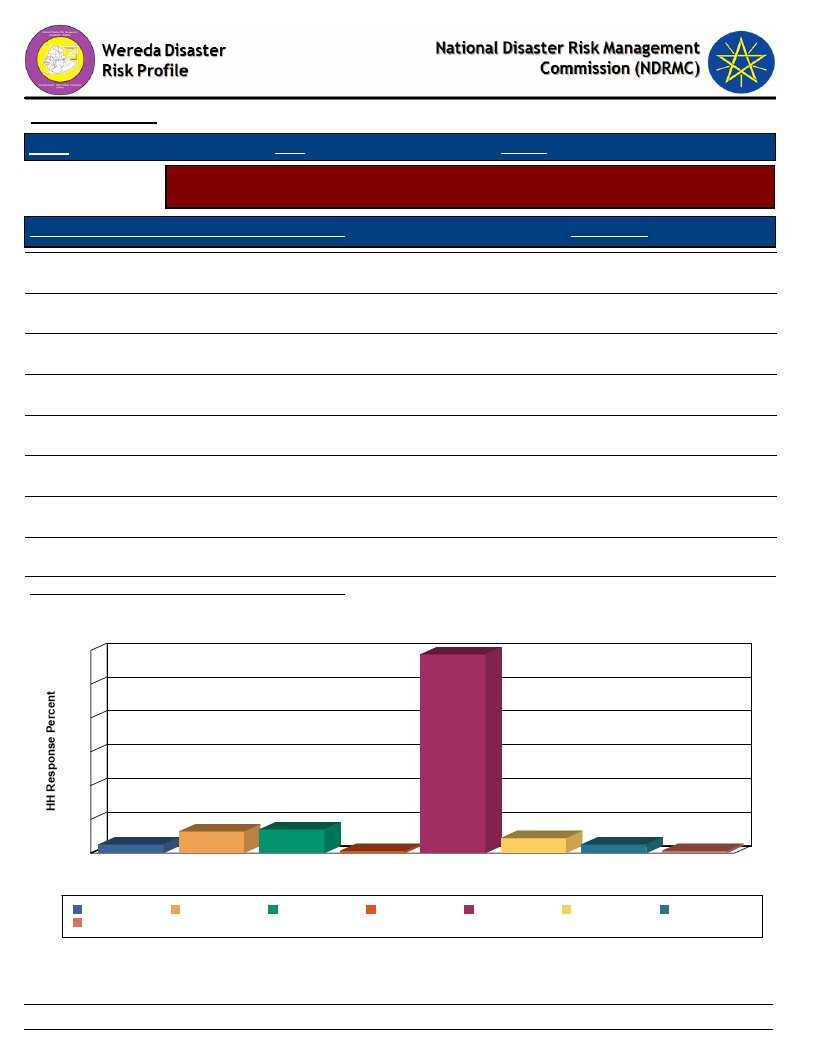
Data_Collected_Date
January 1900
Thursday, July 11, 2019
Region S.N.N.P
Zone SEGEN PEOPLES
Wereda ALLE SPECIAL
Selected Indicator
Household Access to Drinking Water - Number of times households fetch water
in a week
Number of Times Households Fetch Water in a Week
HH Response
Once
0.26
Twice
0.26
Three times
1.02
Four times
2.81
Five times
2.56
Six times
1.79
Seven times
23.53
Eight and more
1.02
Average Number of Times HH Fetch Water Per Week
12.59
Number of Times HH Fetch Water in a Week
24
24
20
16
12
8
4
1
0
Eight and more
3
Five times
Eight and more
Twice
Five times
3
2
0
Four times
Once
Seven times
Six times
Number of Times HH Fetch Water in a Week
Four times
Once
Seven times
1
Three times
Six times
0
Twice
Three times
171
Page 1 of 1
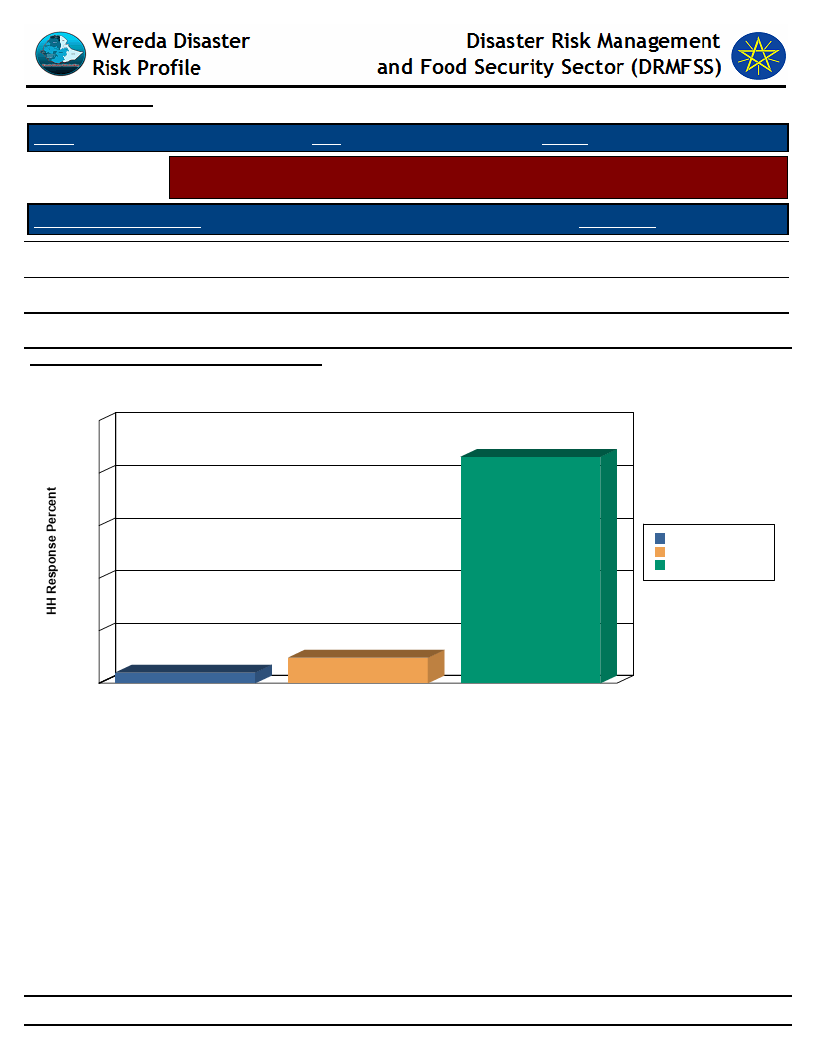
Data_Collected_Date
January 1900
Thursday, July 11, 2019
Region S.N.N.P
Zone SEGEN PEOPLES
Wereda ALLE SPECIAL
Selected Indicator
Household Access to Drinking Water - Time taken per day to fetch water for
households
Time Taken To Fetch Water
HH Response
Less than 30 min
86.19
30 min - 1 hr
9.72
1 hr and Above
Average Number of Times Taken To Fetch Water
4.09
22.51
Time Taken To Fetch Water for the HH
100
86
80
60
1 hr and Above
30 min - 1 hr
Less than 30 min
40
20
10
4
0
1 hr and Above
30 min - 1 hr
Less than 30 min
Time Taken To Fetch Water
172
Page 1 of 1
WDRP Indicators
Coping Mechanisms and
Preparedness
173

Wereda Disaster Risk
Profile
Data_Collected_Date
January 1900
Region S.N.N.P
Zone SEGEN PEOPLES
Selected Indicator
KebeleName
Capacity: Community Preparedness against Sudden Onset Disasters
Precaution_1
Comment_1
Precaution_2
KERKERT
TURUBA
KOLANGO
EYANA
LOKITE
GUMA
GOROZE
Reporting for
government or
responding bodies
Shifting resource
example, house
material, livestock
etc
Reporting for
government
Firstly asking
government for
helping
Highly prepare like
selling livestock,
saving money and
seeking other
contingency from
other
Sharing the resource
Mobilize the
community
To get response
from concerned
body
Selecting better
place to resist the
risk
Evaluate from risk
area
To get response
from concerned
bodies
To resist the
negative effect of
the disaster, to
reduce the disaster
risk threat
Evacuate from risk
area
Reporting for
governmental or
responding bodies
Severely affected
household helping
To reduce the risk of
the disaster
Evacuate from the
risk area
National Disaster Risk Management
Commission (NDRMC)
Thursday, July 11, 2019
Wereda ALLE SPECIAL
Comment_2
To save their life
and assets
Precaution_3
Use clean
water
Comment_3
To reduce
transmission
disease
To save their life
and material
To get response
from concerned
bodies
Evacuate from
risk area
To save their
life and assets.
To save their life
and material
174
Page 1 of 3

Wereda Disaster Risk
Profile
Data_Collected_Date
January 1900
Region S.N.N.P
Zone SEGEN PEOPLES
Selected Indicator
Capacity: Community Preparedness against Sudden Onset Disasters
KebeleName
DELBENA GAMA
TSEMEHA
ADIS OLETEMA
Precaution_1
Use short season crop
Reporting for
government or
responding bodies
Reporting the
government
Comment_1
To get a short
period of time
To get response
from concerned
body
To get response in
concerned body
Precaution_2
Use small scale
irrigation
Evaluate from risk
area
Evaluate from risk
area
GEWADA
DIGINTY
Make strategic
disaster risk
management system
For disaster
minimization
To cope the
negative effect of
the disaster
Awareness creation
for negative effect
of fire disaster
Reporting to
wereda for helping
for health problem
DEGA MASHELE
BOLE
Reporting for
government
responding bodies
Report to the wereda
To get response in
concerned body
To get response
recover the disaster
Evaluate from risk
area
Shift place
GERGEMA
Reporting for
government or
responding bodies
To get response
from concerned
body
Evacuate from risk
area
National Disaster Risk Management
Commission (NDRMC)
Thursday, July 11, 2019
Wereda ALLE SPECIAL
Comment_2
To improve the
product ion
To save their life
and asset.
To save the life
Precaution_3
Use specialized
animal
Use clean
water
Use clean
water
Comment_3
To improve
production
To reduce
transmission of
disease
To reduce
transmission
disease
If the hazard is
occurred
To save the life
To save life and
assets
To save their life
and assets
For health
problem
vaccination of
child
Use clean
water
Use clean
water
If fever caught
etc, occurred (
transmitted
disease)
To reduce
transmission of
disease
To reduced
transmission
disease
175
Page 2 of 3

Wereda Disaster Risk
Profile
Data_Collected_Date
January 1900
Region S.N.N.P
Zone SEGEN PEOPLES
Selected Indicator
KebeleName
Capacity: Community Preparedness against Sudden Onset Disasters
Precaution_1
Comment_1
Precaution_2
DUGULO
LALCHO
Active community
participation
Asking for help
To get relief
Migration
National Disaster Risk Management
Commission (NDRMC)
Thursday, July 11, 2019
Wereda ALLE SPECIAL
Comment_2
Precaution_3
Comment_3
To minimize the
disaster
Selling of
animal
To save life
176
Page 3 of 3

Wereda Disaster
Risk Profile
National Disaster Risk Management
Commission (NDRMC)
Data_Collected_Date
Region S.N.N.P
January 1900
Zone SEGEN PEOPLES
Wereda ALLE SPECIAL
Thursday, July 11, 2019
Selected Indicator
Capacity: Community Preparedness against Increase in Disaster Intensity
KebeleName
Precaution_1
Comment_1
Precaution_2
Comment_2
Precaution_3
Comment_3
KERKERT
TURUBA
KOLANGO
EYANA
LOKITE
Vaccination
Using integrated
soil and water
conservation
Forestation
Wise use of
resource like
money, livestock
fodder etc
Prepare the plan
to resist the
magnitude of the
hazard, the plan
must be related
with hazard.
To reduce human
transmission
diseases
To resist the effect
of the drought
improve the
resilience green
economy
Protect natural
resource from soil
degradation
Migration, select
other job like daily
work, and other
income types
Appropriate
plooughing
Improved
agricultural
practices
Developed soil and
water conservation
practices
To improve
productivity of soil
Harvesting
fodder
To save animal
life
To improve/
increased crop yield
and to reduce disease
Because of to
reduced soil erosion
is important
Avoiding
deforestation
and well
protect and
manage natural
resource
Important to
increase
production
productivity and
also to climate
change
177
Page 1 of 3

Wereda Disaster
Risk Profile
National Disaster Risk Management
Commission (NDRMC)
Data_Collected_Date
Region S.N.N.P
January 1900
Zone SEGEN PEOPLES
Wereda ALLE SPECIAL
Thursday, July 11, 2019
Selected Indicator
Capacity: Community Preparedness against Increase in Disaster Intensity
KebeleName
GUMA
GOROZE
DELBENA GAMA
TSEMEHA
ADIS OLETEMA
GEWADA
DIGINTY
DEGA MASHELE
Precaution_1
Prepare plan to
risk the drought
and negative
effect of disaster
Saving the
resource
Forestation
Use short season
crop
Use short season
crop
Decrease the
livestock and
wisely use the
limited resource
Use diversion
canal
Use short season
crop
Comment_1
To prepare and
response the
negative effect of
the disaster
Preparing
contingency for the
future
To improve soil
fertility and
increase soil erosion
To get yield in a
short period of time
Precaution_2
Improved
agricultural practice
Construct small
scale irrigation
Animal vaccination
Comment_2
Increased crop yield
and reduced disease
To minimize
To minimize animal
disease
To minimize the
effect of drought
To reduce the risk
of the hazards.
Use animal
vaccination
To prevent
transmitted disease
Precaution_3
Comment_3
Harvesting
fodder
To prevent
livestock life
construct small
scale irrigation
and harvesting
fodder
Harvesting
fodder
To improve the
productivity to
save animal life
To save animal
life
If flood occurred
To minimize the
effect of drought
Use irrigation
Use animal
vaccination
Before the drought
short season crops
To prevent animal
health
Harvesting
fodder
To save animal
life
178
Page 2 of 3
Wereda Disaster
Risk Profile
National Disaster Risk Management
Commission (NDRMC)
Data_Collected_Date
Region S.N.N.P
January 1900
Zone SEGEN PEOPLES
Wereda ALLE SPECIAL
Thursday, July 11, 2019
Selected Indicator
Capacity: Community Preparedness against Increase in Disaster Intensity
KebeleName
Precaution_1
Comment_1
Precaution_2
Comment_2
Precaution_3
Comment_3
BOLE
GERGEMA
DUGULO
LALCHO
Use short season
crop
Vaccination
Due to flood make
diversion canal
A forestation
To get short season
yield
Construct small
scale irrigation
To reduce human
transmission disease
Harvesting fodder
To improve
productivity of soil
Construction of
irrigation
To improve the
productivities
To save animal life
To minimize the
hazards
Use selected
animal breed
To improve
livestock
production
Harvesting
fodder
To save animal
life
179
Page 3 of 3

Wereda Disaster
Risk Profile
Data_Collected_Date
January 1900
Region S.N.N.P
Zone
SEGEN PEOPLES
Selected Indicator
Capacity: Community Preparedness against Disasters
Kebele Name
Precaution 1
Comment 1
Precaution 2
KERKERT
TURUBA
KOLANGO
EYANA
LOKITE
Wise use of money
and crops, saving
and loan
Need support from
government and
other non
governmental
organization such
as relief
Small scale
irrigation
Prepare strategic
mitigation measure
Using short season
crops, decrease
the number of
livestock to reduce
the pasture land
To reduce the effect
of consequence
By reporting the
indicators
Improve yield
Integrated soil and
water conservation,
decrease over grazing,
decreasing the number
of livestock
The climate change is
the severely effects
our community the we
select the short season
crops and other
options decrease the
number of livestock by
selling
Migration
Pottery work
Harvesting
fodder
Free planting
Re forestation
180
National Disaster Risk Management
Commission (NDRMC)
Thursday, July 11, 2019
Wereda ALLE SPECIAL
Comment 2
To save life and
seek special job
opportunity
By using hand
craft product
Precaution 3
Use modern
technology
Comment 3
To get good yield
and increase
income
To minimize
animal death
Reducing soil and
water
degradation
Short season crop
Collecting water
To harvest a short
period of time
For human being
and livestock
purpose
To decrease
temperature and
soil erosion
Page 1 of 4

Wereda Disaster
Risk Profile
Data_Collected_Date
January 1900
Region S.N.N.P
Zone
SEGEN PEOPLES
Selected Indicator
Capacity: Community Preparedness against Disasters
Kebele Name
Precaution 1
Comment 1
Precaution 2
GUMA
Forestation
Be recovering
destroyed forest
Create all
income
generating
activities
GOROZE
DELBENA GAMA
TSEMEHA
ADIS OLETEMA
Saving money,
food, selling
livestock and
reduce the number
of livestock
Harvesting fodder
Saving
Harvesting
To resist the future
drought negative
effect
During dry season
occur lack of fodder
and grazing land and
to prevent it
Most of community un
wise use of crop
product and money
then saving awareness
is important
In the dry season occur
lack of water and rain
the fodder of animal
must be harvested
Saving money
and food
Harvesting
fodder
Use short season
crop
181
National Disaster Risk Management
Commission (NDRMC)
Thursday, July 11, 2019
Wereda ALLE SPECIAL
Comment 2
To have
alternative
income
generating
activities
Precaution 3
Comment 3
To reduce the
negative effect
of the disaster
Water harvesting
Lack of grazing
land during dry
season and
drought
Use short season
crop
To get yield a
short period of
time
Saving
During dry season
important for
livestock drinking
and others
To get yield a
short period of
time
Most of the
community lack of
awareness about
saving then create
awareness to save
asset and crop
Page 2 of 4

Wereda Disaster
Risk Profile
Data_Collected_Date
January 1900
Region S.N.N.P
Zone
SEGEN PEOPLES
Selected Indicator
Capacity: Community Preparedness against Disasters
Kebele Name
Precaution 1
Comment 1
Precaution 2
GEWADA
DIGINTY
DEGA MASHELE
Helping each other
by sharing food and
money
Saving and wisely
use of grass, water
source and food,
collection of
waste( surplus
product )
Harvesting fodder
to livestock
To recover the effect
household family
member
If the disaster occur
the community
prevents their life
from disaster
In the dry season
occurs lack of fodder
and grazing land as
that time
Elders advise as
cooperate in
local helping
Use short season
crop
BOLE
GERGEMA
Saving and with
use of crop and
short season crop
Saving money and
saving food
Most of the community
literate then
awareness is important
about saving
To reduced the effect
of consequence
Use short season
crop
Harvesting of
fodder
National Disaster Risk Management
Commission (NDRMC)
Thursday, July 11, 2019
Wereda ALLE SPECIAL
Comment 2
Precaution 3
Comment 3
To report to
wereda kebele
decision maker
Foresting,
terracing,
minimize of the
over grazing
To get yield a
short period of
time
Saving
To get yield a
short period of
time
Selling more
animal
To reduced
animals fodder
shortage for the
dry season
Preparation of
check dam
Evaluate the
report, use of
irrigation and
using integrate
water and soil
conservation
Most of the
community un
wise use of money
because of literacy
and lack of
awareness
To increase the
fodder and grazing
land specialized
animal
Both for collecting
money and for
food purpose
182
Page 3 of 4
Wereda Disaster
Risk Profile
Data_Collected_Date
Region S.N.N.P
January 1900
Zone
SEGEN PEOPLES
Selected Indicator
Capacity: Community Preparedness against Disasters
Kebele Name
DUGULO
Precaution 1
Forestation
Comment 1
Prepare seed etc
Precaution 2
Create other
income
generating
activity
LALCHO
Saving
To minimize disaster
Use short season
crops
National Disaster Risk Management
Commission (NDRMC)
Thursday, July 11, 2019
Wereda ALLE SPECIAL
Comment 2
To harvest a
short period of
time
Precaution 3
Decrease over
grazing in the same
pasture place
Comment 3
Harvesting fodder
During dry season
occur lack of
animal fodder and
grazing land
183
Page 4 of 4

Wereda Disaster
Risk Profile
Data_Collected_Date
Region S.N.N.P
January 1900
Zone
SEGEN PEOPLES
National Disaster Risk Management
Commission (NDRMC)
Thursday, July 11, 2019
Wereda ALLE SPECIAL
Selected Indicator
Kebele Name
Hazard: Coping and recovering during last Disaster
ADIS OLETEMA
Type of Disaster(s)
Coping_Strategy
Drought
Report the wereda selling animal sharing of material
Description
during the incident report the wereda is important to get response to save asset loss, to save life
Recovery_Strategy
Use short season crop, forestation
Description
Community
Participation_Ways
Description
To minimize the negative effect of the disaster, soil and water conservation
Co operatively any disaster of the kebele
Helping each other to resist the disaster
Kebele Name
Type of Disaster(s)
Coping_Strategy
Description
Recovery_Strategy
Description
Community
Participation_Ways
Description
BOLE
Drought
Use Vaccination, selling animal, save the children, helping each other
To reduced disease transmission, use specialized animal and prevent loss of asset, save the life of children, awareness creation
Use short season crop, improved seed
after the incident short season crops improved to increase the yield of production
Help each other, sharing of material
The community to save life resist drought help each other by sharing material and food
184
Page 1 of 9

Wereda Disaster
Risk Profile
Data_Collected_Date
Region S.N.N.P
January 1900
Zone
SEGEN PEOPLES
National Disaster Risk Management
Commission (NDRMC)
Thursday, July 11, 2019
Wereda ALLE SPECIAL
Selected Indicator
Kebele Name
Hazard: Coping and recovering during last Disaster
DEGA MASHELE
Type of Disaster(s)
Coping_Strategy
Drought
Report the wereda, selling of animal, school feeding
Description
During the incident report the wereda risk management system and get first aid, to keep asset loss, to reduced school drop out
Recovery_Strategy
Use short season crop, forestation
Description
Community
Participation_Ways
Description
After the incident to minimize the hazard of disaster use short season crop and improved seeds
Cooperatively participate any disaster minimizing of the negative effect
To reduce the negative effect of drought the community use modern technology cooperatively
Kebele Name
Type of Disaster(s)
Coping_Strategy
Description
Recovery_Strategy
Description
Community
Participation_Ways
Description
DELBENA GAMA
Drought
Report the wereda, sharing of food
Report the wereda is important to get the response
Sharing of the material, distribute food and fodder to resist the drought
To save the life of human and animal.
Sharing of material and food
The community sharing material and food is first aid but now community external aids.
185
Page 2 of 9

Wereda Disaster
Risk Profile
Data_Collected_Date
Region S.N.N.P
January 1900
Zone
SEGEN PEOPLES
National Disaster Risk Management
Commission (NDRMC)
Thursday, July 11, 2019
Wereda ALLE SPECIAL
Selected Indicator
Kebele Name
Hazard: Coping and recovering during last Disaster
DIGINTY
Type of Disaster(s)
Coping_Strategy
Description
Drought
Select the poorest and asking the relief from government, reselling the livestock, select the beneficiary of PSNP, Selling assets,
using agriculture input
Slightly recover and better before the last year by help of relief and PSNP,in migration
Recovery_Strategy
By help of government and helping each other in kebele/ community
Description
Community
Participation_Ways
Description
Creation of awareness, early warning system, using irrigation, using modern technology including short season crops like teff,
haricot bean etc
Sharing of limited resource in household and development group leader support each other
Sharing of food
Kebele Name
Type of Disaster(s)
Coping_Strategy
Description
Recovery_Strategy
Description
Community
Participation_Ways
Description
DUGULO
Drought
Prepare and plan to reduce negative effect of disaster, migration, saving resource example money, flood, decrease the number
of cattle s
Support of government and sharing of foods and money each other
Sharing of resource , relief
186
Page 3 of 9

Wereda Disaster
Risk Profile
Data_Collected_Date
Region S.N.N.P
January 1900
Zone
SEGEN PEOPLES
National Disaster Risk Management
Commission (NDRMC)
Thursday, July 11, 2019
Wereda ALLE SPECIAL
Selected Indicator
Kebele Name
Hazard: Coping and recovering during last Disaster
EYANA
Type of Disaster(s)
Coping_Strategy
Drought
Mobilized to protect the disaster
Description
Helped each other and sharing limited resource each other by coordination of local leader ( development agent)
Recovery_Strategy
Rehabilitate the resource, relief, forecasting for future
Description
Community
Participation_Ways
Description
Constructing loose out of vulnerable place, early warning system in local method
Sharing of money, food, building house etc
If the disaster preparing and plan
Kebele Name
Type of Disaster(s)
Coping_Strategy
Description
Recovery_Strategy
Description
Community
Participation_Ways
Description
GERGEMA
Drought
Report for wereda, migrant of animal
Awareness creation, to reduced the impact by saving animal life
Short term asset migration, use short season crop
After the incident important to cope negative impact of disaster by saving food and non food item
Sharing of food, shelter and others
To developed cooperation to minimized the negative impact of disaster
187
Page 4 of 9

Wereda Disaster
Risk Profile
Data_Collected_Date
Region S.N.N.P
January 1900
Zone
SEGEN PEOPLES
National Disaster Risk Management
Commission (NDRMC)
Thursday, July 11, 2019
Wereda ALLE SPECIAL
Selected Indicator
Kebele Name
Hazard: Coping and recovering during last Disaster
GEWADA
Type of Disaster(s)
Coping_Strategy
Drought
Save life most of the time save children and elderly people, protect assets such as livestock, good, food etc.
Description
Reduce the problems by saving life and asset.
Recovery_Strategy
Helping each other, early warning each other.
Description
Community
Participation_Ways
Description
After the incident important to cope negative impact of disaster by saving food and non food item.
Sharing more, relief, sowing sweet potato ( sowing short season crop).
Developed cooperation to minimize the negative impact of disaster and also to cope the impact.
Kebele Name
Type of Disaster(s)
Coping_Strategy
Description
Recovery_Strategy
Description
Community
Participation_Ways
Description
GOROZE
Drought
Sharing of money, food, selling goat, sheep and cattle, seeking addition
Better status of coping measure to resist disaster
Relief and PSNP, recover and restoration activities
Rehabilitative activities on better to resist the disaster
Sharing of money food
Better measure for affected people
188
Page 5 of 9

Wereda Disaster
Risk Profile
Data_Collected_Date
Region S.N.N.P
January 1900
Zone
SEGEN PEOPLES
National Disaster Risk Management
Commission (NDRMC)
Thursday, July 11, 2019
Wereda ALLE SPECIAL
Selected Indicator
Kebele Name
Hazard: Coping and recovering during last Disaster
GUMA
Type of Disaster(s)
Coping_Strategy
Drought
Active community participation to cope incident
Description
Prepare the plan to reduce negative effect of the incident, preparedness and create
Recovery_Strategy
Recover action, rehabilitation
Description
Community
Participation_Ways
Description
Building asset for effect households, relief
Sharing resource example food, money etc
Ikub and Ider for emergency
Kebele Name
Type of Disaster(s)
Coping_Strategy
Description
Recovery_Strategy
Description
Community
Participation_Ways
Description
KERKERT
Drought
Report for wereda, migrant of animal, save children and elder, short term asset migration
Awareness creation, asking of wereda administration of relief, reduced the problems by saving life and asset, during the incident
report the wereda as reduced to negative
Use irrigation, migrant to other place, use short crop season, natural resource management
After the incident important to cope negative impact of disaster by saving food and non food item.
Sharing of food, shelter and cloth
Save life and cooperate together, developed cooperation to minimize the negative impact of disaster and also to cope the
impact.
189
Page 6 of 9
Wereda Disaster
Risk Profile
Data_Collected_Date
Region S.N.N.P
January 1900
Zone
SEGEN PEOPLES
Selected Indicator
Kebele Name
Hazard: Coping and recovering during last Disaster
KOLANGO
Type of Disaster(s)
Coping_Strategy
Drought
Community sharing food and non food items
Description
Reduce the problems by sharing food and non food items
Recovery_Strategy
Physical and biological water conservation
National Disaster Risk Management
Commission (NDRMC)
Thursday, July 11, 2019
Wereda ALLE SPECIAL
Description
Community
Participation_Ways
Description
Most soil and water conservation area not effective because of lack of biological ( planting ) conservation
Most of community are support by credit, food etc
To save life is effective specially save children and women
Kebele Name
Type of Disaster(s)
Coping_Strategy
Description
Recovery_Strategy
Description
Community
Participation_Ways
Description
LALCHO
Drought
Reporting the wereda, sharing of food, use enset as food
The wereda report is necessary to find helps and get aid
Harvesting fodder, tracing the affecting people , awareness creation
To save the animal life, to recover from disaster
The community help each other with sharing material
The community sharing of material and other necessary activities and skills
190
Page 7 of 9

Wereda Disaster
Risk Profile
Data_Collected_Date
Region S.N.N.P
January 1900
Zone
SEGEN PEOPLES
National Disaster Risk Management
Commission (NDRMC)
Thursday, July 11, 2019
Wereda ALLE SPECIAL
Selected Indicator
Kebele Name
Hazard: Coping and recovering during last Disaster
LOKITE
Type of Disaster(s)
Coping_Strategy
Drought
Sharing of foods, money and shelter, select the severely affected household and report to wereda
Description
Better status off coping / recover efforts example sharing money, food etc
Recovery_Strategy
Migration, rehabilitation, recovery of the household asset
Description
Community
Participation_Ways
Description
Replace and regain loss resource
Building house for severely affected household
Community local helping culture idir, Ikub and other
Kebele Name
Type of Disaster(s)
Coping_Strategy
Description
Recovery_Strategy
Description
Community
Participation_Ways
Description
TSEMEHA
Drought
Selling of animal , save the children and mother, helping each other
During the incident report the wereda to get relief and other material , reduced the problem by saving life and asset, awareness
creation
Use short season crop and small scale irrigation
After the incident important to short season impact of disaster by saving food and non food item
Helping each other sharing of food
Save life and cooperative together, developed cooperation to minimize the negative impact of disaster and also to cope the
impact.
191
Page 8 of 9
Wereda Disaster
Risk Profile
Data_Collected_Date
Region S.N.N.P
January 1900
Zone
SEGEN PEOPLES
Selected Indicator
Kebele Name
Hazard: Coping and recovering during last Disaster
TURUBA
Type of Disaster(s)
Coping_Strategy
Drought
Daily work for day food consumption, selling livestock, borrowing the money
Description
To resist the risk and to survive the negative effect of the disaster.
Recovery_Strategy
Rehabilitate ( reset ) the asset livestock, goat, sheep and poultry
Description
Community
Participation_Ways
Description
Restore and regain the resource loss at the time of the risk
Sharing money food
Local independent high social interaction
National Disaster Risk Management
Commission (NDRMC)
Thursday, July 11, 2019
Wereda ALLE SPECIAL
192
Page 9 of 9

Data_Collected_Date
Region S.N.N.P
January 1900
Zone SEGEN PEOPLES
Selected Indicator
Capacity: Type Community Participation
Kebele Name
Levels_Comm_Participation
KERKERT
Low level of cooperation mostly during
drought season
TURUBA
KOLANGO
EYANA
LOKITE
GUMA
GOROZE
DELBENA GAMA
TSEMEHA
ADIS OLETEMA
High social interaction, helping each other
Better social interaction in cooperation and
participation among the household to prevent
the drought
Better cooperation and participation among
kebele in social and economic activities
Highest level of cooperation and participation
for common good in kebele level
High cooperation between household to resist
the disaster by sharing resource and money
High social interaction based on development
group
Cooperate each other
The level of cooperation mostly during
drought season is good
The level of cooperation during on the
disaster time is very poor
GEWADA
DIGINTY
High social interaction due to cooperation in
social work to reduce disaster risk
management activities
Strong cooperation and social participation
between people
DEGA MASHELE
Cooperate each other most of the kebele
community
193
Thursday, July 11, 2019
Wereda ALLE SPECIAL
Changes_In_Last_Decade
Related to drought the population
decreasing cooperative with each
other, decreasing in the last decade
Level of co operation increased
during this period on the prevention
of hazards
No changes in the last decade
Recovery after the disaster risk
Better resist the disaster but,
recently change day to day
There improve the cooperative
The participation of female
increasing during the drought
The participation of community only
increasing on the disaster but on the
cooperation decline
Some change in kebele regarding to
disaster risk management system
Increasing social development
activities participation but the
change is less due to drought the
living standard is less before ten
years.
The participation of youth is low
during the disaster
Page 1 of 2

Data_Collected_Date
Region S.N.N.P
January 1900
Zone SEGEN PEOPLES
Selected Indicator
Capacity: Type Community Participation
Kebele Name
Levels_Comm_Participation
BOLE
GERGEMA
DUGULO
LALCHO
The level cooperation on the kebele level is
good on the disaster time
Cooperate and participate in a development
group
Strength cooperation and participate among
the people
Good cooperation and participation
Thursday, July 11, 2019
Wereda ALLE SPECIAL
Changes_In_Last_Decade
Only cooperation are on the disaster
time
No change
194
Page 2 of 2
Data_Collected_Date
Region S.N.N.P
January 1900
Zone SEGEN PEOPLES
Thursday, July 11, 2019
Wereda ALLE SPECIAL
Selected Indicator
Capacity: Recovery from Losses from Disasters - Percentage of Households who
have managed to recover from losses of disasters
Percentage of households who have managed to recover from losses of disasters
Comments
53.61 %
195
Page 1 of 1
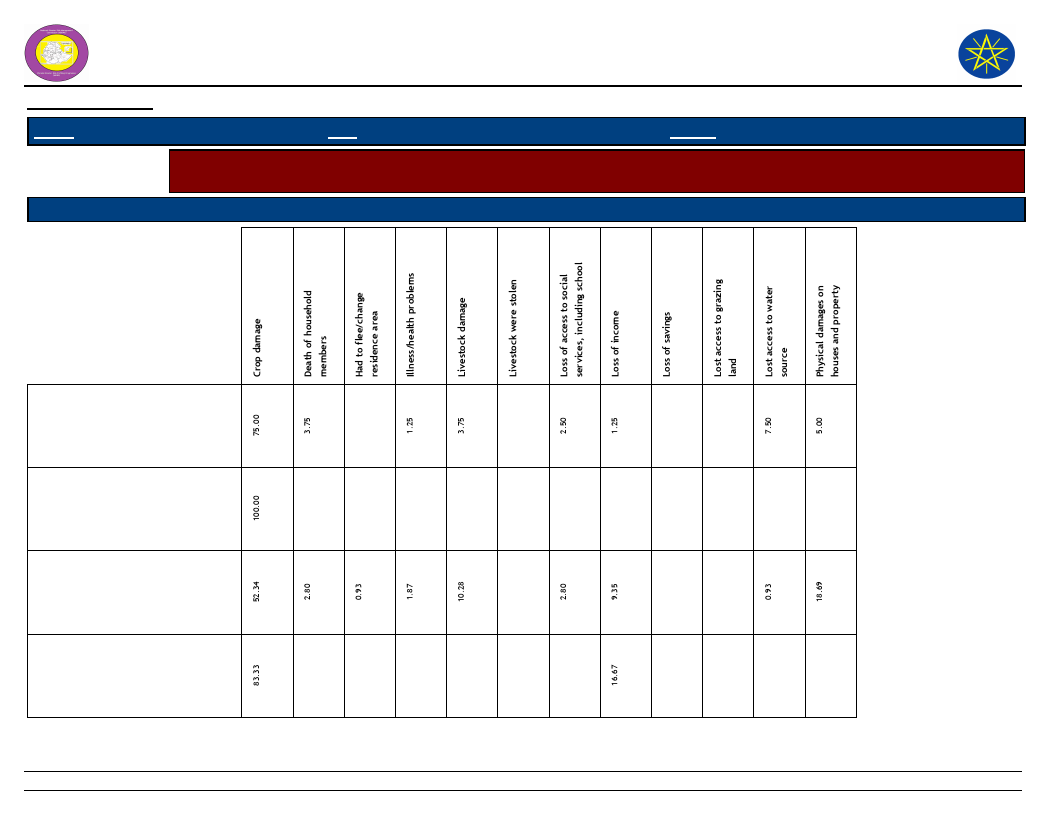
Wereda Disaster
Risk Profile
National Disaster Risk Management
Commission (NDRMC)
Data_Collected_Date
Region S.N.N.P
January 1900
Zone SEGEN PEOPLES
Wereda ALLE SPECIAL
Thursday, July 11, 2019
Selected Indicator
Capacity: Coping Strategies Adopted by Households - Main coping strategies adopted by households to recover
from respective losses
Type of Coping Strategy Adopted
Type of Loss
Borrowing of food or cash
(including purchasing food on
credit)
Collection of wild food
Consumption rather than sale
of crop surplus
Increased working hours
196
Page 1 of 4

Wereda Disaster
Risk Profile
National Disaster Risk Management
Commission (NDRMC)
Data_Collected_Date
Region S.N.N.P
January 1900
Zone SEGEN PEOPLES
Wereda ALLE SPECIAL
Thursday, July 11, 2019
Selected Indicator
Capacity: Coping Strategies Adopted by Households - Main coping strategies adopted by households to recover
from respective losses
Type of Coping Strategy Adopted
Type of Loss
Limit portion size at meals
Long-term / permanent
migration (including distress
migration of whole families)
Others -
Reduce number of meals eaten
in a day
197
Page 2 of 4
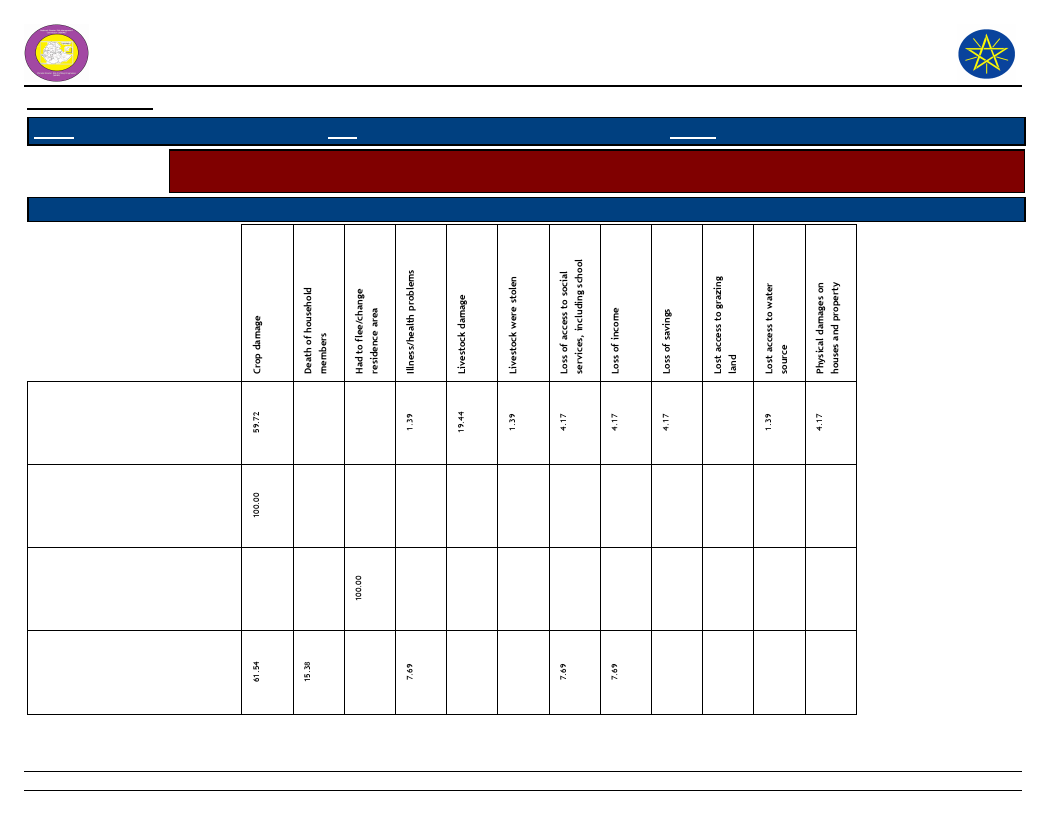
Wereda Disaster
Risk Profile
National Disaster Risk Management
Commission (NDRMC)
Data_Collected_Date
Region S.N.N.P
January 1900
Zone SEGEN PEOPLES
Wereda ALLE SPECIAL
Thursday, July 11, 2019
Selected Indicator
Capacity: Coping Strategies Adopted by Households - Main coping strategies adopted by households to recover
from respective losses
Type of Coping Strategy Adopted
Type of Loss
Reduced expenditure on
non-essential items (beer,
cigarettes, clothes, meat, etc.)
Rely on less preferred and less
expensive food
Sale of non-productive assets
(Jewelry, clothing, etc.)
Sale of productive assets (land,
farm implements, vehicle, etc.)
198
Page 3 of 4

Wereda Disaster
Risk Profile
National Disaster Risk Management
Commission (NDRMC)
Data_Collected_Date
Region S.N.N.P
January 1900
Zone SEGEN PEOPLES
Wereda ALLE SPECIAL
Thursday, July 11, 2019
Selected Indicator
Capacity: Coping Strategies Adopted by Households - Main coping strategies adopted by households to recover
from respective losses
Type of Coping Strategy Adopted
Type of Loss
Seek alternative or additional
jobs
Sell more livestock than usual
Sending children of household
for work
Short-term / seasonal labor
migration
199
Page 4 of 4
Data_Collected_Date
Region S.N.N.P
January 1900
Zone
SEGEN PEOPLES
Thursday, July 11, 2019
Wereda ALLE SPECIAL
Selected Indicator
Capacity: Coping Strategies Adopted by Households - Percentage of households
by frequency of main coping strategies adopted
Type of Coping Strategy Adopted
Frequency of Adoption
Borrowing of food or cash (including purchasing
food on credit)
Collection of wild food
Consumption rather than sale of crop surplus
Increased working hours
Limit portion size at meals
Long-term / permanent migration (including
distress migration of whole families)
Others -
Reduce number of meals eaten in a day
Reduced expenditure on non-essential items
(beer, cigarettes, clothes, meat, etc.)
Rely on less preferred and less expensive food
Sale of non-productive assets (Jewelry, clothing,
etc.)
Sale of productive assets (land, farm implements,
vehicle, etc.)
2.50
4.67
38.89
25.00
33.33
1.41
3.75
26.17
16.67
25.00
12.68
100.00
28.75
20.56
33.33
22.22
25.00
33.33
50.00
18.31
62.50
100.00
44.86
66.67
11.11
100.00
50.00
57.75
100.00
92.31
2.50
3.74
11.11
25.00
9.86
7.69
200
Page 1 of 2
Data_Collected_Date
Region S.N.N.P
January 1900
Zone
SEGEN PEOPLES
Thursday, July 11, 2019
Wereda ALLE SPECIAL
Selected Indicator
Capacity: Coping Strategies Adopted by Households - Percentage of households
by frequency of main coping strategies adopted
Type of Coping Strategy Adopted
Frequency of Adoption
Seek alternative or additional jobs
Sell more livestock than usual
Sending children of household for work
Short-term / seasonal labor migration
3.33
3.33
6.67
86.67
13.04
8.70
73.91
4.35
30.77
30.77
38.46
16.67
83.33
201
Page 2 of 2
Wereda Disaster
Risk Profile
Data_Collected_Date
January 1900
National Disaster Risk Management
Commission (NDRMC)
Thursday, July 11, 2019
Region S.N.N.P
Zone SEGEN PEOPLES
Wereda ALLE SPECIAL
Selected Indicator
Kebele Name
KERKERT
Capacity: Alternative Livelihood Sources - Alternative livelihood sources suggested by the community
Work_Option_1
Comment_1
Work_Option_2
Comment_2
Work_Option_3
Migrate from rural
area to urban for
daily labor
To get money for
supporting family
Sale of none
production asset,
selling local drink
( cheka)
To save food for the
next day and drink it to
save life and get income
Seeking
alternative or
additional jobs,
like poverty
TURUBA
Reducing daily
consumption of
legume foods
To save the limited
resource ( resist the
drought season )
Saving money
food
To share the severely
effect household
Using water
pump motor for
using vegetable
KOLANGO
EYANA
Seek job
opportunities
Move to urban
area for daily
labor works
To get money for
supporting family
To get money for
supporting family
Selling livestock
To reduced food gap
Seek alternative
or additional jobs
like ( pottery)
To get other income for
minimizing food gap
Increasing
working time
Sell local
drinking like
"cheka"
LOKITE
GUMA
Daily work,
example pottery,
seeking job
opportunity,
migration
Create other
additional income
generating
activities
To generate income
To increase income
Comment_3
To get other
income to
minimizing
food gap and
getting income
To improve
water
alternative
potential
To get more
money
For food
purpose and
also to
generate
income
202
Page 1 of 3

Wereda Disaster
Risk Profile
Data_Collected_Date
January 1900
National Disaster Risk Management
Commission (NDRMC)
Thursday, July 11, 2019
Region S.N.N.P
Zone SEGEN PEOPLES
Wereda ALLE SPECIAL
Selected Indicator
Kebele Name
GOROZE
DELBENA GAMA
TSEMEHA
ADIS OLETEMA
GEWADA
Capacity: Alternative Livelihood Sources - Alternative livelihood sources suggested by the community
Work_Option_1
Comment_1
Work_Option_2
Comment_2
Work_Option_3
Prepare local food
example cheka,
Trade, pottery
work, prepare
wood
Job opportunity,
day worker
Income generating
To save your life and
to head your life
Preparation of
Cheka ( local
drinking )
Most community use
cheka as food
Job day worker
Preparing local
food like Cheka,
areke
To save the asset of
community
Because of most
community drinking
and also a source of
income
Increased
working time
Sell local
drinking like
cheka
Use specialized
animal selling
more animals
Cheka
preparation
Create other
income
generating
activities like (
pottery )
To save money and to
minimize food gap
Both for food purpose
and also income purpose
Minimizing number
animal traditional
husbandry
Selling activity and
consumption like food
To get money for
supporting family
Migrate from
rural area to
urban for daily
labor
Migrate to urban
area for daily
labor
DIGINTY
Saving in Omo
Micro Finance in
kebele level
Saving in the better
for future threat
season
Fattening of
goats
Goats resist the dry
season
Comment_3
To get other
money,
income to
minimizing
family food
gap.
203
Page 2 of 3

Wereda Disaster
Risk Profile
Data_Collected_Date
January 1900
National Disaster Risk Management
Commission (NDRMC)
Thursday, July 11, 2019
Region S.N.N.P
Zone SEGEN PEOPLES
Wereda ALLE SPECIAL
Selected Indicator
Kebele Name
DEGA MASHELE
BOLE
GERGEMA
Capacity: Alternative Livelihood Sources - Alternative livelihood sources suggested by the community
Work_Option_1
Job and worker
Comment_1
To get money
Migrate to other
place
Preparation of
cheka and selling
it
daily labor and
income
To save money and
their own
consumption
Work_Option_2
Preparation of
local drinking (
cheka )
Preparation of "
cheka"
Work days
increasing
Comment_2
Most of community
consume it. low
expenditure but high
profitable.
The community use "
cheka" instead of food
To save money and
reduced food gap
Work_Option_3
Irrigation ( small
canal irrigation )
DUGULO
LALCHO
Food construct for
food support and
report to
government to
supply relief
Preparation of
Cheka drink to
sell
Both the food purpose
and also income
generating activities
Weaving
Planted of enset
and Moringa
The enset and moringa
resist the drought
Using irrigation
Comment_3
To increase
the production
and
productivity of
the community
204
Page 3 of 3
Data_Collected_Date
Region S.N.N.P
January 1900
Zone SEGEN PEOPLES
Thursday, July 11, 2019
Wereda ALLE SPECIAL
Selected Indicator
Type of Disaster
Capacity: Recovery from Losses from Disasters - Percentage of households
recovered from past disasters by type of Disasters
Recovered Percentage
Drought
83.65
Flood
1.44
Landslide
3.37
Crop diseases
4.33
Livestock diseases
2.40
Human diseases
0.48
Storms / hail storm
0.96
Heavy Rain
0.48
Frost / Cold waves
0.96
Conflicts
1.92
205
Page 1 of 1
Data_Collected_Date
Region S.N.N.P
January 1900
Zone SEGEN PEOPLES
Thursday, July 11, 2019
Wereda ALLE SPECIAL
Selected Indicator:
Capacity: Recovery from Losses from Disasters - Proportion of households
recovered by type of Losses
Type of Loss
Percentage
Physical damages on houses and property
13.94
Crop damage
63.46
Livestock damage
5.29
Death of household members
0.96
Illness/health problems
1.44
Loss of access to social services, including school
2.40
Loss of income
7.69
Loss of savings
0.96
Livestock were stolen
0.48
Lost access to grazing land
0.48
Lost access to water source
1.92
Had to flee/change residence area
0.96
206
Page 1 of 1

Data_Collected_Date
Region S.N.N.P
January 1900
Zone
SEGEN PEOPLES
Thursday, July 11, 2019
Wereda ALLE SPECIAL
Selected Indicator
Capacity: Coping Options if More Resources Available - What coping strategy
could be adopted if more resource were available?
Coping Strategy To Be Adopted
Response (%)
Adaptation of economic activities to hazards season (e.g. cropping cycle, short term
crops, etc.)
Storage of food and other necessities
52.82
26.41
Physical protection of buildings and property
18.21
Changing residence area/migration
2.05
Others (specify)
0.26
None
0.26
207
Page 1 of 1

Data_Collected_Date
January 1900
Thursday, July 11, 2019
Region S.N.N.P
Selected Indictor:
Zone SEGEN PEOPLES
Wereda ALLE SPECIAL
Capacity: Coping Strategies Adopted by Households - Percentage of households by
major type of coping strategies adopted (at least once)
Coping Strategy Adopted
Main Strategy
Secondary Strategy
Reduced expenditure on non-essential items (beer, cigarettes,
clothes, meat, etc.)
Consumption rather than sale of crop surplus
18.56
27.58
5.85
12.77
Sell more livestock than usual
6.19
3.19
Borrowing of food or cash (including purchasing food on credit)
20.62
8.51
Sale of non-productive assets (Jewelry, clothing, etc.)
0.26
1.06
Sale of productive assets (land, farm implements, vehicle, etc.)
3.35
1.86
Sending children of household for work
3.35
3.19
Short-term / seasonal labor migration
3.09
0.00
Long-term / permanent migration (including distress migration of
whole families)
Increased working hours
1.03
3.72
1.55
0.27
Seek alternative or additional jobs
7.73
13.83
Collection of wild food
0.26
30.32
Rely on less preferred and less expensive food
0.26
2.93
Limit portion size at meals
4.64
3.46
Reduce number of meals eaten in a day
0.52
3.72
208
Page 1 of 2
Data_Collected_Date
January 1900
Thursday, July 11, 2019
Region S.N.N.P
Selected Indictor:
Zone SEGEN PEOPLES
Wereda ALLE SPECIAL
Capacity: Coping Strategies Adopted by Households - Percentage of households by
major type of coping strategies adopted (at least once)
Coping Strategy Adopted
Main Strategy
Secondary Strategy
Others -
0.77
0.00
Others -
0.26
0.00
Reduce number of meals eaten in a day
0.00
1.86
Skip entire day without eating
0.00
0.80
Others -
0.00
0.53
No coping strategy adopted
0.00
0.27
209
Page 2 of 2

Wereda Disaster
Risk Profile
National Disaster Risk Management
Commission (NDRMC)
Data_Collected_Date
January 1900
Region S.N.N.P
Zone SEGEN PEOPLES
Wereda ALLE SPECIAL
Selected Indicator
Capacity: Coping Strategies Adopted by Households - Main coping strategies adopted by households for respective
disasters
Coping Strtegies Adopted
Types of disaters for which HHs in the community adopt the listed
Coping Strtegies
Thursday, July 11, 2019
Borrowing of food or cash
(including purchasing food
on credit)
Collection of wild food
Consumption rather than
sale of crop surplus
210
Page 1 of 6

Wereda Disaster
Risk Profile
National Disaster Risk Management
Commission (NDRMC)
Data_Collected_Date
January 1900
Region S.N.N.P
Zone SEGEN PEOPLES
Wereda ALLE SPECIAL
Selected Indicator
Capacity: Coping Strategies Adopted by Households - Main coping strategies adopted by households for respective
disasters
Coping Strtegies Adopted
Types of disaters for which HHs in the community adopt the listed
Coping Strtegies
Thursday, July 11, 2019
Increased working hours
Limit portion size at meals
Long-term / permanent
migration (including
distress migration of
whole families)
211
Page 2 of 6
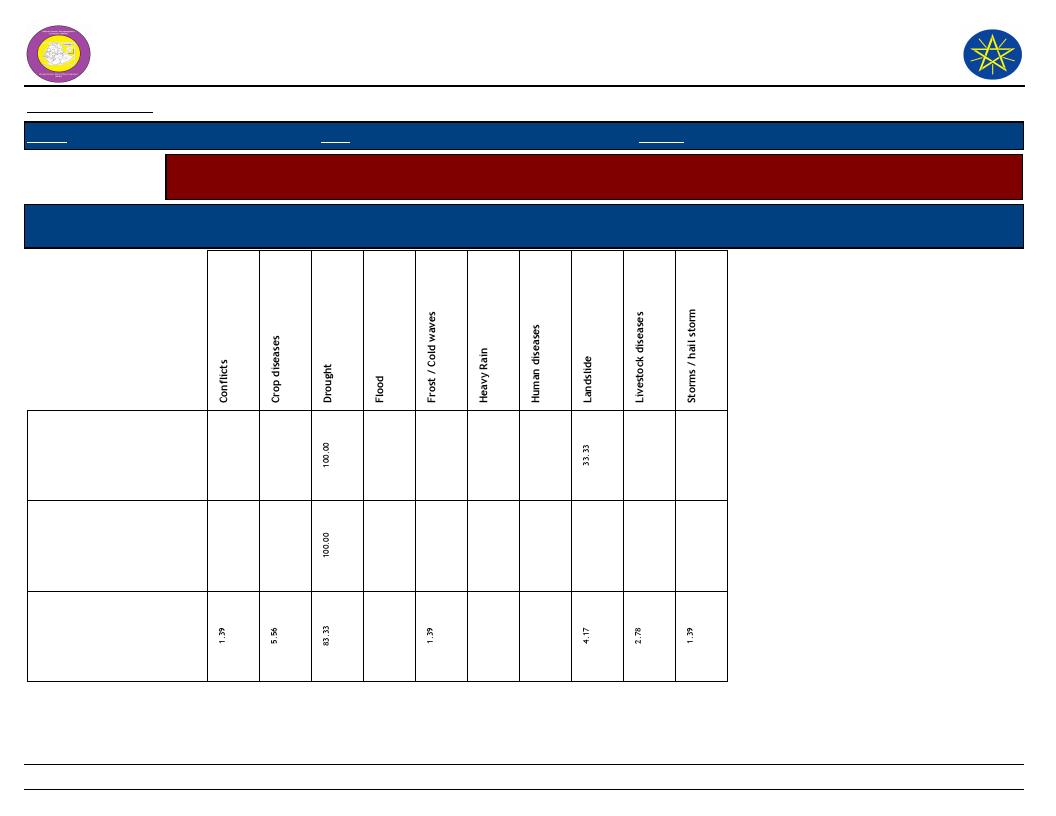
Wereda Disaster
Risk Profile
National Disaster Risk Management
Commission (NDRMC)
Data_Collected_Date
January 1900
Region S.N.N.P
Zone SEGEN PEOPLES
Wereda ALLE SPECIAL
Selected Indicator
Capacity: Coping Strategies Adopted by Households - Main coping strategies adopted by households for respective
disasters
Coping Strtegies Adopted
Types of disaters for which HHs in the community adopt the listed
Coping Strtegies
Thursday, July 11, 2019
Others -
Reduce number of meals
eaten in a day
Reduced expenditure on
non-essential items (beer,
cigarettes, clothes, meat,
etc.)
212
Page 3 of 6

Wereda Disaster
Risk Profile
National Disaster Risk Management
Commission (NDRMC)
Data_Collected_Date
January 1900
Region S.N.N.P
Zone SEGEN PEOPLES
Wereda ALLE SPECIAL
Selected Indicator
Capacity: Coping Strategies Adopted by Households - Main coping strategies adopted by households for respective
disasters
Coping Strtegies Adopted
Types of disaters for which HHs in the community adopt the listed
Coping Strtegies
Thursday, July 11, 2019
Rely on less preferred and
less expensive food
Sale of non-productive
assets (Jewelry, clothing,
etc.)
Sale of productive assets
(land, farm implements,
vehicle, etc.)
213
Page 4 of 6

Wereda Disaster
Risk Profile
National Disaster Risk Management
Commission (NDRMC)
Data_Collected_Date
January 1900
Region S.N.N.P
Zone SEGEN PEOPLES
Wereda ALLE SPECIAL
Selected Indicator
Capacity: Coping Strategies Adopted by Households - Main coping strategies adopted by households for respective
disasters
Coping Strtegies Adopted
Types of disaters for which HHs in the community adopt the listed
Coping Strtegies
Thursday, July 11, 2019
Seek alternative or
additional jobs
Sell more livestock than
usual
Sending children of
household for work
214
Page 5 of 6
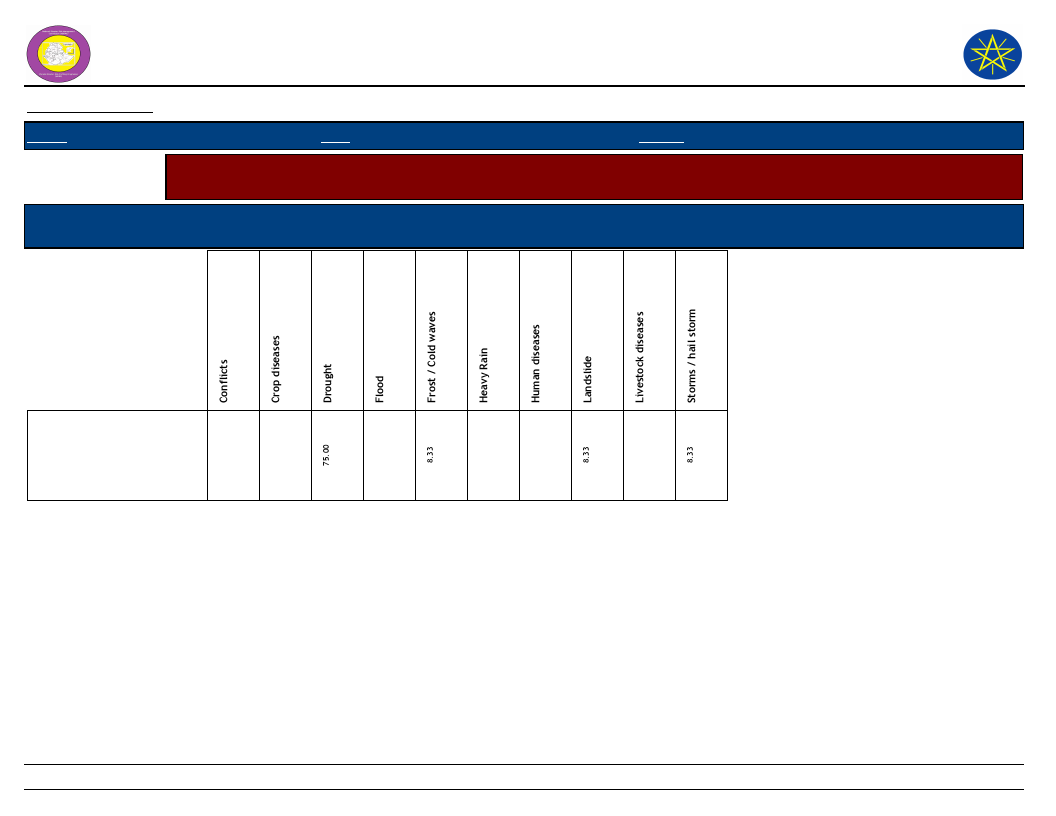
Wereda Disaster
Risk Profile
National Disaster Risk Management
Commission (NDRMC)
Data_Collected_Date
January 1900
Region S.N.N.P
Zone SEGEN PEOPLES
Wereda ALLE SPECIAL
Selected Indicator
Capacity: Coping Strategies Adopted by Households - Main coping strategies adopted by households for respective
disasters
Coping Strtegies Adopted
Types of disaters for which HHs in the community adopt the listed
Coping Strtegies
Thursday, July 11, 2019
Short-term / seasonal
labor migration
215
Page 6 of 6

Wereda Disaster Risk
Profile
National Disaster Risk Management
Commission (NDRMC)
Data_Collected_Date
Region S.N.N.P
January 1900
Zone
SEGEN PEOPLES
Wereda ALLE SPECIAL
Thursday, July 11, 2019
Selected Indicator
Capacity: Coping Strategies Adopted by Households - Secondary coping strategies adopted by households for
respective disasters
Begging for money or for
food
Borrowing of food or cash
(including purchasing food
on credit)
Collection of wild food
Consumption rather than
sale of crop surplus
Increased working hours
Limit portion size at meals
216
Page 1 of 4

Wereda Disaster Risk
Profile
National Disaster Risk Management
Commission (NDRMC)
Data_Collected_Date
Region S.N.N.P
January 1900
Zone
SEGEN PEOPLES
Wereda ALLE SPECIAL
Thursday, July 11, 2019
Selected Indicator
Capacity: Coping Strategies Adopted by Households - Secondary coping strategies adopted by households for
respective disasters
Long-term / permanent
migration (including
distress migration of whole
No coping strategy adopted
Others -
Reduce number of meals
eaten in a day
Reduced expenditure on
non-essential items (beer,
cigarettes, clothes, meat,
Reduced expenditure on
productive inputs
(fertilizer, seeds, livestock
217
Page 2 of 4
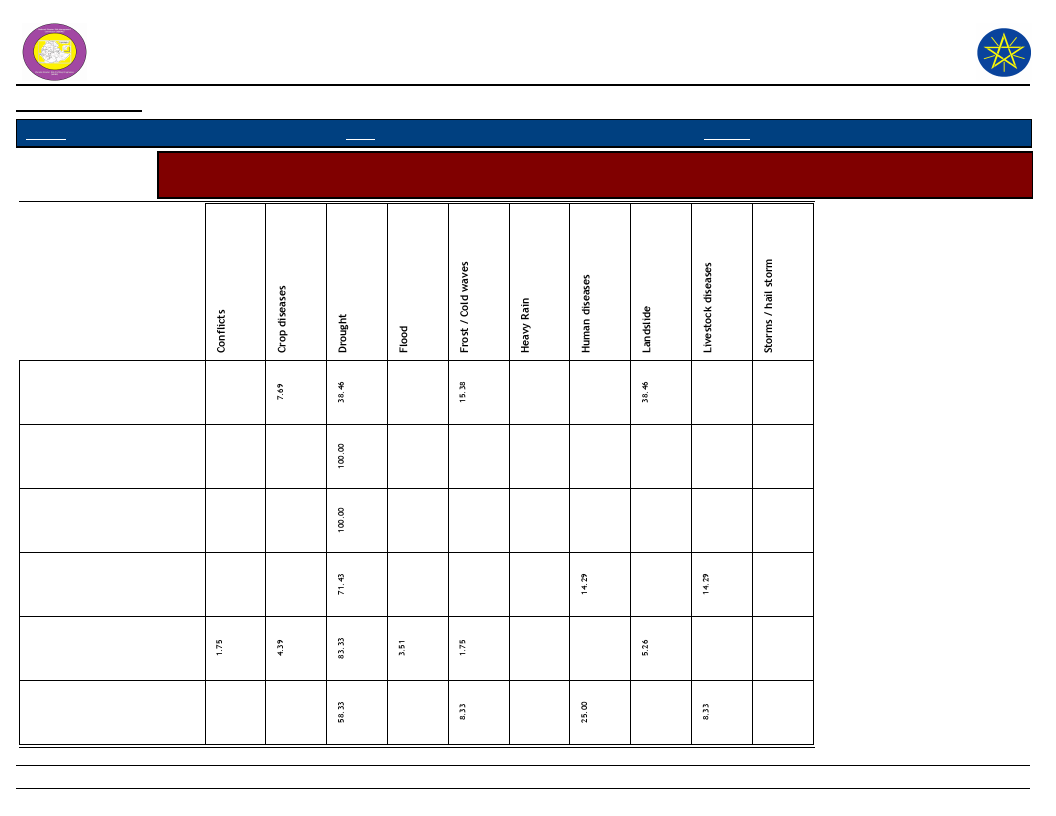
Wereda Disaster Risk
Profile
National Disaster Risk Management
Commission (NDRMC)
Data_Collected_Date
Region S.N.N.P
January 1900
Zone
SEGEN PEOPLES
Wereda ALLE SPECIAL
Thursday, July 11, 2019
Selected Indicator
Capacity: Coping Strategies Adopted by Households - Secondary coping strategies adopted by households for
respective disasters
Rely on less preferred and
less expensive food
Restrict consumption by
adults in order for small
children to eat
Sale of non-productive
assets (Jewelry, clothing,
etc.)
Sale of productive assets
(land, farm implements,
vehicle, etc.)
Seek alternative or
additional jobs
Sell more livestock than
usual
218
Page 3 of 4

Wereda Disaster Risk
Profile
National Disaster Risk Management
Commission (NDRMC)
Data_Collected_Date
Region S.N.N.P
January 1900
Zone
SEGEN PEOPLES
Wereda ALLE SPECIAL
Thursday, July 11, 2019
Selected Indicator
Capacity: Coping Strategies Adopted by Households - Secondary coping strategies adopted by households for
respective disasters
Sending children of
household for work
Short-term / seasonal labor
migration
Skip entire day without
eating
219
Page 4 of 4
WDRP Indicators
Community
Perceptions and Suggestions
220
Wereda Disaster
Risk Profile
Data_Collected_Date
January 1900
National Disaster Risk Management
Commission (NDRMC)
Thursday, July 11, 2019
Region S.N.N.P
Zone
SEGEN PEOPLES
Wereda ALLE SPECIAL
Selected Indicator
Kebele Name
Interventions: Community Perception on Mediums to Influence DRM Actors - Community perception on the
effectiveness of institutional channels to use to influence DRM actors
Institution_1
Process_Description
Institution_2 Process_Description
Institution_3
Process_Description
KERKERT
TURUBA
Cooperative( Edir)
If disaster occur
cooperative each
other with the
kebele people.
Developmental
group
The developmental
group leaders the
members
Kebele risk
management
to wereda risk
management
The network is very
good but not on time or
during accident
KOLANGO
EYANA
LOKITE
Kebele
management part
Decision maker
kebele
administrative and
other stakeholder
1 to 5 ,
development
group, kebele
manager
1 to 5
organization,
development
group community
Discuss in issues due
to disaster risk and
hazard,
management system
Our community
decision making
channels
sequentially from
communities to
kebele
administration
regarding to
magnitude of
disaster
Kebele
development
leader
Information and
awareness creation
for community
Kebele risk
management
to wereda risk
management
Command post
221
The network is very
good but not on time
or during accident
Any assessment and
evaluation of climate
change each
community is
collected by
Development agents
and reported to
command post
organization in
kebele.
Local disaster
risk
management
method like
Debo, leaders
Reduced risk of disaster
Page 1 of 4

Wereda Disaster
Risk Profile
Data_Collected_Date
January 1900
National Disaster Risk Management
Commission (NDRMC)
Thursday, July 11, 2019
Region S.N.N.P
Zone
SEGEN PEOPLES
Wereda ALLE SPECIAL
Selected Indicator
Kebele Name
Interventions: Community Perception on Mediums to Influence DRM Actors - Community perception on the
effectiveness of institutional channels to use to influence DRM actors
Institution_1
Process_Description
Institution_2 Process_Description
Institution_3
Process_Description
GUMA
1 to 5
GOROZE
DELBENA GAMA
1 to 5,
development
group, kebele
administration
Edir
TSEMEHA
Edir leader
ADIS OLETEMA
Edir leader
Evaluate the
performance of crop
production and
livestock health
then report to
kebele disaster risk
management
committee
Community
discussed from early
warning groups
Development
groups
Report the reports
evaluated by 1 to 5
organization to
kebele disaster risk
management
committee
Kebele health
centre
Health extension at
kebele level
The community edir
leader ordered to
resist the drought
Awareness creation
by the leader of edir
Developmental
group
Developmental
group
The participation of
developmental group
actively participate
The developmental
group leaders lead
the members
Awareness creation
by the leader
community
Kebele risk
management
report to
wereda risk
management
To reduced the
impact of disaster
and protect
community life
Kebele disaster
risk
management
committee
Select severely
affected household and
report to wereda
Kebele risk
management
to wereda risk
management
The network is very
good but not on time
Edir
Edir members
cooperate each other
to save the safer
community
222
Page 2 of 4

Wereda Disaster
Risk Profile
Data_Collected_Date
January 1900
National Disaster Risk Management
Commission (NDRMC)
Thursday, July 11, 2019
Region S.N.N.P
Zone
SEGEN PEOPLES
Wereda ALLE SPECIAL
Selected Indicator
Kebele Name
Interventions: Community Perception on Mediums to Influence DRM Actors - Community perception on the
effectiveness of institutional channels to use to influence DRM actors
Institution_1
Process_Description
Institution_2 Process_Description
Institution_3
Process_Description
GEWADA
DIGINTY
DEGA MASHELE
BOLE
GERGEMA
Religious
institution
1 to 5 and
development
group kebele level
and at wereda
level of the
organization
Equb
If disaster occur in
the area the
religious leaders and
member are co
operative each other
with the kebele
people.
Accept the wereda
early warning
information system
to members, make
meeting sharing of
how to decrease in
kebele
Kebele
administration
early warning
community
Eder
Awareness creation
by the leader of
early warning groups
If disaster occur
cooperative each
other with the
kebele people
Development
group leaders
Developmental
group
Kebele health
center
Developmental
group
To protect community
health and decision
with health extension
at kebele level
Important to
developed the group
leader and member
1 to 5
organization
Kebele risk
management
to wereda risk
management
1 to 5
The network is good
but not on time
The network is good
but not on time
223
Page 3 of 4

Wereda Disaster
Risk Profile
Data_Collected_Date
January 1900
National Disaster Risk Management
Commission (NDRMC)
Thursday, July 11, 2019
Region S.N.N.P
Zone
SEGEN PEOPLES
Wereda ALLE SPECIAL
Selected Indicator
Kebele Name
Interventions: Community Perception on Mediums to Influence DRM Actors - Community perception on the
effectiveness of institutional channels to use to influence DRM actors
Institution_1
Process_Description
Institution_2 Process_Description
Institution_3
Process_Description
DUGULO
LALCHO
1 to 5 -->
development
group--> kebele-->
wereda
Eder
The community Eder
is important during
disaster and
weeding
Youth
association
Youth cooperatively
work
Developmental
group
Leads to how to
coordinate and
minimize the effect of
disaster
224
Page 4 of 4
Data_Collected_Date
Region S.N.N.P
January 1900
Zone
SEGEN PEOPLES
Thursday, July 11, 2019
Wereda ALLE SPECIAL
Selected Indicator
Interventions: Community Perception on their Knowledge used in DRM Process -
Perception of the community on how their knowledge influences the priorities
and measures of DRM actors
KebeleName
Community_Suggestions
KERKERT
TURUBA
Yes, our suggestion and knowledge are influence in some development issues,
specially extra structure construction, but in some weakness present in the cause of
good governmental problems.
KOLANGO
Yes, our suggestion and knowledge are influence some developmental issues
EYANA
LOKITE
GUMA
GOROZE
DELBENA GAMA
TSEMEHA
ADIS OLETEMA
Prepare plan based on community needs and decided on best risk management
strategies based on knowledge of community.
The suggestion and knowledge of our community positive influence the priorities
and measure taken by the kebele DRM committee and community food security
taskforce, regarding to and disaster risk management activities.
Effective contribution in some institution example wereda agriculture office,
livestock and fisheries office and wereda health office etc
Prepare strategic and effective disaster risk management and plan to implementing
depending as local community need related with disaster
Yes, our suggestion and knowledge are influence in some development issues,
specially extra structure construction activity but in some weakness are present in
the cause of good governmental problems
Our suggestion knowledge are influence in some development issues specially extra
structure construction
Our suggestion and knowledge use very highly influence all the community
GEWADA
DIGINTY
DEGA MASHELE
BOLE
GERGEMA
Prepare strategic and effective disaster risk management policies and plane
implementation depend on local community need related with disaster.
If they prepare strong strategic plan and disaster risk management project as well
as create awareness of the worst of the disaster better to manage the disaster.
Yes because of our responsibilities concerned the risk and hazard prevention,
preparing and responding .
In my suggestion the community severely affected with drought then the
government resettlement other place.
Yes, our suggestion and knowledge are influence in save development issues.
225
Page 1 of 2

Data_Collected_Date
Region S.N.N.P
January 1900
Zone
SEGEN PEOPLES
Thursday, July 11, 2019
Wereda ALLE SPECIAL
Selected Indicator
Interventions: Community Perception on their Knowledge used in DRM Process -
Perception of the community on how their knowledge influences the priorities
and measures of DRM actors
KebeleName
Community_Suggestions
DUGULO
LALCHO
Better effectiveness government and non government office contribution is creates
positive influence in communities.
226
Page 2 of 2
Wereda Disaster Risk
Profile
National Disaster Risk Management
Commission (NDRMC)
Data_Collected_Date
Region
Zone
Wereda
Thursday, July 11, 2019
Selected Indicator
Interventions: Suggestions to improve preparedness - Interventions suggested by the community to development
actors to improve preparedness in the area
KebeleName
Measure 1
Comment 1
Measure 2
Comment 2
Measure 3
Comment 3
227
Page 1 of 1
Wereda Disaster Risk
Profile
National Disaster Risk Management
Commission (NDRMC)
Data_Collected_Date
Region S.N.N.P
January 1900
Zone SEGEN PEOPLES
Wereda ALLE SPECIAL
Thursday, July 11, 2019
Selected Indicator
Interventions: Suggestions to DRM Actors in the Area - Community suggested measures to DRM actors in the area
for effective DRM actions
Kebele Name
KERKERT
Measure 1
Give vaccination to
child
Comment 1
To preventing
transmission
disease as and
responding
activity to sick
human
TURUBA
Measure 2
Accessing relief and
first aid and awareness
creation, preventing,
preparing and how
responding system
Comment 2
Awareness creation
to the community
how to minimize
the disaster risk
and mitigation
method,
availability of
food/ relief
Measure 3
Build small scale
irrigation access
Comment 3
To improved
production
productivity of
the area
KOLANGO
EYANA
Small scale
irrigation
Building small scale
irrigation access
To increase the
production
productivity
because of most
area are rain fed
activity
To improved
production and
productivity of
the area to
reduced food
gap.
Electricity
Saving of money
To build small
scale job
opportunity in the
wereda
Improved seed
Important to
developed food
security
Livestock
vaccination and
treatment
To reduced
vector born
disease and
increased
livestock
production
228
Page 1 of 4
Wereda Disaster Risk
Profile
National Disaster Risk Management
Commission (NDRMC)
Data_Collected_Date
Region S.N.N.P
January 1900
Zone SEGEN PEOPLES
Wereda ALLE SPECIAL
Thursday, July 11, 2019
Selected Indicator
Interventions: Suggestions to DRM Actors in the Area - Community suggested measures to DRM actors in the area
for effective DRM actions
Kebele Name
LOKITE
Measure 1
Prepare good
infrastructure
GUMA
Improve strong and
effective early
warning
GOROZE
DELBENA GAMA
Improve high social
interaction and
create better
awareness relate
with risk
Construction of
irrigation
Comment 1
Better
infrastructure
helps good
disaster risk
management
activities
To forecast the
future and
prepare the
strategic measure
of disaster
Because of some
risk management
need deep
awareness and
knowledge
To minimize the
negative effect
Measure 2
Supply other water
option like water pump
Prepare plan to
manage effective of
disaster
Small scale irrigation
Create job opportunity
to youth
Comment 2
To provide the
vegetable short
season and others
Measure 3
By improving early
warning system
related to disaster
risk
To increase the
production,
productivity
important for food
security
Reduced
dependent of
young on
governmental
works
Accessing of
improved seeds
Comment 3
Important
because of
drought
resistance crop
229
Page 2 of 4

Wereda Disaster Risk
Profile
National Disaster Risk Management
Commission (NDRMC)
Data_Collected_Date
Region S.N.N.P
January 1900
Zone SEGEN PEOPLES
Wereda ALLE SPECIAL
Thursday, July 11, 2019
Selected Indicator
Interventions: Suggestions to DRM Actors in the Area - Community suggested measures to DRM actors in the area
for effective DRM actions
Kebele Name
TSEMEHA
Measure 1
Awareness creation
Comment 1
How to minimize
and prevent of
the disaster
ADIS OLETEMA
GEWADA
DIGINTY
Awareness creation
for community
about prevention of
disaster
Save the children
NGOs are create
awareness in give
birth in health
center and
profession health
experts.
Creativity of
awareness about
disaster,
vaccination of child
and livestock
How to minimize
and preventing
the disaster
To give enough
awareness
related with
disaster risk
Our community
have low
awareness about
disaster and
livestock disease
causes death of
livestock.
Measure 2
Saving
Saving
Mercy corps
management of natural
resource in wisely
Plan of the project to
manage the disaster
Comment 2
To prevent the loss
of asset and
responding
disasters
To prevent the loss
of asset and
responding of
disasters
To give awareness
natural resource
management
activity
Measure 3
Forestation
Forestation (
plantation
activity )
Comment 3
To improve
natural resource
To resist disaster
at dry season most
of the time our
kebele community
have less plan
Focusing pay
attention to
mothers who give
birth
230
Page 3 of 4
Wereda Disaster Risk
Profile
National Disaster Risk Management
Commission (NDRMC)
Data_Collected_Date
Region S.N.N.P
January 1900
Zone SEGEN PEOPLES
Wereda ALLE SPECIAL
Thursday, July 11, 2019
Selected Indicator
Interventions: Suggestions to DRM Actors in the Area - Community suggested measures to DRM actors in the area
for effective DRM actions
Kebele Name
DEGA MASHELE
Measure 1
Awareness creation
Comment 1
Measure 2
Saving
BOLE
GERGEMA
DUGULO
LALCHO
Awareness creation
Build small scaling
irrigation access
Strong early
warning system,
strategic plan for
disaster risk
management
Construction of
check dam
How to minimize
the disaster
Saving
To increasing the
production
productivity of
the community in
the area
Give vaccination to
child and mothers
To harvest water
in rainy season
Accessing of improved
seeds
Comment 2
To preventing loss
of assets and
responding disaster
To save asset and
building capacity
during disaster.
To preventing
transmission
disease and
responding activity
to sick human
Measure 3
Forestation
A forestation
Soil and water
conservation
practices
To increase
productivity
Forestation
Comment 3
To improve
productivity of
the crop
To improve
natural resource
resource
To improved
natural resources
and also improve
soil fertility.
To control soil
erosion land
degradation
231
Page 4 of 4
Wereda Disaster Risk
Profile
National Disaster Risk Management
Commission (NDRMC)
Data_Collected_Date
Region S.N.N.P
January 1900
Zone SEGEN PEOPLES
Wereda ALLE SPECIAL
Thursday, July 11, 2019
Selected Indicator
Economic Vulnerability: Community Suggestions to Improve Economic Situation - Community suggested measures
to improve the economic situation of the area
KebeleName
Measure 1
Comment 1
Measure 2
Comment 2
Measure 3 Comment 3
KERKERT
TURUBA
KOLANGO
EYANA
LOKITE
GUMA
Use short season crop
Build small scale
irrigation channel
Road access
To harvesting short period
of time
Build small scale
irrigation
To increase production
and productivity
Poor road access
Use/ improved
short season crop
Improved seed
Great awareness
diversification of
income generating
activity
Irrigation, improve
agriculture input, water
pump
It is the best option
Supply and
facilitation
infrastructure
Medium trade
Shifting activities with
change of the season
To improve the
production of crop
production and livestock
production
To produce 3
times a year
To increase yield
production
Local seed
production are low
Use
specialized
seeds
To increase
yield
Market access
Selling crop
and livestock
production
Infrastructure
Facilitation
of
infrastructur
e important
for owe life
232
Page 1 of 3

Wereda Disaster Risk
Profile
National Disaster Risk Management
Commission (NDRMC)
Data_Collected_Date
Region S.N.N.P
January 1900
Zone SEGEN PEOPLES
Wereda ALLE SPECIAL
Thursday, July 11, 2019
Selected Indicator
Economic Vulnerability: Community Suggestions to Improve Economic Situation - Community suggested measures
to improve the economic situation of the area
KebeleName
GOROZE
Measure 1
Irrigation
Comment 1
To improve the income
Measure 2
Short season crop
sowing
Comment 2
To resist the
drought
Measure 3
Water pump
and
contingency
pond
Comment 3
Use
alternative
water
DELBENA GAMA
Use fertilizer
To improve productivity
Construction of
road
To link market
Construct
small scale
irrigation
To increase
yield
TSEMEHA
Use modern farming
system
To improve
Use specialized
animal
To improve dairy
cattle
Use irrigation
To improve
production
ADIS OLETEMA
Use fertilizer
Use short season
crop
Constructing
water
conservation
dam
GEWADA
Prepare food warehouse
DIGINTY
Modernizing the
agriculture system
DEGA MASHELE
Use technology
Irrigation using in
tradition / small
scale irrigation
To improve productivity
Use fertilizers
233
To increase yield
Animal
husbandry
and
construction
of the animal
health post
Use short
season crop
To harvest
short period
of time
Page 2 of 3

Wereda Disaster Risk
Profile
National Disaster Risk Management
Commission (NDRMC)
Data_Collected_Date
Region S.N.N.P
January 1900
Zone SEGEN PEOPLES
Wereda ALLE SPECIAL
Thursday, July 11, 2019
Selected Indicator
Economic Vulnerability: Community Suggestions to Improve Economic Situation - Community suggested measures
to improve the economic situation of the area
KebeleName
Measure 1
Comment 1
Measure 2
Comment 2
Measure 3 Comment 3
BOLE
GERGEMA
DUGULO
LALCHO
Use modern farming
system
To improved livestock
production
Use fertilizer
To increased crop
production
Construction of
infrastructure example
road, water, health
center
Use construction of dam
Improve productivity
Use small irrigation
access
Use irrigation
Improve water for
irrigation and pure
health center for
livestock
Use of fertilizer
To increased
production and
productivity
Increased
production
productivity of the
area
Use
specialized
livestock
production
Select seed
Family
planning
service
To improve yield
Use short
season crop
To improve
dairy
production
Increased
yield
production
Harvesting a
short period
of time
234
Page 3 of 3

Wereda Disaster
Risk Profile
Data_Collected_Date
January 1900
Region S.N.N.P
Zone SEGEN PEOPLES
Selected Indicator
Community Awareness of Disaster Risk Management System and Actors
Kebele Name
ADIS OLETEMA
Institution 1
Responsibility
Activity
Agriculture
Accessing extension
Improved agricultural production
Institution 2
Responsibility
Activity
Health office
Vaccination
Protect and services for community
Institution 3
Responsibility
Activity
Kebele Name
Education
School feeding
Capacity building
BOLE
Institution 1
Responsibility
Activity
Health center
Awareness creation, diagnosis
Institution 2
Responsibility
Activity
Agriculture office
Awareness creation, use irrigation
Institution 3
Responsibility
Animal health post
Animal vaccination
Activity
National Disaster Risk
Management Comission (NDRMC)
Thursday, July 11, 2019
Wereda ALLE SPECIAL
235
Page 1 of 9

Wereda Disaster
Risk Profile
Data_Collected_Date
January 1900
Region S.N.N.P
Zone SEGEN PEOPLES
Selected Indicator
Community Awareness of Disaster Risk Management System and Actors
Kebele Name
DEGA MASHELE
Institution 1
Responsibility
Activity
Agriculture
Watershed program
Institution 2
Responsibility
Activity
Health office
Vaccination and keep hygiene
Institution 3
Responsibility
Activity
Kebele Name
DELBENA GAMA
Institution 1
Responsibility
Activity
Agriculture
Use irrigation, short season
Digging of dam and sowing of fruits
Institution 2
Responsibility
Activity
Early warning
Relief awareness
Shifting house exposing the disaster
Institution 3
Responsibility
Activity
Health center
Vaccination
Give vaccination
National Disaster Risk
Management Comission (NDRMC)
Thursday, July 11, 2019
Wereda ALLE SPECIAL
236
Page 2 of 9

Wereda Disaster
Risk Profile
Data_Collected_Date
January 1900
Region S.N.N.P
Zone SEGEN PEOPLES
Selected Indicator
Community Awareness of Disaster Risk Management System and Actors
Kebele Name
DIGINTY
Institution 1
Responsibility
Activity
Agriculture
Development agent
Create awareness of disaster using of agricultural input
Institution 2
Responsibility
Activity
Health post
Health extension expert
Mother health, child care and nutrition
Institution 3
Responsibility
Activity
Kebele Name
DUGULO
Institution 1
Responsibility
Activity
Agriculture extension
Create awareness forum
Institution 2
Responsibility
Activity
Institution 3
Responsibility
Activity
National Disaster Risk
Management Comission (NDRMC)
Thursday, July 11, 2019
Wereda ALLE SPECIAL
237
Page 3 of 9

Wereda Disaster
Risk Profile
Data_Collected_Date
January 1900
Region S.N.N.P
Zone SEGEN PEOPLES
Selected Indicator
Community Awareness of Disaster Risk Management System and Actors
Kebele Name
EYANA
Institution 1
Responsibility
Activity
Agriculture office
Supply inputs
Water shade, use the fertilizer input
Institution 2
Responsibility
Activity
NGO/ mercy corps
Prepare nursery site
Natural resource management system
Institution 3
Responsibility
Activity
Kebele Name
School
Teach the community
To build up community capacity and also awareness creation
GERGEMA
Institution 1
Responsibility
Activity
Agriculture
Use short season crops
To increased production and productivity
Institution 2
Responsibility
Activity
Early warning
Create people awareness
To cope and minimize the negative risk
Institution 3
Responsibility
Activity
School
Teach the community
To build human capacity
National Disaster Risk
Management Comission (NDRMC)
Thursday, July 11, 2019
Wereda ALLE SPECIAL
238
Page 4 of 9

Wereda Disaster
Risk Profile
Data_Collected_Date
January 1900
Region S.N.N.P
Zone SEGEN PEOPLES
Selected Indicator
Community Awareness of Disaster Risk Management System and Actors
Kebele Name
GEWADA
Institution 1
Responsibility
Activity
Agriculture office
Disseminate information of early warning
Develop modern agricultural extension
Institution 2
Responsibility
Activity
Health office
Preventing of CHD awareness
Building health post
Institution 3
Responsibility
Activity
Kebele Name
Omo micro finance institute
Facilitate saving institute
Improve saving culture
GOROZE
Institution 1
Responsibility
Activity
agriculture office
Early warning forecast the climate
Facilitate the agriculture inputs
Institution 2
Responsibility
Activity
Health post
Public health
Vaccination, midwifery
Institution 3
Responsibility
Activity
School
Create awareness
Create skilled man power
National Disaster Risk
Management Comission (NDRMC)
Thursday, July 11, 2019
Wereda ALLE SPECIAL
239
Page 5 of 9

Wereda Disaster
Risk Profile
Data_Collected_Date
January 1900
Region S.N.N.P
Zone SEGEN PEOPLES
Selected Indicator
Community Awareness of Disaster Risk Management System and Actors
Kebele Name
GUMA
Institution 1
Responsibility
Activity
Agriculture office
DRM department give early warning information system
Institution 2
Responsibility
Activity
Kebele development agent
Door to door support by creating awareness related with climate change
Institution 3
Responsibility
Kebele health extension
Give first aid and 16 health extension packages expansion
Activity
Kebele Name
KERKERT
Institution 1
Responsibility
Activity
Health post
Keep sanitation and hygiene
To protect human from transmitted disease
Institution 2
Responsibility
Activity
Agriculture
Use short season crops
Important to increased production, productivity
Institution 3
Responsibility
Activity
Early warning
Create people awareness
Important to cope and to minimize the negative risk during and after disaster
National Disaster Risk
Management Comission (NDRMC)
Thursday, July 11, 2019
Wereda ALLE SPECIAL
240
Page 6 of 9

Wereda Disaster
Risk Profile
Data_Collected_Date
January 1900
Region S.N.N.P
Zone SEGEN PEOPLES
Selected Indicator
Community Awareness of Disaster Risk Management System and Actors
Kebele Name
KOLANGO
Institution 1
Responsibility
Activity
Kebele DRM committee
Reduced disaster
Disseminate early warning information
Institution 2
Responsibility
Activity
Wereda agriculture office
Support farmer
Short season crop
Institution 3
Responsibility
Activity
Kebele Name
Health office
To teach the people
Vaccination of child and livestock
LALCHO
Institution 1
Responsibility
Activity
Agriculture office
Improve productivity
Institution 2
Responsibility
Activity
Health office
Improve human health
Institution 3
Responsibility
Activity
National Disaster Risk
Management Comission (NDRMC)
Thursday, July 11, 2019
Wereda ALLE SPECIAL
241
Page 7 of 9
Wereda Disaster
Risk Profile
Data_Collected_Date
January 1900
Region S.N.N.P
Zone SEGEN PEOPLES
Selected Indicator
Community Awareness of Disaster Risk Management System and Actors
Kebele Name
LOKITE
Institution 1
Responsibility
Activity
Agriculture office
Create awareness regarding to climate change
Shifting of the crop sowing season
Institution 2
Responsibility
Activity
Health office
Create awareness regarding to health
Establish the better health care
Institution 3
Responsibility
Activity
Kebele Name
kebele administration
Create the awareness and give measure
Coordinate the community
TSEMEHA
Institution 1
Responsibility
Activity
Health center
awareness creation
Use vacination , keep hygiene
Institution 2
Responsibility
Activity
Agriculture office
Watershed program
Use fertilizer, use modern technology, use irrigation
Institution 3
Responsibility
Activity
National Disaster Risk
Management Comission (NDRMC)
Thursday, July 11, 2019
Wereda ALLE SPECIAL
242
Page 8 of 9
Wereda Disaster
Risk Profile
Data_Collected_Date
January 1900
Region S.N.N.P
Zone SEGEN PEOPLES
Selected Indicator
Community Awareness of Disaster Risk Management System and Actors
Kebele Name
TURUBA
Institution 1
Responsibility
Activity
Kebele DRM committee
Preparing the people to prevent hazard
Select the most vulnerable households
Institution 2
Responsibility
Activity
Wereda agriculture office
DRMFSD early warning system dissemination
Support by SNP and relief
Institution 3
Responsibility
Activity
Health extension experts
Prevention of disease
16 health extension package
National Disaster Risk
Management Comission (NDRMC)
Thursday, July 11, 2019
Wereda ALLE SPECIAL
243
Page 9 of 9
Wereda Disaster
Risk Profile
National Disaster Risk Management
Commission (NDRMC)
Data_Collected_Date
January 1900
Thursday, July 11, 2019
Region S.N.N.P
Zone SEGEN PEOPLES
Wereda ALLE SPECIAL
Selected Indicator
Community Perception of DRM System and Actors - Perception of the community on the effectiveness of DRM
system in helping them to prevent, cope and recover from disasters
KebeleName
Prevention
Coping
Recovery
Overall_Effectiveness
KERKERT
TURUBA
KOLANGO
EYANA
LOKITE
Because institutions
awareness is very necessary
to reduce the effect of
disaster.
Preparation stage some
weakness of agriculture
office
Early warning the disaster
risk management awareness.
Is better effective
Better effective regarding to
increasing drought some
institution many support
many support to our
community in prevention
stage to handle the risk of
the disaster
The wereda agriculture
office stand their
responsible to give relief to
safer child and mother.
None of response and relief
is available due to season
Resist the risk of the
disaster helping by PSNP
and relief.
Prepare recovery action to
habilitate the effect on
community.
Better effective especially
in this year ( 2009 ) loss of
asset is high in other
community due to drought
the effective activities are
done by money institution
to cope the risk.
All institutions are
contributed to recover
from the disaster.
The wereda disaster and risk
management food security
component mostly effective
to availability of aids and
relief to affected
community.
Distributed food and non
food item.
By supplying recovering
inputs like asset building
materials.
In this year recovery
activities like relief aid
of money and food
support is very effective.
Lack of institutional
integration so that for the
future developing
integration.
Lack of fund, topographic
change, road access are
reason the action not
effective.
As our community the
reason of lack of
infrastructure the measure
activities being not effect
over the season.
244
Page 1 of 4

Wereda Disaster
Risk Profile
National Disaster Risk Management
Commission (NDRMC)
Data_Collected_Date
January 1900
Thursday, July 11, 2019
Region S.N.N.P
Zone SEGEN PEOPLES
Wereda ALLE SPECIAL
Selected Indicator
Community Perception of DRM System and Actors - Perception of the community on the effectiveness of DRM
system in helping them to prevent, cope and recover from disasters
KebeleName
Prevention
Coping
Recovery
Overall_Effectiveness
GUMA
GOROZE
DELBENA GAMA
TSEMEHA
ADIS OLETEMA
Moderate effect related with
last ten years.
As perceive that better
effectiveness of the
activities to prevent the
drought
Agriculture create awareness
to the community use
irrigation, fertilizer and fruit
seeds.
No because the disaster is
very high
Supports people/ community
very well and also most
activity are solve/ reduced
the problems.
Better cope measures help
during incident response
and relief work.
It is better to cope the
disaster risk
The wereda agriculture
office give the relief
reduced human suffering
disaster.
Relief to wereda
The distribution of food and
non food activity are not
perfect.
Better effective help to
recover.
In this year recovery
activities are better to
cope example relief
No because of the nature
of climate change.
Lack of infrastructure road,
energy power access etc,
climate change is highly
comes negative effects.
Related with fund is main
reason to fail plan of the
effective risk management
system
The drought repeated year
to year and now increasing
it.
Use short season crop
and fertilizers, use
animal vaccination.
Community sharing each
other and distributed
food and non food items.
The drought is very high,
the kebele is very far from
the wereda and any
infrastructure not available.
Not effective because of/ or
the main reason are lack of
integration and also lack of
skill people.
245
Page 2 of 4

Wereda Disaster
Risk Profile
National Disaster Risk Management
Commission (NDRMC)
Data_Collected_Date
January 1900
Thursday, July 11, 2019
Region S.N.N.P
Zone SEGEN PEOPLES
Wereda ALLE SPECIAL
Selected Indicator
Community Perception of DRM System and Actors - Perception of the community on the effectiveness of DRM
system in helping them to prevent, cope and recover from disasters
KebeleName
GEWADA
DIGINTY
DEGA MASHELE
BOLE
Prevention
If the above institution
responsibilities and activities
are effective practice our
community can preventing
from disasters
When the season of seed is
good the activities of the
institution is good but if it is
bad the activities of the
sector decrease
Partially decrease this effect
Wereda agriculture use short
season crops and modern
technologies.
Coping
Regarding to drought our
communities practiced any
modern agriculture
extension but shortage of
rain we faced the problem.
Some what good but
sometimes not good
The agriculture office
support by relief then
partially reduced the
severity of disaster.
The institution mostly
contribute their own
responsibility.
Recovery
Better effective than
before last year because
of some better recover
activities are prepared
and improved.
Is some good incase of
coping measure giving
relief and PSNP but not
enough.
Feeding of child save the
life, selling and
migrating of people
reduced hazards
The institution create
awareness cooperatively
and resist the drought
disaster of animal
disease.
Overall_Effectiveness
Our agro ecology is one
reason, awareness of the
people, fund and
infrastructure.
If the relief donors fair
distribution of the resource
the active effective but
sometimes the resource
distribution is not fair.
The drought is very hard the
relief/ aids available the
hazard is decreased by this
support, the government in
addition to relief animal
fodder is available.
The drought affected all the
community the resistance of
the community participation
is low especially youth.
246
Page 3 of 4

Wereda Disaster
Risk Profile
National Disaster Risk Management
Commission (NDRMC)
Data_Collected_Date
January 1900
Thursday, July 11, 2019
Region S.N.N.P
Zone SEGEN PEOPLES
Wereda ALLE SPECIAL
Selected Indicator
Community Perception of DRM System and Actors - Perception of the community on the effectiveness of DRM
system in helping them to prevent, cope and recover from disasters
KebeleName
GERGEMA
DUGULO
LALCHO
Prevention
Institutions awareness is very
necessary to reduced the
effect of disaster.
Coping
The wereda agriculture
office stand their
responsible to give relief to
save child and women.
Recovery
All institution are
contributed to recover
from.
Prediction of climate change
accuracy based on each
change
Prepare and plan effective
risk management strategy
Relief, helping in food
supply and PSNP
In our perception the
institution well preventing
and responding.
Partially the institution is
effective.
The community save
their life by the
accessing of relief.
Overall_Effectiveness
The wereda disaster and risk
management and food
security component mostly
effective to availability of
aids and relief to affected
the community.
If the institution stakeholder
of disaster risk management
measure create awareness
for the household the
negative effect of disaster.
The system of the
institution not cooperate
other concerned bodies.
247
Page 4 of 4
Data_Collected_Date
Region S.N.N.P
January 1900
Zone SEGEN PEOPLES
Thursday, July 11, 2019
Wereda ALLE SPECIAL
Selected Indicator
Major Public Interventions Desired - Percentage of households by type of
intervention desired
Major public interventions desired by the community
Degree of Importance for the community
Access to markets
1st
2nd
3rd
0.51
2.59
9.06
Access to roads
0.26
0.00
1.25
Agricultural inputs (fertilizer, improved seeds, etc.)
16.62
10.09
10.62
Better job
27.37
26.22
5.00
Cash transfers/social assistance
6.39
13.83
2.19
Cash-for-work activities (not employment)
0.00
0.29
0.00
Enhance access to schools / School feeding for children
0.77
1.44
2.50
Food-for-work activities
0.51
4.90
10.94
Fuel subsidies
0.00
0.00
0.31
Medical assistance / access to health facilities
0.00
3.75
12.50
Micro-credit programmes
0.77
1.15
5.31
Other
0.00
0.00
9.69
Rental subsidies
3.07
2.31
0.62
School fees for children
0.00
1.44
2.81
Subsidized food
1.28
7.49
1.56
248
Page 1 of 2

Data_Collected_Date
Region S.N.N.P
January 1900
Zone SEGEN PEOPLES
Thursday, July 11, 2019
Wereda ALLE SPECIAL
Selected Indicator
Major Public Interventions Desired - Percentage of households by type of
intervention desired
Major public interventions desired by the community
Degree of Importance for the community
Subsidized health care
1st
2nd
3rd
1.53
3.75
13.44
Supplementary feeding for women and young children
0.77
5.76
5.62
Veterinary facilities
0.00
0.29
1.56
Food aid
40.15
14.70
4.69
249
Page 2 of 2
WDRP Indicators
Other Community Characteristics
250
Wereda Disaster
Risk Profile
Data_Collected_Date
January 1900
Region S.N.N.P
Zone SEGEN PEOPLES
Selected Indicator
Capacity: Community Based Organizations in the Wereda
Name_Of_Organization
Est._Year
Formal/Informal
Kebele Name
Ekub
ADIS OLETEMA
Unknown
Informal
Eder
Kebele Name
Equb
BOLE
Unknown
1997
Informal
Informal
Farmer association
Omo
Kebele Name
Equb
DEGA MASHELE
Eder
Kebele Name DELBENA GAMA
Eder
Kebele Name DIGINTY
Farmer association
Women association
2001
2006
Unknown
Unknown
Unknown
Informal
Formal
Informal
Informal
Informal
Formal
Formal
National Disaster Risk Management
Commission (NDRMC)
Thursday, July 11, 2019
Wereda ALLE SPECIAL
Type of Members
Both
Both
Both male and
female
Farmers
Both male and
female
Activity
To save money and credit
Helping each other
They support each other
Improved seed and credit money
Credit service
Farmer
Women
Selling improved seed, agricultural tools
saving and credit money
251
Page 1 of 4
Wereda Disaster
Risk Profile
Data_Collected_Date
January 1900
National Disaster Risk Management
Commission (NDRMC)
Thursday, July 11, 2019
Region S.N.N.P
Zone SEGEN PEOPLES
Selected Indicator
Capacity: Community Based Organizations in the Wereda
Name_Of_Organization
Est._Year
Formal/Informal
Wereda ALLE SPECIAL
Type of Members
Activity
Omo micro finance institution
Ider
Ikub
Kebele Name DUGULO
Omo micro finance
Kebele Name EYANA
Omo micro finance institute
RUSSACCO
Mercy Corps
Kebele Name
Eder
GERGEMA
Farmer association
Kebele Name GEWADA
Ikub
Omo micro finance institute
Kebele Name GOROZE
2005
2005
2005
2007
2006
2004
1996
2005
Formal
Informal
Informal
PSNP beneficiary
Both
Both
Formal
Farmers
Formal
Formal
Formal
Farmer
Farmers
Farmer
Informal
Informal
Both
Both
Informal
Formal
Self help group
Female group
252
Saving and money
Social interaction
Social interaction
Saving of money
Saving money
Saving money and fire wood
Helping each other during saving and Teff
harvesting technology
Saving money in group
Saving
Page 2 of 4
Wereda Disaster
Risk Profile
Data_Collected_Date
January 1900
National Disaster Risk Management
Commission (NDRMC)
Thursday, July 11, 2019
Region S.N.N.P
Zone SEGEN PEOPLES
Selected Indicator
Capacity: Community Based Organizations in the Wereda
Name_Of_Organization
Est._Year
Formal/Informal
Wereda ALLE SPECIAL
Type of Members
Activity
Ikub
Farmers group
Idir
Kebele Name
Ikub
Idir
Kebele Name
Eder
Equb
Kebele Name
Ikub
Edir
Kebele Name
Eder
Equb
GUMA
KERKERT
KOLANGO
LALCHO
2000
2000
2001
2001
1996
Unknown
Unknown
2000
Unknown
Unknown
Unknown
Informal
Informal
Informal
Farmers
Farmers group
Farmers
Informal
Informal
Informal
Informal
Informal
Informal
Informal
Informal
Farmers
Farmers
Farmer
Farmer
Saving money and other resource to share
the day if incident
Saving money and other resource to share
the day if incident
Saving money and other resource to share
the day if incident
Saving money
Sharing food and money
Helping each other
Helping each other
To save money
To help each other
253
Page 3 of 4
Wereda Disaster
Risk Profile
Data_Collected_Date
January 1900
Region S.N.N.P
Zone SEGEN PEOPLES
Selected Indicator
Capacity: Community Based Organizations in the Wereda
Name_Of_Organization
Est._Year
Formal/Informal
Cooperative association
Kebele Name LOKITE
Idir
Ikub
Kebele Name
Eder
TSEMEHA
Equb
Kebele Name TURUBA
Omo micro finance institution
RUSSACCO
Ikub
2006
2000
2000
Unknown
Unknown
2005
2005
Unknown
Informal
Informal
Informal
Informal
Informal
Formal
Formal
Informal
National Disaster Risk Management
Commission (NDRMC)
Thursday, July 11, 2019
Wereda ALLE SPECIAL
Type of Members
40
Farmers
Farmers
Both
Both
Farmers
Farmers
Self help groups
Activity
Selling of oil and sugar
Saving money
Saving money
To helping each other
To save money and credit money
Saving money
Potters association, cooperative association
254
Page 4 of 4
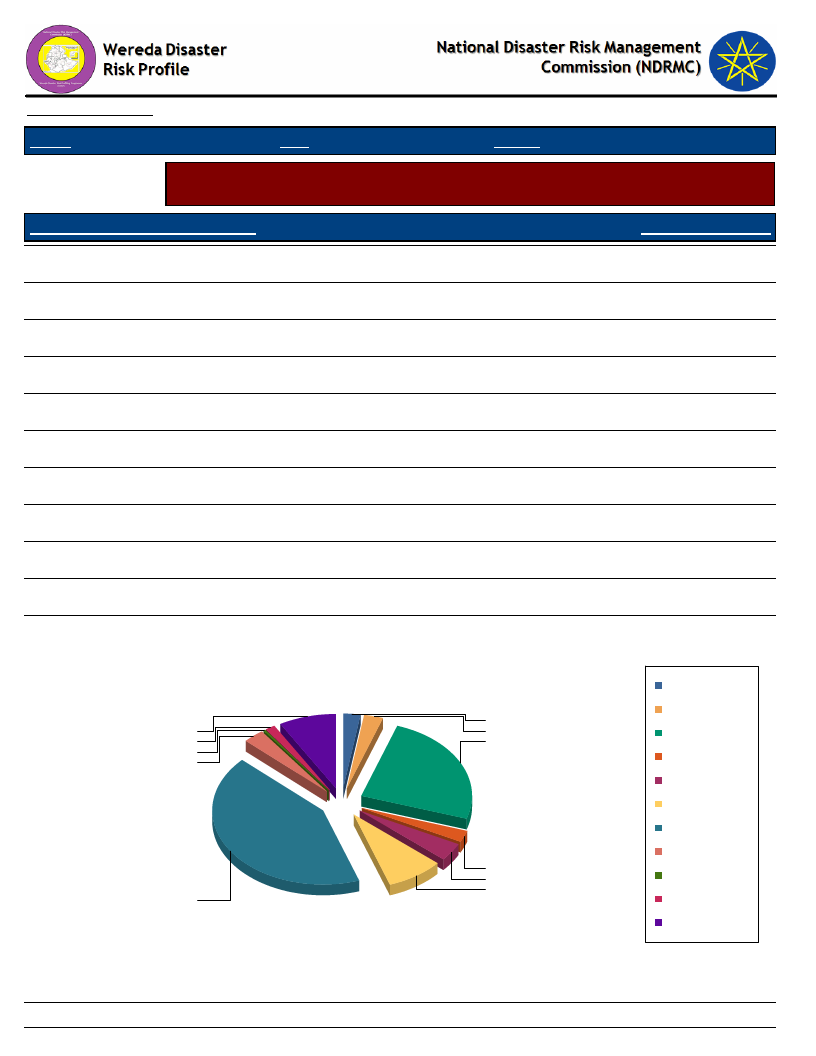
Data_Collected_Date
Region S.N.N.P
January 1900
Zone SEGEN PEOPLES
Thursday, July 11, 2019
Wereda ALLE SPECIAL
Selected Indicator
Supporting Agencies against Disasters - Percentage of households by supporting
institutions to handle or recover from disaster damages
Supporting Agencies Against Disasters
Response_Percentage
National or local authorities
42.31
International NGOs (e.g. UN organizations, ICRC, etc.)
3.85
Local NGOs
8.21
Family members in the same community
2.56
Friends and neighbors in the same community
24.62
Family members outside the community
2.82
Friends outside the community
2.56
Support via contacts working for the authorities
8.21
Support via contacts working for NGOs
1.54
Religious sources such as the mosque
0.26
None
3.08
Supporting Agencies Against Disasters
2.6
8.2
2.8
1.5
24.6
0.3
3.1
2.6
3.9
8.2
42.3
Family members in the
same community
Family members outside
the community
Friends and neighbors in
the same community
Friends outside the
community
International NGOs (e.g.
UN organizations, ICRC,
etc.)
Local NGOs
National or local
authorities
None
Religious sources such
as the mosque
Support via contacts
working for NGOs
Support via contacts
working for the
authorities
255
Page 1 of 1
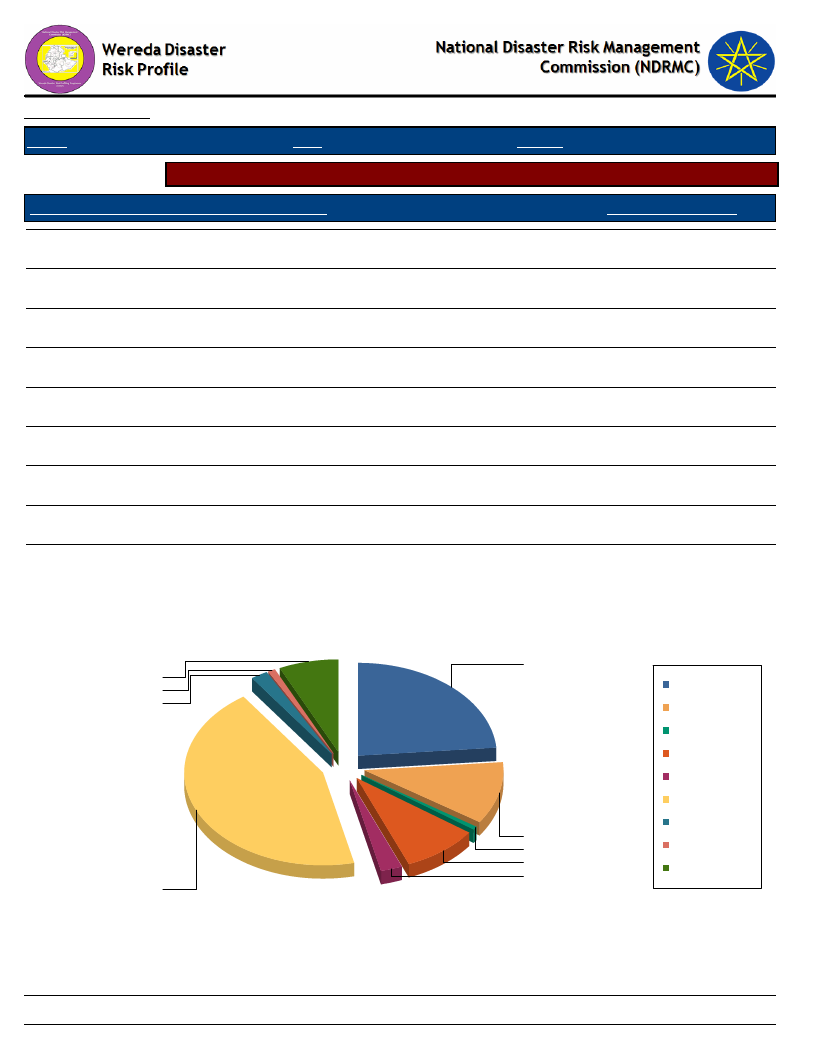
Data_Collected_Date
Region S.N.N.P
January 1900
Zone
SEGEN PEOPLES
Thursday, July 11, 2019
Wereda ALLE SPECIAL
Selected Indicator
Types of support received by households during disasters
Type of Support Provided By Supporting Agencies
Response_Percentage
Emergency aid (food, water, shelter, etc.)
43.85
Capital for re-construction of house and property
8.97
New house
0.77
Access to loan for re-construction
10.77
Access to capital or loan for adaptation/protection measures
23.59
Assets such as livestock replenishment
0.51
Other
6.92
DK
2.56
NA
2.05
Type of Support Provided By Supporting Agencies
24
7
Access to capital or loan
for adaptation/protection
1
measures
2
Access to loan for
re-construction
Assets such as livestock
replenishment
Capital for
re-construction of house
and property
DK
Emergency aid (food,
water, shelter, etc.)
NA
11
1
New house
9
Other
3
44
256
Page 1 of 1
Wereda Disaster
Risk Profile
Data_Collected_Date
January 1900
National Disaster Risk Management
Commission (NDRMC)
Thursday, July 11, 2019
Region S.N.N.P
Zone SEGEN PEOPLES
Wereda ALLE SPECIAL
Selected Indicator
Government Actors in the Field of Disaster Risk Management - Government actors and their activities in the field
of Disaster Risk Managements
Government Institution
Road Transport Office
Activity
Description
Construction of local road
Preparedness the disaster during the incident easily accessing the material to the affected people
Activity
Description
Expansion of new road
Expanding of road un reaching road by community participation
Activity
Description
Activity
Description
Access of transport
To reduced shortage of transport
Government Institution
Wereda Administration Office
Activity
Giving training and awareness creation
Description
Activity
Description
Before the disaster occur ( happened ) the above responsive employer must train and aware the people how to prepare, prevent, giving
response and taking adaptive measure
Facilitating logistic
Facilitating crop pesticide and disease medicine
Activity
Description
Activity
Description
Facilitating relief for affected people
The above responsible employer facilitate relief and saving by communicating with government and NGO.
257
Page 1 of 4

Wereda Disaster
Risk Profile
Data_Collected_Date
January 1900
National Disaster Risk Management
Commission (NDRMC)
Thursday, July 11, 2019
Region S.N.N.P
Zone SEGEN PEOPLES
Wereda ALLE SPECIAL
Selected Indicator
Government Actors in the Field of Disaster Risk Management - Government actors and their activities in the field
of Disaster Risk Managements
Government Institution
Wereda Agriculture Office
Activity
Description
Awareness creation
awareness creation how to prevention, preparedness, response and adaptive measures etc
Activity
Description
Access of certified seeds
To improve productivity and short season seeds
Activity
Description
Activity
Description
Access relief
Asking of concerned bodies to disaster risk management system
Government Institution
Wereda Education Office
Activity
Description
Data and site selection, input supply
Select household with insecurity, students with shortage of income
Activity
Description
Select focal person
Monitoring and evaluation
Activity
Description
Activity
Description
258
Page 2 of 4

Wereda Disaster
Risk Profile
Data_Collected_Date
January 1900
National Disaster Risk Management
Commission (NDRMC)
Thursday, July 11, 2019
Region S.N.N.P
Zone SEGEN PEOPLES
Wereda ALLE SPECIAL
Selected Indicator
Government Actors in the Field of Disaster Risk Management - Government actors and their activities in the field
of Disaster Risk Managements
Government Institution
Wereda Environmental Protection and Land Administration Office
Activity
Description
Seedling production and plantation
Nursery foundation and contract worker
Activity
Description
Forest demark and registration
Natural and religious forest identification, registration an demarcation
Activity
Developing management
Description
Activity
Description
Expanding drugs disposal system facilitation
Government Institution
Wereda Health Office
Activity
Description
Vaccination
To reduced transmission of disease
Activity
Description
Create awareness
How to control the disease and effects
Activity
Description
Activity
Description
Treatment
Save the life
259
Page 3 of 4
Wereda Disaster
Risk Profile
Data_Collected_Date
January 1900
National Disaster Risk Management
Commission (NDRMC)
Thursday, July 11, 2019
Region S.N.N.P
Zone SEGEN PEOPLES
Wereda ALLE SPECIAL
Selected Indicator
Government Actors in the Field of Disaster Risk Management - Government actors and their activities in the field
of Disaster Risk Managements
Government Institution
Wereda Water Resource Development Office
Activity
Description
Water line extension
Give first the most vulnerable parts of the wereda for disaster to construct the water live extension
Activity
Description
Identify the most vulnerable parts of the wereda and source of the water
It is the first step of the prevention and response to the risk measure
Activity
Description
Activity
Description
260
Page 4 of 4
Data_Collected_Date
January 1900
Thursday, July 11, 2019
Region S.N.N.P
Zone SEGEN PEOPLES
Wereda ALLE SPECIAL
Selected
Indicator
Non-Government Actors in the Field of Disaster Risk Management - Non-government
actors and their activities in the field of Disaster Risk Management
Non Governmental Actors
in the Wereda
Activities
AMREF (African Medical
and research Foundation)
MERCY CORPS
Improve the mothers and children health
Create job opportunity to the community and environmental protection
NGOs
Water spring construction and distribution
Identify water spring gravity for distribution
Saving life by giving relief ( money ) grain
Save The Children
The child and women health protection
Save the mothers and children
Give shallow wall and borehole service
261
Page 1 of 1
Wereda Disaster Risk
Profile
Data_Collected_Date
January 1900
National Disaster Risk Management
Commission (NDRMC)
July 11, 2019
Region S.N.N.P
Selected Indicator:
Zone
SEGEN PEOPLES
Interventions: Community Suggestions to Development Actors
Wereda ALLE SPECIAL
Kebele Name
Type Of Disaster 1
Early Warning Indicator
KERKERT
Drought
Moon round cover with red color, star direction
Type Of Disaster 3
Early Warning Indicator
Preparedness Measure
Awareness creation , saving, wise use of money
Preparedness Measure
Type Of Disaster 2
Early Warning Indicator
Type Of Disaster 4
Early Warning Indicator
Preparedness Measure
Preparedness Measure
Kebele Name
Type Of Disaster 1
Early Warning Indicator
Preparedness Measure
Type Of Disaster 2
Early Warning Indicator
Preparedness Measure
TURUBA
Drought
Position of stars and its shine
Saving foods and money
Type Of Disaster 3
Early Warning Indicator
Preparedness Measure
Type Of Disaster 4
Early Warning Indicator
Preparedness Measure
262
Page 1 of 9

Region S.N.N.P
Selected Indicator:
Zone
SEGEN PEOPLES
Interventions: Community Suggestions to Development Actors
Wereda ALLE SPECIAL
Kebele Name
Type Of Disaster 1
Early Warning Indicator
KOLANGO
Drought
star come late on the sky balance of moon
Type Of Disaster 3
Early Warning Indicator
Crop disease
Direction of sun
Preparedness Measure
Type Of Disaster 2
Early Warning Indicator
Flood
Color of moon red
Preparedness Measure
Type Of Disaster 4
Early Warning Indicator
Preparedness Measure
Preparedness Measure
Kebele Name
Type Of Disaster 1
Early Warning Indicator
Preparedness Measure
Type Of Disaster 2
Early Warning Indicator
Preparedness Measure
EYANA
Drought
Sun and moon as well as stars
Prepare trace construction and water harvest
Type Of Disaster 3
Early Warning Indicator
Preparedness Measure
Type Of Disaster 4
Early Warning Indicator
Preparedness Measure
263
Page 2 of 9

Region S.N.N.P
Selected Indicator:
Zone
SEGEN PEOPLES
Interventions: Community Suggestions to Development Actors
Wereda ALLE SPECIAL
Kebele Name
Type Of Disaster 1
Early Warning Indicator
LOKITE
Drought
Late come of rain
Type Of Disaster 3
Early Warning Indicator
Preparedness Measure
Ready to change the crop sowing season
Preparedness Measure
Type Of Disaster 2
Early Warning Indicator
Type Of Disaster 4
Early Warning Indicator
Preparedness Measure
Preparedness Measure
Kebele Name
Type Of Disaster 1
Early Warning Indicator
Preparedness Measure
Type Of Disaster 2
Early Warning Indicator
Preparedness Measure
GUMA
Drought
Star movement
Preparation of land and livestock resource
protection and conservation activities
Type Of Disaster 3
Early Warning Indicator
Preparedness Measure
Type Of Disaster 4
Early Warning Indicator
Preparedness Measure
264
Page 3 of 9

Region S.N.N.P
Selected Indicator:
Zone
SEGEN PEOPLES
Interventions: Community Suggestions to Development Actors
Wereda ALLE SPECIAL
Kebele Name
Type Of Disaster 1
Early Warning Indicator
GOROZE
Drought
Position of moon
Type Of Disaster 3
Early Warning Indicator
Preparedness Measure
Prepare water harvesting
Preparedness Measure
Type Of Disaster 2
Early Warning Indicator
Type Of Disaster 4
Early Warning Indicator
Preparedness Measure
Preparedness Measure
Kebele Name
Type Of Disaster 1
Early Warning Indicator
Preparedness Measure
Type Of Disaster 2
Early Warning Indicator
Preparedness Measure
DELBENA GAMA
Drought
Star direction
Select crop sowing
Pests
Rain
Community buy chemicals
Type Of Disaster 3
Early Warning Indicator
Preparedness Measure
Type Of Disaster 4
Early Warning Indicator
Preparedness Measure
265
Page 4 of 9

Region S.N.N.P
Selected Indicator:
Zone
SEGEN PEOPLES
Interventions: Community Suggestions to Development Actors
Wereda ALLE SPECIAL
Kebele Name
Type Of Disaster 1
Early Warning Indicator
TSEMEHA
Drought
Star direction,
Type Of Disaster 3
Early Warning Indicator
Preparedness Measure
Type Of Disaster 2
Use selected crops and saving, it is bad season to
the crop
Preparedness Measure
Type Of Disaster 4
Early Warning Indicator
Early Warning Indicator
Preparedness Measure
Preparedness Measure
Kebele Name
Type Of Disaster 1
Early Warning Indicator
Preparedness Measure
Type Of Disaster 2
Early Warning Indicator
Preparedness Measure
ADIS OLETEMA
Drought
Moon covering red color
Saving and harvesting fodder
Type Of Disaster 3
Early Warning Indicator
Preparedness Measure
Type Of Disaster 4
Early Warning Indicator
Preparedness Measure
266
Page 5 of 9

Region S.N.N.P
Selected Indicator:
Zone
SEGEN PEOPLES
Interventions: Community Suggestions to Development Actors
Wereda ALLE SPECIAL
Kebele Name
Type Of Disaster 1
Early Warning Indicator
GEWADA
Drought
Moon inverted shape, movement of star
Type Of Disaster 3
Early Warning Indicator
Preparedness Measure
Sowing short season crops, preparing farm land
Preparedness Measure
Type Of Disaster 2
Early Warning Indicator
Type Of Disaster 4
Early Warning Indicator
Preparedness Measure
Preparedness Measure
Kebele Name
Type Of Disaster 1
Early Warning Indicator
Preparedness Measure
Type Of Disaster 2
Early Warning Indicator
Preparedness Measure
DIGINTY
Drought
Direction and show of star and sun stars and sun
as well as moon
Saving food and money
Flood
Moon, color of moon red
Prepare terrace in farm land
Type Of Disaster 3
Early Warning Indicator
Preparedness Measure
Type Of Disaster 4
Early Warning Indicator
Preparedness Measure
Disease of livestock
Highly fall of rain
Vaccination and migrate to lowland
267
Page 6 of 9

Region S.N.N.P
Selected Indicator:
Kebele Name
Type Of Disaster 1
Zone
SEGEN PEOPLES
Interventions: Community Suggestions to Development Actors
DEGA MASHELE
Type Of Disaster 3
Wereda ALLE SPECIAL
Early Warning Indicator
Early Warning Indicator
Preparedness Measure
Preparedness Measure
Type Of Disaster 2
Early Warning Indicator
Type Of Disaster 4
Early Warning Indicator
Preparedness Measure
Preparedness Measure
Kebele Name
Type Of Disaster 1
Early Warning Indicator
Preparedness Measure
Type Of Disaster 2
Early Warning Indicator
Preparedness Measure
BOLE
Drought
Direction of star ( two stars before and after
onset )
Wise use of asset
Type Of Disaster 3
Early Warning Indicator
Preparedness Measure
Type Of Disaster 4
Early Warning Indicator
Preparedness Measure
268
Page 7 of 9
Region S.N.N.P
Selected Indicator:
Zone
SEGEN PEOPLES
Interventions: Community Suggestions to Development Actors
Wereda ALLE SPECIAL
Kebele Name
Type Of Disaster 1
Early Warning Indicator
GERGEMA
Drought
2 star direction
Type Of Disaster 3
Early Warning Indicator
Preparedness Measure
Use short season crop and saving
Preparedness Measure
Type Of Disaster 2
Early Warning Indicator
Type Of Disaster 4
Early Warning Indicator
Preparedness Measure
Preparedness Measure
Kebele Name
Type Of Disaster 1
Early Warning Indicator
Preparedness Measure
Type Of Disaster 2
Early Warning Indicator
Preparedness Measure
DUGULO
Drought
Position of stars , moon white color, born of moon
Type Of Disaster 3
Early Warning Indicator
Preparedness Measure
Type Of Disaster 4
Early Warning Indicator
Preparedness Measure
269
Page 8 of 9

Region S.N.N.P
Selected Indicator:
Zone
SEGEN PEOPLES
Interventions: Community Suggestions to Development Actors
Wereda ALLE SPECIAL
Kebele Name
Type Of Disaster 1
Early Warning Indicator
LALCHO
Drought
Direction of moon and star
Type Of Disaster 3
Early Warning Indicator
Preparedness Measure
Wise use of assets
Preparedness Measure
Type Of Disaster 2
Early Warning Indicator
Preparedness Measure
Flood
Sunshine ( January - March)
Sowing short season crop
Type Of Disaster 4
Early Warning Indicator
Preparedness Measure
270
Page 9 of 9
Wereda Disaster Risk
Profile
Data_Collected_Date
Region S.N.N.P
January 1900
Zone
SEGEN PEOPLES
National Disaster Risk Management
Commission (NDRMC)
Thursday, July 11, 2019
Wereda ALLE SPECIAL
Selected Indicator
Wereda Strengths, weaknesses, opportunites and treats (SWOT) Analysis
Kebele Name
KERKERT
Strength
- High social interaction
- Helping each other
- Work cooperatively
- High social interaction
TURUBA
KOLANGO
- Social interaction,
traditional early warning
system
- High motivation to
reduced the disaster
- High social interaction,
saving of resource, literate
people, electric power
- High youth s
participation
Weakness
- Illiteracy
- Lack of awareness
- Lack of animal vaccination
- Youth participation is
week
- Illiteracy, lack of
awareness, agro ecology, size
of farm land
- Use of long season crop ,
use of rain fed farm,
deforestation increased,
fragmentation of farm land
- Lack of awareness disaster
risk management, lack of
climate change
- Depending on government
Opportunity
- Road ( local road access),
river
- Improved seed access
- Availability of credit for
animals fattening
- Availability of micro
finance/ credit
- Ponds, road construction,
using of fruits, PSNP and relief
- Seedling problem
- Construction health center,
road, school, wereda
administration center
- Water ( river ) resource
Threat
- drought
- Shortage of rainfall
- Animal disease vector
born disease due to
climate change
- lack of skill
- Deforestation, out break
of new disaster, lack of
funding, phase-out of PSNP
4
- Damage of water pipe,
shortage of cut of rainfall,
rainfall, change of climate
- Climate change, out
break new disaster like
water born disease, lack of
funding
- Lack of skill
271
Page 1 of 5

Wereda Disaster Risk
Profile
Data_Collected_Date
Region S.N.N.P
January 1900
Zone
SEGEN PEOPLES
National Disaster Risk Management
Commission (NDRMC)
Thursday, July 11, 2019
Wereda ALLE SPECIAL
Selected Indicator
Wereda Strengths, weaknesses, opportunites and treats (SWOT) Analysis
Kebele Name
EYANA
LOKITE
GUMA
Strength
- Road agro ecology, social
interaction
- Local of knowledge of
water resource
management
- High youth participation
- Culture of travelling of
farm land and using short
season crop
- Social interaction high,
wise use of resource, like
livestock crop produce
- Delimitation of water
shade and prevention of
natural resource
- High social interaction
- High social interaction
- Agro ecology is good
Weakness
- Lack of awareness, lack of
water and rain, illiteracy /
lack of skill man power
- Lack of people centered
early warning system
- Depending on government
- lack of problem regarding
to irrigation, lack of disaster
risk management
- Backwardness
- Youth participation is
weak
- Lack of awareness,
illiteracy of poor
infrastructure
- Lack of skill
Opportunity
- Road construction, irrigation
water
- Access to agriculture
extension service like improved
seed and fertilizer
- Electricity access for job
opportunity
- School, health post, forest
- Local knowledge
- Availability of micro
finance/ credit
- Road construction, source of
energy, near to wereda
- Livestock production
Threat
- lack of fund, shortage of
water
- Erratic rainfall /
insufficient rainfall for
crops production
- Small trade enterprise
are priceless
- Climate change, death of
livestock, phase out of
PSNP 4
- Shortage of relief
increased severity of
disaster year to year
- Poor governmental
management
- Climate change,
reduction of number of the
livestock
- Out break of new
livestock disease, lack of
fund
272
Page 2 of 5

Wereda Disaster Risk
Profile
Data_Collected_Date
Region S.N.N.P
January 1900
Zone
SEGEN PEOPLES
National Disaster Risk Management
Commission (NDRMC)
Thursday, July 11, 2019
Wereda ALLE SPECIAL
Selected Indicator
Wereda Strengths, weaknesses, opportunites and treats (SWOT) Analysis
Kebele Name
GOROZE
DELBENA GAMA
TSEMEHA
Strength
- Implement of policy, high
social interaction,
vaccination
- Using agricultural inputs
- High social interaction
- Literate people
- Indigenous knowledge
- High social interaction
- Use fertilizers
- Work cooperatively
- Public work actively
participation
ADIS OLETEMA
- High social interaction
- High motivation to
reduced disaster
- Local knowledge of water
resources management
Weakness
- Lack of awareness,
illiteracy, using long season
crops, unpunctuality on time
of the meeting
- Youth participation is weak
- weak social interaction
- Weak protection of natural
resource management
- Lack of awareness
- Illiteracy
- Lack of animal vaccination
- Depend on government
- Lack of awareness
- Lack of natural resources
management increased
deforestation
- Lack of early warning
system
Opportunity
- Health post, school, road
construction, farmers training
center
- Availability of micro finance
credit
- Road access, mobile network
- Support NGO
- Road ( local road access)
- Access of improved seeds
- Availability of the credit for
animal fattening
- Including kebele with safety
net program
- Road access
- Agricultural office are
preparation of seedling
- Access improved seed and
fertilizer
Threat
- Effect of climate change,
loss of asset, phase-out of
PSNP, access of input
supply
- Lack of skill
- Increased severity of
disaster
- Severity of landslide
- Drought
- Shortage of rainfall
- Animal disease vector
born disease due to
climate change
- Excluding productive
safety net program
- Most of the time erosion
is threat in the area
- Sowing of high flood
- Erratic rainfall ( for crop
production )
273
Page 3 of 5

Wereda Disaster Risk
Profile
Data_Collected_Date
Region S.N.N.P
January 1900
Zone
SEGEN PEOPLES
National Disaster Risk Management
Commission (NDRMC)
Thursday, July 11, 2019
Wereda ALLE SPECIAL
Selected Indicator
Wereda Strengths, weaknesses, opportunites and treats (SWOT) Analysis
Kebele Name
GEWADA
DIGINTY
DEGA MASHELE
BOLE
Strength
- High social interaction,
literacy, shortage of food
- High motivation to
reduced the disaster
- High social interaction
- Add others
- High social interaction
- High social interaction
- Indigenous knowledge
- High social interaction
- Local knowledge of water
resource management
- High social interaction
- High social interaction
using fertilizers
- High social worker
community
Weakness
- Lack of awareness due to
disaster, no vaccination,
dryness of kebele
- Lack of natural resource
management, over grazing
grass land
- Backwardness
- Illiteracy, lack of
awareness about disaster and
early warning, lack of road
- Lack of marketing system
- Weak protection of
Natural resource
management
- Lack of awareness
- Lack of people centered
early warning system
- Illiteracy , social problem
lack of awareness
- Illiteracy people
- Market communication gap
Opportunity
- electric power and market,
road and dam construction,
option of irrigation, school,
health center
- Agriculture and natural
resources development office
are supporting farmer by
seedling preparation
- Local knowledge
- Forest, livestock
- Road access
- NGO activity support
government activity support
- Local road construction
- Access to agricultural
extension services ( improve
seed )
- Supporting NGO and
governmental activity
- Access of improved seed
- Road access
Threat
- Lack of funding, out
break of new disease,
shortage of pasture,
deforestation
- Severity of high flood
- Increased severity of
disaster year to year
- Lack of funding , land
slide due to deforestation
- Production and
productivity may be
priceless
- Increased erosion in the
area.
- Shortage of rain
- Erratic rainfall
insufficient rainfall
- Disaster increased year
to year
- Shortage of rainfall
- Market price may tell
because of road access
274
Page 4 of 5

Wereda Disaster Risk
Profile
Data_Collected_Date
Region S.N.N.P
January 1900
Zone
SEGEN PEOPLES
National Disaster Risk Management
Commission (NDRMC)
Thursday, July 11, 2019
Wereda ALLE SPECIAL
Selected Indicator
Wereda Strengths, weaknesses, opportunites and treats (SWOT) Analysis
Kebele Name
GERGEMA
DUGULO
LALCHO
Strength
- High social interaction
- Helping each other
- High social interaction
- High social interaction,
forest, agro ecology
- High social interaction
Weakness
- Low awareness
- Lack of awareness
- Youth s participation is
weak
- Lack of awareness,
illiteracy, deforestation
- Depend on nature
- Illiteracy
- Lack of awareness
Opportunity
- Tree of Moringa
- Improved seed access
- Availability of micro
finance/ credit
- School, health post, road
construction
- Road
Threat
- Relief of food
- Shortage of rainfall
- Lack of skill
- Out break of new
disease, migration, phase
out of PSNP and relief
- lack of funding
275
Page 5 of 5