


NATIONAL
DISASTER RISK MANAGEMENT COMMISSION
(NDRMC)
WEREDA DISASTER RISK PROFILE (WDRP)
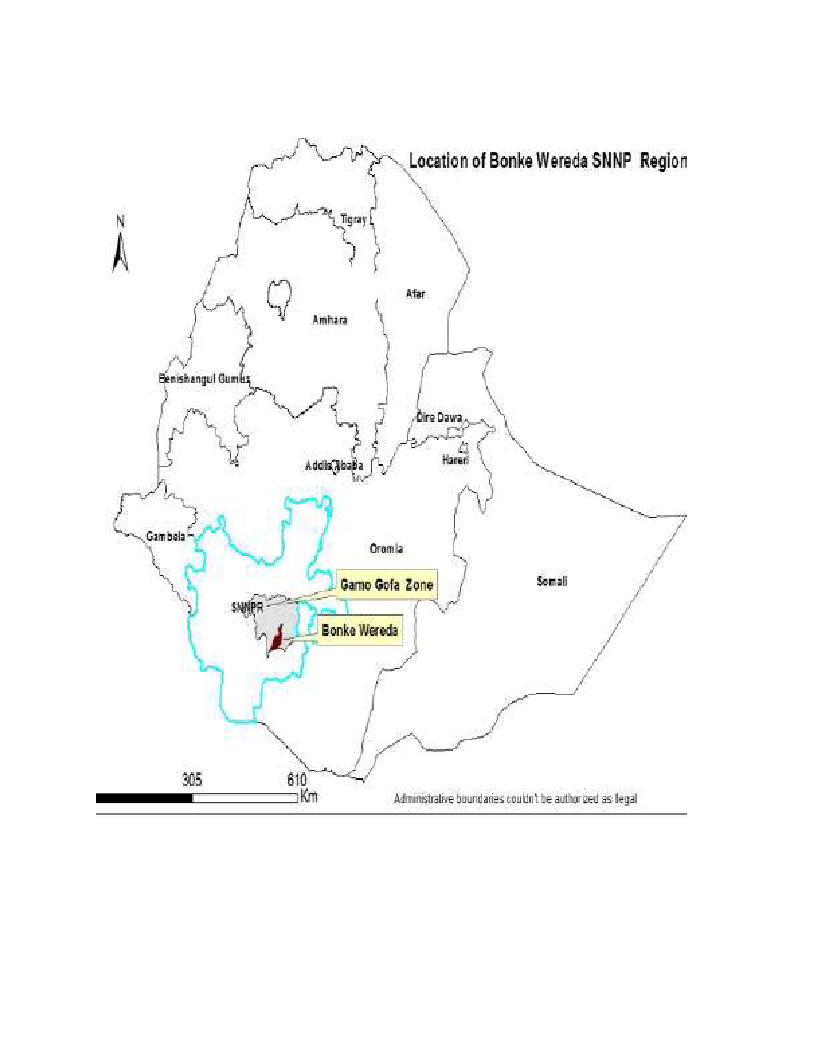
REGION: SNNP
ZONE: GAMO
WEREDA: BONKE
December, 2020
Addis Ababa

About the National Disaster Risk Management Commission (NDRMC)
The National Disaster Risk Management Commission (NDRMC) was reestablished in
December 2015 and recognized by an act of Council of Ministers (Regulation No.
363/2015) as an autonomous Federal Government office mandated to conduct
appropriate activities for the comprehensive implementation and realization of
the objectives of the National Disaster Risk Management Policy and Strategy and
to coordinate, monitor and provide appropriate support with respect to activities
carried out by the lead sector institutions.
Address: Kirkos Sub-city Behind Dembel City Center, Addis Ababa, Ethiopia.
P.O.Box: 5686
Tele: 0115524259/4272
Website: www.dppc.gov.et
© 2020 National Disaster Risk Management Commission. All rights reserved
Printed in Addis Ababa, Ethiopia.
Citation- This Document May be Cited as Follows:
National Disaster Risk Management Commission (2020), Bonke Woreda Disaster
Risk Profile, Addis Ababa, Ethiopia.

PREFACE
Ethiopia is well aware of the impact that disasters can have on the
development goals that we are rigorously pursuing through our
Growth and Transformation Plan II. With this recognition we
started a paradigm shift a few years ago, largely triggered by the
revised National Policy and Strategy on Disaster Risk Management.
To make the DRM programme implementation in the country well-informed, a
comprehensive information management system is required. We have been
undertaking a comprehensive risk assessment exercise under which Disaster Risk
Profiles are being prepared for each district and at sub-district levels in the country.
This Wereda Disaster Risk Profile establishes an extensive database on disaster risk
elements that will help decision makers at all levels to be better informed at
community and Wereda level about the characteristics of potential hazards, their
potential exposure, vulnerabilities of communities, capacities and that can also be an
input for Wereda Disaster Risk Reduction Plans and area specific early warning tools.
Wereda Disaster Risk Profiles developed are publically available here for the use of all
development partners and government sectors at all levels. Also, other data sources
of NDRMC, such as Desinventar, Livelihood Baseline and the Early Warning information
will be integrated and harmonized with this Information Management System.
Finally, we need to acknowledge the support of partners who have funded this
programme and we also look for the support of donors and all development partners
in order to achieve the ambitious indicators of this risk information and providing
every district with the disaster risk profile and their respective risk-informed plans.
H.E. Ato Mitiku Kassa
Commissioner
National Disaster Risk Management Commission (NDRMC)
The Federal Democratic Republic of Ethiopia (FDRE)

PREFACE
Woreda Disaster Risk Profiling (WDRP) is a government owned
programme undertaken by the National Disaster Risk
Management Commission (NDRMC) in collaboration with
regional DRM offices and development partners to provide
baseline information for disaster risk management practices
and activities in the country. The programme is designed by
taking into account the experiences gained from the implementation of pervious
strategies and actions like the Hygo Framework for Action (2000-2015) and the Sendai
Framework for Disaster Risk Reduction (2015-2030).
WDRP is composed of diversified indicators including hazard related issues, crop and
livestock production, landholding and environmental issues, human and livestock
health issues, education and social issues at wereda and kebele level. It provides
basic and detailed indicators with both quantitative and qualitative information which
obtained from both primary and secondary data sources.
Moreover, two pages summary of profiles is also prepared to help users easily
understand WDRP results for each wereda without going into detail for all indicators.
In addition to this booklet, developed profiles are uploaded on WDRP website
(http://profile.ndrmc.gov.et) to be viewed by all users; we encourage all DRM actors
at all levels to use this profile as baseline information for all DRM initiatives.
This WDRP booklet was produced through exemplary collaboration of all concerned
bodies and I would like to give my deepest gratitude to all who directly or indirectly
contribute for the success of the programme particularly for data enumerators and
supervisors, data encoders and profile development teams, consultants and advisors,
partner ministries and all DRM stakeholders.
Abraham Abebe
Director
Disaster Risk Reduction and Rehabilitation Directorate (DRRRD)
National Disaster Risk Management Commission (NDRMC)
Contents
No. Indicator Name
Page
Wereda Location
I
Preface
II
Wereda Location in Ethiopian Map
III
WDRP Methodology
VI
Summary Profile
Hazard Related Characteristics
1
1. Biological Hazards of the Wereda
2
2. Geological Hazards of the Wereda
3
3. Hydro Metrological Hazards of the Wereda
4
4. Socio Economic Hazards of the Wereda
5
5. Technological Hazards of the Wereda
6
6. Disaster Characteristics By Kebele
7
7. Hazards: Conflict as an Issue
25
8.
Hazard Situation During Last Disaster - Characteristics of most recent disaster that
affected the community
27
9. Frequency of Disaster Occurrence
32
10. Household Exposure to Hazards
33
11. Months of Occurrence of Frequent Disasters
34
Conflicts: Perception of households on conflict issues - Is conflict an issue in this
12. community?
35
Conflicts: Perception of households on conflict issues - Who do you turn to in case
13. of a conflict?
36
14. Losses from Disasters - Losses from all disasters (household response in %)
37
15. Losses from Disasters - Main Losses by Type of Disasters (household response in %) 38
No. Indicator Name
Losses from Disasters - Secondary Losses by Type of Disasters (household response
16. in %)
17. Seasonal Calendar for Hazards, Activities and Income Level By Kebele
Page
41
44
Infrastructure Access Characteristics
73
Physical Vulnerability: Access to Roads & Urban Centres - Households access to
18. road and urban centre
74
Physical Vulnerability: Access to Electricity - Households’ access and utilization of
19. electricity
75
20. Physical Vulnerability: Type of Dwelling Units - Households’ type of dwelling houses 76
Socio Demographic Characteristics
77
Economic Vulnerability: Level of Migration - Migration level and its characteristics
21. by Kebele
78
Economic Vulnerability: Household Migration - Household migration and reason for
22. migration
81
Economic Vulnerability: Household Migration - Disasters as a triggering factor for
23. migration (households response in %)
82
24. Demography: Population Structure
83
25. Demography: Population Trends and Ethnic Groups
86
Social Vulnerability: Household Demographic Characteristics - Demographic
26. characteristics of households
89
Social Vulnerability: Level of Educational Attainment - Education status of
27. household members
89
Social Vulnerability: Gender Parity - Gender parity in education level (7+ years)
28. and household heading
91
Environmental Characteristics
92
Environmental Situation: Environmental Problems - Major environmental problems
29. by Kebele
93
Environmental Situation: General Land Quality - Perceptions of the community
30. on changes in the general quality of land over a decade
95
No. Indicator Name
Page
Environmental Situation: Changes in Landscape - Changes observed by the
31. community on landscape and the problems due to the changes
97
32.
Environmental Situation: Land-Use other than crop production - Types of land use
other than crop production across Kebeles
99
33.
Environmental Situation: Deforestation - Observed changes over levels of
deforestation by the community and its problems
101
Environmental Situation: Natural Resources Availability - Natural resources
34. available and changes observed by the community
103
Environmental Situation: Rainfall & Temperature - Observed changes on rainfall
35. and temperature by the community over the last decade
118
36. Environmental Situation: Reasons for Environmental Changes
121
Environmental Situation: Soil Erosion - Observed changes on levels of soil erosion
37. by the community
123
Livelihood, Occupation and Source of food
125
Economic Vulnerability: Major Occupational Categories - Major categories of
38. occupation and percent of population engaged in the occupation by Kebele
126
Economic Vulnerability: Livelihoods - Households important sources of
39. livelihood (response in %)
129
Economic Vulnerability: Occupational Categories - Percent of population above 15
40. years age by occupation categories
131
41.
Economic Vulnerability: Sources of Food - Households source for different food
items (response in %)
132
Crop Production
134
Hazards: Change in Crop Damages - Proportion of total crop damage (percentage
42. response by households)
135
Hazards: Change in Crop Damages - Major reasons for crop damage (percentage
43. response by households)
136
Hazards: Change in Crop Damages - Proportion of Damage for Major Crops
44. (percentage response by households)
137
Hazards: Change in Crop Damages - Reasons for Damage of Major Crops
45. (percentage response by households)
139
No. Indicator Name
Agricultural Situation: Change in Crops Grown - Five major crops grown by
46. proportion of total cultivated land
47.
Agricultural Situation: Access to Extension - Perception of the community on
Access to Agricultural extension Services
Page
142
151
48. Economic Vulnerability: Crops Grown - Types of crops grown by households
153
49.
Economic Vulnerability: Crops Grown - Proportion of households by amount of yield
of major crops (last year)
155
50.
Economic Vulnerability: Crops Grown - Proportion of households by amount of yield
of major crops (Five years ago)
157
51. Economic Vulnerability: Land Ownership and Quality - Landownership of households 159
52.
Economic Vulnerability: Land Ownership and Quality - Farmers’ perception on the
quality of their agricultural land
160
Agricultural Situation: Access to Inputs - Perception of the community on access
53. to improved agricultural inputs
161
Agricultural Situation: Water for irrigation - Access to water for irrigation in the
54. community
163
Agricultural Situation: Soil Fertility - Perception of the community on soil fertility
55. and its change over time
165
Economic Vulnerability: Status of Agriculture - Methods of tillage, Irrigation and
56. other agricultural input utilization by households
167
57.
Economic Vulnerability: Change in Agricultural Situation - Households
perception on changes of crop type, size of cultivated area and crop yields
168
58. Economic Vulnerability: Crops Grown - Number of crops grown by households
170
Livestock Production
171
Agricultural Situation: Status of Livestock Disease - Change In Livestock Disease
59. Status By Kebele
172
Livestock Prevalent of Diseases & Veterinary Facility - Livestock Diseases
60. Prevalence
174
Livestock Prevalent of Diseases & Veterinary Facility - Evaluation of Access to
61. Veterinary Services and Livestock Drugs
174
No. Indicator Name
Page
62.
Agricultural Situation: Water Availability for Livestock - Water availability for
livestock in the community
175
Agricultural Situation: Livestock Diversity - Type of livestock and their economic
63. importance in the community
178
Economic Vulnerability: Livestock Ownership and Changes - Percentage of
64. households by number and type of livestock owned
182
65.
Economic Vulnerability: Livestock Ownership and Changes - Households’ perception
on changes in livestock number in the last five years (response in %)
184
66.
Economic Vulnerability: Livestock Ownership and Changes - Households
perception on changes in livestock number in the last five years (response in %)
185
67.
Agriculture (Livestock): Pasture Availability - Households’ perception on access and
quality of pasture
189
Agriculture (Livestock): Pasture Availability - Households’ perception on
68. problematic months for pasture availability
190
Agriculture (Livestock): Water Availability - Households’ response on water
69. availability for livestock
191
70.
Agriculture (Livestock): Water Availability - Households’ perception on problematic
months of water availability for livestock
192
Agriculture (Livestock): Water Availability - Sources of water for livestock
71. (households response in %)
193
Access to Markets and Credit
194
Economic Vulnerability: Proportion of Produce Sold and Market - Proportion of
72. crops and livestock sold from total production and markets
195
73. Economic Vulnerability: Kebele Access to Markets - Access to market by Kebele
199
Economic Vulnerability: Formal & Informal Transfers - Percentage of households
74. reporting received formal transfers
201
75. Capacity: Access to Credit Facilities - Households access to credit facilities
203
Capacity: Access to Credit Facilities - Percentage of households by major reasons
76. of borrowing money
204
No. Indicator Name
Capacity: Access to Credit Facilities - Percentage of households by major sources
77. of credit
Capacity: Access to Credit Facilities - Percent of households with ability to raise
78. 500 birr in one week
Health and Sanitation Characteristics
Page
205
206
207
79. Household Access to Health Facilities - Where do patients go for health care?
208
80. Hazards: Health problems and changes over the last decade
209
81. Household Health Status - Households’ health condition and major health problems 211
82.
Household Access to Sanitation - Percentage of households with access to different
kind of toilet facilities
213
Household Access to Drinking Water - Sources of drinking water for households
83. (response in %)
214
Household Access to Drinking Water - Households’ methods of treating drinking
84. water
215
85.
Household Access to Drinking Water - Number of times households fetch water in a
week
216
Household Access to Drinking Water - Time taken per day to fetch water for
86. households
217
Coping Mechanisms and Preparedness Measures
218
87. Capacity: Community Preparedness against Sudden Onset Disasters
219
88. Capacity: Community Preparedness against Increase in Disaster Intensity
222
89. Capacity: Community Preparedness against Disasters
226
90. Hazard: Coping and recovering during last Disaster
230
91. Capacity: Type Community Participation
245
Capacity: Recovery from Losses from Disasters - Percentage of Households who
92. have managed to recover from losses of disasters
247
No. Indicator Name
Page
Capacity: Coping Strategies Adopted by Households - Main coping strategies
93. adopted by households to recover from respective losses
248
94.
Capacity: Coping Strategies Adopted by Households - Percentage of households
by frequency of main coping strategies adopted
254
95.
Capacity: Alternative Livelihood Sources - Alternative livelihood sources suggested
by the community
256
96.
Capacity: Recovery from Losses from Disasters - Percentage of households
recovered from past disasters by type of Disasters
259
Capacity: Recovery from Losses from Disasters - Proportion of households
97. recovered by type of Losses
260
Capacity: Coping Options if More Resources Available - What coping strategy could
98. be adopted if more resource were available?
261
Capacity: Coping Strategies Adopted by Households - Percentage of households by
99. major type of coping strategies adopted (at least once)
262
Capacity: Coping Strategies Adopted by Households - Main coping strategies
100. adopted by households for respective disasters
264
Capacity: Coping Strategies Adopted by Households - Secondary coping strategies
101. adopted by households for respective disasters
271
Community Perception and Suggestions
275
Interventions: Community Perception on Mediums to Influence DRM Actors -
102. Community perception on the effectiveness of institutional channels to use to
276
influence DRM actors
Interventions: Community Perception on their Knowledge used in DRM Process -
103. Perception of the community on how their knowledge influences the priorities and 280
measures of DRM actors
Interventions: Suggestions to improve preparedness - Interventions suggested by
104. the community to development actors to improve preparedness in the area
282
Interventions: Suggestions to DRM Actors in the Area - Community suggested
105. measures to DRM actors in the area for effective DRM actions
283
No. Indicator Name
Page
Economic Vulnerability: Community Suggestions to Improve Economic Situation -
106. Community suggested measures to improve the economic situation of the area
287
107. Community Awareness of Disaster Risk Management System and Actors
293
Community Perception of DRM System and Actors - Perception of the community on
108. the effectiveness of DRM system in helping them to prevent, cope and recover
308
from disasters
Major Public Interventions Desired - Percentage of households by type of
109. intervention desired
315
Others
317
110. Capacity: Community Based Organizations
318
Supporting Agencies against Disasters - Percentage of households by supporting
111. institutions to handle or recover from disaster damages
326
Type of Support Received from Supporting Agencies – Household responses of types
112. of support received from supporting agencies
327
Government Actors in the Field of Disaster Risk Management - Government actors
113. and their activities in the field of Disaster Risk Managements
328
Non-Government Actors in the Field of Disaster Risk Management - Non-government
114. actors and their activities in the field of Disaster Risk Management
330
115. Interventions: Community Suggestions to Development Actors
331
116. Wereda SWOT Analysis
346
WEREDA LOCATON
METHODOLOGY
WDRP Content :
• Comprehensive information on disaster risk components
(Hazards, Vulnerability and Capacity)
• Multi-sectoral and multi-hazard information.
Research Approach:
• Mixed Approach
• Both quantitative and qualitative information
Data Sources:
• Primary Data:
Household Questionnaires: statistically significant number
(around 400 households).
Focus Groups Discussions: One per kebele
Key Informant Interviews: with major woreda level government
and non-government DRM actors
Problem Tree Analyses : to see the cause and effect of disasters
• Secondary Data:
collected relevant to WDRP indicators:
LIU, SERA Project, Risk baseline, other ministries…
Sampling Technique:
• Multistage cluster sampling
• Both Probability and Non-probability sampling
Methods of Analysis:
• Descriptive Statistics
• Textual Analysis
• Cispro and SPSS
• Automate WDRP software

WEREDA
SUMMARY DISASTER RISK PROFILE
INFORMATION
Wereda Disaster Risk Profiling Programme: SNNPR
Disaster Risk Profile: Bonke Wereda (May 2017)
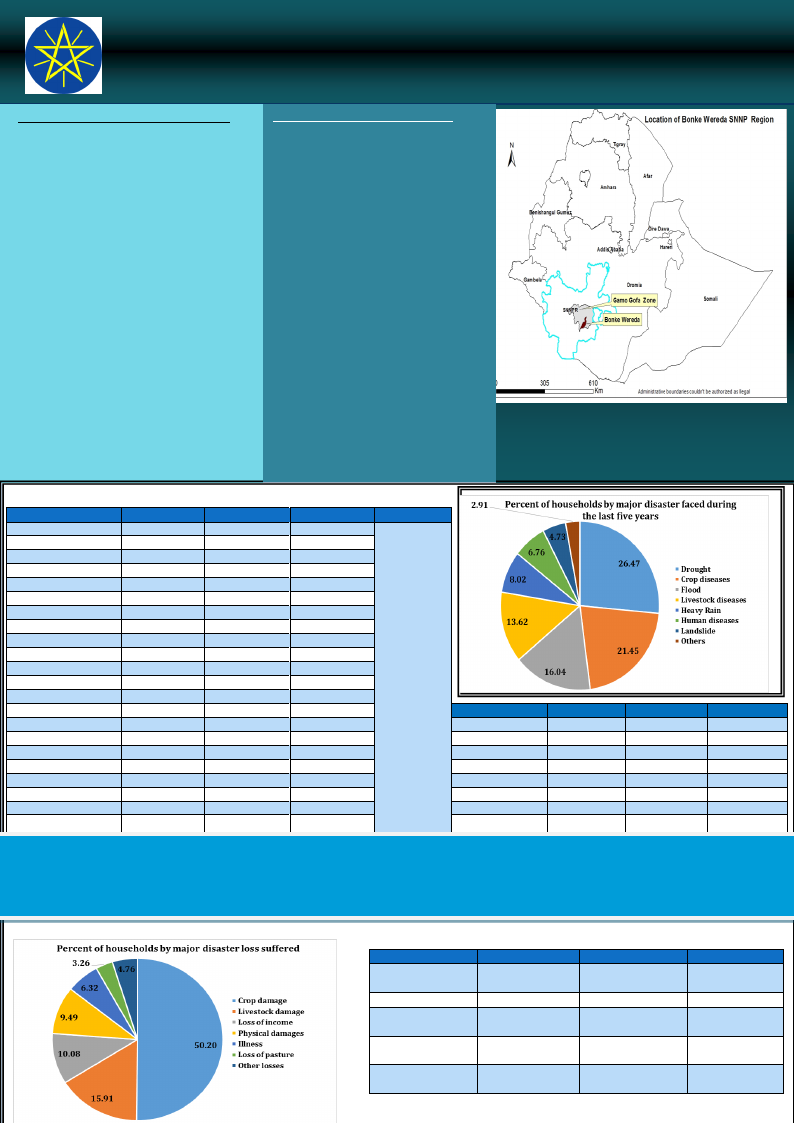
SUMMARY OF WEREDA PROFILE
Drought, crop diseases and pests, floods and
livestock diseases are the major disaster risks
affecting the livelihood of the community.
Human diseases and landslides are also
among the hazards. Deforestation, soil
erosion and water pollution are among
environmental problems.
Sloppy topography, cultivation of steep areas,
lack of enough soil and water conservation in
some areas, limited access to irrigation,
traditional livestock production system,
shortage of pesticides, lack of clean water,
poor sanitation and hygiene are among
vulnerability factors to major disaster.
Supply of drought tolerant crop varieties,
timely provision of pesticides and increasing
access and use of improved animal breeds are
required. Improving access to clean water,
expanding irrigation, construction of roads
and other infrastructures, strengthening soil
and water conservation activities, improving
market linkage are also recommended.
SUMMARY OF LIVELIHOOD ZONE
Gamo-Gofa Maize and Root Crop
Livelihood Zone
This zone is highly food-insecure,
characterized by small landholdings, low
soil fertility and frequent rainfall
irregularities. Enset and root crops are
important as relatively drought-resistant
crops. Livestock and butter sales bring
the biggest portion of cash for the better-
off and middle groups. The poor rely for
cash mainly on casual employment,
including migrant work on state farms in
Jinka, Awash, Shashamene and Ziway.
Gamo Gofa Enset and Barley (GEB)
Livelihood Zone
The agricultural system is mixed farming.
Households grow enset, barley, wheat,
sweet potatoes, pulses (horse beans, peas
and haricot beans) and small amounts of
maize. Cattle, sheep, horses, mules,
donkeys and chickens are reared in this
livelihood zone, but the types of livestock
owned vary considerably from one
wealth group to the next.
MAJOR DISASTERS REPORTED IN WEREDA
Kebele
Disaster 1
Disaster 2
Disaster 3
LIU Info
Zega
Drought
Crop disease Livestock ids. Chronic
Fudele
Drought
Livestock dis. Human dis.
hazards:
Garibansa Galo
Drought
Flood
Crop disease GMR LZ
Geribanisa Karche
Zazie
Gorate
Geribansa Soroge
Kole Kanchame
Kole Zale
Bonke Yela
Koyra Mukula
Ketele
Fishito
Duribe
Algude
Kacha Kashiso
Chosha
Kamele B/Oro
Kalibo Laka
Gezeso
Denbile Osa
Landslide
Drought
Drought
Flood
Crop disease
Crop disease
Landslide
Drought
Drought
Landslide
Drought
Crop disease
Flood
Livestock dis.
Drought
Crop disease
Crop disease
Drought
Crop disease
Landslide
Landslide
Landslide
Livestock dis.
Livestock dis.
Crop disease
Crop disease
Livestock dis.
Drought
Human dis.
Human dis.
Crop disease
Crop disease
Human dis.
Livestock dis.
Landslide
Crop disease
Human dis.
Crop disease
Livestock dis.
Drought
Livestock dis.
Human dis.
Human dis.
Livestock dis.
Livestock dis.
Human dis.
Landslide
Landslide
Drought
Human dis.
Shortage
& erratic
rainfall,
crop
pests,
Trypanos
omiasis,
Market
price
shock &
malaria
GEB LZ
Erratic
rainfall, crop
diseases &
pests
(mainly
aphids)
Kebele
Kalo Gagula
Gerase Zala
Kalo Gagula
Dembile Otora
Koshale
Gobo Bake
Dimele Fuse
Disaster 1
Crop disease
Drought
Drought
Drought
Drought
Crop disease
Drought
Disaster 2
Livestock dis.
Human dis.
Landslide
Human dis.
Livestock dis.
Flood
Livestock dis.
Disaster 3
Livestock dis.
Crop disease
Livestock dis.
Human dis.
Livestock dis.
Deshkele
Drought
Crop disease Livestock dis.
Bula
Drought
Human dis. Livestockdis.
eases
SHORT NARRATIVE ON MAJOR DISASTERS: Drought (erratic distribution and shortage of rain) is very recurrent in the Woreda and causes crop damage
and resulted in other hazards like crop diseases and pests as well as severe shortage of food, feed and water. Floods affect the Woreda mainly in
April, October and November, mainly causing land degradation, damages on farms and crops and destruction of infrastructures. Moreover, crop
pests and diseases (like rust, aphids and striga) also affect crops from October to December. Human diseases (malaria, typhus, typhoid and skin
diseases) are reported by households. Livestock diseases (Black leg, Anthrax and Trypanosomiasis) are prevalent.
Disasters
Drought
Crop diseases
Flood
Livestock
diseases
Human diseases
EFFECT OF DISASTERS
Loss 1
Crop damage
Crop damage
Crop damage
Death of animals
Loss 2
Loss of water and
pasture
Loss of income
Damage on
infrastructures
Loss of income
Loss of working Death of humans
manpower
Loss 3
Loss of animal
products
Food shortage
Land
degradation
Loss of income
and saving
Wereda Disaster Risk Profiling Programme: SNNPR
Disaster Risk Profile: Bonke Wereda (May 2017)
HOUSEHOLD AND COMMUNITY
VVUULLNNEERRAABIBLIILTIYTY
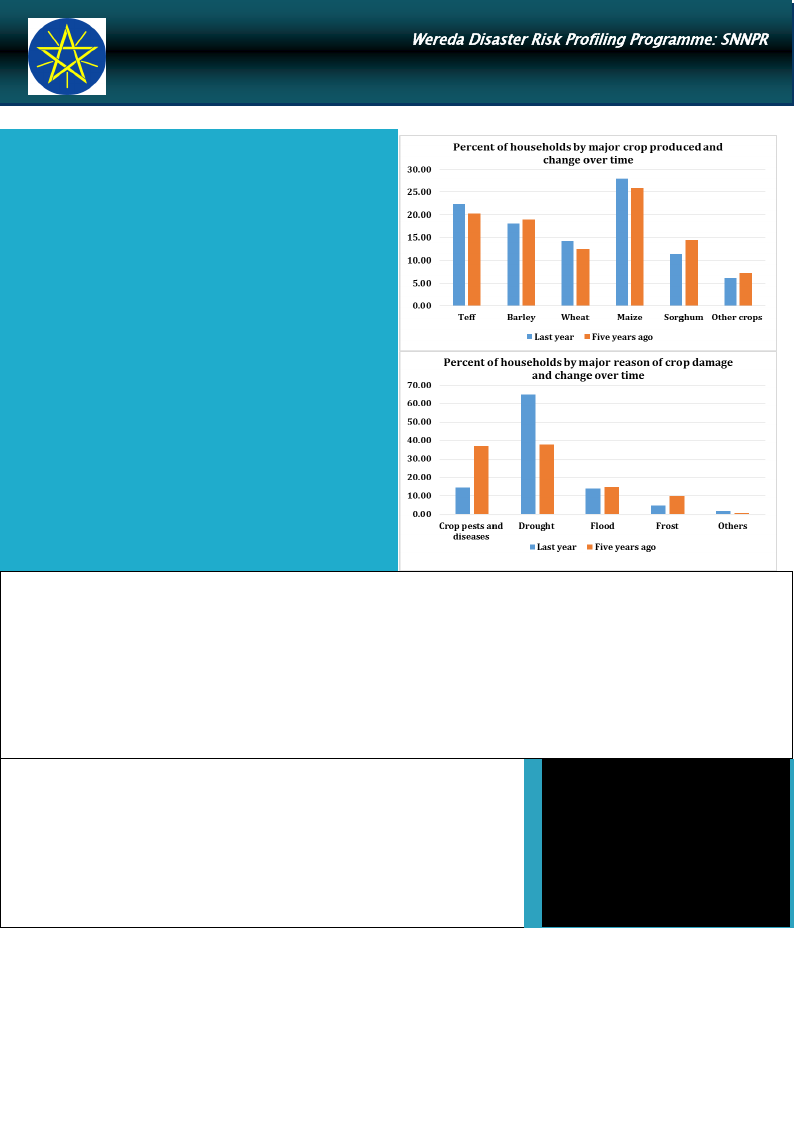
The wereda is mixed crop and livestock producing system. Cereals
dominate crop production where maize, teff, barley, wheat and
sorghum are widely grown in the area. Crop production is constrained
by many hazards like erratic rainfall distribution, rainfall shortage,
crop pests and diseases and floods. Shortage of pesticides and
improved seeds is reported in most kebeles. Moreover, poor soil
fertility, shortage of land, poor agronomic practices (including mono-
cropping) and high price of agricultural inputs (fertilizer, seeds and
pesticides) are additional constraints in crop production.
Sloppy topography, cultivation of mountainous and steep areas,
settlement condition and lack of enough soil and water conservation
works in some areas exposed households to flooding. Poor
environmental sanitation and personal hygiene, lack of clean drinking
water and food shortage exposed households to malaria, typhoid,
typhus and skin diseases. January is the most problematic month in
terms of pasture and water availability for livestock. Traditional
livestock production system and diminishing grass areas reduced
livestock productivity.
On the other hand, large family size (8 per household), lack of family
planning, poor saving habit and lack of awareness are additional
vulnerability factors. More than 80% of the households did not
manage to recover from the disaster loss they suffered implying weak
resilience capacity of the community. About 15% of households have
received food aid.
Accessibility:
Access to veterinary facility: 56% of the households reported to have poor access to veterinary service and livestock drugs.
Access to water and sanitation: 52% and 48% of the households primarily obtain drinking water from rivers/streams and communal tap
respectively. About 65% of the households treat drinking water using different techniques. With regard to sanitation, 97% of the households use
outdoor latrine.
Access to road and urban centre: average time taken to reach the nearest paved road is 1 hour, while it took them 3 hours to reach the nearest
urban centre. Access to electricity: 6% of the households are located in the community with electricity and 4% are connected to electric power.
Access and linkage to market is poor for most kebeles due to lack of road access.
Utilization of fertilizer, pesticide and improved seeds: 90% of the households have used chemical fertilizer in crop production, while 34% of
the households have used pesticides. On the other hand, 95% of the households have reported using improved variety of seeds.
Access to agricultural extension service is good and 95% of the households have received agricultural extension service.
Access to credit: 10% of the households have borrowed money from different sources mainly to purchase food and agricultural inputs.
Level of Awareness and Institutional Development
The literacy level of the population above 7 years of age is 17%, out of which 32% of them
completed only below first grade level, while 44% and 22% of the population attended primary
and secondary school respectively. With regard to gender disparity in education, proportion of
male students is more than female students at primary and higher levels.
Community awareness about disaster risk management actors and system is good. There are
community based organizations such as cooperatives (which supply agricultural inputs and
consumption goods to its members), Edir and Ekub (association to help each other in social
affairs) as well as women and youth associations. Hope international development agency and
WASH are working in the wereda on supply of clean water to the community.
InfoBits:
Population
: 158795 (2007)
Sex ratio
: 1011 F/1000 M
Urban Population : 6344 (2007)
Mean Altitude : 1820 m
Mean Slope
: 10.4%
Measles caseload : 11 (2004 to 2009)
Sources: Various Secondary Sources
COMMUNITY CAPACITY TO COPE
Saving crop surplus for consumption, selling more livestock than usual, looking for labour work and selling firewood/charcoal are the major
coping mechanisms when households face problems.
Farmers use different methods to mitigate the effect of drought, which include cultivation of short cycle crops, adjusting cropping calendar and
cultivation of drought tolerant crops (like sweet potato, Enset and root crops).
The level of cooperation in the community is good, but it is decreasing over time due to recurrent occurrence of disasters and poor capacity.
Crop and livestock diversity: major crops produced are maize, teff, wheat, barley and sorghum. Potato, Enset and root crops are also grown in
the area. On the other hand, cattle are the major types of livestock reared in the area followed by sheep, goat, donkey and poultry. There are
potential rivers like Dancha River that can be used for irrigation to mitigate the effect of drought.
WDRP Indicators
Hazard Related Characteristics
1

Wereda Disaster
Risk Profile
National Disaster Risk Management
Commission (NDRMC)
Data_Collected_Date
March 2017
Friday, July 21, 2017
Region S.N.N.P
Zone
GAMO GOFA
Wereda
BONKE
Selected Indicator
Biological Hazards of the Wereda
Hazard_Name
Cause_Of_Hazard
Hazard_Sub_Type
Crop diseases and pests
• Rust
• Aphids
• Striga weed
Change in weather condition
Poor agronomic practices (such as poor
land preparation and lack of crop
rotation)
Low access to pesticides
Hazard_Sub_Type
Human diseases
• Malaria
• Thyroid
• Typhus
• Diarrhea
• Skin diseases (like scabies)
Poor hygiene
Lack of environmental sanitation
Food shortage
Lack of clean water
Water pollution
Hazard_Sub_Type
Livestock diseases
• Black leg
• Anthrax
• Trypanosomiasis
Change in weather condition
Shortage of pasture and water
Effects_Of_Hazard
Crop damage
Loss of income
Food insecurity
Malnutrition
Long term illness
Death of humans
Loss of assets
Loss of income
Incur high expense for medication
Animal death
Loss of animal products
Poor body condition of animals
Low price of animals at market
Low income
Page 1 of 1
2
Wereda Disaster
Risk Profile
National Disaster Risk Management
Commission (NDRMC)
Data_Collected_Date
March 2017
Friday, July 21, 2017
Region S.N.N.P
Zone
GAMO GOFA
Wereda
BONKE
Selected Indicator
Geological Hazards of the Wereda
Hazard_Name
Hazard_Sub_Type
Landslide
Cause_Of_Hazard
Landslide
High rainfall intensity
Deforestation
Cultivation of sloppy areas
Sloppy topography
Effects_Of_Hazard
Crop damage
Land degradation
Death of humans and animals
Damage on infrastructures and assets
Page 1 of 1
3
Wereda Disaster
Risk Profile
National Disaster Risk Management
Commission (NDRMC)
Data_Collected_Date
March 2017
Friday, July 21, 2017
Region S.N.N.P
Zone
GAMO GOFA
Wereda
BONKE
Selected Indicator
Hydro Metrological Hazards of the Wereda
Hazard_Name
Hazard_Sub_Type
Drought
Cause_Of_Hazard
Drought
Change in weather condition
Deforestation
Hazard_Sub_Type
Flood
Flood
High rainfall
Sloppy topography
Deforestation
Poor farming system (cultivation of
sloppy areas)
Overgrazing
Effects_Of_Hazard
Crop damage
Loss of pasture
Shortage of water
Loss of income
Food shortage
Crop damage and yield reduction
Damage crop land
Landslide
Physical damage on houses and
properties
Gully formation and land degradation
Loss of income
Food shortage
Death of humans
Page 1 of 1
4

Wereda Disaster
Risk Profile
National Disaster Risk Management
Commission (NDRMC)
Data_Collected_Date
March 2017
Friday, July 21, 2017
Region S.N.N.P
Zone
GAMO GOFA
Wereda
BONKE
Selected Indicator
Socio Economic Hazards of the Wereda
Hazard_Name
Hazard_Sub_Type
Socio-economic hazard
Cause_Of_Hazard
Socio-economic hazard
No socio-economic hazard is reported
Effects_Of_Hazard
Page 1 of 1
5
Wereda Disaster
Risk Profile
National Disaster Risk Management
Commission (NDRMC)
Data_Collected_Date
March 2017
Friday, July 21, 2017
Region S.N.N.P
Zone
GAMO GOFA
Wereda
BONKE
Selected Indicator
Technological Hazards of the Wereda
Hazard_Name
Hazard_Sub_Type
Technological Hazards
Cause_Of_Hazard
Technological Hazards
No technological Hazard is reported
Effects_Of_Hazard
Page 1 of 1
6

Wereda Disaster
Risk Profile
National Disaster Risk Management
Commission (NDRMC)
Data_Collected_Date
March 2017
Friday, July 21, 2017
Region S.N.N.P
Zone GAMO GOFA
Wereda BONKE
Selected Indictor:
Kebele Name
ALGUDA
YELA
Disaster Characteristics By Kebele
Disaster_Type Common Period
Year
Worst_ Trends of
Occured Year Effects
Root Causes
Crop diseases
October,
November,
December,
April, January
2004,
2005,
2006,
2008,
2009
2008
Increased
Climate
change
Human
diseases
December,
January,
February, March
2007,
2008,
2009
2009
Increased
Water
pollution
Livestock
diseases
January,
February,
March, April
2006,
2008,
2009
2009
Increased
Climate
change
Landslide
May, April
2005,
2006,
2007,
2008
2006
Decreased High rain fall
Crop diseases
September,
November,
October
2005,
2006,
2007,
2008,
2009
2007
Increased
Climate
change
Effects
Crop
damage,
Shortage of
food, Loss of
income
Illness
Livestock
death, Loss
of income
Loss of crop
yield
Loss of crop
production,
Loss of
income
Vulnerability
Unseasonal rainfall
Lack of clean water
Shortage of forage,
Lack of vaccination
Climate change
Climate change
Coping Strategy
Use of pesticides
Medical treatment
Vaccination
Soil and water
conservation
Use of pesticides
7
Page 1 of 18

Wereda Disaster
Risk Profile
National Disaster Risk Management
Commission (NDRMC)
Data_Collected_Date
March 2017
Friday, July 21, 2017
Region S.N.N.P
Zone GAMO GOFA
Wereda BONKE
Selected Indictor:
Kebele Name
CHOSHA
Disaster Characteristics By Kebele
Disaster_Type Common Period
Livestock
diseases
January,
February,
March, April
Year
Occured
2003,
2004,
2004,
2005,
2006,
2007,
2008,
2009
Worst_
Year
2005
Trends of
Effects
Increased
Crop diseases
September,
October,
November
2004,
2004,
2005,
2006,
2007,
2008,
2009
2008
Increased
Human
diseases
November,
December,
January,
February
2009
2009
Increased
Root Causes
Climate
change
Climate
change
Shortage of
clean water
DENBILE OSA
Drought
July, August,
September,
February, March
2000,
2001,
2002,
2006,
2007,
2008
2000
Increased
Climate
change
Effects
Livestock
death, Loss
of income
Yield loss,
Loss of
income
Health
problem,
Stopping of
teaching
process
Loss of yield
Vulnerability
Shortage of pasture
Climate change
Climate change
Shortage of water
Coping Strategy
Vaccination
Use of pesticides
Medical treatment
Report to concerned
bodies for gaining of
support
8
Page 2 of 18

Wereda Disaster
Risk Profile
National Disaster Risk Management
Commission (NDRMC)
Data_Collected_Date
March 2017
Friday, July 21, 2017
Region S.N.N.P
Zone GAMO GOFA
Wereda BONKE
Selected Indictor:
Kebele Name
DENBILE OSA
DEMBILE OTORA
DESHKELE
Disaster Characteristics By Kebele
Disaster_Type Common Period
Year
Worst_ Trends of
Occured Year Effects
Crop diseases July, August
2005-200 2009
9
Increased
Human
diseases
February,
March, July,
August
2007,
2008,
2009
2009
Increased
Root Causes
Climate
change
Shortage of
food
Drought
Human
diseases
Livestock
diseases
Drought
September,
October,
November,
December
January,
February, March
2006,
2007,
2008,
2009
2005 -
2009
January,
February, March
2008,
2009
January,
February, March
2007,
2008,
2009
2009
Increased
Climate
change
2009
2009
2008
Increased
Increased
Increased
Climate
change
(pollution)
Shortage of
water and
forage
Climate
change
Crop diseases
Livestock
diseases
March, April,
May
May, June, July
2008,
2009
2008,
2009
2008
2009
Increased
Increased
9
Climate
change
Climate
change,
Heavy rainfall
Effects
Vulnerability
Loss of yield Climate change
Human death
Yield loss,
Shortage of
food and
water
Health
problem in
children
Livestock
death, Loss
of income
Loss of crop
production,
Shortage of
water and
animal feedc
Yield loss
Livestock
death, Loss
of income
Lack of medical
treatment and
health experts
shortage in the area
Climate change
Climate change,
Water pollution
Climate change
Climate change,
Shortage of rain fall
Climate change,
Shortage of rain
Climate change,
Shortage of animal
feed
Coping Strategy
Use of pesticides
Use of medical
treatment
Planting of short
cycle crops
Use of medical
treatment
Vaccination
Planting of drought
resistant crops
Use of pesticide, but
in limitation
Vaccination and give
care for livestock s
Page 3 of 18

Wereda Disaster
Risk Profile
National Disaster Risk Management
Commission (NDRMC)
Data_Collected_Date
March 2017
Friday, July 21, 2017
Region S.N.N.P
Zone GAMO GOFA
Wereda BONKE
Selected Indictor:
Kebele Name
DESHKELE
DURIBE
Disaster Characteristics By Kebele
Disaster_Type Common Period
Year
Worst_ Trends of
Occured Year Effects
Landslide
October, April,
July
2006,
2007,
2008,
2009
2007
Increased
Drought
January,
February,
March, April
2007,
2008,
2009
2009
Increased
Root Causes
Climate
change,
Heavy rain
fall
Deforestation
, Shortage of
rain fall
FADELE
Human
diseases
Livestock
diseases
Drought
December,
January,
February,
March, April
October,
February,
March, May
2007,
2008,
2009
2007,
2008,
2009
November,
December,
January,
February, March
2006,
2007,
2008,
2009
2009
Increased
Shortage of
clean water
2009
2009
Increased
Increased
Shortage of
water and
pasture, Lack
of
vaccination
Climate
change,
Water
shortage
10
Effects
Vulnerability
Human
death, Loss
of yield
Topography,
Climate change
Yield loss,
Shortage of
water and
food,
Livestock
death, Loss
of income
Illness of
working
groups and
Loss of
income
Reduction of
production,
Livestock
death, Loss
of income
Damage of
crops, Yield
loss,
Shortage of
food, Income
loss
Deforestation,
Shortage of rainfall,
Lack of irrigation
Shortage of rain
Climate change,
Shortage of rain
Shortage of rain
Coping Strategy
Soil and water
conservation
Store food, Change
livelihood system
Medical treatment
Vaccination
Store food and crops
to escape from the
impacts of drought.
Page 4 of 18

Wereda Disaster
Risk Profile
National Disaster Risk Management
Commission (NDRMC)
Data_Collected_Date
March 2017
Friday, July 21, 2017
Region S.N.N.P
Zone GAMO GOFA
Wereda BONKE
Selected Indictor:
Kebele Name
FADELE
FISHITO
Disaster Characteristics By Kebele
Disaster_Type Common Period
Year
Worst_ Trends of
Occured Year Effects
Livestock
diseases
January,
February, March
2006,
2007,
2008,
2009
2009
Increased
Landslide
November,
December,
March
2003,
2004,
2005,
2006,
2007,
2008
2008
Increased
Drought
January,
February, March
2000,
2001,
2002,
2003,
2004,
2005,
2006,
2007,
2008
2008
Increased
Human
diseases
February, March
2008,
2009
2009
Increased
Root Causes
Climate
change,
Shortage of
rain
Climate
change, High
rainfall
Climate
change
Water
pollution
Effects
Vulnerability
Livestock
death, Loss
of income
Shortage of water
and animal forage
Human
death, Crop
damage, Loss
of soil
fertility
Topography,
Climate change
Shortage of
food,
Migration
Deforestation,
Climate change
Human
death, Stop
teaching
process
Shortage of clean
water, Water
pollution
Coping Strategy
Temporary migration
with their livestock
Migration and
shifting the place
temporarily
Use of irrigation
water, Migration
Medical treatment
11
Page 5 of 18

Wereda Disaster
Risk Profile
National Disaster Risk Management
Commission (NDRMC)
Data_Collected_Date
March 2017
Friday, July 21, 2017
Region S.N.N.P
Zone GAMO GOFA
Wereda BONKE
Selected Indictor:
Kebele Name
FISHITO
GARIBANISA
SOROGE
GERASE ZALA
Disaster Characteristics By Kebele
Disaster_Type Common Period
Crop diseases
November,
February
Year
Occured
2000,
2001,
2002,
2004,
2006
Worst_
Year
2009
Trends of
Effects
Increased
Root Causes
Contact with
toxic
materials
Flood
April, August,
October,
November
2002,
2005,
2006,
2008
2008
Increased
Deforestation
, Heavy rain
fall
Landslide
November,
April, July,
August
2002,
2005,
2008
2008
Increased Topography
Livestock
diseases
February, March
2000,
2005,
2006,
2009
2000
Decreased Climate
change
Drought
January,
February,
March, April
2007,
2008,
2009
2009
Increased
Climate
change
Human
diseases
October, May,
June
2008,
2009
2009
Increased
Shortage of
clean water
and food
Effects
Loss of
income
Human
death, Crop
damage
Human
death,
Migration
Livestock
death
Shortage of
water, food
and animal
fodder
Health
problem,
Loss of
income
Vulnerability
Climate change
Topography, Poor
cultivation
Unconditional heavy
rainfall, Climate
change
Shortage of water
Climate change
Climate change
Coping Strategy
Shifting of farm land
and crop rotation
Migrate into other
places temporarily.
Constructing of
shelters, Soil and
water conservation
Use of traditional
treatment and drugs.
Planting of short
cycle crops like
sweet potato
Use of drug and
vaccination services
12
Page 6 of 18

Wereda Disaster
Risk Profile
National Disaster Risk Management
Commission (NDRMC)
Data_Collected_Date
March 2017
Friday, July 21, 2017
Region S.N.N.P
Zone GAMO GOFA
Wereda BONKE
Selected Indictor:
Kebele Name
GERASE ZALA
GERIBANISA
KARICHE
GERIBANISHA
GALO
Disaster Characteristics By Kebele
Disaster_Type Common Period
Livestock
diseases
October, May,
June
Year
Occured
2008,
2009
Worst_
Year
2009
Trends of
Effects
Increased
Landslide
Crop diseases
Drought
Flood
Crop diseases
October,
November, April
October,
November
September,
October, May,
June
March, April,
October,
December
October,
November
1998,
2004,
2008
2000,
2002,
2003,
2006,
2008
2004,
2005,
2007,
2008
2005,
2006,
2007,
2008
2005,
2006,
2007,
2008
2004
Increased
2008
Increased
2007
Increased
2008
Increased
2008
Increased
Root Causes
Lack of
vaccination,
Limited
number of
experts
High rainfall
Climate
change
Climate
change, Land
degradation
Heavy rain
fall
Climate
change, Loss
of soil
fertility
Effects
Livestock
death, Loss
of income
Vulnerability
Climate change,
Shortage of water
Human
death, Crop
damage
Yield loss,
Shortage of
income
Steep slope,
Topography,
Deforestation
Climate change
Yield loss,
Shortage of
food, Loss of
income
Human
death, Crop
damage
Unseasonal rain
fall, Dependency of
rain feed
agriculture
Poor settlement,
Deforestation
Loss of yield,
Shortage of
food, Loss of
income
High soil acidity,
Fluctuation of
rainfall, Less access
of pesticides
Coping Strategy
Medical treatment
Migrate to another
place temporarily
Use of pesticide
Migration for labor
work
Soil conservation,
Construction of
houses and give
temporary shelter.
Use of pesticides
13
Page 7 of 18

Wereda Disaster
Risk Profile
National Disaster Risk Management
Commission (NDRMC)
Data_Collected_Date
March 2017
Friday, July 21, 2017
Region S.N.N.P
Zone GAMO GOFA
Wereda BONKE
Selected Indictor:
Kebele Name
GEZESO
GOBO BAKE
Disaster Characteristics By Kebele
Disaster_Type Common Period
Year
Worst_ Trends of
Occured Year Effects
Crop diseases
October,
September
2000,
2001,
2002,
2003,
2004,
2005,
2009
2007
Increased
Landslide
September, May,
April
2000,
2002,
2004,
2005,
2006,
2007,
2008
2007
Increased
Drought
October,
November
2003-200 2007
7
Increased
Root Causes
Climate
change
Heavy rainfall
Climate
change
Crop diseases
November,
December
2006,
2007,
2008,
2009
2007
Increased
Climate
change, High
rain fall
Flood
June, October
2006,
2007
2007
Decreased
Climate
change, High
rain fall
Effects
Vulnerability
Loss of
income,
Shortage of
food
Climate change
Crop
damage,
Animal death
Poor settlement
Loss of
income,
Animal death
Crop
damage, Loss
of income,
Shortage of
food
Crop
damage, Loss
of household
materials
Shortage of rainfall
Lack of resistant
crops
Overgrazing
Coping Strategy
Use of pesticides
Soil and water
conservation, A
forestation
Store food crops
Changing of sowing
time and use of crop
rotation
Cut off drain, Soil
and water
conservation
14
Page 8 of 18

Wereda Disaster
Risk Profile
National Disaster Risk Management
Commission (NDRMC)
Data_Collected_Date
March 2017
Friday, July 21, 2017
Region S.N.N.P
Zone GAMO GOFA
Wereda BONKE
Selected Indictor:
Kebele Name
GOBO BAKE
Disaster Characteristics By Kebele
Disaster_Type Common Period
Year
Worst_ Trends of
Occured Year Effects
Root Causes
Livestock
diseases
April, May
2001 -
2008
2008
Decreased Climate
change
Effects
Livestock
death
Vulnerability
Shortage of
livestock pasture
GORATE
KALIBO LAKA
KALO GAGULA
Drought
Landslide
August,
September,
October,
November,
June, July
May, June,
October
Crop diseases
September,
October,
November
Livestock
diseases
February,
March, April
Landslide
April, May,
June, October
Crop diseases
October,
November,
December
2005,
2006,
2007,
2008,
2009
2007,
2008,
2009
2005-200
9
2008
2007
2009
Increased
Shortage of
rain fall
Increased
Heavy rain
fall
Increased
Unseasonal
rainfall
2006-200 2009
9
Increased Anthrax
2003,
2004
2003
Increased heavy rain
2007,
2008,
2009
2009
Increased Rust
Productivity
decreased,
Yield loss,
Shortage of
food
Human
death, Crop
damage
Loss of yield,
Shortage of
food, Crop
damage
Death of
animal
Death of
livestock,
Crop damage
Yield loss,
Shortage of
water
Climate change
Climate change
Climate change
Lack of vaccination,
Lack of veterinary
professionals
Climate change,
Poor settlement
Climate change,
Shortage of water
Coping Strategy
Vaccination,
Roasting of their
body
Destocking, Eat
different plants like
nut and roots
Migrate to other
places
Use of pesticides
Vaccination
Soil and water
conservation
Use of pesticides
15
Page 9 of 18

Wereda Disaster
Risk Profile
National Disaster Risk Management
Commission (NDRMC)
Data_Collected_Date
March 2017
Friday, July 21, 2017
Region S.N.N.P
Zone GAMO GOFA
Wereda BONKE
Selected Indictor:
Kebele Name
KALO GAGULA
KAMELE BARIE
ORO
Disaster Characteristics By Kebele
Disaster_Type Common Period
Livestock
diseases
January,
February,
March, April
Year
Occured
2007,
2008,
2009
Worst_
Year
2009
Trends of
Effects
Increased
Drought
January,
February, March
2007,
2008,
2009
2009
Increased
Root Causes
Lack of
vaccination
Shortage of
rain fall
Human
diseases
Landslide
October,
November,
December,
January
February, March
October,
September
2008,
2009
2000,
2001,
2002,
2003,
2004,
2005,
2006,
2007,
2008,
2009
2009
Increased
Shortage of
clean water
and food
2008
Increased
Heavy rain
fall,
Topography
Effects
Death of
livestock
Crop
damage,
Shortage of
food and
water
Illness
Human
death, Crop
damage,
Destruction
of
infrastructur
e, Loss of
income
Vulnerability
Climate change,
Shortage of pasture
and water
Shortage of rainfall
Shortage of rain
Climate change
Coping Strategy
Vaccination
Destocking, Store
food crops for future
use
Medical treatment
Co-operation work
16
Page 10 of 18

Wereda Disaster
Risk Profile
National Disaster Risk Management
Commission (NDRMC)
Data_Collected_Date
March 2017
Friday, July 21, 2017
Region S.N.N.P
Zone GAMO GOFA
Wereda BONKE
Selected Indictor:
Kebele Name
KAMELE BARIE
ORO
Disaster Characteristics By Kebele
Disaster_Type Common Period
Livestock
diseases
December,
January,
February,
March, October
Year
Occured
2000-200
9
Worst_
Year
2000
Trends of
Effects
Increased
Root Causes
Shortage of
water and
pasture
Crop diseases
September,
October, August
2000-200 2007
9
Increased Heavy rain
DIMELE FUSE
Drought
March, April,
July, August
2007,
2008,
2009
2008
Increased
Climate
change
Livestock
diseases
April, March,
June
2006,
2007,
2009
2006
Increased
Shortage of
clean water
and forage
Effects
Vulnerability
Livestock
death, Loss
of income,
Decrease
productivity
Crop
damage, Loss
of
production,
Shortage of
food
Crop disease,
Yield loss,
Shortage of
food, Loss of
income
Death of
livestock,
Loss of
income
Climate change
Climate change
Shortage of rain fall
Climate change
Coping Strategy
Feeding like bamboo
and others
Pesticides
Destocking to buy
food, Planting of
short cycle crops
Vaccination, Migrate
to other better
places
17
Page 11 of 18

Wereda Disaster
Risk Profile
National Disaster Risk Management
Commission (NDRMC)
Data_Collected_Date
March 2017
Friday, July 21, 2017
Region S.N.N.P
Zone GAMO GOFA
Wereda BONKE
Selected Indictor:
Kebele Name
KACHA KASHISO
KETELE
Disaster Characteristics By Kebele
Disaster_Type Common Period
Crop diseases
September,
October, May,
June
Year
Occured
2001,
2002,
2003,
2004,
2005,
2006,
2007,
2008,
2009
Worst_
Year
2009
Trends of
Effects
Increased
Flood
April, October,
September
2005,
2006,
2007,
2008,
2009
2009
Increased
Drought
February,
March, April,
July, August
2005,
2006,
2007,
2008,
2009
2009
Increased
Root Causes
Heavy rain
Heavy rain
fall
Climate
change, Lack
of rainfall
Livestock
diseases
January,
February,
March, April
2007,
2008,
2009
2009
Increased
Climate
change
Effects
Yield loss
Livestock
death, Crop
damage
Livestock
death,
Shortage of
food,
Shortage of
animal
forage
Livestock
death
Vulnerability
Climate change
Climate change
Climate change
Climate change
Coping Strategy
Use of pesticides
Soil and water
conservation
Destocking to buy
food crops
Destocking
18
Page 12 of 18

Wereda Disaster
Risk Profile
National Disaster Risk Management
Commission (NDRMC)
Data_Collected_Date
March 2017
Friday, July 21, 2017
Region S.N.N.P
Zone GAMO GOFA
Wereda BONKE
Selected Indictor:
Kebele Name
KETELE
KOLE KANCHAME
Disaster Characteristics By Kebele
Disaster_Type Common Period
Human
diseases
November,
December,
April, May
Year
Occured
2005,
2006,
2007,
2008,
2009
Worst_
Year
2009
Trends of
Effects
Increased
Flood
April, May
2006,
2007,
2008,
2009
2008
Increased
Crop diseases
September,
November,
December
2001,
2002,
2003,
2004,
2005,
2006,
2007,
2008,
2009
2008
Increased
Livestock
diseases
January,
February, March
2001,
2002,
2003,
2004,
2005,
2006,
2007,
2008
2009
Increased
Root Causes
Shortage of
food,
Shortage of
clean water
Deforestation
Climate
change
Climate
change
Effects
Health
problem and
illness
Loss of yield
Crop
damage,
Yield loss
Animal
death, Loss
of income
Vulnerability
Climate change,
Shortage of water
Soil erosion, loss of
soil fertility
Lack of crop
rotation system,
Soil acidity
Shortage of animal
pasture and forage
Coping Strategy
Medical treatment
Soil and water
conservation
Use of pesticides
Vaccination and
drugs
19
Page 13 of 18

Wereda Disaster
Risk Profile
National Disaster Risk Management
Commission (NDRMC)
Data_Collected_Date
March 2017
Friday, July 21, 2017
Region S.N.N.P
Zone GAMO GOFA
Wereda BONKE
Selected Indictor:
Kebele Name
KOLE KANCHAME
KOLE ZALE
Disaster Characteristics By Kebele
Disaster_Type Common Period
Year
Worst_ Trends of
Occured Year Effects
Drought
November,
December,
April, May, June
2005,
2006,
2007,
2008,
2009
2007
Increased
Landslide
April, May,
August, July
2005,
2006,
2007,
2008,
2009
2005
Increased
Crop diseases
November,
December,
September
2001,
2002,
2003,
2004,
2005,
2006,
2007
2008,
2009
2006
Increased
Root Causes
Climate
change
Heavy rain
Climate
change
Effects
Crop
damage,
Livestock
death
Vulnerability
Shortage of food,
and animal pasture
Human
death, Crop
damage,
Livestock
death
Deforestation, Poor
cultivation system
Crop
damage, Loss
of income
Lack of crop
rotation system
Coping Strategy
Migrate for labor
work
Temporary migration
in to better places.
Use of pesticides
20
Page 14 of 18

Wereda Disaster
Risk Profile
National Disaster Risk Management
Commission (NDRMC)
Data_Collected_Date
March 2017
Friday, July 21, 2017
Region S.N.N.P
Zone GAMO GOFA
Wereda BONKE
Selected Indictor:
Kebele Name
KOLE ZALE
KOSHALE
Disaster Characteristics By Kebele
Disaster_Type Common Period
Livestock
diseases
April, May, June
Year
Occured
2000,
2001,
2002,
2003,
2004,
2005,
2006,
2007,
2008
Worst_
Year
2007
Trends of
Effects
Increased
Drought
December,
January,
February,
March, July,
August
2005 -
2009
2009
Increased
Livestock
diseases
February,
March, April,
October,
December
2005 -
2009
2009
Increased
Root Causes
Climate
change
Shortage of
rainfall, High
temperature,
Deforestation
Climate
change
Human
diseases
December,
January,
February,
March, April
206 -
2009
2008
Increased
Shortage of
food and
clean water
Effects
Loss of
income,
Livestock
death
Vulnerability
Limited vaccination
and shortage of
animal feed
Migration,
Shortage of
water and
food, Illness
Climate change,
Dependency on
rainfall
Death of
animals,
Decrease
livestock
productivity
Illness of
workers,
Human death
Lack of awareness,
Shortage of
livestock forage and
water
Climate change,
Lack of awareness
about protection of
health
Coping Strategy
Vaccination and give
a great care for the
livestock s
Migration,
Destocking to buy
food
Use of indigenous
medicine, Roasting
of livestock body
Medical treatment
21
Page 15 of 18

Wereda Disaster
Risk Profile
National Disaster Risk Management
Commission (NDRMC)
Data_Collected_Date
March 2017
Friday, July 21, 2017
Region S.N.N.P
Zone GAMO GOFA
Wereda BONKE
Selected Indictor:
Kebele Name
KOYRA MUKULA
Disaster Characteristics By Kebele
Disaster_Type Common Period
Drought
August, July,
February, March
Year
Occured
2005,
2007,
2008,
2009
Worst_
Year
2008
Trends of
Effects
Increased
Root Causes
Climate
change
KALO GAGULA
ZEGA
Crop diseases
Drought
Landslide
Crop diseases
Drought
April, May
May, June, July,
August,
September,
October
April, August,
October,
November
October,
November,
December
August,
September, June
2006,
2007,
2008,
2009
2004,
2006,
2007,
2008
2004,
2006,
2007
2004,
2005,
2007,
2008
2001,200
2,2003,2
004,2005
,2006,20
07,2008,
2009
2007
2007
2007
2008
2004
Increased
Climate
change
Increased
Shortage of
rainfall
Increased Deforestation
Increased
Climate
change
Increased
Environmenta
l change
Effects
Vulnerability
Loss of
production,
Shortage of
food, Loss of
income
Loss of yield,
Loss of
income
Shortage of rainfall,
Deforestation
Climate change
Migration,
Dropout from
school
Climate change,
Shortage of rainfall
Crop damage
and plants
Deforestation,
Grazing land
Crop
damage,
Yield loss
Climate change,
Lack of pesticide
due to lack of fund
Shortage of
food, Loss of
income
Depend on rain feed
agriculture, Lack of
irrigation water
Coping Strategy
Change animals in
food crops, store and
save food crops for
long.
Use of pesticides
Migrate to other
place for labor work
Soil and water
conservation,
Reforestation
Use of pesticide
Destocking, Planting
of short cycle crops
22
Page 16 of 18
Wereda Disaster
Risk Profile
National Disaster Risk Management
Commission (NDRMC)
Data_Collected_Date
March 2017
Friday, July 21, 2017
Region S.N.N.P
Zone GAMO GOFA
Wereda BONKE
Selected Indictor:
Kebele Name
ZEGA
Disaster Characteristics By Kebele
Disaster_Type Common Period
Year
Worst_ Trends of
Occured Year Effects
Root Causes
Crop diseases April, May
2006,200
7,2008,2
009
2009
Increased
Climate
change,
Contact with
toxic
materials
Livestock
diseases
November,
December,
February
2008,200 2009
9
Increased
Climate
change,
Shortage of
forage
Landslide
November, May
2008,200 2008
9
Decreased
High rainfall,
Climate
change
Flood
November, May,
September
2001,
2002,
2003,
2004,
2005,
2006,
2007,
2008
2008
Decreased High rainfall
Effects
Yield loss,
Loss of
income
Vulnerability
Due to climate
change
Livestock
death, Loss
of income
Due to shortage of
animal feed,
Climate change
Loss of
fertility, Loss
of farm land,
Loss of yield
Loss of farm
land, Loss of
yield
Topography,
Cracking of earth
Topography, High
rainfall
Coping Strategy
Uses of pesticides
Use of traditional
medicine,
Vaccination
Temporary migration
Soil and water
conservation,
Plantation
23
Page 17 of 18

Wereda Disaster
Risk Profile
National Disaster Risk Management
Commission (NDRMC)
Data_Collected_Date
March 2017
Friday, July 21, 2017
Region S.N.N.P
Zone GAMO GOFA
Wereda BONKE
Selected Indictor:
Kebele Name
ZAZIE
Disaster Characteristics By Kebele
Disaster_Type Common Period
Drought
December,
January,
November
Year
Occured
2005,
2006,
2007,
2008,
2009
Worst_
Year
2009
Trends of
Effects
Increased
Root Causes
Climate
change
Landslide
May, June,
September,
October
2001,
2002,
2006,
2007,
2008
2008
Increased
Topography
factors,
Unconditional
heavy rainfall
Crop diseases
September,
October
2003,
2004,
2005,
2006,
2007,
2008
2007
Increased
Climate
change
IMPORTANT: The years and months mentoned in this report are according to Ethiopian Calendar (EC).
Effects
Vulnerability
Loss of
income,
Animal
death,
Shortage of
food, an
fodder
Crop
damage,
Human
death, and
livestock
Weather condition
Heavy rainfall
Crop
damage, Loss
income
Lack of pesticides
Coping Strategy
Store food and crops
for the future use in
dry seasons.
Soil and water
conservation
Use of pesticides
24
Page 18 of 18

Wereda Disaster
Risk Profile
Data_Collected_Date
March 2017
Region S.N.N.P
Zone GAMO GOFA
Selected Indictor:
KebeleName
ZEGA
Hazards: Conflict as an Issue
Description_Of_Conflict
FADELE
GERIBANISHA GALO
GERIBANISA KARICHE
ZAZIE
GORATE
GARIBANISA SOROGE
KOLE KANCHAME
KOLE ZALE
BONKE YALA
KOYRA MUKULA
KETELE
FISHITO
DURIBE
ALGUDA
KACHA KASHISO
CHOSHA
National Disaster Risk Management
Commission (NDRMC)
Saturday, December 19, 2020
Wereda BONKE
Change_In_Last_Decade
Main_Causes_Of_Conflict
25
Page 1 of 2
Wereda Disaster
Risk Profile
Data_Collected_Date
March 2017
Region S.N.N.P
Zone GAMO GOFA
Selected Indictor:
KebeleName
KAMELE BARIE ORO
Hazards: Conflict as an Issue
Description_Of_Conflict
KALIBO LAKA
GEZESO
DENBILE OSA
DESHKELE
KALO GAGULA
GERASE ZALA
KALO GAGULA
DEMBILE OTORA
KOSHALE
GOBO BAKE
KEBELE 01
National Disaster Risk Management
Commission (NDRMC)
Saturday, December 19, 2020
Wereda BONKE
Change_In_Last_Decade
Main_Causes_Of_Conflict
26
Page 2 of 2

Wereda Disaster Risk
Profile
Data_Collected_Date
March 2017
National Disaster Risk Management
Commission (NDRMC)
Saturday, December 19, 2020
Region S.N.N.P
Zone
GAMO GOFA
Wereda
BONKE
Selected Indicator: Hazard Situation During Last Disaster - Characteristics of most recent disasters that affected the community
KebeleName
Types of Disasters
Hazard_Description
Effect_Of_Disaster
Most_Severly_Affected
Reason
ALGUDA
BONKE YALA
Crop disease
Crop disease
CHOSHA
Crop disease
DENBILE OSA
Drought
DEMBILE OTORA
Drought
DESHKELE
Drought
DURIBE
Drought
FADELE
Drought
Half of the community was affected
for 5 years.
Majority of the community was
affected for 2 years continuously.
Majority of the community was
affected for 5 years, severity
increased.
Magnitude, Duration, and severity
increased, there is food and water
shortage.
Majority of the community was
affected for 4 years.
All of the community was affected for
3 years continuously.
70% of the community was affected
for 4 years due to shortage of food
and income loss.
75% of the community severely
affected each years for 2 seasons for
4 years, extent and severity is
increased.
27
Shortage of food
Loss of production,
Shortage of food,
Migration
Loss of yield, Loss of
income
Shortage of food, Loss
of yield
Shortage of food and
animal feed, Human
and livestock disease
Yield loss, Shortage of
food and animal feed,
Shortage of water.
Shortage of food and
water, Livestock
pasture decreased,
Loss of income
Shortage of food and
water, Yield loss, Loss
of income, Migration
Lactating women,
Children and Elder
Lactating women,
Children and Elders
Elders, Children and
Women
Lactating women, Loss
of yield
Children, Lactating
women, Elders
Elders, Children, and
Lactate women
Children, Elders, Lactate
women
Women and children
Lack of capacity
They have no
capacity to labor
work
Lack of capacity
They are highly
dependent on
others
Lack of capacity
Lack of capacity
and they are
dependent on
others
Lack of capacity
Lack of capacity,
dependency on
others
Page 1 of 5

Wereda Disaster Risk
Profile
Data_Collected_Date
March 2017
National Disaster Risk Management
Commission (NDRMC)
Saturday, December 19, 2020
Region S.N.N.P
Zone
GAMO GOFA
Wereda
BONKE
Selected Indicator: Hazard Situation During Last Disaster - Characteristics of most recent disasters that affected the community
KebeleName
Types of Disasters
Hazard_Description
Effect_Of_Disaster
Most_Severly_Affected
Reason
FISHITO
GARIBANISA
SOROGE
Drought
Land slide
GERASE ZALA
Drought
GERIBANISA
KARICHE
Land slide
GERIBANISHA GALO
Drought
GEZESO
Crop disease (Rust)
2/3 of the population was affected
for 8 years and the severity increased
Half of the community was affected
for 4 years and the extent is
increased.
All of the community was affected for
3 years continuously.
The community was affected for 3
years continuously, extent increased
and 35% of the community was
affected.
90% of the population are affected
for 6 years, and the frequency
increased because of climate change.
High magnitude, Duration for short
time and severity is increased.
Migration, Shortage of
water, Loss of income,
Loss of livestock feed
Migration, Human
death, Shortage of
food, Livestock death
Elders, Children, Lactate
women
Women and Children
Yield loss, Shortage of
water, human food
and livestock pasture,
Human and livestock
disease
Human death,
Shortage of food,
Migration, Loss of
income
Migration, Human
death, Shortage of
food, Death of
livestock, Loss of
income, Malnutrition
Shortage of food, Loss
of crop production
Children and Lactate
women
Children, Elders and
lactate women
Lactate women,
Children, Elders
Children, Elders and
women
Lack of capacity
They are highly
dependent on
others due to their
lack of capacity to
work.
Lack of capacity for
work
Lack of capacity
They have no
capacity to do labor
work and they are
dependent on
others.
Lack of capacity
28
Page 2 of 5

Wereda Disaster Risk
Profile
Data_Collected_Date
March 2017
National Disaster Risk Management
Commission (NDRMC)
Saturday, December 19, 2020
Region S.N.N.P
Zone
GAMO GOFA
Wereda
BONKE
Selected Indicator: Hazard Situation During Last Disaster - Characteristics of most recent disasters that affected the community
KebeleName
GOBO BAKE
Types of Disasters
Crop disease
GORATE
Drought
KALIBO LAKA
Crop disease
KALO GAGULA
KAMELE BARIE ORO
Crop disease
Drought
KEBELE 01
Drought
KACHA KASHISO
Flood
Hazard_Description
Majority of the community was
affected.
Half of the community is affected for
5 years and the severity is increased.
75% of the population was affected
for 5 years.
Majority of the population was
affected for 3 years.
Majority of the community was
affected for 9 years, severity is
increased.
60% of the population was affected
for 3 years.
75% of the population was affected.
Effect_Of_Disaster
Migration, Yield loss
and shortage of food
Most_Severly_Affected
Lactating women, Elders
and Children
Yield loss,
Productivity
decreased, Shortage
of food and animal
pasture
Loss of yield, Shortage
of food, Migration
Lactate women,
Children, Elders
Lactating women,
Children, and Elders
Loss of yield, Shortage
of food, Migration
Shortage of food, loss
of yield, income loss,
migration
Human disease,
Livestock death due to
shortage of food and
water.
Loss of income
Lactating women,
Children and Elders
Lactating women,
Children, and Elder
Lactating women,
Children
Children, Elder, Women
Reason
Lack of capacity,
and they are
dependent on
others
Lack of capacity to
labor work and they
are highly
dependent on
others.
Lack of capacity
and dependency on
others
Lack of capacity
Lack of capacity
Lack of capacity
Lack of capacity
KETELE
Drought
90% of the community was affected
for 5 years continuously, there was
severe shortage of water problem.
Shortage of food,
Migration, Livestock
death, Human disease
Women and children
Lack of capacity to
do labor work
29
Page 3 of 5
Wereda Disaster Risk
Profile
Data_Collected_Date
March 2017
National Disaster Risk Management
Commission (NDRMC)
Saturday, December 19, 2020
Region S.N.N.P
Zone
GAMO GOFA
Wereda
BONKE
Selected Indicator: Hazard Situation During Last Disaster - Characteristics of most recent disasters that affected the community
KebeleName
Types of Disasters
Hazard_Description
Effect_Of_Disaster
Most_Severly_Affected
Reason
KOLE KANCHAME
Crop diseases
KOLE ZALE
Crop disease
KOSHALE
Drought
KOYRA MUKULA
Drought
KALO GAGULA
Drought
ZEGA
Drought
80% of the community was affected
for 10 years continuously.
Majority of the community is affected
for 8 years in loss of yield due to crop
damage.
All of the community was affected for
6 years
75% of the community was vulnerable
to drought for 4 years.
80% of the community was affected
for 5 years and severity is increased.
The magnitude is increased for long
years, duration for one year,
intensity is in all community, severity
is increased.
Crop damage, yield
loss, food shortage,
Migration
Yield loss, Migration,
Food shortage
Migration, Shortage of
food, and water,
Livestock death
Shortage of food, Loss
of yield, Livestock
death, Loss of income
Migration, Shortage of
food due to crop
damage, Low income,
Low productivity
Migration, food
shortage, water
shortage, loss of
income
Lactate women,
Children
Lactating woman and
children
Lactating women and
Children
Lactate women,
Children
Children, Lactate
women, Elders
Elders, Women, Children
Lack of capacity
and they are
dependent on
others.
Lack of capacity for
labor work and they
are dependent on
others.
Lack of capacity
and their
dependency on
others.
Lack of capacity
and they are
dependent on
others
Dependency on
other workers
Lack of capacity,
their dependency
on others
30
Page 4 of 5
Wereda Disaster Risk
Profile
Data_Collected_Date
March 2017
National Disaster Risk Management
Commission (NDRMC)
Saturday, December 19, 2020
Region S.N.N.P
Zone
GAMO GOFA
Wereda
BONKE
Selected Indicator: Hazard Situation During Last Disaster - Characteristics of most recent disasters that affected the community
KebeleName
ZAZIE
Types of Disasters
Drought
Hazard_Description
Shortage of rain for 5 years and 3/4
of the community affected, extent
increased
Effect_Of_Disaster
Shortage of food, Loss
of income
Most_Severly_Affected
Children, Elders, Lactate
women
Reason
Lack of capacity
and dependency on
others.
31
Page 5 of 5
Data_Collected_Date
March 2017
Region S.N.N.P
Zone GAMO GOFA
Selected Indictor: Frequency of Disaster Occurrence
Wereda
Saturday, December 19, 2020
BONKE
Crop diseases
Drought
Flood
Frost / Cold waves
Heat waves/ High temp
Heavy Rain
Human diseases
Landslide
Livestock diseases
No Disaster
Road Accident
Storms / hail storm
14.14
12.30
21.92
50.00
23.81
19.40
20.00
16.67
8.00
33.33
100.00
100.00
24.75
28.97
23.29
50.00
4.76
13.43
35.38
11.90
21.60
33.33
20.71
18.25
21.23
4.76
22.39
21.54
26.19
16.00
33.33
40.40
40.48
33.56
66.67
44.78
23.08
45.24
54.40
32
Page 1 of 1

Data_Collected_Date
March 2017
Region S.N.N.P
Zone GAMO GOFA
Selected Indictor: Household Exposure to Hazards
Disaster Type
Drought
Crop diseases
Flood
Livestock diseases
Heavy Rain
Human diseases
Landslide
Heat waves/ High temp
Frost / Cold waves
Conflicts
Storms / hail storm
No Disaster
No Disaster
Forest Fires
Road Accident
Saturday, December 19, 2020
Wereda BONKE
General_Exposure
22.98
18.83
15.48
13.45
11.25
7.66
5.46
3.18
0.41
0.33
0.33
0.33
0.16
0.08
0.08
Last_Five_Years_Exposure
26.47
21.45
16.04
13.62
8.02
6.76
4.73
2.13
0.29
0.10
0.29
0.10
33
Page 1 of 1
Wereda Disaster
Risk Profile
Data_Collected_Date
March 2017
Region S.N.N.P
Selected Indictor:
Zone GAMO GOFA
Months of Occurrence of Frequent Disasters
National Disaster Risk Management
Commission (NDRMC)
Saturday, December 19, 2020
Wereda BONKE
Crop diseases
Drought
Flood
Frost / Cold waves
Heat waves/ High temp
Heavy Rain
Human diseases
Landslide
Livestock diseases
No Disaster
Road Accident
Storms / hail storm
2.65
25.17
23.18
18.54
4.64
5.30
5.30
9.93
3.97
0.66
0.66
0.53
4.23
6.88
21.16
23.28
26.98
5.82
4.76
1.06
0.53
2.65
2.12
2.27
28.41
28.41
2.27
5.68
3.41
3.41
23.86
1.14
1.14
100.00
5.56
16.67
38.89
33.33
5.56
9.43
24.53
11.32
1.89
1.89
7.55
41.51
1.89
5.56
16.67
25.00
22.22
11.11
8.33
5.56
2.78
2.78
5.88
26.47
11.76
5.88
2.94
5.88
38.24
2.94
1.20
9.64
3.61
15.66
20.48
27.71
13.25
6.02
2.41
100.00
100.00
100.00
34
Page 1 of 1
Data_Collected_Date March 2017
Saturday, December 19, 2020
Region S.N.N.P
Zone GAMO GOFA
Wereda BONKE
Selected Indictor:
Conflicts: Perception of households on conflict issues - Is conflict an issue in this
community?
Is Conflict an Issue in Community?
Response_Percent
Yes
1.30
No
98.18
DK
0.52
Is Conflict an Issue in Community?
DK
Yes
0.5
1.3
DK 0.5 0.5%
No 98.2 98.2%
Yes 1.3 1.3%
Total: 100 100.0%
No
98.2
35
Page 1 of 1
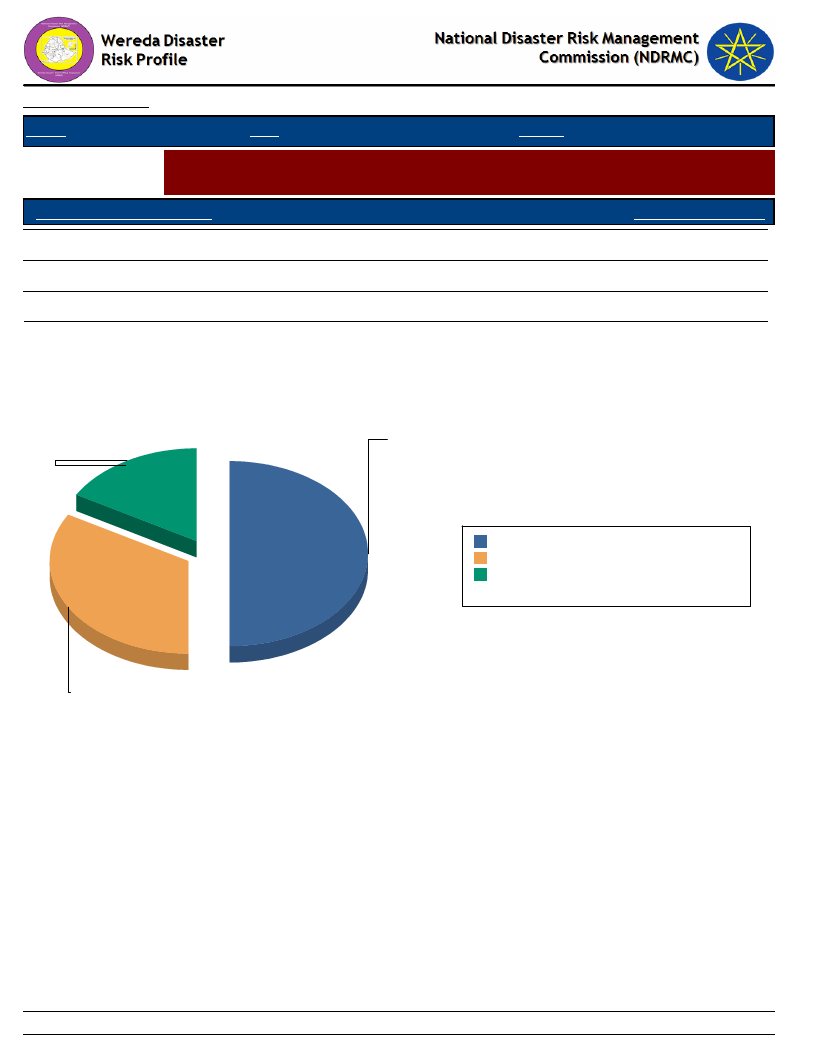
Data_Collected_Date
Region S.N.N.P
March 2017
Zone GAMO GOFA
Wereda BONKE
Friday, July 21, 2017
Selected Indictor:
Conflicts: Perception of households on conflict issues - Who To Turn To in case
of Conflict?
Who To Turn During Conflict?
Response_Percentage
Elders
33.33
Amakaris
50.00
Regional representatives
16.67
Who To Turn During Conflict?
Regional
representatives
17
Amakaris
50
Amakaris
50 50.0%
Elders
33 33.3%
Regional representatives 17 16.7%
Total:
100 100.0%
Elders
33
36
Page 1 of 1
Data_Collected_Date
Region S.N.N.P
March 2017
Zone GAMO GOFA
Wereda BONKE
Friday, July 21, 2017
Selected Indictor: Losses from Disasters - Losses from all disasters (household response in %)
Type of Loss
Main_Loss_Percent
Secondary_Loss_Percent
Physical damages on houses and property
9.49
4.19
Crop damage
50.20
8.38
Livestock damage
15.91
22.25
Death of household members
1.19
0.79
Illness/health problems
6.32
1.57
Loss of access to social services, including school
0.10
0.79
Loss of income
10.08
38.74
Loss of savings
0.10
2.62
Livestock were stolen
0.20
0.26
Lost access to grazing land
3.26
12.30
Lost access to water source
1.98
4.97
Had to flee/change residence area
0.40
1.83
Other losses/damages
0.79
1.31
37
Page 1 of 1

Wereda Disaster
Risk Profile
National Disaster Risk Management
Commission (NDRMC)
Data_Collected_Date
Region S.N.N.P
March 2017
Zone GAMO GOFA
Wereda BONKE
Friday, July 21, 2017
Selected Indictor: Losses from Disasters - Main Losses by Type of Disasters (household response in %)
Type of Loss
Type of Disasters which mainly caused Listed Losses
Crop damage
Death of household
members
Had to flee/change
residence area
Illness/health problems
Livestock damage
38
Page 1 of 3

Wereda Disaster
Risk Profile
National Disaster Risk Management
Commission (NDRMC)
Data_Collected_Date
Region S.N.N.P
March 2017
Zone GAMO GOFA
Wereda BONKE
Friday, July 21, 2017
Selected Indictor: Losses from Disasters - Main Losses by Type of Disasters (household response in %)
Type of Loss
Type of Disasters which mainly caused Listed Losses
Livestock were stolen
Loss of access to social
services, including
school
Loss of income
Loss of savings
Lost access to grazing
land
39
Page 2 of 3

Wereda Disaster
Risk Profile
National Disaster Risk Management
Commission (NDRMC)
Data_Collected_Date
Region S.N.N.P
March 2017
Zone GAMO GOFA
Wereda BONKE
Friday, July 21, 2017
Selected Indictor: Losses from Disasters - Main Losses by Type of Disasters (household response in %)
Type of Loss
Type of Disasters which mainly caused Listed Losses
Lost access to water
source
Other losses/damages
Physical damages on
houses and property
40
Page 3 of 3
Wereda Disaster Risk
Profile
Data_Collected_Date
Region S.N.N.P
March 2017
Zone GAMO GOFA
National Disaster Risk Management
Commission (NDRMC)
Wereda BONKE
Friday, July 21, 2017
Selected Indictor: Losses from Disasters - Secondary Losses by Type of Disasters (household response in %)
Type of Loss
Type of Disasters which caused Listed Secondary Losses
Crop damage
Death of household
members
Had to flee/change
residence area
Illness/health problems
Livestock damage
13.11
4.14
4.44
0.69
1.64
51.03
4.44
13.16
18.18
38.46
5.36
100.00
2.63
18.18
20.00
5.26
7.69
1.79
10.00
2.63
36.36
30.00
7.69
7.14
41
Page 1 of 3

Wereda Disaster Risk
Profile
Data_Collected_Date
Region S.N.N.P
March 2017
Zone GAMO GOFA
National Disaster Risk Management
Commission (NDRMC)
Wereda BONKE
Friday, July 21, 2017
Selected Indictor: Losses from Disasters - Secondary Losses by Type of Disasters (household response in %)
Type of Loss
Type of Disasters which caused Listed Secondary Losses
Livestock were stolen
Loss of access to social
services, including school
Loss of income
Loss of savings
Lost access to grazing land
2.63
1.64
10.00
9.09
73.77
16.55
51.11
100.00
20.00
26.32
9.09
7.69
73.21
1.64
6.67
5.26
23.08
3.28
14.48
20.00
10.00
28.95
5.36
42
100.00
Page 2 of 3
Wereda Disaster Risk
Profile
Data_Collected_Date
Region S.N.N.P
March 2017
Zone GAMO GOFA
National Disaster Risk Management
Commission (NDRMC)
Wereda BONKE
Friday, July 21, 2017
Selected Indictor: Losses from Disasters - Secondary Losses by Type of Disasters (household response in %)
Type of Loss
Type of Disasters which caused Listed Secondary Losses
Lost access to water source
Other losses/damages
Physical damages on houses
and property
11.03
4.44
4.92
2.07
8.89
5.36
5.26
1.79
7.89
9.09
15.38
43
Page 3 of 3

Wereda Disaster
Risk Profile
Data_Collected_Date
March 2017
National Disaster Risk Management
Commission (NDRMC)
Friday, July 21, 2017
Region S.N.N.P
Zone GAMO GOFA
Wereda BONKE
Selected Indictor: Seasonal Calendar for Hazards, Activities and Income Level By Kebele
Month of Hazard
Major_Problems /Disasters
Hazard Severity
Rank
Agricultural_Activities
Kebele Name ALGUDA
E - Jan (Tir)
Shortage of clean water
2
Harvesting, Land preparation
Income
Level Rank
2nd
F - Feb (Yekatit)
Shortage of water
3
Land preparation
1st
G - Mar (Megabit)
Shortage of water and livestock pasture
3
Land preparation
3rd
H - Apr (Meazea)
Soil erosion
2
Crop sowing
6th
I - May (Ginbot)
Soil erosion, Crop disease (Potato rust)
3
Plantation
7th
J - Jun (Sene)
Crop disease (Potato rust)
2
Harvesting
9th
K - Jul (Hamle)
Shortage of food
3
Land preparation
11th
L - Aug (Nehase)
Shortage of food
3
Land preparation
12th
A - Sep (Meskerem)
Lack of fund
2
crop sowing
10th
B - Oct (Tikimt)
Shortage of food
3
Weeding
8th
C - Nov (Hidar)
Shortage of food
3
Weeding
5th
D - Dec (Tahsas)
Crop disease
2
Harvesting
4th
NOTE: Hazard Severity Rank helps prioritize the more severe hazards that have occurred in the months of disaster occurrence, 3 being the worst and 1
the least severe hazards.
44
Page 1 of 29

Wereda Disaster
Risk Profile
Data_Collected_Date
March 2017
National Disaster Risk Management
Commission (NDRMC)
Friday, July 21, 2017
Region S.N.N.P
Zone GAMO GOFA
Wereda BONKE
Selected Indictor: Seasonal Calendar for Hazards, Activities and Income Level By Kebele
Month of Hazard
Major_Problems /Disasters
Hazard Severity
Rank
Agricultural_Activities
Kebele Name CHOSHA
E - Jan (Tir)
Livestock disease
---------
Crop sowing (potato), Harvesting (Barley)
Income
Level Rank
2nd
F - Feb (Yekatit)
Shortage of animal feed and water, Livestock disease
3
Crop sowing (potato)
3rd
G - Mar (Megabit)
Shortage of animal feed and water, Livestock disease
3
Weeding (potato)
9th
H - Apr (Meazea)
Shortage of animal feed and water, Livestock disease
3
Planting of tree
5th
I - May (Ginbot)
Shortage of animal feed and water
2
Harvesting (potato), and Crop sowing
4th
J - Jun (Sene)
Crop disease(potato and Inset)
2
Land preparation (Wheat, Barley)
6th
K - Jul (Hamle)
Crop disease(potato and Inset)
3
Land preparation and crop sowing
7th
L - Aug (Nehase)
---------
Crop sowing
8th
A - Sep (Meskerem)
Human disease (scabies)
3
Weeding and crop sowing (potato)
10th
B - Oct (Tikimt)
Human disease (scabies)
3
Weeding
10th
C - Nov (Hidar)
Crop disease(wheat)
3
Weeding and Crop sowing (potato)
12th
D - Dec (Tahsas)
Crop disease(wheat)
3
Crop sowing (potato)
1st
NOTE: Hazard Severity Rank helps prioritize the more severe hazards that have occurred in the months of disaster occurrence, 3 being the worst and 1
the least severe hazards.
45
Page 2 of 29

Wereda Disaster
Risk Profile
Data_Collected_Date
March 2017
National Disaster Risk Management
Commission (NDRMC)
Friday, July 21, 2017
Region S.N.N.P
Zone GAMO GOFA
Wereda BONKE
Selected Indictor: Seasonal Calendar for Hazards, Activities and Income Level By Kebele
Month of Hazard
Major_Problems /Disasters
Hazard Severity
Rank
Agricultural_Activities
Kebele Name DEMBILE OTORA
E - Jan (Tir)
Shortage of water and animal feed
3
Harvesting (maize), Land preparation
Income
Level Rank
1st
F - Feb (Yekatit)
Shortage of water, Human disease
3
Soil and water conservation, store animal feed
7th
G - Mar (Megabit)
Shortage of water and animal feed, Human disease
3
Crop sowing (maize)
5th
H - Apr (Meazea)
Human disease, Livestock disease
2
Crop sowing (maize)
6th
I - May (Ginbot)
Livestock disease
2
Weeding
4th
J - Jun (Sene)
Human disease (malaria)
2
Weeding
12th
K - Jul (Hamle)
1
Land preparation and harvesting
8th
L - Aug (Nehase)
1
Crop sowing (teff and maize)
9th
A - Sep (Meskerem)
1
Weeding
11th
B - Oct (Tikimt)
Drought
3
Weeding
9th
C - Nov (Hidar)
Drought, High temperature
3
Harvesting (teff)
3rd
D - Dec (Tahsas)
Drought
3
Harvesting (teff)
2nd
NOTE: Hazard Severity Rank helps prioritize the more severe hazards that have occurred in the months of disaster occurrence, 3 being the worst and 1
the least severe hazards.
46
Page 3 of 29

Wereda Disaster
Risk Profile
Data_Collected_Date
March 2017
National Disaster Risk Management
Commission (NDRMC)
Friday, July 21, 2017
Region S.N.N.P
Zone GAMO GOFA
Wereda BONKE
Selected Indictor: Seasonal Calendar for Hazards, Activities and Income Level By Kebele
Month of Hazard
Major_Problems /Disasters
Hazard Severity
Rank
Agricultural_Activities
Kebele Name DENBILE OSA
E - Jan (Tir)
Shortage of water
3
Land preparation
Income
Level Rank
2nd
F - Feb (Yekatit)
Human disease (Diarrhea)
1
Land preparation, Harvesting
1st
G - Mar (Megabit)
Shortage of water
3
Crop sowing
6th
H - Apr (Meazea)
Human disease (Malaria), Drought
3
Crop sowing
12th
I - May (Ginbot)
Human disease (Malaria), Drought
2
Weeding
11th
J - Jun (Sene)
Livestock diseases
1
Land preparation
10th
K - Jul (Hamle)
Livestock diseases
1
Crop sowing
8th
L - Aug (Nehase)
Shortage of water, Human disease (Malaria)
3
Crop sowing
7th
A - Sep (Meskerem)
Shortage of water
2
Crop sowing
9th
B - Oct (Tikimt)
Livestock diseases
1
Weeding
5th
C - Nov (Hidar)
Livestock diseases
2
Harvesting
4th
D - Dec (Tahsas)
Shortage of water
1
Harvesting
3rd
NOTE: Hazard Severity Rank helps prioritize the more severe hazards that have occurred in the months of disaster occurrence, 3 being the worst and 1
the least severe hazards.
47
Page 4 of 29

Wereda Disaster
Risk Profile
Data_Collected_Date
March 2017
National Disaster Risk Management
Commission (NDRMC)
Friday, July 21, 2017
Region S.N.N.P
Zone GAMO GOFA
Wereda BONKE
Selected Indictor: Seasonal Calendar for Hazards, Activities and Income Level By Kebele
Month of Hazard
Major_Problems /Disasters
Hazard Severity
Rank
Agricultural_Activities
Kebele Name DESHKELE
E - Jan (Tir)
Shortage of animal feed
2
Harvesting, Land preparation
Income
Level Rank
2nd
F - Feb (Yekatit)
Shortage of animal feed and water
3
Crop sowing (Maize)
1st
G - Mar (Megabit)
Shortage of animal food
3
Weeding
4th
H - Apr (Meazea)
Shortage of animal food
3
Crop sowing (Inset and Irish potato)
5th
I - May (Ginbot)
Shortage of animal food
3
Land preparation
7th
J - Jun (Sene)
Shortage of animal food
3
Land preparation
8th
K - Jul (Hamle)
Shortage of animal food
2
Crop sowing (Wheat and Barley)
10th
L - Aug (Nehase)
1
Crop sowing (Barley)
8th
A - Sep (Meskerem)
1
Weeding
11th
B - Oct (Tikimt)
Migration, Shortage of animal food
3
Weeding
12th
C - Nov (Hidar)
Migration, Shortage of animal food
3
Crop sowing (Potato and Inset)
6th
D - Dec (Tahsas)
1
Crop sowing (Potato)
3rd
NOTE: Hazard Severity Rank helps prioritize the more severe hazards that have occurred in the months of disaster occurrence, 3 being the worst and 1
the least severe hazards.
48
Page 5 of 29

Wereda Disaster
Risk Profile
Data_Collected_Date
March 2017
National Disaster Risk Management
Commission (NDRMC)
Friday, July 21, 2017
Region S.N.N.P
Zone GAMO GOFA
Wereda BONKE
Selected Indictor: Seasonal Calendar for Hazards, Activities and Income Level By Kebele
Month of Hazard
Major_Problems /Disasters
Hazard Severity
Rank
Agricultural_Activities
Kebele Name DIMELE FUSE
E - Jan (Tir)
Shortage of water
1
Land preparation, Harvesting
Income
Level Rank
1st
F - Feb (Yekatit)
Shortage of animal forage
2
Crop sowing
5th
G - Mar (Megabit)
Shortage of water
3
Crop sowing
10th
H - Apr (Meazea)
Shortage of water
2
Crop sowing and Weeding
7th
I - May (Ginbot)
Livestock disease
3
Weeding, Harvesting
3rd
J - Jun (Sene)
Drought
3
Land preparation
12th
K - Jul (Hamle)
Drought
2
Crop sowing, Harvesting
11th
L - Aug (Nehase)
Drought
3
Weeding, Crop sowing
9th
A - Sep (Meskerem)
Erosion
2
Weeding
8th
B - Oct (Tikimt)
Erosion
2
Harvesting
6th
C - Nov (Hidar)
Livestock disease
2
Harvesting
4th
D - Dec (Tahsas)
Human disease
2
Harvesting
2nd
NOTE: Hazard Severity Rank helps prioritize the more severe hazards that have occurred in the months of disaster occurrence, 3 being the worst and 1
the least severe hazards.
49
Page 6 of 29

Wereda Disaster
Risk Profile
Data_Collected_Date
March 2017
National Disaster Risk Management
Commission (NDRMC)
Friday, July 21, 2017
Region S.N.N.P
Zone GAMO GOFA
Wereda BONKE
Selected Indictor: Seasonal Calendar for Hazards, Activities and Income Level By Kebele
Month of Hazard
Major_Problems /Disasters
Hazard Severity
Rank
Agricultural_Activities
Kebele Name DURIBE
E - Jan (Tir)
Drought
2
Harvesting, Land preparation
Income
Level Rank
1st
F - Feb (Yekatit)
Drought
2
Land preparation
2nd
G - Mar (Megabit)
Drought
3
Crop sowing
4th
H - Apr (Meazea)
Shortage of water, food and forage
3
Weeding
12th
I - May (Ginbot)
Shortage of food
3
Weeding
11th
J - Jun (Sene)
Shortage of food
3
Crop sowing (Sweet potato)
10th
K - Jul (Hamle)
Shortage of food
3
Crop sowing (Sweet potato)
7th
L - Aug (Nehase)
Shortage of food
3
Land preparation
4th
A - Sep (Meskerem)
---------
Crop sowing
5th
B - Oct (Tikimt)
Livestock disease
2
Crop sowing, Weeding
6th
C - Nov (Hidar)
Shortage of food
2
Land preparation
8th
D - Dec (Tahsas)
Human disease
2
Harvesting
3rd
NOTE: Hazard Severity Rank helps prioritize the more severe hazards that have occurred in the months of disaster occurrence, 3 being the worst and 1
the least severe hazards.
50
Page 7 of 29

Wereda Disaster
Risk Profile
Data_Collected_Date
March 2017
National Disaster Risk Management
Commission (NDRMC)
Friday, July 21, 2017
Region S.N.N.P
Zone GAMO GOFA
Wereda BONKE
Selected Indictor: Seasonal Calendar for Hazards, Activities and Income Level By Kebele
Month of Hazard
Major_Problems /Disasters
Hazard Severity
Rank
Agricultural_Activities
Kebele Name FADELE
E - Jan (Tir)
Shortage of rain, Shortage of forage
1
Land preparation, Harvesting
Income
Level Rank
1st
F - Feb (Yekatit)
Shortage of water, Shortage of food
2
Land preparation
2nd
G - Mar (Megabit)
Shortage of water, Shortage of food
3
Crop sowing, Land preparation
6th
H - Apr (Meazea)
Shortage of water, Shortage of food
2
Weeding
7th
I - May (Ginbot)
Shortage of forage
2
Land preparation, Weeding
12th
J - Jun (Sene)
Shortage of forage
3
Harvesting, Land preparation
11th
K - Jul (Hamle)
Drought
3
Land preparation
10th
L - Aug (Nehase)
Shortage of rain
2
Land preparation
9th
A - Sep (Meskerem)
Shortage of rain, Shortage of food
3
Weeding
8th
B - Oct (Tikimt)
Shortage of fund, Shortage of rain
2
Weeding
5th
C - Nov (Hidar)
Drought
3
Harvesting
4th
D - Dec (Tahsas)
Drought
3
Harvesting
3rd
NOTE: Hazard Severity Rank helps prioritize the more severe hazards that have occurred in the months of disaster occurrence, 3 being the worst and 1
the least severe hazards.
51
Page 8 of 29

Wereda Disaster
Risk Profile
Data_Collected_Date
March 2017
National Disaster Risk Management
Commission (NDRMC)
Friday, July 21, 2017
Region S.N.N.P
Zone GAMO GOFA
Wereda BONKE
Selected Indictor: Seasonal Calendar for Hazards, Activities and Income Level By Kebele
Month of Hazard
Major_Problems /Disasters
Hazard Severity
Rank
Agricultural_Activities
Kebele Name FISHITO
E - Jan (Tir)
Drought, Shortage of water
3
Land preparation (Harvesting)
Income
Level Rank
1st
F - Feb (Yekatit)
Shortage of water and livestock forage
2
Crop sowing
2nd
G - Mar (Megabit)
Drought
3
Crop sowing
6th
H - Apr (Meazea)
Land slide, Livestock disease
3
Weeding
9th
I - May (Ginbot)
Land slide, Livestock disease
2
Weeding
12th
J - Jun (Sene)
Shortage of food, Human disease
3
Land preparation
11th
K - Jul (Hamle)
Shortage of food
2
Land preparation
5th
L - Aug (Nehase)
High rainfall
2
Crop sowing
8th
A - Sep (Meskerem)
Shortage of rain
3
Crop sowing
4th
B - Oct (Tikimt)
Shortage of food
3
Weeding
10th
C - Nov (Hidar)
Crop disease
2
Harvesting
7th
D - Dec (Tahsas)
High rainfall
2
Harvesting
3rd
NOTE: Hazard Severity Rank helps prioritize the more severe hazards that have occurred in the months of disaster occurrence, 3 being the worst and 1
the least severe hazards.
52
Page 9 of 29

Wereda Disaster
Risk Profile
Data_Collected_Date
March 2017
National Disaster Risk Management
Commission (NDRMC)
Friday, July 21, 2017
Region S.N.N.P
Zone GAMO GOFA
Wereda BONKE
Selected Indictor: Seasonal Calendar for Hazards, Activities and Income Level By Kebele
Month of Hazard
Major_Problems /Disasters
Hazard Severity
Rank
Agricultural_Activities
Kebele Name GARIBANISA SOROGE
E - Jan (Tir)
Shortage of water
2
Crop sowing, Harvesting
Income
Level Rank
2nd
F - Feb (Yekatit)
Livestock disease
2
Crop sowing, Harvesting
1st
G - Mar (Megabit)
Livestock disease
1
Livestock activities
3rd
H - Apr (Meazea)
Flood
2
Plantation
6th
I - May (Ginbot)
Land slide
3
Crop sowing
5th
J - Jun (Sene)
Crop disease
2
Land preparation
8th
K - Jul (Hamle)
Erosion
1
Land preparation
7th
L - Aug (Nehase)
Land slide
3
Land preparation, Livestock activities
9th
A - Sep (Meskerem)
Flood
2
Crop sowing
10th
B - Oct (Tikimt)
Crop disease
2
Weeding
12th
C - Nov (Hidar)
Crop disease
3
Weeding
11th
D - Dec (Tahsas)
Land slide
1
Land preparation
4th
NOTE: Hazard Severity Rank helps prioritize the more severe hazards that have occurred in the months of disaster occurrence, 3 being the worst and 1
the least severe hazards.
53
Page 10 of 29

Wereda Disaster
Risk Profile
Data_Collected_Date
March 2017
National Disaster Risk Management
Commission (NDRMC)
Friday, July 21, 2017
Region S.N.N.P
Zone GAMO GOFA
Wereda BONKE
Selected Indictor: Seasonal Calendar for Hazards, Activities and Income Level By Kebele
Month of Hazard
Major_Problems /Disasters
Hazard Severity
Rank
Agricultural_Activities
Kebele Name GERASE ZALA
E - Jan (Tir)
Shortage of water and animal pasture
3
Land preparation, Harvesting
Income
Level Rank
2nd
F - Feb (Yekatit)
Shortage of water and food and human disease
3
Land preparation
1st
G - Mar (Megabit)
Shortage of food and animal feed, Human and livestock
3
Crop sowing
6th
disease
H - Apr (Meazea)
Human and livestock disease
3
Crop sowing
11th
I - May (Ginbot)
Livestock disease
2
Weeding
12th
J - Jun (Sene)
1
Weeding
10th
K - Jul (Hamle)
1
Harvesting (Barley), Land preparation
7th
L - Aug (Nehase)
1
Harvesting (Barley), Land preparation
8th
A - Sep (Meskerem)
1
Crop sowing
4th
B - Oct (Tikimt)
Livestock disease
2
Crop sowing
3rd
C - Nov (Hidar)
Livestock disease
2
Weeding
9th
D - Dec (Tahsas)
Livestock disease
2
Harvesting (teff and wheat)
5th
NOTE: Hazard Severity Rank helps prioritize the more severe hazards that have occurred in the months of disaster occurrence, 3 being the worst and 1
the least severe hazards.
54
Page 11 of 29

Wereda Disaster
Risk Profile
Data_Collected_Date
March 2017
National Disaster Risk Management
Commission (NDRMC)
Friday, July 21, 2017
Region S.N.N.P
Zone GAMO GOFA
Wereda BONKE
Selected Indictor: Seasonal Calendar for Hazards, Activities and Income Level By Kebele
Month of Hazard
Major_Problems /Disasters
Hazard Severity
Rank
Agricultural_Activities
Kebele Name GERIBANISA KARICHE
E - Jan (Tir)
Unseasonal high rainfall
2
Harvesting
Income
Level Rank
3rd
F - Feb (Yekatit)
Unseasonal high rainfall
2
Land preparation
1st
G - Mar (Megabit)
Erosion
2
Land preparation
6th
H - Apr (Meazea)
Land slide
3
Plantation
7th
I - May (Ginbot)
Potato rust
2
Crop sowing (potato)
2nd
J - Jun (Sene)
Crop damage
2
Land preparation
5th
K - Jul (Hamle)
Erosion
2
Crop sowing (wheat)
8th
L - Aug (Nehase)
Erosion
2
Crop sowing (barley)
9th
A - Sep (Meskerem)
Erosion
2
Weeding
11th
B - Oct (Tikimt)
Land slide
2
Weeding
12th
C - Nov (Hidar)
Land slide
2
Crop sowing (potato)
10th
D - Dec (Tahsas)
Rust
2
Harvesting
4th
NOTE: Hazard Severity Rank helps prioritize the more severe hazards that have occurred in the months of disaster occurrence, 3 being the worst and 1
the least severe hazards.
55
Page 12 of 29

Wereda Disaster
Risk Profile
Data_Collected_Date
March 2017
National Disaster Risk Management
Commission (NDRMC)
Friday, July 21, 2017
Region S.N.N.P
Zone GAMO GOFA
Wereda BONKE
Selected Indictor: Seasonal Calendar for Hazards, Activities and Income Level By Kebele
Month of Hazard
Major_Problems /Disasters
Hazard Severity
Rank
Agricultural_Activities
Kebele Name GERIBANISHA GALO
E - Jan (Tir)
Drought
3
Harvesting
Income
Level Rank
2nd
F - Feb (Yekatit)
Livestock disease
1
Harvesting
1st
G - Mar (Megabit)
Climate change
2
Crop sowing
5th
H - Apr (Meazea)
Unseasonal rainfall
3
Tree planting
7th
I - May (Ginbot)
Flood
2
Tree planting
11th
J - Jun (Sene)
Drought
2
Land preparation
8th
K - Jul (Hamle)
Unseasonal rainfall
2
Land preparation, Livestock activities
3rd
L - Aug (Nehase)
Flood
3
Crop sowing
9th
A - Sep (Meskerem)
Land slide
2
Weeding
10th
B - Oct (Tikimt)
Crop disease
3
Weeding
12th
C - Nov (Hidar)
Crop disease, Flood
2
Livestock activities
4th
D - Dec (Tahsas)
Unseasonal rainfall
2
Planting of potato
6th
NOTE: Hazard Severity Rank helps prioritize the more severe hazards that have occurred in the months of disaster occurrence, 3 being the worst and 1
the least severe hazards.
56
Page 13 of 29

Wereda Disaster
Risk Profile
Data_Collected_Date
March 2017
National Disaster Risk Management
Commission (NDRMC)
Friday, July 21, 2017
Region S.N.N.P
Zone GAMO GOFA
Wereda BONKE
Selected Indictor: Seasonal Calendar for Hazards, Activities and Income Level By Kebele
Month of Hazard
Major_Problems /Disasters
Hazard Severity
Rank
Agricultural_Activities
Kebele Name GEZESO
E - Jan (Tir)
Shortage of water, grass and livestock disease
3
Crop sowing, Harvesting
Income
Level Rank
2nd
F - Feb (Yekatit)
Shortage of water, grass and livestock disease
3
Harvesting, Land preparation
1st
G - Mar (Megabit)
Shortage of water, grass and livestock disease
3
Crop sowing, Land preparation
4th
H - Apr (Meazea)
Land slide, Crop disease, Heavy rain fall
3
Crop sowing
6th
I - May (Ginbot)
Drought
3
Crop sowing, Land preparation
5th
J - Jun (Sene)
Drought
3
Land preparation
7th
K - Jul (Hamle)
1
Harvesting, Land preparation
3rd
L - Aug (Nehase)
1
Crop sowing, Land preparation
8th
A - Sep (Meskerem)
Drought
2
Crop sowing, Weeding
9th
B - Oct (Tikimt)
Drought
1
Weeding
10th
C - Nov (Hidar)
1
Weeding
12th
D - Dec (Tahsas)
1
Crop sowing
11th
NOTE: Hazard Severity Rank helps prioritize the more severe hazards that have occurred in the months of disaster occurrence, 3 being the worst and 1
the least severe hazards.
57
Page 14 of 29

Wereda Disaster
Risk Profile
Data_Collected_Date
March 2017
National Disaster Risk Management
Commission (NDRMC)
Friday, July 21, 2017
Region S.N.N.P
Zone GAMO GOFA
Wereda BONKE
Selected Indictor: Seasonal Calendar for Hazards, Activities and Income Level By Kebele
Month of Hazard
Major_Problems /Disasters
Hazard Severity
Rank
Agricultural_Activities
Kebele Name GOBO BAKE
E - Jan (Tir)
Shortage of water, Human disease
3
Harvesting
Income
Level Rank
1st
F - Feb (Yekatit)
Shortage of water and food
3
Land preparation
3rd
G - Mar (Megabit)
Shortage of water and food, Livestock disease
3
Crop sowing
7th
H - Apr (Meazea)
Shortage of water and food
3
Crop sowing
8th
I - May (Ginbot)
Shortage of food, Livestock disease
3
Weeding
12th
J - Jun (Sene)
Flood and Land slide
3
Weeding
9th
K - Jul (Hamle)
Shortage of food
2
Land preparation
6th
L - Aug (Nehase)
Shortage of food
2
Crop sowing
4th
A - Sep (Meskerem)
Livestock disease
2
Crop sowing
5th
B - Oct (Tikimt)
Crop disease
2
Weeding
9th
C - Nov (Hidar)
Flood and Crop disease
2
Crop sowing
11th
D - Dec (Tahsas)
Crop disease
2
Harvesting
2nd
NOTE: Hazard Severity Rank helps prioritize the more severe hazards that have occurred in the months of disaster occurrence, 3 being the worst and 1
the least severe hazards.
58
Page 15 of 29

Wereda Disaster
Risk Profile
Data_Collected_Date
March 2017
National Disaster Risk Management
Commission (NDRMC)
Friday, July 21, 2017
Region S.N.N.P
Zone GAMO GOFA
Wereda BONKE
Selected Indictor: Seasonal Calendar for Hazards, Activities and Income Level By Kebele
Month of Hazard
Major_Problems /Disasters
Hazard Severity
Rank
Agricultural_Activities
Kebele Name GORATE
E - Jan (Tir)
Shortage of water, and livestock pasture
2
Harvesting
Income
Level Rank
1st
F - Feb (Yekatit)
Shortage of water, and livestock pasture
2
Harvesting
2nd
G - Mar (Megabit)
Shortage of food and water
2
Land preparation, Crop sowing
4th
H - Apr (Meazea)
Heavy rain
3
Land preparation
7th
I - May (Ginbot)
Shortage of food
3
Weeding
8th
J - Jun (Sene)
Shortage of food
3
Land preparation
9th
K - Jul (Hamle)
Shortage of food
3
Crop sowing
10th
L - Aug (Nehase)
Drought
3
Crop sowing
11th
A - Sep (Meskerem)
Drought
3
Weeding
12th
B - Oct (Tikimt)
Crop disease, Food shortage
2
Weeding
6th
C - Nov (Hidar)
Crop disease, Food shortage
2
Land preparation
5th
D - Dec (Tahsas)
Crop disease
2
Harvesting
3rd
NOTE: Hazard Severity Rank helps prioritize the more severe hazards that have occurred in the months of disaster occurrence, 3 being the worst and 1
the least severe hazards.
59
Page 16 of 29

Wereda Disaster
Risk Profile
Data_Collected_Date
March 2017
National Disaster Risk Management
Commission (NDRMC)
Friday, July 21, 2017
Region S.N.N.P
Zone GAMO GOFA
Wereda BONKE
Selected Indictor: Seasonal Calendar for Hazards, Activities and Income Level By Kebele
Month of Hazard
Major_Problems /Disasters
Hazard Severity
Rank
Agricultural_Activities
Kebele Name KACHA KASHISO
E - Jan (Tir)
Shortage of water
2
Harvesting, Land preparation
Income
Level Rank
1st
F - Feb (Yekatit)
Flood
2
Crop sowing
3rd
G - Mar (Megabit)
High rainfall
3
Planting tree
6th
H - Apr (Meazea)
Flood
3
Planting tree
7th
I - May (Ginbot)
High rainfall
3
Harvesting (potato)
4th
J - Jun (Sene)
Crop disease, Shortage of food
3
Land preparation
5th
K - Jul (Hamle)
Crop disease (potato)
2
Land preparation
10th
L - Aug (Nehase)
Shortage of food
2
Crop sowing
9th
A - Sep (Meskerem)
Crop disease
3
Crop sowing
8th
B - Oct (Tikimt)
Crop disease
3
Weeding
12th
C - Nov (Hidar)
Shortage of food
3
Land preparation
11th
D - Dec (Tahsas)
Livestock disease
2
Harvesting
2nd
NOTE: Hazard Severity Rank helps prioritize the more severe hazards that have occurred in the months of disaster occurrence, 3 being the worst and 1
the least severe hazards.
60
Page 17 of 29

Wereda Disaster
Risk Profile
Data_Collected_Date
March 2017
National Disaster Risk Management
Commission (NDRMC)
Friday, July 21, 2017
Region S.N.N.P
Zone GAMO GOFA
Wereda BONKE
Selected Indictor: Seasonal Calendar for Hazards, Activities and Income Level By Kebele
Month of Hazard
Major_Problems /Disasters
Hazard Severity
Rank
Agricultural_Activities
Kebele Name KALIBO LAKA
E - Jan (Tir)
Human disease (scabies)
2
Harvesting
Income
Level Rank
1st
F - Feb (Yekatit)
Shortage of water and livestock pasture
2
Harvesting, Land preparation
3rd
G - Mar (Megabit)
Livestock death
2
Crop sowing
4th
H - Apr (Meazea)
Livestock disease
2
Weeding
7th
I - May (Ginbot)
Crop disease(Potato)
2
Weeding, Land preparation
8th
J - Jun (Sene)
Unseasonal heavy rainfall
3
Land preparation
5th
K - Jul (Hamle)
Shortage of food and water
3
Crop sowing
6th
L - Aug (Nehase)
Crop disease, Shortage of food
3
Crop sowing
10th
A - Sep (Meskerem)
Crop disease
3
Weeding
11th
B - Oct (Tikimt)
Crop disease (wheat), Food shortage
3
Weeding
12th
C - Nov (Hidar)
Shortage of food
2
Weeding
9th
D - Dec (Tahsas)
1
Harvesting
2nd
NOTE: Hazard Severity Rank helps prioritize the more severe hazards that have occurred in the months of disaster occurrence, 3 being the worst and 1
the least severe hazards.
61
Page 18 of 29
Wereda Disaster
Risk Profile
Data_Collected_Date
March 2017
National Disaster Risk Management
Commission (NDRMC)
Friday, July 21, 2017
Region S.N.N.P
Zone GAMO GOFA
Wereda BONKE
Selected Indictor: Seasonal Calendar for Hazards, Activities and Income Level By Kebele
Month of Hazard
Major_Problems /Disasters
Hazard Severity
Rank
Agricultural_Activities
Kebele Name KALO GAGULA
E - Jan (Tir)
E - Jan (Tir)
Shortage of water and livestock pasture, Livestock
death
Shortage of water and animal forage
1
Harvesting
2
Harvesting
Income
Level Rank
1st
1st
F - Feb (Yekatit)
Shortage of water and livestock pasture, Livestock
1
Harvesting, Land preparation
3rd
death
F - Feb (Yekatit)
Shortage of water and animal forage
2
Harvesting, Land preparation
2nd
G - Mar (Megabit)
Shortage of water and livestock pasture, Livestock
2
Crop sowing
4th
death
G - Mar (Megabit)
Shortage of water and animal forage
2
Land preparation
3rd
H - Apr (Meazea)
Shortage of food
3
Weeding
9th
H - Apr (Meazea)
Land slide
3
Crop sowing
8th
I - May (Ginbot)
Shortage of food, Human and livestock disease
3
Weeding, Land preparation
9th
I - May (Ginbot)
Drought
2
Crop sowing
5th
J - Jun (Sene)
Land slide, Soil erosion, Crop disease (rust)
3
Land preparation
8th
J - Jun (Sene)
Drought
2
Land preparation
6th
NOTE: Hazard Severity Rank helps prioritize the more severe hazards that have occurred in the months of disaster occurrence, 3 being the worst and 1
the least severe hazards.
62
Page 19 of 29
Wereda Disaster
Risk Profile
Data_Collected_Date
March 2017
National Disaster Risk Management
Commission (NDRMC)
Friday, July 21, 2017
Region S.N.N.P
Zone GAMO GOFA
Wereda BONKE
Selected Indictor:
Month of Hazard
K - Jul (Hamle)
Seasonal Calendar for Hazards, Activities and Income Level By Kebele
Major_Problems /Disasters
Shortage of food
Hazard Severity
Rank
2
Agricultural_Activities
Crop sowing
Income
Level Rank
5th
K - Jul (Hamle)
Drought
2
Land preparation
7th
L - Aug (Nehase)
Shortage of food
2
Crop sowing
6th
L - Aug (Nehase)
Drought
3
Crop sowing
9th
A - Sep (Meskerem)
Crop disease, Shortage of food
2
Weeding
7th
A - Sep (Meskerem)
Drought
3
Weeding
11th
B - Oct (Tikimt)
Crop disease, Shortage of food
3
Weeding
12th
B - Oct (Tikimt)
Drought
3
Weeding
12th
C - Nov (Hidar)
Crop disease
3
Weeding
11th
C - Nov (Hidar)
Crop disease
3
Weeding
9th
D - Dec (Tahsas)
Crop disease
2
Harvesting
2nd
D - Dec (Tahsas)
Crop disease
2
Harvesting
4th
Kebele Name KAMELE BARIE ORO
NOTE: Hazard Severity Rank helps prioritize the more severe hazards that have occurred in the months of disaster occurrence, 3 being the worst and 1
the least severe hazards.
63
Page 20 of 29

Wereda Disaster
Risk Profile
Data_Collected_Date
March 2017
National Disaster Risk Management
Commission (NDRMC)
Friday, July 21, 2017
Region S.N.N.P
Zone GAMO GOFA
Wereda BONKE
Selected Indictor:
Month of Hazard
E - Jan (Tir)
Seasonal Calendar for Hazards, Activities and Income Level By Kebele
Major_Problems /Disasters
Shortage of water, and livestock forage
Hazard Severity
Rank
2
Agricultural_Activities
Harvesting
Income
Level Rank
1st
F - Feb (Yekatit)
Shortage of water, and livestock forage
2
Land preparation
3rd
G - Mar (Megabit)
Shortage of water, and livestock forage
3
Land preparation
4th
H - Apr (Meazea)
Land slide
2
Tree planting
6th
I - May (Ginbot)
Shortage of food
2
Harvesting
5th
J - Jun (Sene)
Shortage of food
2
Harvesting, Land preparation
7th
K - Jul (Hamle)
Shortage of food
2
Crop sowing, Land preparation
8th
L - Aug (Nehase)
Crop disease
3
Crop sowing
9th
A - Sep (Meskerem)
Crop disease
3
Weeding
10th
B - Oct (Tikimt)
Crop disease, Food shortage
3
Weeding
11th
C - Nov (Hidar)
Human disease
3
Land preparation
12th
D - Dec (Tahsas)
Livestock disease
2
Harvesting
2nd
Kebele Name KETELE
NOTE: Hazard Severity Rank helps prioritize the more severe hazards that have occurred in the months of disaster occurrence, 3 being the worst and 1
the least severe hazards.
64
Page 21 of 29

Wereda Disaster
Risk Profile
Data_Collected_Date
March 2017
National Disaster Risk Management
Commission (NDRMC)
Friday, July 21, 2017
Region S.N.N.P
Zone GAMO GOFA
Wereda BONKE
Selected Indictor:
Month of Hazard
E - Jan (Tir)
Seasonal Calendar for Hazards, Activities and Income Level By Kebele
Major_Problems /Disasters
Shortage of water
Hazard Severity
Rank
2
Agricultural_Activities
Crop sowing, Land preparation
Income
Level Rank
6th
F - Feb (Yekatit)
Shortage of water
3
Crop sowing, Land preparation
5th
G - Mar (Megabit)
Drought
3
Crop sowing, Land preparation
4th
H - Apr (Meazea)
Drought
3
Crop sowing
9th
I - May (Ginbot)
Flood
2
Weeding
12th
J - Jun (Sene)
Human disease
3
Land preparation
10th
K - Jul (Hamle)
Human disease
3
Land preparation
10th
L - Aug (Nehase)
Shortage of water
3
Harvesting
1st
A - Sep (Meskerem)
Shortage of water
3
Harvesting
2nd
B - Oct (Tikimt)
Flood
3
Harvesting
3rd
C - Nov (Hidar)
Flood
2
Livestock activities, bee keeping
8th
D - Dec (Tahsas)
Shortage of water
2
Harvesting
7th
Kebele Name KOLE KANCHAME
NOTE: Hazard Severity Rank helps prioritize the more severe hazards that have occurred in the months of disaster occurrence, 3 being the worst and 1
the least severe hazards.
65
Page 22 of 29

Wereda Disaster
Risk Profile
Data_Collected_Date
March 2017
National Disaster Risk Management
Commission (NDRMC)
Friday, July 21, 2017
Region S.N.N.P
Zone GAMO GOFA
Wereda BONKE
Selected Indictor:
Month of Hazard
E - Jan (Tir)
Seasonal Calendar for Hazards, Activities and Income Level By Kebele
Major_Problems /Disasters
Shortage of water and animal feed
Hazard Severity
Rank
2
Agricultural_Activities
Harvesting
Income
Level Rank
1st
F - Feb (Yekatit)
Shortage of water and animal feed
2
Harvesting, Crop sowing (Potato)
2nd
G - Mar (Megabit)
Shortage of water and animal feed
3
Crop sowing
4th
H - Apr (Meazea)
Drought
3
Harvesting (potato)
5th
I - May (Ginbot)
Drought
3
Harvesting (potato)
6th
J - Jun (Sene)
Shortage of food
3
Land preparation
12th
K - Jul (Hamle)
Soil erosion, Land slide
3
Land preparation
11th
L - Aug (Nehase)
Soil erosion, Land slide
3
Crop sowing
10th
A - Sep (Meskerem)
Land slide
2
Crop sowing, Weeding
9th
B - Oct (Tikimt)
Crop disease
2
Weeding
8th
C - Nov (Hidar)
Drought, Crop disease
3
Crop sowing (Potato)
7th
D - Dec (Tahsas)
Drought, Crop disease
3
Harvesting
3rd
Kebele Name KOLE ZALE
NOTE: Hazard Severity Rank helps prioritize the more severe hazards that have occurred in the months of disaster occurrence, 3 being the worst and 1
the least severe hazards.
66
Page 23 of 29

Wereda Disaster
Risk Profile
Data_Collected_Date
March 2017
National Disaster Risk Management
Commission (NDRMC)
Friday, July 21, 2017
Region S.N.N.P
Zone GAMO GOFA
Wereda BONKE
Selected Indictor:
Month of Hazard
E - Jan (Tir)
Seasonal Calendar for Hazards, Activities and Income Level By Kebele
Major_Problems /Disasters
Shortage of water, Shortage of animal feed
Hazard Severity
Rank
2
Agricultural_Activities
Crop sowing (potato)
Income
Level Rank
2nd
F - Feb (Yekatit)
Shortage of water, Shortage of animal feed
2
Crop sowing (potato), Harvesting
10th
G - Mar (Megabit)
Shortage of animal feed
2
Crop sowing ( Irish potato), Harvesting
7th
H - Apr (Meazea)
Shortage of water, Shortage of animal feed
3
Harvesting (potato)
4th
I - May (Ginbot)
Shortage of animal feed and Livestock disease
2
Harvesting (potato)
5th
J - Jun (Sene)
Livestock disease
3
Land preparation
8th
K - Jul (Hamle)
Shortage of food
3
Land preparation
9th
L - Aug (Nehase)
Shortage of food
3
Crop sowing
3rd
A - Sep (Meskerem)
Shortage of food
2
Weeding
12th
B - Oct (Tikimt)
Crop disease
3
Weeding
11th
C - Nov (Hidar)
Crop disease
3
Weeding, crop sowing (potato)
6th
D - Dec (Tahsas)
Crop disease
2
Harvesting (Barley and wheat)
1st
Kebele Name KOSHALE
NOTE: Hazard Severity Rank helps prioritize the more severe hazards that have occurred in the months of disaster occurrence, 3 being the worst and 1
the least severe hazards.
67
Page 24 of 29

Wereda Disaster
Risk Profile
Data_Collected_Date
March 2017
National Disaster Risk Management
Commission (NDRMC)
Friday, July 21, 2017
Region S.N.N.P
Zone GAMO GOFA
Wereda BONKE
Selected Indictor:
Month of Hazard
E - Jan (Tir)
Seasonal Calendar for Hazards, Activities and Income Level By Kebele
Major_Problems /Disasters
Shortage of water
Hazard Severity
Rank
3
Agricultural_Activities
Land preparation
Income
Level Rank
10th
F - Feb (Yekatit)
Shortage of food, water and livestock forage
3
Land preparation
11th
G - Mar (Megabit)
Shortage of food, water and livestock forage
3
Crop sowing
12th
H - Apr (Meazea)
Shortage of food, water and livestock forage
3
Crop sowing
9th
I - May (Ginbot)
Shortage of food, Drought
3
Weeding
7th
J - Jun (Sene)
Shortage of food, Drought
2
Weeding
8th
K - Jul (Hamle)
Human disease
2
Harvesting
5th
L - Aug (Nehase)
Shortage of rain
2
Preparation of honey hey
6th
A - Sep (Meskerem)
Shortage of rain
3
Harvesting of honey
4th
B - Oct (Tikimt)
Human disease
3
Harvesting of honey
3rd
C - Nov (Hidar)
Human disease
3
Harvesting of honey
1st
D - Dec (Tahsas)
Shortage of water
3
Harvesting of honey
2nd
Kebele Name KOYRA MUKULA
NOTE: Hazard Severity Rank helps prioritize the more severe hazards that have occurred in the months of disaster occurrence, 3 being the worst and 1
the least severe hazards.
68
Page 25 of 29

Wereda Disaster
Risk Profile
Data_Collected_Date
March 2017
National Disaster Risk Management
Commission (NDRMC)
Friday, July 21, 2017
Region S.N.N.P
Zone GAMO GOFA
Wereda BONKE
Selected Indictor:
Month of Hazard
E - Jan (Tir)
Seasonal Calendar for Hazards, Activities and Income Level By Kebele
Major_Problems /Disasters
Shortage of animal forage
Hazard Severity
Rank
2
Agricultural_Activities
Land preparation
Income
Level Rank
1st
F - Feb (Yekatit)
Shortage of animal forage and water
3
Crop sowing
6th
G - Mar (Megabit)
Shortage of water for crop production
3
Crop sowing
8th
H - Apr (Meazea)
Crop diseases
2
Weeding
9th
I - May (Ginbot)
Crop diseases
2
Weeding, Land preparation
12th
J - Jun (Sene)
Drought, Shortage of food
3
Land preparation
11th
K - Jul (Hamle)
Drought, Shortage of food
2
Crop sowing
10th
L - Aug (Nehase)
Shortage of rain fall
3
Crop sowing
7th
A - Sep (Meskerem)
Shortage of rain fall
3
Harvesting
3rd
B - Oct (Tikimt)
Crop diseases
2
Weeding
5th
C - Nov (Hidar)
High rain fall, Climate change
3
Harvesting
4th
D - Dec (Tahsas)
Livestock disease
1
Harvesting
2nd
Kebele Name YELA
NOTE: Hazard Severity Rank helps prioritize the more severe hazards that have occurred in the months of disaster occurrence, 3 being the worst and 1
the least severe hazards.
69
Page 26 of 29

Wereda Disaster
Risk Profile
Data_Collected_Date
March 2017
National Disaster Risk Management
Commission (NDRMC)
Friday, July 21, 2017
Region S.N.N.P
Zone GAMO GOFA
Wereda BONKE
Selected Indictor:
Month of Hazard
E - Jan (Tir)
Seasonal Calendar for Hazards, Activities and Income Level By Kebele
Major_Problems /Disasters
Shortage of water
Hazard Severity
Rank
2
Agricultural_Activities
Harvesting
Income
Level Rank
4th
F - Feb (Yekatit)
Shortage of water and animal feed
2
Crop Sowing (vegetable and potato)
1st
G - Mar (Megabit)
Shortage of water and animal feed
2
Crop Sowing (potato)
3rd
H - Apr (Meazea)
Flood
3
Crop Sowing (vegetable and plant)
7th
I - May (Ginbot)
Flood, Land slide
3
Harvesting, Sowing (potato)
8th
J - Jun (Sene)
Flood
2
Land preparation
11th
K - Jul (Hamle)
Crop disease(potato)
2
Land preparation
2nd
L - Aug (Nehase)
Crop disease(potato)
2
Crop sowing
8th
A - Sep (Meskerem)
---------
Weeding
10th
B - Oct (Tikimt)
Crop disease (wheat, Barley)
3
Weeding
11th
C - Nov (Hidar)
Crop disease
3
Weeding, Crop sowing (potato)
6th
D - Dec (Tahsas)
---------
Crop Sowing (potato)
5th
Kebele Name ZAZIE
NOTE: Hazard Severity Rank helps prioritize the more severe hazards that have occurred in the months of disaster occurrence, 3 being the worst and 1
the least severe hazards.
70
Page 27 of 29

Wereda Disaster
Risk Profile
Data_Collected_Date
March 2017
National Disaster Risk Management
Commission (NDRMC)
Friday, July 21, 2017
Region S.N.N.P
Zone GAMO GOFA
Wereda BONKE
Selected Indictor:
Month of Hazard
E - Jan (Tir)
Seasonal Calendar for Hazards, Activities and Income Level By Kebele
Major_Problems /Disasters
Shortage of water, grass, Animal disease
Hazard Severity
Rank
2
Agricultural_Activities
Harvesting
Income
Level Rank
2nd
F - Feb (Yekatit)
Shortage of water, grass
2
Harvesting
1st
G - Mar (Megabit)
Animal disease
2
Crop sowing
3rd
H - Apr (Meazea)
Land slide, Erosion
2
Crop sowing
6th
I - May (Ginbot)
Land slide, Erosion
2
Crop sowing
7th
J - Jun (Sene)
Land slide, Erosion, Drought
3
Land preparation, Harvesting
5th
K - Jul (Hamle)
Drought
2
Land preparation, Harvesting
4th
L - Aug (Nehase)
Drought
3
Crop sowing
8th
A - Sep (Meskerem)
Crop disease, Drought
3
Crop sowing
9th
B - Oct (Tikimt)
Crop disease
3
Weeding
12th
C - Nov (Hidar)
Food shortage
3
Weeding
11th
D - Dec (Tahsas)
---------
weeding, Weeding
10th
Kebele Name ZEGA
NOTE: Hazard Severity Rank helps prioritize the more severe hazards that have occurred in the months of disaster occurrence, 3 being the worst and 1
the least severe hazards.
71
Page 28 of 29
Wereda Disaster
Risk Profile
Data_Collected_Date
March 2017
National Disaster Risk Management
Commission (NDRMC)
Friday, July 21, 2017
Region S.N.N.P
Zone GAMO GOFA
Wereda BONKE
Selected Indictor:
Month of Hazard
E - Jan (Tir)
Seasonal Calendar for Hazards, Activities and Income Level By Kebele
Major_Problems /Disasters
Drought, Shortage of animal feed
Hazard Severity
Rank
3
Agricultural_Activities
Harvesting, Land preparation
Income
Level Rank
1st
F - Feb (Yekatit)
Drought, Shortage of water
3
Crop sowing
2nd
G - Mar (Megabit)
Crop disease
3
Crop sowing
9th
H - Apr (Meazea)
Crop disease, Flood, Land slide
3
Weeding
8th
I - May (Ginbot)
Crop disease
3
Weeding
12th
J - Jun (Sene)
Crop disease (Coffee)
3
Harvesting, Land preparation
11th
K - Jul (Hamle)
---------
Land preparation
10th
L - Aug (Nehase)
Drought, Flood
3
Crop sowing
5th
A - Sep (Meskerem)
---------
Crop sowing
6th
B - Oct (Tikimt)
Flood
3
Weeding(teff), Harvesting(maize)
3rd
C - Nov (Hidar)
Livestock disease
3
Weeding
7th
D - Dec (Tahsas)
Livestock disease
3
Harvesting, Land preparation
4th
NOTE: Hazard Severity Rank helps prioritize the more severe hazards that have occurred in the months of disaster occurrence, 3 being the worst and 1
the least severe hazards.
72
Page 29 of 29
WDRP Indicators
Infrastructure Access Characteristics
73
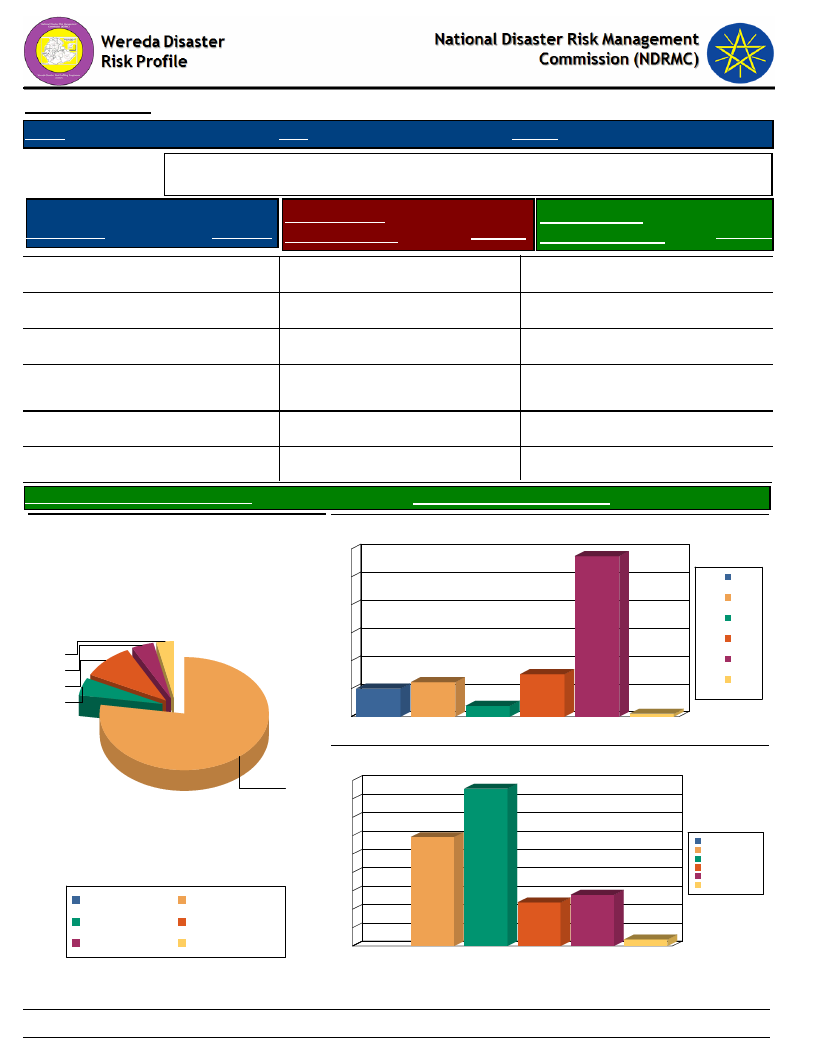
Data_Collected_Date
Region S.N.N.P
March 2017
Zone GAMO GOFA
Wereda BONKE
Friday, July 21, 2017
Selected Indicator
Type of Road
Physical Vulnerability: Access to Roads & Urban Centres - Households access to
road and urban centre
Time to Nearest
Response Paved Road (Mins.)
Time To Nearest
Response Urban Center (Mins.)
Response
Yes, paved
3.35 Less than 30 min
57.47 Less than 1 hr
13.92
Yes, partly paved road
4.12 30 – 60 min
15.21 1 - 2 hrs
29.64
Yes, gravel road
9.79 1 – 2 hrs
10.05 2 - 4 hrs
42.78
Yes, dirt road (difficult
for car)
No road
4.90 2 – 3 hrs
76.03 3 – 4 hrs
12.37 4 - 6 hrs
3.87 More than 6 hrs
11.86
1.80
More than 4 hrs
1.03
Avg Time To Nearest Urban Center(Mins.)
Type of Road
3
4
10
5
76
Yes, dirt road (difficult
for car)
Yes, partly paved road
No road
Yes, gravel road
Yes, paved
174.02
Avg_Time_To_Nearest_Paved_Road
60.36
Time to reach the nearest paved road from the HH
60
57
50
40
30
20
10
10
0
1 – 2 hrs
12
2 – 3 hrs
15
4
3 – 4 hrs
30 – 60 min
Less than 30
min
1
More than 4
hrs
1 – 2 hrs
2 – 3 hrs
3 – 4 hrs
30 – 60 min
Less than 30 min
More than 4 hrs
Time to reach nearest urban center from the HH
45
43
40
35
30
30
25
20
15
10
14
12
1 - 2 hrs
2 - 4 hrs
4 - 6 hrs
Less than 1 hr
More than 6 hrs
5
2
0
1 - 2 hrs
2 - 4 hrs
4 - 6 hrs
Less than 1 hr More than 6 hrs
74
Page 1 of 1
Data_Collected_Date
Region S.N.N.P
March 2017
Zone GAMO GOFA
Wereda BONKE
Friday, July 21, 2017
Selected Indicator
Physical Vulnerability: Access to Electricity - Households access and utilization
of electricity
Household_Located_In_Electricity
5.93
Household_Connected_To Electricity
3.90
75
Page 1 of 1
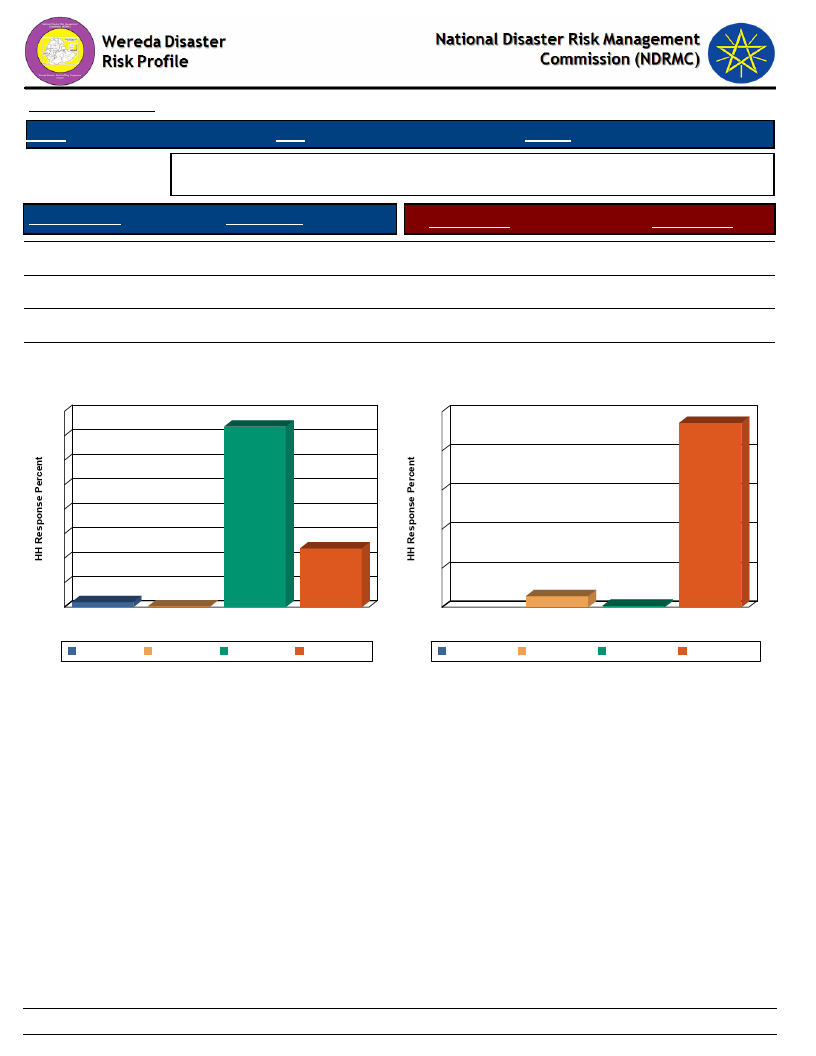
Data_Collected_Date
Region S.N.N.P
March 2017
Zone GAMO GOFA
Wereda BONKE
Friday, July 21, 2017
Selected Indicator
Floor Structure
Physical Vulnerability: Type of Dwelling Units - Households type of dwelling
houses
HH Response
Type of Floor
HH Response
Tin house
23.97
Concrete
5.70
Bamboo
2.06
Non-Concrete
94.30
Mobile home
0.26
DK
0.76
Thatched
73.71
Floor Structure
80
100
74
70
80
60
50
60
40
30
40
24
20
20
10
2
0
0
0
Bamboo
Mobile home
Thatched
Tin house
Floor Structure
Bamboo
Mobile home Thatched
Tin house
Type of Floor
94
6
1
Concrete
DK
Type of Floor
Concrete
DK
Non-Concrete
Non-Concrete
76
Page 1 of 1
WDRP Indicators
Socio Demographic Characteristics
77

Wereda Disaster
Risk Profile
National Disaster Risk Management
Commission (NDRMC)
Data_Collected_Date
March 2017
Friday, July 21, 2017
Region S.N.N.P
Selected Indicator
Kebele Name
ZEGA
FADELE
GERIBANISHA GALO
GERIBANISA KARICHE
ZAZIE
GORATE
GARIBANISA SOROGE
KOLE KANCHAME
KOLE ZALE
Zone GAMO GOFA
Wereda BONKE
Economic Vulnerability: Level of Migration - Migration level and its characteristics by Kebele
Approx_No. Age_Group
Sex
Migration_Period
Migration Trend
Migration_Reason
200-250
100
200
50
350-400
Youth and
working gr
All
All groups
Both
Male
All
Except elders
All
Youth, working
group
Both
September, July,
August
December,
January, February
October, May,
September
August, October,
November
September,
October
Increased
Increased
Increased
Increased
Increased
200
All
300
All except
elders
500
All groups
85-100
Youth
All
All
Both
Both
May, June, July,
August, Septe
July, August,
September
October,
September,
December
May, June,
September
Increased
Increased
Increased
Increased
Because of economic
hardship
Economic hardship,
Job opportunity
Economic hardship,
Due to the impacts
of disaster
Seeking of better job
and economic
hardship
To get job
opportunities,
Economic hardship
due to lack of
fertilize soil and
shortage of food
Seeking job
opportunity,
Economic hardship
Economic hardship,
Job opportunities
Job opportunity,
Economic hardship
Economic hardship,
job opportunities
Destination
Denble, Darmallo, Shelle,
Ssra
Rural - Daramalo, Kebma
woreda
Sile, Gidole, Busa
Sile, Zayse, Gumaide,
Moyale
Sile, Bussa
Rural - Elgo, Wazaka,
Danbile, Sile
Sile, Yabelo
Shelle, Sira, Gomayde,
Woicaka
Sile, Wozeka, Arbaminch,
Shele
78
Page 1 of 3
Wereda Disaster
Risk Profile
Data_Collected_Date
March 2017
National Disaster Risk Management
Commission (NDRMC)
Friday, July 21, 2017
Region S.N.N.P
Selected Indicator
Kebele Name
YELA
KOYRA MUKULA
Zone GAMO GOFA
Wereda BONKE
Economic Vulnerability: Level of Migration - Migration level and its characteristics by Kebele
Approx_No. Age_Group
Sex
Migration_Period
Migration Trend
Migration_Reason
150
Youth, Working Both
August, November,
Decreased
Job opportunity,
group
October
Economic hardship
Increased
Destination
Shelle, Chano, Morabe,
Gomayde
KETELE
FISHITO
DURIBE
300
200-250
150
All groups
Youth,
Children, Wor
All
Both
Both
Male
July, August,
September
March, September,
November
April, May, June
Increased
Increased
Increased
ALGUDA
800
KACHA KASHISO
500
CHOSHA
200
KAMELE BARIE ORO
700
All except
children
All groups
All
Both
Youth, working
group
Both
Except elders
All
and ch
September,
October, November
October, July,
August
Increased
Increased
September,
October,
November,
August, September,
October, No
Decreased
Increased
Economic hardship,
Job opportunities
Economic hardship,
Shortage of food,
Loss of soil fertility
Job opportunity,
Economic hardship,
Shortage of food and
less productivity of
crop and livestock s
Job opportunities,
Economic hardship
Job opportunities,
Economic hardship
Economic hardship
and job
opportunities
Job opportunities
and Economic
hardship
Daramalo, Beto, Jink
Shelle, Jinka, Bussa,
Daramallo
Rural - Shele, Elgo, Sile,
Jinka
Rural - Sile Dandile, Zaise,
Elgo
Rural - Mirab abaya,
Kemba, Daramab, and
Urban - Addis Ababa
Shile, Maze, Mirabe, Sira
Rural - Elgo, Gumaide,
Wozaka, Shelle, Denbile
79
Page 2 of 3

Wereda Disaster
Risk Profile
National Disaster Risk Management
Commission (NDRMC)
Data_Collected_Date
March 2017
Friday, July 21, 2017
Region S.N.N.P
Selected Indicator
Kebele Name
KALIBO LAKA
GEZESO
DENBILE OSA
Zone GAMO GOFA
Wereda BONKE
Economic Vulnerability: Level of Migration - Migration level and its characteristics by Kebele
Approx_No.
900
Age_Group
All
Sex
Male
350-400
Youth, Working
elder
Both
Migration_Period
July, August,
September, Octob
June, July
Migration Trend
Increased
Increased
Increased
Migration_Reason
Job opportunities,
Economic hardship
Economic hardship,
Job opportunities
Destination
Rural areas - Sile, Zala,
Busa, Gafa, Gumaide
Sira, Bussa, Maze
DESHKELE
KALO GAGULA
GERASE ZALA
KALO GAGULA
DEMBILE OTORA
150
2000
250
250
All
Both
All
All
Youth
Except elders
Both
All
March, April,
September, Novem
October,
November,
December, A
Increased
Increased
September,
October, November
June, July, October
Increased
Increased
Increased
Job opportunities,
Economic hardship
Job opportunities,
Economic hardship
due to food shortage
problem
Job opportunities,
Economic hardship
Economic hardship,
Job opportunities
Elego, Shelle, Danbile,
Daramalo
Rural - Gumaide, Sile,
Zala, Otolo, Busa
Jinka, Addis Ababa, Elgo,
Shelle, Busa
Sile, Elgo
KOSHALE
GOBO BAKE
DIMELE FUSE
400
All
All
January, February,
Increased
March, Apri
100
Youth, Working Both
August, October
Increased
group
Increased
Economic hardship
Job opportunities,
Economic hardship,
To gain money
Ruaral area - Daramalo,
Ale
Elego, Wozaga, Shele,
Gomayde
80
Page 3 of 3
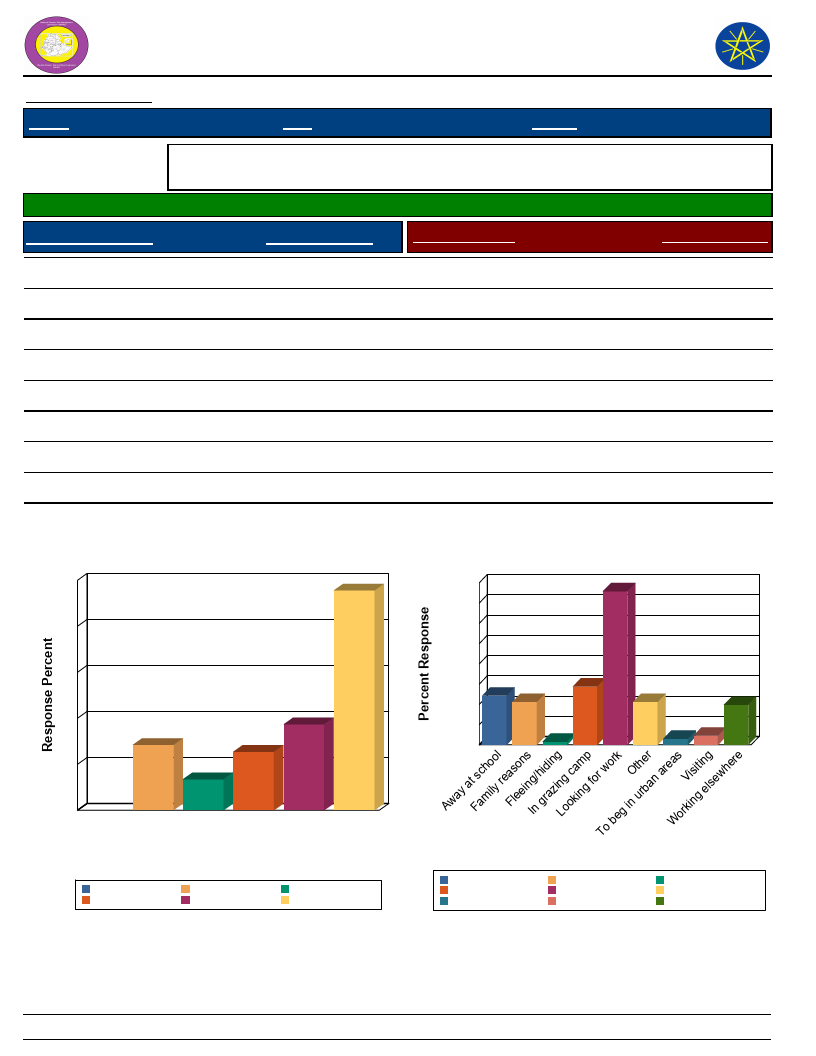
Wereda Disaster
Risk Profile
National Disaster Risk Management
Commission (NDRMC)
Data_Collected_Date
Region S.N.N.P
March 2017
Zone GAMO GOFA
Wereda BONKE
Friday, July 21, 2017
Selected Indicator
Economic Vulnerability: Household Migration - Household migration and reason
for migration
Households who migrated (%)
5.05
Duration of Migration
Response Percent
Migration Reason
Response Percent
Less than 2 weeks
A month – 3 months
3 – 6 months
Two weeks – month
> 6 months
18.66
12.69
6.72
47.76
14.18
Visiting
Looking for work
Working elsewhere
Family reasons
In grazing camp
Fleeing/hiding
Away at school
To beg in urban areas
Other
2.27
37.88
9.85
10.61
14.39
0.76
12.12
1.52
10.61
Duration of Migration
50
48
40
30
20
14
19
13
10
7
Migration Reason
40
38
35
30
25
20
14
15 12 11
11
10
5
1
2
0
10
2
0
> 6 3 – 6 A month Less Two
months months – 3 than 2 weeks –
months weeks month
Duration of Migration
A month – 3 months
> 6 months
Less than 2 weeks
3 – 6 months
Two weeks – month
Away at school
In grazing camp
To beg in urban areas
Migration Reason
Family reasons
Looking for work
Visiting
Fleeing/hiding
Other
Working elsewhere
81
Page 1 of 1
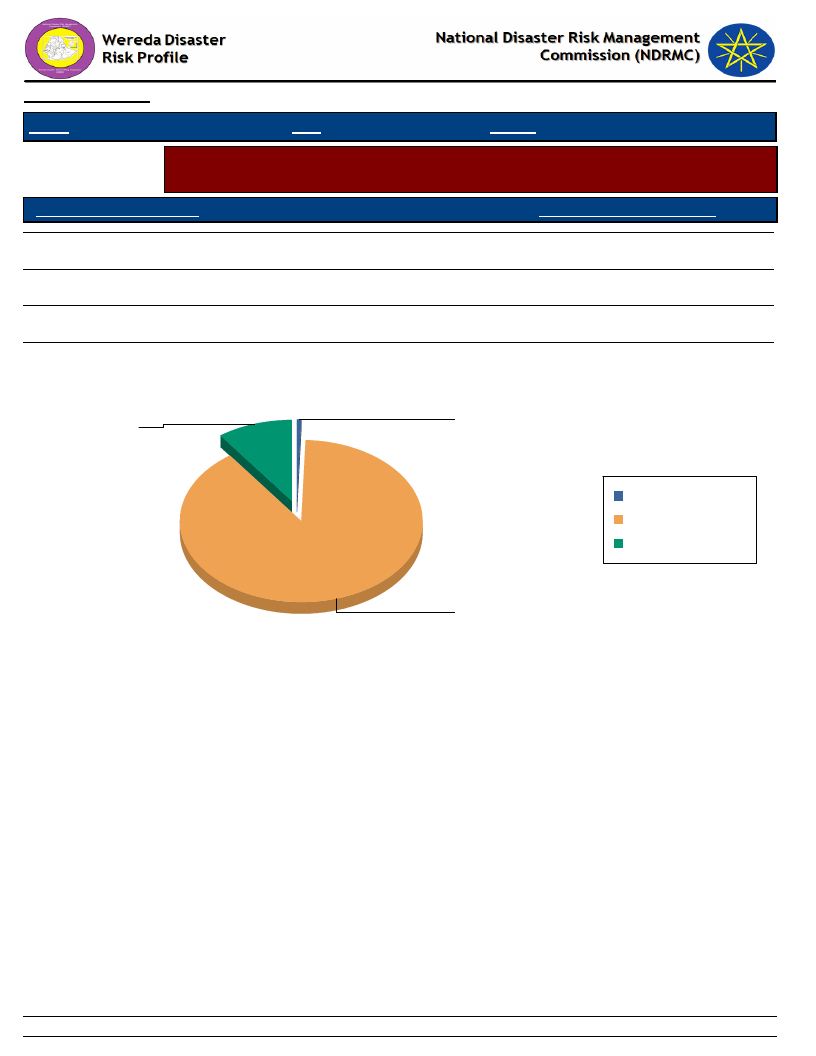
Data_Collected_Date
March 2017
Friday, July 21, 2017
Region S.N.N.P
Zone GAMO GOFA
Wereda BONKE
Selected Indicator
Economic Vulnerability: Household Migration - Disasters as a triggering factor for
migration (households response in %)
Is Migration Due to Hazard?
HH Response - Due To Hazard
No
89.35
Yes
9.87
Migration partly because of such impacts
0.52
Is Migration Due to Hazard?
Migration partly because of such
Yes
impacts
9.9
0.5
Migration partly because
of such impacts
No
Yes
No
89.3
82
Page 1 of 1
Data_Collected_Date
Region S.N.N.P
March 2017
Zone GAMO GOFA
Selected Indictor: Demography: Population Structure
KEY:
Male
Female
A-Children
(0-12 yrs)
ALGUDA
-
-
CHOSHA
-
-
DEMBILE OTORA
-
-
DENBILE OSA
-
-
DESHKELE
-
-
DIMELE FUSE
-
-
DURIBE
-
-
FADELE
-
-
FISHITO
-
-
GARIBANISA SOROGE
-
-
GERASE ZALA
-
-
GERIBANISA KARICHE
-
-
Wereda BONKE
Friday, July 21, 2017
B-Youth
(12-25 yrs)
-
-
49
51
-
-
49
51
-
-
-
-
-
-
-
-
-
-
49
51
-
-
42
58
C-Working
(25-55 yrs)
-
-
-
-
-
-
-
-
-
-
-
-
-
-
-
-
-
-
-
-
46
54
-
-
D-Older
(Above 55
-
-
-
-
-
-
58
42
-
-
-
-
51
49
-
-
49
51
-
-
-
-
49
51
83
Page 1 of 3
Data_Collected_Date
Region S.N.N.P
March 2017
Zone GAMO GOFA
Selected Indictor: Demography: Population Structure
A-Children
(0-12 yrs)
GERIBANISHA GALO
-
-
GEZESO
-
-
GOBO BAKE
-
-
GORATE
49
51
KACHA KASHISO
-
-
KALIBO LAKA
-
-
KALO GAGULA
-
-
KAMELE BARIE ORO
0
75
KETELE
-
-
KOLE KANCHAME
-
-
KOLE ZALE
-
-
KOSHALE
47
53
Wereda BONKE
Friday, July 21, 2017
B-Youth
(12-25 yrs)
-
-
-
-
-
-
-
-
49
51
-
-
-
-
-
-
-
-
-
-
-
-
49
51
C-Working
(25-55 yrs)
49
51
52
48
-
-
-
-
-
-
-
-
-
-
-
-
-
-
-
-
-
-
-
-
D-Older
(Above 55
-
-
52
48
-
-
-
-
-
-
-
-
-
-
-
-
-
-
-
-
-
-
-
-
84
Page 2 of 3
Data_Collected_Date
Region S.N.N.P
March 2017
Zone GAMO GOFA
Selected Indictor: Demography: Population Structure
A-Children
(0-12 yrs)
KOYRA MUKULA
-
-
YELA
-
-
ZAZIE
-
-
ZEGA
-
-
Wereda BONKE
Friday, July 21, 2017
B-Youth
(12-25 yrs)
-
-
-
-
52
48
-
-
C-Working
(25-55 yrs)
51
49
-
-
-
-
-
-
D-Older
(Above 55
-
-
-
-
53
47
-
-
85
Page 3 of 3

Data_Collected_Date
Region S.N.N.P
March 2017
Zone GAMO GOFA
Wereda BONKE
Friday, July 21, 2017
Selected Indicator
Demography: Population Trends and Ethnic Groups
Kebele Name
Population Change Trend
Population Change Reasons
Ethnic_Groups
ZEGA
FADELE
GERIBANISHA GALO
Increased
Increased
Increased
GERIBANISA
KARICHE
ZAZIE
GORATE
GARIBANISA
SOROGE
KOLE KANCHAME
KOLE ZALE
YELA
KOYRA MUKULA
KETELE
FISHITO
DURIBE
ALGUDA
KACHA KASHISO
CHOSHA
KAMELE BARIE ORO
KALIBO LAKA
GEZESO
DENBILE OSA
DESHKELE
KALO GAGULA
Increased
Increased
Increased
Increased
Increased
Increased
Increased
Increased
Increased
Increased
Increased
Increased
Increased
Increased
Increased
Increased
Increased
Increased
Increased
Increased
More children
More children
More children, Lack of awareness
on family planning
More children, Poor family
planning
More children
More children
More children, Lack of awareness
to family planning
More children
More children
More children
More children
More children
More children
More children
More children
More children
More children
More children
More children
More children, Larger family
More children
More children
More children
86
Gamo
Gamo
Gamo
Gamo
Poor
Gamo
Gamo
Gamo
Gamo
Gamo
Gamo
Gamo
Gamo
Gamo
Gamo
Gamo
Gamo
Gamo
Gamo
Gamo
Gamo
Gamo
Gamo
Page 1 of 2
Data_Collected_Date
Region S.N.N.P
March 2017
Zone GAMO GOFA
Wereda BONKE
Friday, July 21, 2017
Selected Indicator
Demography: Population Trends and Ethnic Groups
Kebele Name
Population Change Trend
Population Change Reasons
Ethnic_Groups
GERASE ZALA
KALO GAGULA
DEMBILE OTORA
KOSHALE
GOBO BAKE
DIMELE FUSE
Increased
Increased
Increased
Increased
Increased
Increased
More children
More children
More children
More children
More children
More discuss
Gamo
Gamo
Gamo
Gamo
Gamo
Gamo
87
Page 2 of 2

Data_Collected_Date
March 2017
Friday, July 21, 2017
Region S.N.N.P
Zone
GAMO GOFA
Wereda BONKE
Selected Indicator
Social Vulnerability: Household Demographic Characteristics - Demographic
characteristics of households
Demographic Indicator
Indicator_Value Comments
Average household size
7.7
Sex ratio
914.0 Number of females per 1000 males
Child sex ratio (under 14 yrs)
1,010.0 Number of females per 1000 males
Adult sex ratio (18 & Above yrs)
848.0 Number of females per 1000 males
Dependency ratio ([(0-14)+(64+)] / (15-64)
0.9
yrs)
88
Page 1 of 1

Wereda Disaster
Risk Profile
Data_Collected_Date
March 2017
National Disaster Risk Management
Commission (NDRMC)
Friday, July 21, 2017
Region S.N.N.P
Selected Indicator
General Awareness
Zone
GAMO GOFA
Wereda BONKE
Social Vulnerability: Level of Educational Attainment - Education status of household members
Percentage Educational Level
Percentage
Read and understand text - Yes, easily
Read and understand text - Yes, with
difficulty
Can write letters - Yes, easily
Can write letters - Yes, with difficulty
23.44
14.49
From Proportion of population (7+) - Less than 1st grade completed
Primary Education (Grade 1 - 6) Student
23.31
13.72
Secondary School Education (7 - 12) Student
From Proportion of population (7+) - Technical / vocational
certificate or diploma
From Proportion of population (7+) - University diploma
From Proportion of population (7+) - Pursuing University degree
From Proportion of population (7+) - University degree or higher
From Proportion of population (15+) - Less than 1st grade
From Proportion of population (15+) - Primary (1-6)
From Proportion of population (15+) - Secondary (7-12)
From Proportion of population (15+) - Technical
From Proportion of population (15+) - Diploma
From Proportion of population (15+) - Pursuing or completed
University
UNIVERSITY DEGREE
31.59
44.80
22.36
0.80
0.04
0.12
0.08
35.45
32.61
30.19
1.21
0.06
0.18
0.06
89
Page 1 of 2
Wereda Disaster
Risk Profile
Data_Collected_Date
March 2017
National Disaster Risk Management
Commission (NDRMC)
Friday, July 21, 2017
Region S.N.N.P
Selected Indicator
General Awareness
Zone
GAMO GOFA
Wereda BONKE
Social Vulnerability: Level of Educational Attainment - Education status of household members
Percentage Educational Level
Percentage
General Literacy Rate
Proportion of literate population (7+) to total 7+
population
Percentage
17.22
Adult Literacy Rate
Proportion of literate population (15+) to total 15+
population
Percentage
16.43
90
Page 2 of 2
Data_Collected_Date
March 2017
Friday, July 21, 2017
Region S.N.N.P
Zone GAMO GOFA
Wereda BONKE
Selected Indicator
Educational Level
Social Vulnerability: Gender Parity - Gender parity in education level (7+ years)
and household heading
Male_Percent
Female_Percent
From Proportion of population (7+) - Less than 1st grade
completed
From Proportion of population (7+) - Technical / vocational
certificate or diploma
From Proportion of population (7+) - University diploma
40.54
68.42
100.00
59.46
31.58
0.00
From Proportion of population (7+) - Pursuing University degree
100.00
0.00
From Proportion of population (7+) - University degree or higher
50.00
50.00
Primary Education (Grade 1 - 6) Student
53.85
46.15
Secondary School Education (7 - 12) Student
66.18
33.82
Male Head of HH
96.94
Female Head of HH
3.06
91
Page 1 of 1
WDRP Indicators
Environmental Characteristics
92

Data_Collected_Date
Region S.N.N.P
March 2017
Zone GAMO GOFA
Wereda BONKE
Friday, July 21, 2017
Selected Indicator
Environmental Situation: Environmental Problems - Major environmental
problems by Kebele
KebeleName
Problem_1
Problem_2
Problem_3
Problem4
ZEGA
Drought
Crop disease
Flood
Land slide
FADELE
Livestock disease
Soil erosion
Water pollution
Deforestation
GERIBANISHA
GALO
GERIBANISA
KARICHE
ZAZIE
Poor cultivation
Land slide
Soil erosion
Flood, Soil erosion
Crop disease
Deforestation
Water erosion
Deforestation
Pests
Crop Pests
Water shortage
GORATE
Soil erosion
Shortage of water
Deforestation
Pests
GARIBANISA
SOROGE
KOLE KANCHAME
Land slide
Soil erosion
Soil erosion
Land slide
Flood
Pests
Pests
Deforestation
KOLE ZALE
Crop disease
Livestock disease
Soil erosion
Shortage of water
YELA
Erosion
Deforestation
Pests
KOYRA MUKULA
Soil fertility
Shortage of water
Pests
Deforestation
KETELE
Deforestation
Animal disease
Human disease
Shortage of rain
FISHITO
Soil erosion
Land slide
Deforestation
Water pollution
DURIBE
Deforestation
Soil erosion
Shortage of water
ALGUDA
Crop disease
Livestock disease
Deforestation
Water pollution
KACHA KASHISO
Flood
Crop disease
Deforestation
Shortage of water
CHOSHA
Crop disease
Livestock disease
Human disease
Soil erosion
KAMELE BARIE
ORO
Land slide
Erosion
93
Pests
Water pollution
Page 1 of 2
Data_Collected_Date
Region S.N.N.P
March 2017
Zone GAMO GOFA
Wereda BONKE
Friday, July 21, 2017
Selected Indicator
Environmental Situation: Environmental Problems - Major environmental
problems by Kebele
KebeleName
Problem_1
Problem_2
Problem_3
Problem4
KALIBO LAKA
Land slide
Pests
Soil erosion
Shortage of water
GEZESO
Land slide
Pests
Soil erosion
Deforestation
DENBILE OSA
Drought
Crop disease
Human disease
Deforestation
DESHKELE
Soil erosion
Pests
Deforestation
KALO GAGULA
GERASE ZALA
Increment of soil
acidity
Soil erosion
Soil erosion
Pest
Pests
Deforestation
Deforestation
KALO GAGULA
Soil erosion
Pests
Land slide
Deforestation
DEMBILE OTORA
Deforestation
Soil erosion
KOSHALE
Land degradation
Deforestation
Water pollution
Livestock disease
GOBO BAKE
Human disease
Water pollution
Deforestation
DIMELE FUSE
Drought
Shortage of water
Livestock diseases
Deforestation
94
Page 2 of 2

Data_Collected_Date
March 2017
Friday, July 21, 2017
Region S.N.N.P
Zone GAMO GOFA
Wereda BONKE
Selected Indicator
Environmental Situation: General Land Quality - Perceptions of the community
on changes in the general quality of land over a decade
KebeleName
Current_Situation
Change_Last_Decade
Comment
ZEGA
Graded land, poor
Increased
Land slide, Flood
FADELE
Graded, Poor
Increased
Poor cultivation
GERIBANISHA
GALO
GERIBANISA
KARICHE
ZAZIE
Poor and degraded
Poor and degraded
Degraded
Decreased
Decreased
Increased
Poor settlement,
Deforestation
Poor cultivation,
Deforestation
Over cultivation
GORATE
Degraded
Increased
Poor settlement
GARIBANISA
SOROGE
KOLE KANCHAME
Poor and degraded
Poor and degraded
Decreased
Increased
Poor cultivation system
Poor cultivation
KOLE ZALE
Medium
Decreased
Poor cultivation system
YELA
Medium
Increased
Good cultivation system
KOYRA MUKULA
Soil fertility decreased
Increased
Productivity decreased
KETELE
FISHITO
Poor, degraded
Degraded land
Increased
Increased
Less soil and water
conservation
Land slide
DURIBE
ALGUDA
KACHA KASHISO
Degraded (less fertile)
Poor, degraded
Degraded
Increased
Decreased
Increased
Poor land use
management
Poor soil and water
conservation
Poor cultivation
CHOSHA
Poor
Decreased
Poor cultivation
KAMELE BARIE
ORO
KALIBO LAKA
Degraded land
Poor and degraded
Increased
Increased
Poor settlement
Poor cultivation
95
Page 1 of 2

Data_Collected_Date
March 2017
Friday, July 21, 2017
Region S.N.N.P
Zone GAMO GOFA
Wereda BONKE
Selected Indicator
Environmental Situation: General Land Quality - Perceptions of the community
on changes in the general quality of land over a decade
KebeleName
GEZESO
DENBILE OSA
Current_Situation
Degraded land
Poor
Change_Last_Decade
Increased
Increased
Comment
Poor land use
management
Deforestation
DESHKELE
Poor and degraded land
Increased
Soil erosion
KALO GAGULA
Poor and degraded
Increased
Soil erosion
GERASE ZALA
Poor and degraded
Increased
Soil erosion
KALO GAGULA
Degraded land
Decreased
Deforestation
DEMBILE OTORA
Good
Increased
KOSHALE
GOBO BAKE
DIMELE FUSE
Poor
Degraded
Degraded land
Decreased
Increased
Decreased
Deforestation,
Overgrazing
Poor cultivation, Over
grazing
Deforestation
96
Page 2 of 2
Data_Collected_Date
March 2017
S.N.N.P
Region
Selected Indicator
Zone GAMO GOFA
Wereda BONKE
Environmental Situation: Changes in Landscape - Changes observed by the
community on landscape and the problems due to the changes
KebeleName
Changes_Observed
Problems_Due_To_Changes
ZEGA
Decreased soil fertility
Yield loss, Loss of income
Friday, July 21, 2017
FADELE
Decreased
Poor cultivation
GERIBANISHA GALO
GERIBANISA KARICHE
ZAZIE
Decreased farm land and
grazing land
Farm land, grazing and
fertility decreased
Soil erosion
Yield loss, the number of Livestock decreased
Yield loss, Loss of productivity
Decreased productivity and soil fertility
GORATE
GARIBANISA SOROGE
KOLE KANCHAME
Land use (fertility
decreased)
Decreased farm land,
grazing land, and soil
fertility
Soil fertility decreased
Productivity decreased
Yield and number of livestock decreased
Productivity decreased
KOLE ZALE
YELA
Decreased in farm land,
grazing land and fertility
Medium, degraded
Population growth, Lack of productivity
Soil fertility decreased
KOYRA MUKULA
Poor, degraded land
KETELE
Fertility decreased
Loss of yield
FISHITO
Fertility decreased
Yield loss increased
DURIBE
Deforestation
Shortage of rain, high temperature
ALGUDA
Fertility decreased
Yield decreased
KACHA KASHISO
Soil fertility decreased
Productivity decreased
CHOSHA
Fertility decreased
Loss of yield and productivity
KAMELE BARIE ORO
Poor and degraded
Productivity decreased
KALIBO LAKA
Soil fertility decreased
Loss of yield
GEZESO
Deforestation
Climate change
97
Page 1 of 2
Data_Collected_Date
March 2017
S.N.N.P
Region
Selected Indicator
Zone GAMO GOFA
Wereda BONKE
Environmental Situation: Changes in Landscape - Changes observed by the
community on landscape and the problems due to the changes
KebeleName
Changes_Observed
Problems_Due_To_Changes
DENBILE OSA
Fertility decreased
Yield loss
DESHKELE
Degradation
Loss of soil fertility
KALO GAGULA
Degraded increased
Soil fertility decreased
GERASE ZALA
Degraded increased
Loss of soil fertility
KALO GAGULA
DEMBILE OTORA
Land degradation and soil
erosion
Degradation increased
Yield loss, Destocking
Soil fertility decreased
KOSHALE
GOBO BAKE
DIMELE FUSE
Overgrazing and fertility
decreased
Land degradation, Fertility
decreased
Land degradation and soil
erosion
Yield loss
Yield loss increased
Yiled loss, Shortage of livestock forage
Friday, July 21, 2017
98
Page 2 of 2
Wereda Disaster Risk
Profile
Data_Collected_Date
March 2017
Region S.N.N.P
Zone GAMO GOFA
National Disaster Risk Management
Commission (NDRMC)
Friday, July 21, 2017
Wereda BONKE
Selected Indicator
Kebele Name
Environmental Situation: Land-Use other than crop production - Types of land use other than crop production
across Kebeles
Landuse_1
Comments_1
Landuse_2
Comments_2
Landuse_3
Comments_3
ZEGA
Forest land
202.05 Hectare
FADELE
Grazing land
30 hectare
Forest land
93 hectare
GERIBANISHA GALO
Forest land
1 hectare
GERIBANISA KARICHE
ZAZIE
Forest
63 hectare
Grazing land
43 hectare
GORATE
Forest land
39 Hectare
Grazing land
120.42 Hectare
GARIBANISA SOROGE
Forest land
75 Hectare
Grazing land
7 Hectare
KOLE KANCHAME
Grazing land
93.39 Hectare
Forest
22.39 Hectare
KOLE ZALE
Grazing land
75 Hectare
Forest
89 Hectare
YELA
Forest land
1.5 Hectare
KOYRA MUKULA
Grazing land
95 Hectare
Forest
220 Hectare
Honey production
5 Hectare
KETELE
Grazing land
150 Hecatare
Forest
250 Hecatare
Honey production
3 Hecatare
FISHITO
Forest land
40 hectare
DURIBE
Forest
62.5 Hectare
Grazing land
25 Hectare
Enclosure area
25.25 Hectare
ALGUDA
Grazing land
4 Hectare
Forest land
4.5 Hectare
99
Page 1 of 2

Wereda Disaster Risk
Profile
Data_Collected_Date
March 2017
Region S.N.N.P
Zone GAMO GOFA
National Disaster Risk Management
Commission (NDRMC)
Friday, July 21, 2017
Wereda BONKE
Selected Indicator
Kebele Name
Environmental Situation: Land-Use other than crop production - Types of land use other than crop production
across Kebeles
Landuse_1
Comments_1
Landuse_2
Comments_2
Landuse_3
Comments_3
KACHA KASHISO
Forest
15 Hectare
Grazing land
150 Hectare
CHOSHA
Forest land
64 hectare
Grazing land
322.5 hectare
KAMELE BARIE ORO
Forest
56 hectare
KALIBO LAKA
Forest land
53.65 hectare
Grazing land
95.6 hectare
GEZESO
Grazing land
468.65 hectare
Forest
256.55 hectare
DENBILE OSA
Forest land
339 hectare
Grazing land
39 hectare
DESHKELE
Forest
100 Hectare
KALO GAGULA
Grazing land
350 hectare
Forest
70 hectare
GERASE ZALA
Forest
20 hectare
Grazing land
3 hectare
KALO GAGULA
Forest land
2.5
Grazing land
0.5
DEMBILE OTORA
Forest land
469.75 hectare
Grazing land
20 hectare
KOSHALE
Grazing land
2000 hectare
Forest land
1955 hectare
Honey production
100 hectare
GOBO BAKE
Forest
94.5 hectare
DIMELE FUSE
Forest
96 hectare
100
Page 2 of 2

Data_Collected_Date
Region S.N.N.P
March 2017
Zone GAMO GOFA
Wereda BONKE
Selected Indicator
KebeleName
Environmental Situation: Deforestation - Observed changes over levels of
deforestation by the community and its problems
Changes_Observed
Problems_Due_To_Changes
Friday, July 21, 2017
ZEGA
Increased
Due to climate change
FADELE
Increased
Climate change
GERIBANISHA
GALO
GERIBANISA
KARICHE
ZAZIE
Increased
Increased
Increased
Flood
Climate change, Shortage of water
Shortage of rain, climate change, soil moisture decreased
GORATE
Increased
Shortage of water, Climate change
GARIBANISA
SOROGE
KOLE KANCHAME
Increased
Increased
Climate change
Climate change, shortage animal pasture and water
KOLE ZALE
Increased
Climate change, decrease productivity
YELA
Increased
Deforestation
KOYRA MUKULA
Increased
KETELE
Increased
Climate change, shortage of water
FISHITO
Increased
Climate change
DURIBE
Increased
Shortage of rain, climate change
ALGUDA
Increased
Climate change
KACHA KASHISO
CHOSHA
Increased
Increased
Soil fertility and productivity decreased, Soil erosion
increased
Climate change, Shortage of water
KAMELE BARIE
ORO
Poor
Shortage of rain
101
Page 1 of 2

Data_Collected_Date
Region S.N.N.P
March 2017
Zone GAMO GOFA
Wereda BONKE
Selected Indicator
KebeleName
Environmental Situation: Deforestation - Observed changes over levels of
deforestation by the community and its problems
Changes_Observed
Problems_Due_To_Changes
KALIBO LAKA
Increased
Climate change, Shortage of rain fall
GEZESO
Increased
Climate change
DENBILE OSA
Increased
Drought, Shortage of water
DESHKELE
Increased
Climate change
KALO GAGULA
Increased
Climate change, Shortage of water
GERASE ZALA
Increased
Shortage of water, Climate change
KALO GAGULA
Increased
Erosion
DEMBILE OTORA
Increased
Climate change, Shortage of water
KOSHALE
Increased
Climate change, high temperature
GOBO BAKE
Increased
Due to population growth
DIMELE FUSE
Increased
Shortage of water, Erosion, Loss of soil fertility
Friday, July 21, 2017
102
Page 2 of 2
Wereda Disaster
Risk Profile
National Disaster Risk Management
Commission (NDRMC)
Data_Collected_Date
Region S.N.N.P
March 2017
Zone GAMO GOFA
Wereda BONKE
Friday, July 21, 2017
Selected Indicator
KebeleName
Environmental Situation: Natural Resources Availability - Natural resources available and changes observed by
the community
ALGUDA
Resources_1
Land
Resources_3
Forest
Observed_Change_1
Fertility decreased
Observed_Change_3
Decreased
Problems_Changes_1
Yield loss
Problems_Changes_3
Climate change, Deforestation
Resources_2
Observed_Change_2
Problems_Changes_2
Water
Decreased
Shortage of water
Resources_4
Observed_Change_4
Problems_Changes_4
KebeleName
CHOSHA
Resources_1
Land
Observed_Change_1
Fertility decreased
Problems_Changes_1
Loss of yield
Resources_3
Observed_Change_3
Problems_Changes_3
Forest
Increased
A forestation
Resources_2
Observed_Change_2
Problems_Changes_2
Water
Access decreased
Production decreased
Resources_4
Observed_Change_4
Problems_Changes_4
KebeleName
DEMBILE OTORA
103
Page 1 of 15

Wereda Disaster
Risk Profile
National Disaster Risk Management
Commission (NDRMC)
Data_Collected_Date
Region S.N.N.P
March 2017
Zone GAMO GOFA
Wereda BONKE
Friday, July 21, 2017
Selected Indicator
Resources_1
Observed_Change_1
Problems_Changes_1
Environmental Situation: Natural Resources Availability - Natural resources available and changes observed by
the community
Land
Resources_3
Forest
Decreased
Observed_Change_3
Decreased
Yield loss
Problems_Changes_3
Deforestation
Resources_2
Observed_Change_2
Problems_Changes_2
Water
Decreased
Shortage of production
Resources_4
Observed_Change_4
Problems_Changes_4
KebeleName
DENBILE OSA
Resources_1
Land
Observed_Change_1
Fertility decreased
Problems_Changes_1
Decreased productivity
Resources_3
Observed_Change_3
Problems_Changes_3
Forest
Decreased
Climate change
Resources_2
Observed_Change_2
Problems_Changes_2
Water
Decreased
Shortage of water
Resources_4
Observed_Change_4
Problems_Changes_4
Bee keeping
Decreased
Decreased productivity
KebeleName
DESHKELE
104
Page 2 of 15
Wereda Disaster
Risk Profile
National Disaster Risk Management
Commission (NDRMC)
Data_Collected_Date
Region S.N.N.P
March 2017
Zone GAMO GOFA
Wereda BONKE
Friday, July 21, 2017
Selected Indicator
Resources_1
Observed_Change_1
Problems_Changes_1
Environmental Situation: Natural Resources Availability - Natural resources available and changes observed by
the community
Land
Resources_3
Forest
Decreased
Observed_Change_3
Decreased
Yield loss
Problems_Changes_3
Resources_2
Observed_Change_2
Problems_Changes_2
Water
Decreased
Loss of productivity
Resources_4
Observed_Change_4
Problems_Changes_4
KebeleName
DIMELE FUSE
Resources_1
Land
Observed_Change_1
Fertility decreased
Problems_Changes_1
Yield loss
Resources_3
Observed_Change_3
Problems_Changes_3
Forest
Decreased
Climate change
Resources_2
Observed_Change_2
Problems_Changes_2
Water
Decreased
Decreased productivity
Resources_4
Observed_Change_4
Problems_Changes_4
KebeleName
DURIBE
105
Page 3 of 15

Wereda Disaster
Risk Profile
National Disaster Risk Management
Commission (NDRMC)
Data_Collected_Date
Region S.N.N.P
March 2017
Zone GAMO GOFA
Wereda BONKE
Friday, July 21, 2017
Selected Indicator
Resources_1
Observed_Change_1
Problems_Changes_1
Environmental Situation: Natural Resources Availability - Natural resources available and changes observed by
the community
Land
Resources_3
Forest
Decreased
Observed_Change_3
Decreased
Decreased soil fertility
Problems_Changes_3
Climate change, Shortage of rainfall
Resources_2
Observed_Change_2
Problems_Changes_2
Water
Decreased
Decreased productivity
Resources_4
Observed_Change_4
Problems_Changes_4
KebeleName
FADELE
Resources_1
Water
Observed_Change_1
Decreased
Problems_Changes_1
Productivity Decreased
Resources_3
Observed_Change_3
Problems_Changes_3
Forest
Decreased
Deforestation and climate change Increased
Resources_2
Observed_Change_2
Problems_Changes_2
Land use
Decreased
Fertility Decreased
Resources_4
Observed_Change_4
Problems_Changes_4
KebeleName
FISHITO
106
Page 4 of 15

Wereda Disaster
Risk Profile
National Disaster Risk Management
Commission (NDRMC)
Data_Collected_Date
Region S.N.N.P
March 2017
Zone GAMO GOFA
Wereda BONKE
Friday, July 21, 2017
Selected Indicator
Resources_1
Observed_Change_1
Problems_Changes_1
Environmental Situation: Natural Resources Availability - Natural resources available and changes observed by
the community
Land
Resources_3
Forest
Fertility decreased
Observed_Change_3
Deforestation increased
Loss of yield, Less income gain
Problems_Changes_3
Climate change increased
Resources_2
Observed_Change_2
Problems_Changes_2
Water
Access is decreased
Shortage of clean water
Resources_4
Observed_Change_4
Problems_Changes_4
KebeleName
GARIBANISA SOROGE
Resources_1
Land
Observed_Change_1
Fertility decreased
Problems_Changes_1
Yield loss
Resources_3
Observed_Change_3
Problems_Changes_3
Forest
Decreased
Climate change
Resources_2
Observed_Change_2
Problems_Changes_2
Water
Decreased
Less productivity
Resources_4
Observed_Change_4
Problems_Changes_4
KebeleName
GERASE ZALA
107
Page 5 of 15

Wereda Disaster
Risk Profile
National Disaster Risk Management
Commission (NDRMC)
Data_Collected_Date
Region S.N.N.P
March 2017
Zone GAMO GOFA
Wereda BONKE
Friday, July 21, 2017
Selected Indicator
Resources_1
Observed_Change_1
Problems_Changes_1
Environmental Situation: Natural Resources Availability - Natural resources available and changes observed by
the community
Land
Resources_3
Forest
Decreased
Observed_Change_3
Decreased
Yield loss
Problems_Changes_3
Climate change
Resources_2
Observed_Change_2
Problems_Changes_2
Water
Decreased
Shortage of productivity
Resources_4
Observed_Change_4
Problems_Changes_4
KebeleName
GERIBANISA KARICHE
Resources_1
Land
Observed_Change_1
Fertility Decreased
Problems_Changes_1
Yield loss
Resources_3
Observed_Change_3
Problems_Changes_3
Forest
Decreased
Deforestation
Resources_2
Observed_Change_2
Problems_Changes_2
Water
Access decreased
Productivity decreased
Resources_4
Observed_Change_4
Problems_Changes_4
KebeleName
GERIBANISHA GALO
108
Page 6 of 15

Wereda Disaster
Risk Profile
National Disaster Risk Management
Commission (NDRMC)
Data_Collected_Date
Region S.N.N.P
March 2017
Zone GAMO GOFA
Wereda BONKE
Friday, July 21, 2017
Selected Indicator
Resources_1
Observed_Change_1
Problems_Changes_1
Environmental Situation: Natural Resources Availability - Natural resources available and changes observed by
the community
Land
Resources_3
Forest
Decreased in fertility
Observed_Change_3
Decreased
Yield loss
Problems_Changes_3
Climate change
Resources_2
Observed_Change_2
Problems_Changes_2
Water
Decreased
Shortage of clean water
Resources_4
Observed_Change_4
Problems_Changes_4
KebeleName
GEZESO
Resources_1
Land use
Observed_Change_1
Decreased
Problems_Changes_1
Decreased soil fertility
Resources_3
Observed_Change_3
Problems_Changes_3
Resources_2
Observed_Change_2
Problems_Changes_2
Forest
Decreased
Deforestation
Resources_4
Observed_Change_4
Problems_Changes_4
KebeleName
GOBO BAKE
109
Page 7 of 15

Wereda Disaster
Risk Profile
National Disaster Risk Management
Commission (NDRMC)
Data_Collected_Date
Region S.N.N.P
March 2017
Zone GAMO GOFA
Wereda BONKE
Friday, July 21, 2017
Selected Indicator
Resources_1
Observed_Change_1
Problems_Changes_1
Environmental Situation: Natural Resources Availability - Natural resources available and changes observed by
the community
Land
Resources_3
Forest
Fertility decreased
Observed_Change_3
Deforestation increased
Yield decreased
Problems_Changes_3
Shortage of rain fall
Resources_2
Observed_Change_2
Problems_Changes_2
Water
Access decreased
Shortage of drinking water
Resources_4
Observed_Change_4
Problems_Changes_4
KebeleName
GORATE
Resources_1
Shortage of water
Observed_Change_1
Increased
Problems_Changes_1
Climate change, Shortage of rain
Resources_3
Observed_Change_3
Problems_Changes_3
Resources_2
Observed_Change_2
Problems_Changes_2
Forest
Deforestation increased
Soil erosion, Flood
Resources_4
Observed_Change_4
Problems_Changes_4
KebeleName
KACHA KASHISO
110
Page 8 of 15

Wereda Disaster
Risk Profile
National Disaster Risk Management
Commission (NDRMC)
Data_Collected_Date
Region S.N.N.P
March 2017
Zone GAMO GOFA
Wereda BONKE
Friday, July 21, 2017
Selected Indicator
Resources_1
Observed_Change_1
Problems_Changes_1
Environmental Situation: Natural Resources Availability - Natural resources available and changes observed by
the community
Land fertility
Resources_3
Decreased
Observed_Change_3
Productivity Decreased
Problems_Changes_3
Resources_2
Observed_Change_2
Problems_Changes_2
Water
Decreased
Productivity Decreased
Resources_4
Observed_Change_4
Problems_Changes_4
KebeleName
KALIBO LAKA
Resources_1
Land
Observed_Change_1
Poor cultivation increased
Problems_Changes_1
Soil fertility decreased
Resources_3
Observed_Change_3
Problems_Changes_3
Forest
Decreased
Climate change, Lack of rainfall
Resources_2
Observed_Change_2
Problems_Changes_2
Water
Decreased
Productivity decreased
Resources_4
Observed_Change_4
Problems_Changes_4
KebeleName
KALO GAGULA
111
Page 9 of 15
Wereda Disaster
Risk Profile
National Disaster Risk Management
Commission (NDRMC)
Data_Collected_Date
Region S.N.N.P
March 2017
Zone GAMO GOFA
Wereda BONKE
Friday, July 21, 2017
Selected Indicator
Resources_1
Observed_Change_1
Problems_Changes_1
Environmental Situation: Natural Resources Availability - Natural resources available and changes observed by
the community
Land
Resources_3
Forest
Decreased
Observed_Change_3
Decreased
Yield loss
Problems_Changes_3
Climate change
Resources_2
Observed_Change_2
Problems_Changes_2
Water
Decreased
Loss of productivity
Resources_4
Observed_Change_4
Problems_Changes_4
Resources_1
Observed_Change_1
Problems_Changes_1
Land
Fertility decreased
Loss of yield
Resources_3
Observed_Change_3
Problems_Changes_3
Forest
Decreased
Climate change
Resources_2
Observed_Change_2
Problems_Changes_2
Water
Decreased
Decreased productivity
Resources_4
Observed_Change_4
Problems_Changes_4
KebeleName
KAMELE BARIE ORO
112
Page 10 of 15

Wereda Disaster
Risk Profile
National Disaster Risk Management
Commission (NDRMC)
Data_Collected_Date
Region S.N.N.P
March 2017
Zone GAMO GOFA
Wereda BONKE
Friday, July 21, 2017
Selected Indicator
Resources_1
Observed_Change_1
Problems_Changes_1
Environmental Situation: Natural Resources Availability - Natural resources available and changes observed by
the community
Land
Resources_3
Decreased
Observed_Change_3
Yield decreased
Problems_Changes_3
Resources_2
Observed_Change_2
Problems_Changes_2
Forest
Decreased
Shortage of rain
Resources_4
Observed_Change_4
Problems_Changes_4
KebeleName
KETELE
Resources_1
Land
Observed_Change_1
fertility decreased
Problems_Changes_1
Loss of yield
Resources_3
Observed_Change_3
Problems_Changes_3
Forest
Decreased
Climate change
Resources_2
Observed_Change_2
Problems_Changes_2
Water
Decreased
Shortage of water
Resources_4
Observed_Change_4
Problems_Changes_4
Bee keeping
Decreased
Low honey production
KebeleName
KOLE KANCHAME
113
Page 11 of 15

Wereda Disaster
Risk Profile
National Disaster Risk Management
Commission (NDRMC)
Data_Collected_Date
Region S.N.N.P
March 2017
Zone GAMO GOFA
Wereda BONKE
Friday, July 21, 2017
Selected Indicator
Resources_1
Observed_Change_1
Problems_Changes_1
Environmental Situation: Natural Resources Availability - Natural resources available and changes observed by
the community
Land use
Resources_3
forest
Decreased
Observed_Change_3
Decreased
Decreased productivity
Problems_Changes_3
Shortage of rain, climate change
Resources_2
Observed_Change_2
Problems_Changes_2
Water
Decreased
Shortage of water
Resources_4
Observed_Change_4
Problems_Changes_4
KebeleName
KOLE ZALE
Resources_1
Land
Observed_Change_1
Fertility decreased
Problems_Changes_1
Loss of yield
Resources_3
Observed_Change_3
Problems_Changes_3
Water
Decreased
Climate change
Resources_2
Observed_Change_2
Problems_Changes_2
Forest
Access increased
A forestation
Resources_4
Observed_Change_4
Problems_Changes_4
KebeleName
KOSHALE
114
Page 12 of 15

Wereda Disaster
Risk Profile
National Disaster Risk Management
Commission (NDRMC)
Data_Collected_Date
Region S.N.N.P
March 2017
Zone GAMO GOFA
Wereda BONKE
Friday, July 21, 2017
Selected Indicator
Resources_1
Observed_Change_1
Problems_Changes_1
Environmental Situation: Natural Resources Availability - Natural resources available and changes observed by
the community
Land
Resources_3
Forest
Degraded
Observed_Change_3
Deforestation increased
Deforestation increased
Problems_Changes_3
High temperature
Resources_2
Water
Resources_4
Wood
Observed_Change_2
Problems_Changes_2
Access decreased
Shortage of livestock pasture and water
Observed_Change_4
Problems_Changes_4
Access decreased
Demand increased
KebeleName
KOYRA MUKULA
Resources_1
Land
Observed_Change_1
Fertility decreased
Problems_Changes_1
Loss yield
Resources_3
Observed_Change_3
Problems_Changes_3
Forest
Decreased
Climate change
Resources_2
Water
Resources_4
Bee keeping
Observed_Change_2
Problems_Changes_2
Decreased
Shortage of water
Observed_Change_4
Problems_Changes_4
Decreased
Low honey production
KebeleName
YELA
115
Page 13 of 15

Wereda Disaster
Risk Profile
National Disaster Risk Management
Commission (NDRMC)
Data_Collected_Date
Region S.N.N.P
March 2017
Zone GAMO GOFA
Wereda BONKE
Friday, July 21, 2017
Selected Indicator
Resources_1
Observed_Change_1
Problems_Changes_1
Environmental Situation: Natural Resources Availability - Natural resources available and changes observed by
the community
Land
Resources_3
Forest
Fertility decreased
Observed_Change_3
Decreased
Loss of production
Problems_Changes_3
Deforestation
Resources_2
Observed_Change_2
Problems_Changes_2
Water
Access decreased
Productivity decreased
Resources_4
Observed_Change_4
Problems_Changes_4
KebeleName
ZAZIE
Resources_1
Land fertility
Observed_Change_1
Decreased
Problems_Changes_1
Decreased productivity
Resources_3
Observed_Change_3
Problems_Changes_3
Resources_2
Observed_Change_2
Problems_Changes_2
Forest land
Decreased
Deforestation
Resources_4
Observed_Change_4
Problems_Changes_4
KebeleName
ZEGA
116
Page 14 of 15
Wereda Disaster
Risk Profile
National Disaster Risk Management
Commission (NDRMC)
Data_Collected_Date
Region S.N.N.P
March 2017
Zone GAMO GOFA
Wereda BONKE
Friday, July 21, 2017
Selected Indicator
Resources_1
Observed_Change_1
Problems_Changes_1
Environmental Situation: Natural Resources Availability - Natural resources available and changes observed by
the community
Land
Resources_3
Forest
Decreased land fertility
Observed_Change_3
Increased deforestation
Yield loss and income loss
Problems_Changes_3
Drought increased
Resources_2
Observed_Change_2
Problems_Changes_2
Water
No access
Shortage of drinking water and irrigation
Resources_4
Observed_Change_4
Problems_Changes_4
117
Page 15 of 15

Wereda Disaster
Risk Profile
National Disaster Risk Management
Commission (NDRMC)
Data_Collected_Date
March 2017
Region S.N.N.P
Selected Indicator
Zone GAMO GOFA
Wereda BONKE
Environmental Situation: Rainfall & Temperature - Observed changes on rainfall and temperature by the
community over the last decade
Rainfall
Temperature
Friday, July 21, 2017
Kebele Name
Changes Observed Problems
Changes Observed
Problems
ZEGA
FADELE
GERIBANISHA
GALO
GERIBANISA
KARICHE
ZAZIE
GORATE
Decreased
Decreased
Decreased
Decreased
Decreased
Decreased
GARIBANISA
SOROGE
KOLE KANCHAME
Decreased
Decreased
KOLE ZALE
YELA
KOYRA MUKULA
KETELE
Decreased
Decreased
Decreased
Decreased
Due to climate change
Shortage of food, Drought
Decreased production
Yield loss due to water shortage
Productivity decreased
Shortage of water, Productivity
decreased
Water access decreased
Shortage of water, Productivity
decreased
Shortage of water and food
Climate change
Shortage of water, yield decreased
Increased
Increased
Increased
Increased
Increased
Increased
Increased
Increased
Increased
Increased
Increased
Increased
Due to deforestation and climate change
Climate change
Climate change
Climate change
Climate change
Climate change
Climate change
Shortage of animal feed and water,
Climate change
Shortage of water, Climate change
Climate change
climate change
118
Page 1 of 3
Wereda Disaster
Risk Profile
National Disaster Risk Management
Commission (NDRMC)
Data_Collected_Date
March 2017
Region S.N.N.P
Selected Indicator
Zone GAMO GOFA
Wereda BONKE
Environmental Situation: Rainfall & Temperature - Observed changes on rainfall and temperature by the
community over the last decade
Rainfall
Temperature
Friday, July 21, 2017
Kebele Name
Changes Observed Problems
Changes Observed
Problems
FISHITO
DURIBE
ALGUDA
KACHA KASHISO
CHOSHA
KAMELE BARIE
ORO
KALIBO LAKA
GEZESO
DENBILE OSA
DESHKELE
KALO GAGULA
GERASE ZALA
Increased
Decreased
Decreased
Decreased
Decreased
Decreased
decreased
Decreased
Decreased
Decreased
Degraded
Decreased
Climate change
Productivity decreased, Shortage of
livestock water and forage
Productivity decreased
Shortage of water and food,
livestock death
Yield loss due to shortage of water
Loss of yield
Shortage of water, Climate change
Reduction of production
Drought
Shortage of water and livestock
pasture
Shortage of water, and livestock
pasture
Shortage of water and livestock feed
Decreased
Increased
Increased
Increased
Increased
Increased
Increased
Increased
Increased
Increased
Increased
Increased
Climate change, Deforestation
Climate change, Shortage of water
Climate change
Shortage of water
Climate change
Shortage of rain
Shortage of rain, Climate change
Shortage of animal feed
Drought
Shortage of water
Shortage of water
Shortage of rain and climate change
119
Page 2 of 3
Wereda Disaster
Risk Profile
National Disaster Risk Management
Commission (NDRMC)
Data_Collected_Date
March 2017
Region S.N.N.P
Selected Indicator
Zone GAMO GOFA
Wereda BONKE
Environmental Situation: Rainfall & Temperature - Observed changes on rainfall and temperature by the
community over the last decade
Rainfall
Temperature
Friday, July 21, 2017
Kebele Name
Changes Observed Problems
Changes Observed
Problems
KALO GAGULA
DEMBILE OTORA
KOSHALE
GOBO BAKE
DIMELE FUSE
Decreased
Decreased
Decreased
Decreased
Decreased
Production decreased
Shortage of water, and livestock
pasture
Productivity decreased
Climate change
Productivity decreased
Increased
Increased
Increased
Increased
Increased
Climate change
Shortage of water, Climate change
Climate change, high temperature
Deforestation, Climate change
Climate change
120
Page 3 of 3

Data_Collected_Date
Region S.N.N.P
March 2017
Zone GAMO GOFA
Wereda BONKE
Friday, July 21, 2017
Selected Indicator
KebeleName
Environmental Situation: Reasons for Environmental Changes
Reason_For_Environmental_Changes
ZEGA
Climate change, Deforestation, Shortage of water, shortage of food
FADELE
GERIBANISHA GALO
GERIBANISA KARICHE
ZAZIE
Shortage of rainfall, Lack of water irrigation, Deforestation, Poor soil and
water conservation
Population growth, Shortage of water, Flood, Deforestation, Crop and
animal disease
Landslide, Less access of improved crop varieties and animals, Climate
change, Shortage of water
Shortage of rain, Less fertile soil, Poor settlement, Agro-ecology factors
GORATE
GARIBANISA SOROGE
Shortage of water, deforestation, shortage of clean water, decrease soil
fertility
Flood, Land slide, Livestock disease, Shortage of food
KOLE KANCHAME
KOLE ZALE
Shortage of water, Loss of soil fertility, Deforestation, Lack of clean
water
Shortage of water and food, Shortage of livestock pasture
YELA
Climate change, Deforestation
KOYRA MUKULA
KETELE
Deforestation, Climate change, Shortage of water, crop pests, livestock
disease, lack of health center
Climate change, deforestation, shortage of rain, Soil erosion, Flood
FISHITO
Climate change, Deforestation, Drought, Land slide
DURIBE
Loss of soil fertility, Shortage of water
ALGUDA
Poor settlement, Loss of soil fertility, Crop disease, Livestock diseases
KACHA KASHISO
CHOSHA
Shortage of rain, Shortage of food, Lack of vaccination, Inaccessibility of
road, Shortage of clean water
Climate change, Shortage of water and livestock feed
KAMELE BARIE ORO
Shortage of rain, Land slide, Pests, Drought
KALIBO LAKA
Crop disease, Livestock disease, Shortage of water, and lack of irrigation
GEZESO
Deforestation is high, Climate change, Soil erosion, Pests
121
Page 1 of 2
Data_Collected_Date
Region S.N.N.P
March 2017
Zone GAMO GOFA
Wereda BONKE
Friday, July 21, 2017
Selected Indicator
KebeleName
Environmental Situation: Reasons for Environmental Changes
Reason_For_Environmental_Changes
DENBILE OSA
Drought, Climate change, Shortage of water and forage
DESHKELE
Shortage of food and livestock feed
KALO GAGULA
Shortage of rain fall, and livestock pasture
GERASE ZALA
Shortage of water, food, and livestock pasture
KALO GAGULA
Drought, Deforestation, Crop pest, Land slide
DEMBILE OTORA
Shortage of water, food and animal feed
KOSHALE
Drought, Climate change, Deforestation, Shortage of water
GOBO BAKE
Deforestation, Crop disease, Flood, Livestock disease, Shortage of food
DIMELE FUSE
Shortage of water, Drought, Livestock disease, Deforestation
122
Page 2 of 2

Data_Collected_Date
Region S.N.N.P
March 2017
Zone GAMO GOFA
Wereda BONKE
Friday, July 21, 2017
Selected Indicator
KebeleName
Environmental Situation: Soil Erosion - Observed changes on levels of soil
erosion by the community
Changes_Observed
Problems_Observed
ZEGA
Increased
Topography, Due to climate change
FADELE
Increased
Loss of yield, Shortage of food
GERIBANISHA GALO
Increased
Soil fertility decreased
GERIBANISA KARICHE
Increased
Decreased soil fertility
ZAZIE
Increased
Productivity decreased, shortage of food
GORATE
Increased
Lack of soil and water conservation
GARIBANISA SOROGE
Increased
Soil fertility decreased
KOLE KANCHAME
Increased
Crop damage, Yield loss, Soil fertility decreased
KOLE ZALE
Increased
Decrease productivity
YELA
Decreased
Soil and water conservation
KOYRA MUKULA
Increased
KETELE
Increased
Yield decreased
FISHITO
Increased
Climate change, High rainfall
DURIBE
Increased
Fertility and productivity decreased
ALGUDA
Increased
Fertility decreased
KACHA KASHISO
Increased
Productivity decreased
CHOSHA
Increased
Loss of yield and shortage of food
KAMELE BARIE ORO
Increased
Productivity decreased
KALIBO LAKA
Increased
Soil fertility decreased, Loss of yield
GEZESO
Increased
Reduction in production due to loss of soil fertility
DENBILE OSA
Increased
Productivity decreased
123
Page 1 of 2
Data_Collected_Date
Region S.N.N.P
March 2017
Zone GAMO GOFA
Wereda BONKE
Selected Indicator
KebeleName
DESHKELE
Environmental Situation: Soil Erosion - Observed changes on levels of soil
erosion by the community
Changes_Observed
Problems_Observed
Increased
Fertility decreased
KALO GAGULA
Increased
Fertility decreased
GERASE ZALA
Increased
Loss of fertility
KALO GAGULA
Increased
Soil fertility decreased
DEMBILE OTORA
Increased
Fertility decreased
KOSHALE
Increased
Productivity decreased
GOBO BAKE
Increased
Climate change
DIMELE FUSE
Increased
Yield loss
Friday, July 21, 2017
124
Page 2 of 2
WDRP Indicators
Livelihood, Occupation and Source
of Food Characteristics
125
Wereda Disaster
Risk Profile
Data_Collected_Date
March 2017
National Disaster Risk Management
Commission (NDRMC)
Friday, July 21, 2017
Region S.N.N.P
Zone
GAMO GOFA
Wereda BONKE
Selected Indicator
Economic Vulnerability: Major Occupational Categories - Major categories of occupation and percent of population
engaged in the occupation by Kebele
Occupational Categories and Percent of Population engaged within these occupational categories
Percent (%) of Population
KebeleName
Occupation 1
Population Occupation 2
Population Occupation 3
Population Occupation 4
Population
ZEGA
FADELE
GERIBANISHA GALO
GERIBANISA
KARICHE
ZAZIE
GORATE
GARIBANISA
SOROGE
KOLE KANCHAME
KOLE ZALE
YELA
KOYRA MUKULA
Agriculture - Crop
production
Agriculture - Crop
production
Agriculture - Crop
production
Agriculture - Crop
production
Agriculture - Crop
production
Agriculture - Crop
production
Agriculture - Crop
production
Agriculture - Crop
production
Agriculture - Crop
production
Agriculture - Crop
production
Agriculture - Livestock
production
60
- Livestock production
60
65
- Livestock production
35
80
- Livestock production
20
75
- Livestock production
25
75
- Livestock production
25
80
- Livestock activities
20
80
- Livestock activities
20
70
- Livestock production
30
75
- Livestock activities
25
80
- Livestock production
20
55
- Crop production
40
126
-
-
-
-
-
-
-
-
-
-
- Bee keeping
-
-
-
-
-
-
-
-
-
-
5
-
Page 1 of 3

Wereda Disaster
Risk Profile
Data_Collected_Date
March 2017
National Disaster Risk Management
Commission (NDRMC)
Friday, July 21, 2017
Region S.N.N.P
Zone
GAMO GOFA
Wereda BONKE
Selected Indicator
Economic Vulnerability: Major Occupational Categories - Major categories of occupation and percent of population
engaged in the occupation by Kebele
Occupational Categories and Percent of Population engaged within these occupational categories
Percent (%) of Population
KebeleName
Occupation 1
Population Occupation 2
Population Occupation 3
Population Occupation 4
Population
KETELE
FISHITO
Agriculture - Crop
production
-
70
- Livestock production
-
26
- Bee keeping
-
4
-
-
DURIBE
ALGUDA
KACHA KASHISO
CHOSHA
KAMELE BARIE ORO
KALIBO LAKA
GEZESO
DENBILE OSA
DESHKELE
Agriculture - Crop
production
Agriculture - Crop
production
Agriculture - Crop
production
Agriculture - Crop
production
Agriculture - Crop
production
Agriculture - Crop
production
Agriculture - Crop
production
Agriculture - Crop
production
Agriculture - Crop
production
75
- Livestock activities
80
- Livestock production
75
- Livestock disease
70
- Livestock production
75
- Livestock production
- Livestock production
60
- Livestock production
70
- Livestock production
65
- Livestock production
25
-
20
-
25
-
30
-
25G
-
-
40
-
30
-
35
-
127
-
-
-
-
-
-
-
-
-
Page 2 of 3
Wereda Disaster
Risk Profile
Data_Collected_Date
March 2017
National Disaster Risk Management
Commission (NDRMC)
Friday, July 21, 2017
Region S.N.N.P
Zone
GAMO GOFA
Wereda BONKE
Selected Indicator
Economic Vulnerability: Major Occupational Categories - Major categories of occupation and percent of population
engaged in the occupation by Kebele
Occupational Categories and Percent of Population engaged within these occupational categories
Percent (%) of Population
KebeleName
Occupation 1
Population Occupation 2
Population Occupation 3
Population Occupation 4
Population
KALO GAGULA
GERASE ZALA
KALO GAGULA
DEMBILE OTORA
KOSHALE
GOBO BAKE
DIMELE FUSE
Agriculture - Crop
production
75
- Livestock production
Agriculture - Crop
production
75
- Livestock production
Agriculture - Crop
production
75
- Livestock production
Agriculture - Crop
production
70
- Livestock production
Agriculture - Livestock
82
- Bee keeping
production
Agriculture - Crop
production
80
- Livestock production
Agriculture - Crop
production
80
- Livestock production
25
-
25
-
25
-
30
-
13
- Crop production
20
-
15
- Bee keeping
-
-
-
-
5
-
-
5
-
128
Page 3 of 3
Data_Collected_Date
Region S.N.N.P
March 2017
Zone GAMO GOFA
Wereda BONKE
Friday, July 21, 2017
Selected Indicator
Economic Vulnerability: Livelihoods - Households important sources of
livelihood (response in %)
Type of Livelihood Activity
Order of Importnce
Animal herder
1st
2nd
3rd
0.00
0.00
1.22
Buying and selling livestock (cattle, sheep, goats, camels)
1.80
4.86
12.20
Counselor (disputes, marriage)
0.00
0.35
0.00
Daily laborer
0.77
5.90
3.66
Making traditional utensils or farm tools
0.00
1.04
3.66
Others
0.26
0.35
1.22
Rearing & selling animals (camels, cattle, sheep, goats)
5.93
48.26
24.39
Religious teacher
0.00
0.00
1.22
Salaried job
0.00
0.35
0.00
Sale_Of_Natural_Products - Animal feed (grass, fodder, forage, salty
sand, etc.)
Sale_Of_Natural_Products - Charcoal
0.00
3.12
8.54
0.26
0.00
0.00
Sale_Of_Natural_Products - Wild fruits
0.26
0.69
0.00
Selling Cereal food crops (sorghum, maize, wheat, barley)
90.46
7.29
1.22
129
Page 1 of 2

Data_Collected_Date
Region S.N.N.P
March 2017
Zone GAMO GOFA
Wereda BONKE
Friday, July 21, 2017
Selected Indicator
Economic Vulnerability: Livelihoods - Households important sources of
livelihood (response in %)
Type of Livelihood Activity
Order of Importnce
1st
2nd
3rd
Selling Clothes and shoes
0.00
0.35
2.44
Selling dairy products (milk, butter, ghee, cheese)
0.00
1.39
7.32
Selling Fruits (mango, papaya, banana, orange, lemon, etc.)
0.00
4.51
2.44
Selling Oil seeds (sesame, sunflower)
0.26
0.00
0.00
Selling Root crops (Irish potato, sweet potato)
0.00
18.75
23.17
Selling Vegetables (onion, tomato, cabbage, pumpkin, etc.)
0.00
2.78
7.32
130
Page 2 of 2

Data_Collected_Date
Region S.N.N.P
March 2017
Zone
GAMO GOFA
Friday, July 21, 2017
Wereda BONKE
Selected Indicator
Economic Vulnerability: Occupational Categories - Percent of population
above 15 years age by occupation categories
Type of Livelihood Activity
Main Occupation
Secondary Occupation
B)Student
C)Unemployed & seeking work
D)Neither studying nor working nor seeking work
E)Retired/ Old
F)Cultivator
G)Agricultural labourer
H)Livestock rearing
I)Non-agricultural labour
J)Craftsman
K)Shopkeeper and Petty trade
L)Home-maker (housewife)
M)Salaried
P)Others (specify)
Q)None
R)Herder
S)Herder
1st Occupation
35.62
2.74
0.80
2.40
30.49
0.13
0.27
1.07
0.33
0.67
23.68
0.47
0.20
1.13
2nd Occupation
0.13
1.41
0.13
4.09
1.02
12.15
1.15
2.30
1.02
0.64
0.77
0.26
74.68
0.26
131
Page 1 of 1

Wereda Disaster Risk
Profile
National Disaster Risk Management
Commission (NDRMC)
Data_Collected_Date
Region S.N.N.P
March 2017
Zone
GAMO GOFA
Wereda BONKE
Friday, July 21, 2017
Selected Indictor: Economic Vulnerability: Sources of Food - Households source for different food items (response in %)
Source of Food
Types of Food Item
A)Own
cultivation/production
B)Casual labor
C)Borrowed
D)Gifts from
friends/neighbors
E)Purchases from main
shop
132
Page 1 of 2
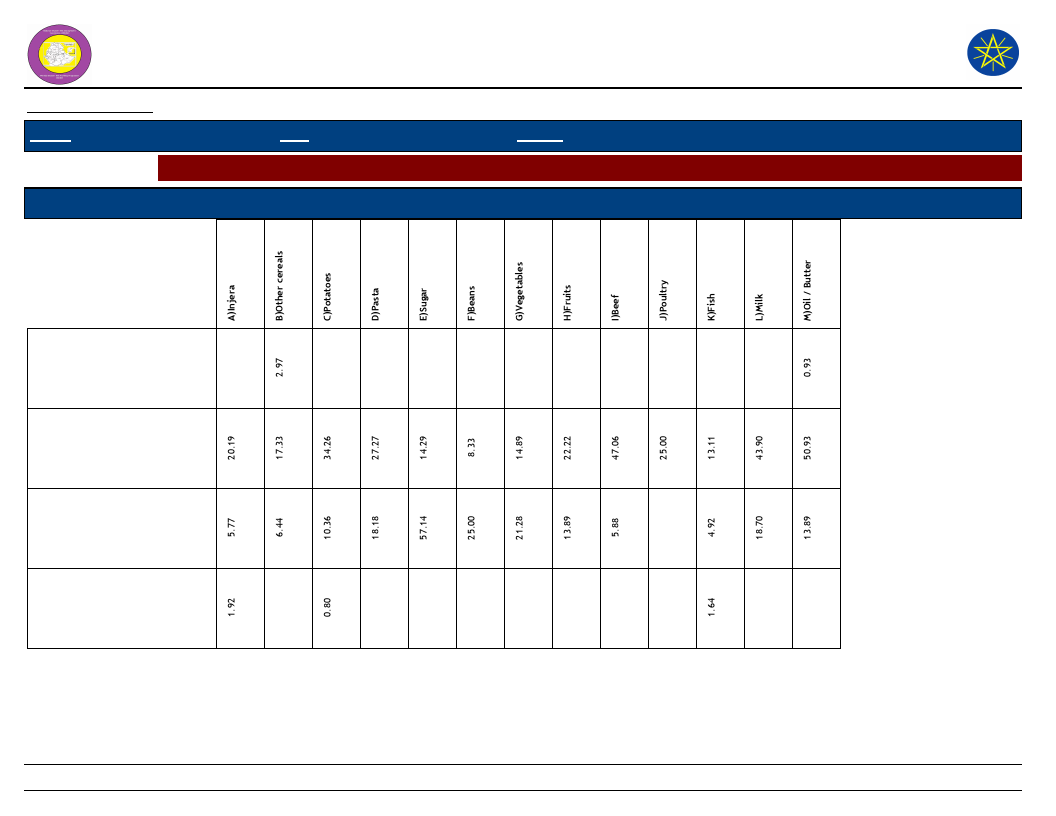
Wereda Disaster Risk
Profile
National Disaster Risk Management
Commission (NDRMC)
Data_Collected_Date
Region S.N.N.P
March 2017
Zone
GAMO GOFA
Wereda BONKE
Friday, July 21, 2017
Selected Indictor: Economic Vulnerability: Sources of Food - Households source for different food items (response in %)
Source of Food
Types of Food Item
F)Free meals/Food
assistance
G)Purchase from
roadside vendor/tuck
shop
H)Purchase subsidized
food from Kebele shop
K)Other
133
Page 2 of 2
WDRP Indicators
Crop Production Characteristics
134
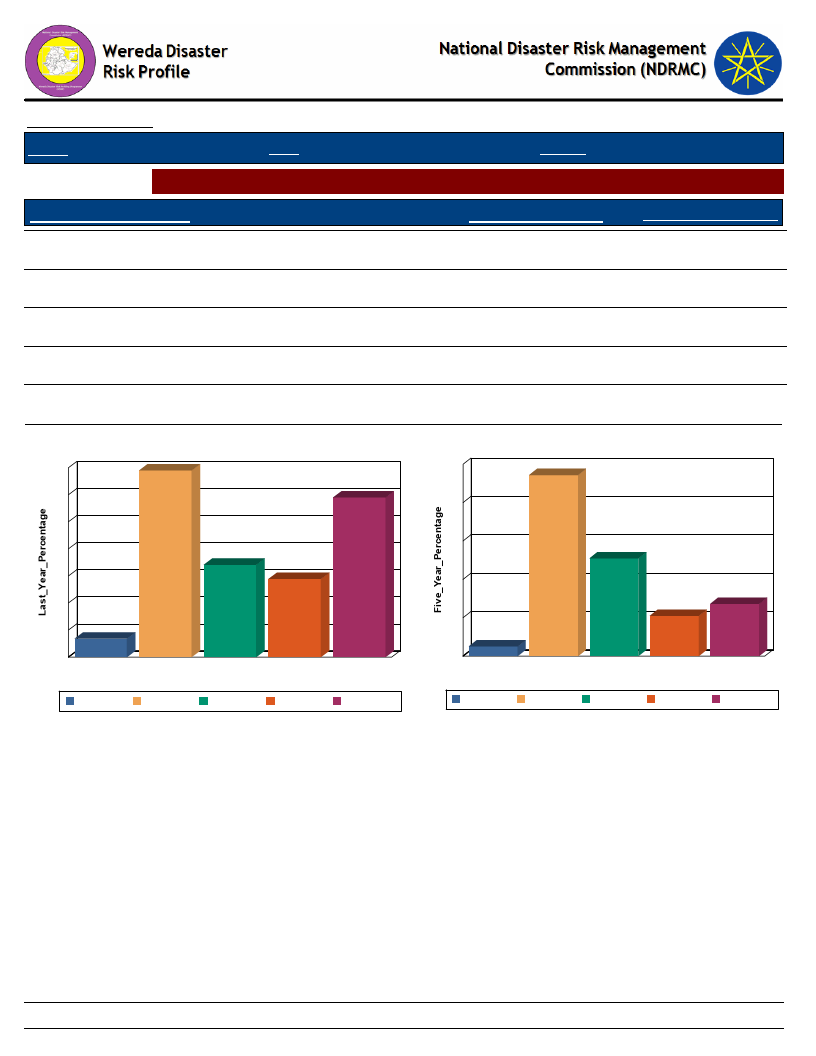
Data_Collected_Date
Region S.N.N.P
March 2017
Zone GAMO GOFA
Wereda BONKE
Selected Indictor: Hazards: Change in Crop Damages - Proportion of Total Crop Damage
Friday, July 21, 2017
Extent of Crop Damage (%)
0%
Last_Year_Percentage
3.39
Five_Year_Percentage
2.50
1 - 25 %
34.50
47.19
26 - 50 %
17.06
25.47
51 - 75 %
14.43
10.49
76 - 100 %
29.49
13.61
Extent of Crop Damage Last_Year
35
35
30
29
25
20
17
15
14
10
5
3
0
0%
0%
1 - 25 %
26 - 50 %
51 - 75 %
Extent of Crop Damage
1 - 25 %
26 - 50 %
51 - 75 %
76 - 100 %
76 - 100 %
Extent of Crop Damage Five Years Ago
50
47
40
30
20
10
3
0
0%
0%
25
14
10
1 - 25 %
26 - 50 % 51 - 75 %
Extent of Crop Damage
76 - 100 %
1 - 25 %
26 - 50 %
51 - 75 %
76 - 100 %
135
Page 1 of 1
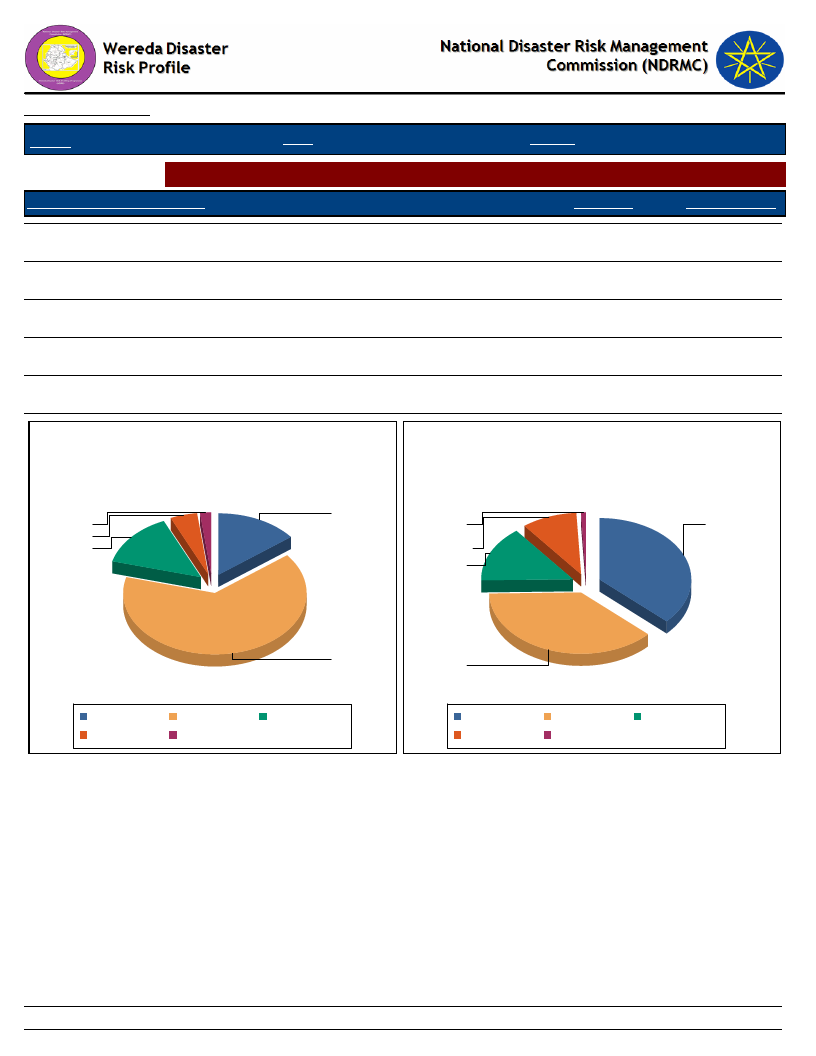
Data_Collected_Date
March 2017
Region S.N.N.P
Zone GAMO GOFA
Wereda BONKE
Selected Indictor: Hazards: Change in Crop Damages - Major reasons for crop damage
Major Reason of Crop Damage
Last_Year
A - Pests, Insects, Weeds
14.56
B - Drought
64.69
C - Flood
14.05
D - Frost/ Cold wave
4.77
E - Others (specify)
1.93
Friday, July 21, 2017
Five_Year_Ago
36.92
37.69
14.74
9.87
0.77
Major Reason of Crop Damage -
Last Year
14.6
1.9
4.8
14.1
Major Reason of Crop Damage -
Five Years Ago
E - Others
(specify)
D - Frost/ Cold
wave
C - Flood
A - Pests,
Insects,
Weeds
64.7
A - Pests, Insects,
Weeds
D - Frost/ Cold wave
B - Drought
E - Others (specify)
C - Flood
B - Drought
A - Pests, Insects,
Weeds
D - Frost/ Cold wave
B - Drought
E - Others (specify)
C - Flood
136
Page 1 of 1
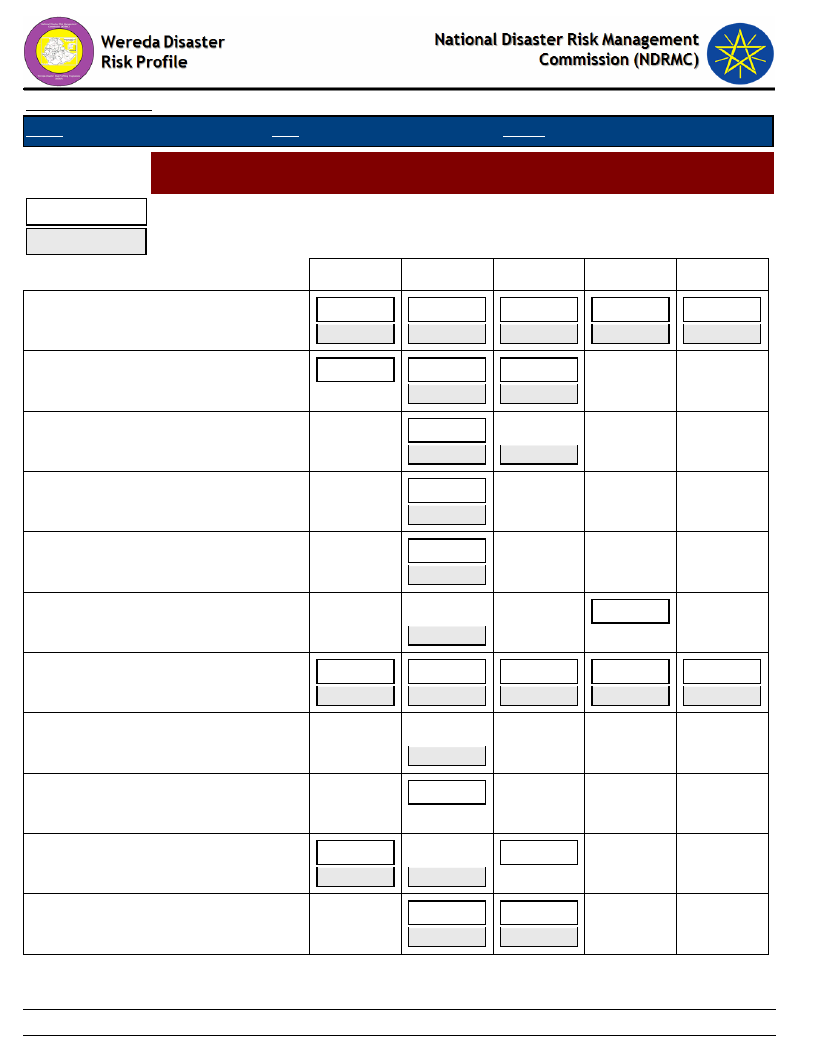
Data_Collected_Date
Region S.N.N.P
March 2017
Zone GAMO GOFA
Wereda BONKE
Selected Indictor:
Last Year
Five Years Ago
Hazards: Change in Crop Damages - Proportion of Damage for Major Crops
(percentage response by households)
Friday, July 21, 2017
0%
1-25%
26-50%
51-75%
76-100%
Barley
4.17
41.67
24.31
16.67
12.50
5.26
48.03
31.58
8.55
5.92
Beans
22.22
66.67
54.55
11.11
45.45
Coffee
100.00
50.00
50.00
Enset
100.00
100.00
Fruits
100.00
100.00
Lentils
100.00
100.00
Maize
1.79
27.35
14.80
10.76
44.39
0.48
44.23
18.75
8.65
26.92
Millet
100.00
Neug
100.00
Other cash crop
Other grain (specify)
50.00
20.00
80.00
66.67
66.67
50.00
33.33
33.33
137
Page 1 of 2
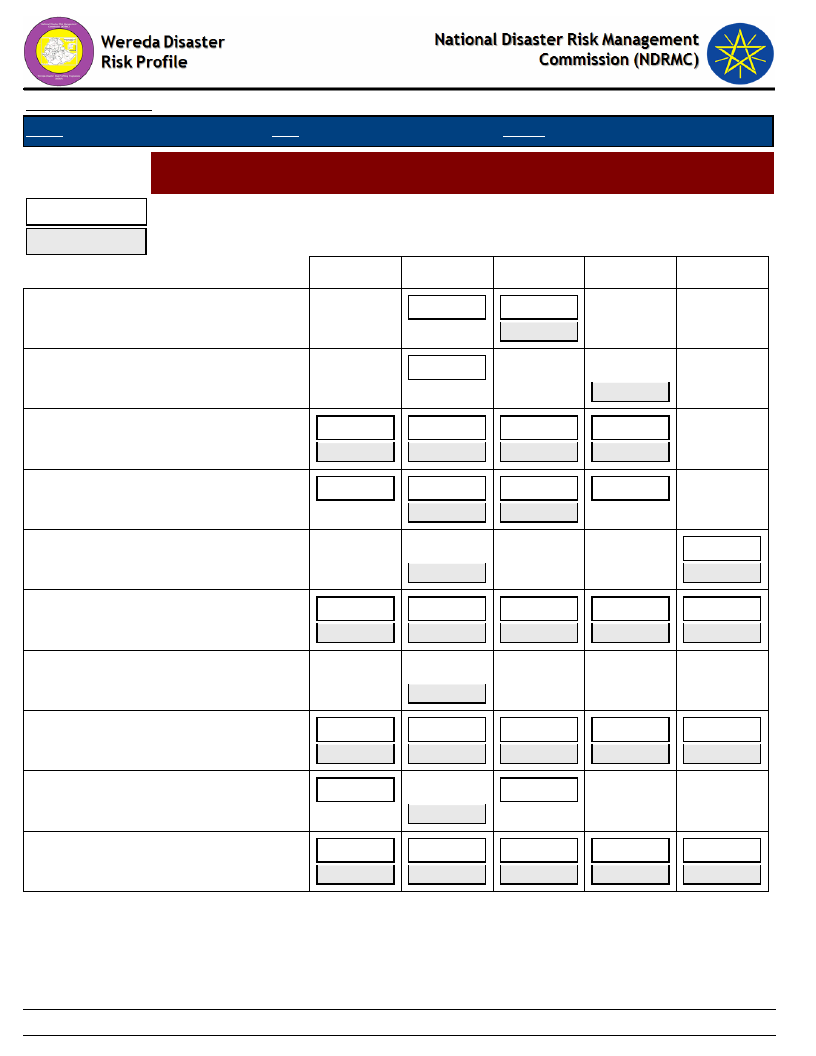
Data_Collected_Date
Region S.N.N.P
March 2017
Zone GAMO GOFA
Wereda BONKE
Selected Indictor:
Last Year
Five Years Ago
Hazards: Change in Crop Damages - Proportion of Damage for Major Crops
(percentage response by households)
0%
1-25%
26-50%
51-75%
Friday, July 21, 2017
76-100%
Other oilseed
50.00
50.00
100.00
Other pulses
100.00
100.00
Peas
20.00
4.76
30.00
38.10
30.00
42.86
20.00
14.29
Root & tubers
14.29
28.57
50.00
42.86
50.00
14.29
Sesame
33.33
100.00
66.67
Sorghum
3.33
26.67
13.33
14.44
41.11
1.72
49.14
25.86
6.90
16.38
Sunflower
100.00
Teff
2.25
35.39
11.24
16.85
32.58
1.85
46.30
22.84
16.05
11.73
Vegetables
50.00
100.00
50.00
Wheat
2.63
37.72
21.93
17.54
18.42
4.00
45.00
31.00
15.00
4.00
138
Page 2 of 2
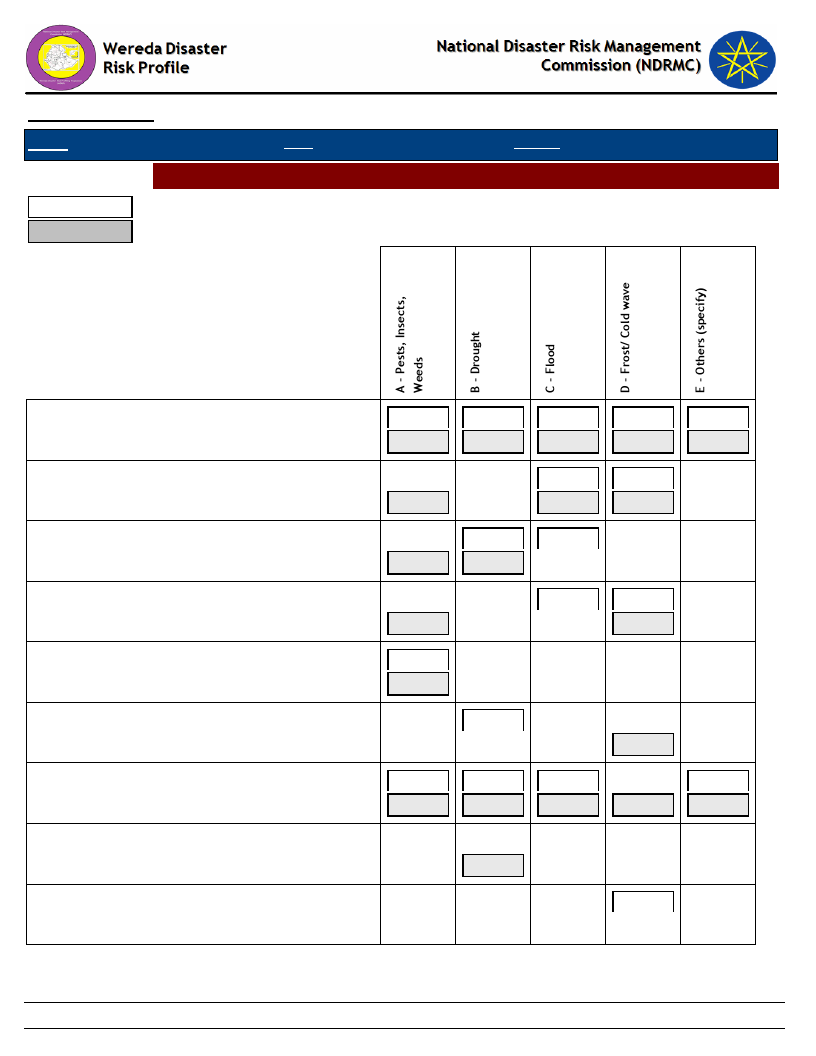
Data_Collected_Date
Region S.N.N.P
March 2017
Zone GAMO GOFA
Wereda BONKE
Hazards: Change in Crop Damages - Reasons for Damage of Major Crops
Last Year
Five Years Ago
Friday, July 21, 2017
Barley
Beans
Coffee
Enset
Fruits
Lentils
Maize
Millet
Neug
32.86
27.14
27.86
8.57
3.57
49.66
16.55
17.24
15.17
1.38
18.18
85.71
54.55
14.29
27.27
50.00
66.67
50.00
33.33
33.33
50.00
50.00
66.67
100.00
100.00
100.00
100.00
6.85
88.58
3.65
0.91
34.31
50.00
11.27
3.92
0.49
100.00
100.00
139
Page 1 of 3
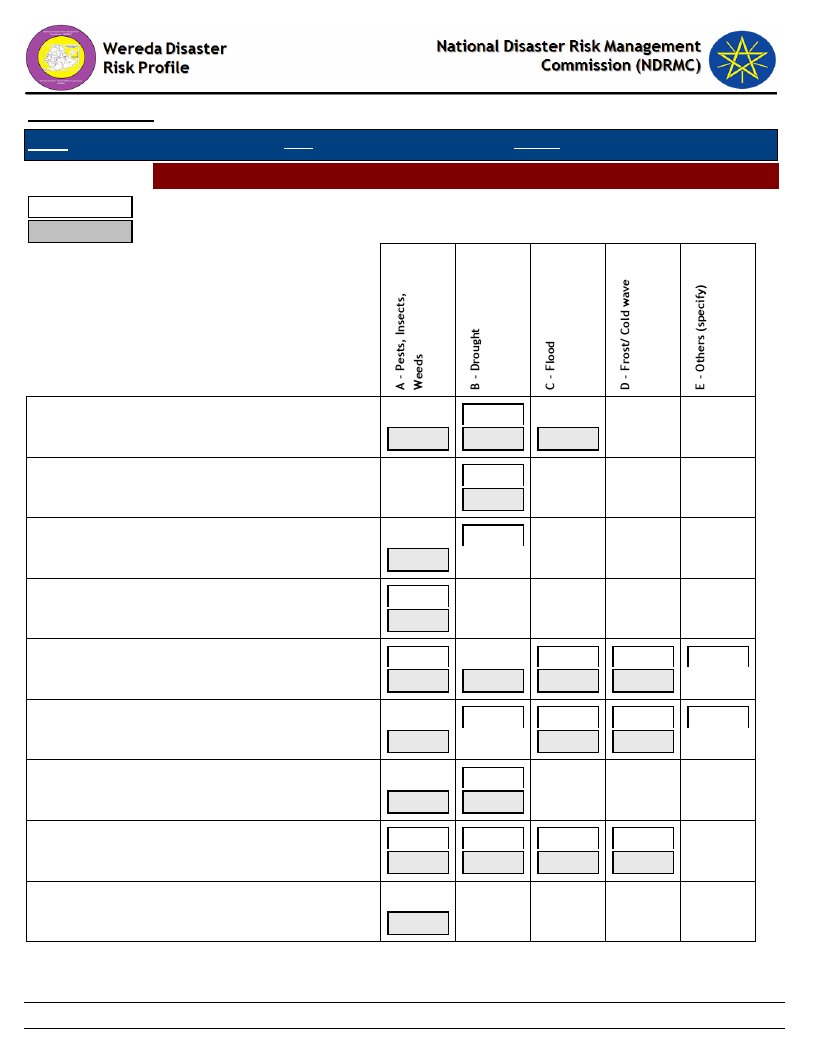
Data_Collected_Date
Region S.N.N.P
March 2017
Zone GAMO GOFA
Wereda BONKE
Hazards: Change in Crop Damages - Reasons for Damage of Major Crops
Last Year
Five Years Ago
Friday, July 21, 2017
Other cash crop
Other grain (specify)
Other oilseed
Other pulses
Peas
Root & tubers
Sesame
Sorghum
Sunflower
20.00
100.00
100.00
100.00
33.33
21.05
25.00
33.33
4.55
31.58
100.00
60.00
100.00
100.00
100.00
31.58
33.33
100.00
66.67
87.50
57.02
20.00
44.44
21.05
16.67
50.00
5.68
7.02
11.11
26.32
33.33
25.00
2.27
4.39
11.11
16.67
100.00
140
Page 2 of 3
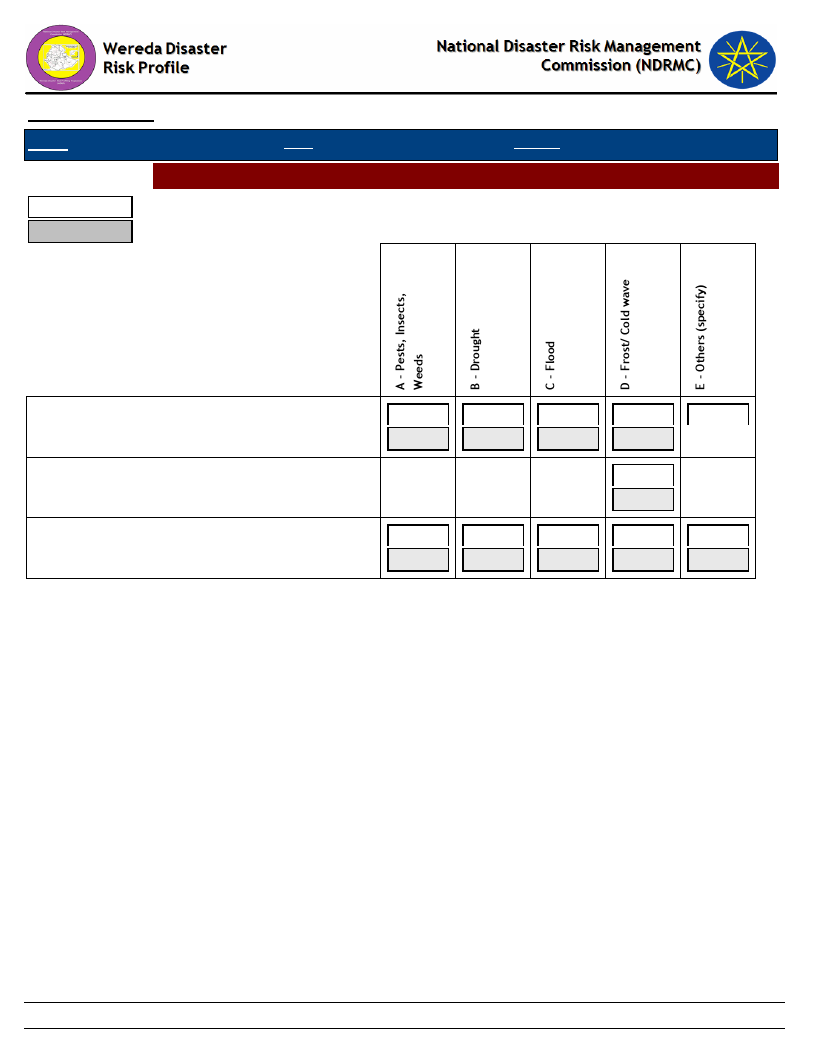
Data_Collected_Date
Region S.N.N.P
March 2017
Zone GAMO GOFA
Wereda BONKE
Hazards: Change in Crop Damages - Reasons for Damage of Major Crops
Last Year
Five Years Ago
Friday, July 21, 2017
Teff
Vegetables
Wheat
9.14
82.29
6.29
1.14
1.14
38.75
46.25
10.62
4.38
100.00
100.00
21.82
31.82
30.00
12.73
3.64
33.33
12.50
30.21
20.83
3.12
141
Page 3 of 3
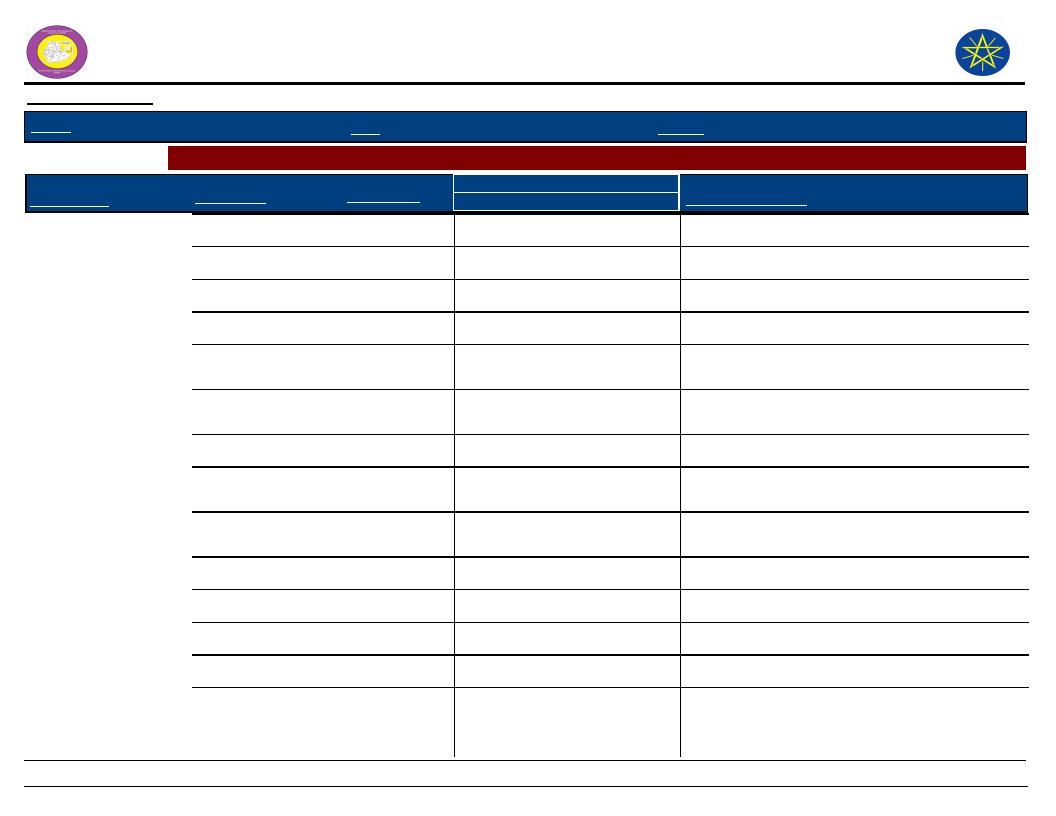
Wereda Disaster
Risk Profile
Data_Collected_Date
March 2017
Region
S.N.N.P
Zone
GAMO GOFA
National Disaster Risk Management
Commission (NDRMC)
Friday, July 21, 2017
Wereda
BONKE
Selected Indictor:
Kebele Name
ALGUDA
Agricultural Situation: Change in Crops Grown - Five major crops grown by proportion of total cultivated land
Major Crops
Main Season
Present
Cropped Area
Five_Years_Ago
Reason_For_Change
Wheat
Meher
40
38
Better yield
Barley
Meher
35
40
Decrease productivity
Potatoes
Belg
25
22
Resist drought
YELA
Wheat
Meher
20
25
High demand
Vegetables
Potatoes
Barley
Belg and
15
Meher
Belg and
35
Meher
Meher
35
11
Because, it is cash crop
32
Resist acidity
32
Yield decreased
CHOSHA
Potatoes
Vegetables
Wheat
Belg and
40
Meher
Belg and
25
Meher
Meher
20
30
High yield
15
For income generation
15
High yield
Banana
Meher
15
40
Low yield
DENBILE OSA
Sorghum
Belg
25
50
Low income and low yield
Teff
Meher
25
35
Low yield
Maize
Belg and
50
Meher
30
High yield
142
Page 1 of 9
Wereda Disaster
Risk Profile
Data_Collected_Date
March 2017
Region
S.N.N.P
Zone
GAMO GOFA
National Disaster Risk Management
Commission (NDRMC)
Friday, July 21, 2017
Wereda
BONKE
Selected Indictor:
Kebele Name
DEMBILE OTORA
Agricultural Situation: Change in Crops Grown - Five major crops grown by proportion of total cultivated land
Major Crops
Main Season
Present
Cropped Area
Five_Years_Ago
Reason_For_Change
Teff
Meher
25
16
Yield increased
Maize
Haricot Bean
Vegetables
Belg and
30
Meher
Belg and
30
Meher
Meher
15
27
Yield increased
27
Yield increased
30
Yield decreased
DESHKELE
Sorghum
Belg
15
25
Due to shortage of land
Barley
Meher
20
25
Due to shortage of land
Maize
Belg
20
25
Due to shortage of land
Wheat
Meher
15
20
Due to shortage of land
DURIBE
Potatoes
Maize
Teff
Sorghum
Belg and
30
Meher
Belg and
35
Meher
Belg and
25
Meher
Belg
20
15
High yield
30
High yield
22
High income
33
Low yield
FADELE
Sweet Potato
Barley
Belg and
20
Meher
Meher
15
15
Resist drought
25
Because of climate change
143
Page 2 of 9

Wereda Disaster
Risk Profile
Data_Collected_Date
March 2017
Region
S.N.N.P
Zone
GAMO GOFA
National Disaster Risk Management
Commission (NDRMC)
Friday, July 21, 2017
Wereda
BONKE
Selected Indictor:
Kebele Name
FADELE
Agricultural Situation: Change in Crops Grown - Five major crops grown by proportion of total cultivated land
Major Crops
Main Season
Present
Cropped Area
Five_Years_Ago
Reason_For_Change
Soya Bean
Belg and
13
10
Meher
Sorghum
Belg
5
15
Low yield
FISHITO
Teff
Maize
Teff
Belg and
20
Meher
Belg and
25
Meher
Meher
25
15
Due to high price
15
Due to high yield
20
High income
Maize
Barley
Belg and
35
Meher
Belg
20
25
Increase yield
30
Low yield
Sorghum
Belg
20
25
It takes long time to harvest
GARIBANISA SOROGE
Potatoes
Wheat
Belg and
50
Meher
Meher
25
35
Resist soil acidity
37
Acidity of soil
Barley
Meher
25
28
Shortage of land, Yield decrease
GERASE ZALA
Barley
Maize
Belg and
25
Meher
Belg
20
23
High yield
20
High yield
Teff
Meher
25
23
High yield
144
Page 3 of 9
Wereda Disaster
Risk Profile
Data_Collected_Date
March 2017
Region
S.N.N.P
Zone
GAMO GOFA
National Disaster Risk Management
Commission (NDRMC)
Friday, July 21, 2017
Wereda
BONKE
Selected Indictor:
Kebele Name
GERASE ZALA
Agricultural Situation: Change in Crops Grown - Five major crops grown by proportion of total cultivated land
Major Crops
Main Season
Present
Cropped Area
Five_Years_Ago
Reason_For_Change
Sorghum
Belg
15
13
New variety
Wheat
Belg
15
24
Low yield
GERIBANISA KARICHE
Maize
Belg
14
15
Shortage of farm land
Irish potato
Wheat
Belg and
18
Meher
Meher
34
20
Shortage of farm land
35
Shortage of farm land
Barley
Meher
28
30
Shortage of farm land
GERIBANISHA GALO
Barley
Meher
46
50
Shortage of land
Wheat
Meher
26
30
Shortage of land
Potatoes
Enset
Belg and
14
Meher
Meher
14
15
Shortage of land
5
Because it can resist drought
GEZESO
Peas
Meher
8
10
Climate change
Sorghum
Beans
Belg and
20
Meher
Meher
10
30
Climate change
15
Climate change
Wheat
Meher
35
30
For income
Irish potato
Belg and
27
Meher
15
For income
145
Page 4 of 9
Wereda Disaster
Risk Profile
Data_Collected_Date
March 2017
Region
S.N.N.P
Zone
GAMO GOFA
National Disaster Risk Management
Commission (NDRMC)
Friday, July 21, 2017
Wereda
BONKE
Selected Indictor:
Kebele Name
GOBO BAKE
Agricultural Situation: Change in Crops Grown - Five major crops grown by proportion of total cultivated land
Major Crops
Main Season
Present
Cropped Area
Five_Years_Ago
Reason_For_Change
Maize
Belg and
45
Meher
25
To increase yield
Teff
Meher
35
25
To increase yield
Wheat
Meher
5
10
To increase production
GORATE
Barley
Teff
Sweet Potato
Belg and
15
Meher
Belg and
13
Meher
Meher
13
40
Low yield
13
High price
10
Resistance of drought
Maize
Barley
Belg and
14
Meher
Meher
20
10
High yield
23
Due to yield
Wheat
Meher
25
21
Due to productivity
KALIBO LAKA
Wheat
Meher
30
32
Poor settlement
Potatoes
Barley
Belg and
35
Meher
Meher
28
26
High yield
32
Poor settlement
Beans
Meher
3
4
Loss of fertility
Peas
Meher
4
6
Loss of fertility
146
Page 5 of 9
Wereda Disaster
Risk Profile
Data_Collected_Date
March 2017
Region
S.N.N.P
Zone
GAMO GOFA
National Disaster Risk Management
Commission (NDRMC)
Friday, July 21, 2017
Wereda
BONKE
Selected Indictor:
Kebele Name
KALO GAGULA
Agricultural Situation: Change in Crops Grown - Five major crops grown by proportion of total cultivated land
Major Crops
Main Season
Present
Cropped Area
Five_Years_Ago
Reason_For_Change
Vegetables
---------
10
8
Cash crop
Barley
---------
30
42
Low yield
Potatoes
---------
25
20
Drought resistant
Wheat
---------
35
30
High yield
KAMELE BARIE ORO
Wheat
Meher
35
37
Loss of soil fertility, Poor settlement
Potatoes
Barley
Belg and
35
Meher
Meher
30
30
Resist solid acidity
33
Fertility decreased
DIMELE FUSE
Teff
Meher
25
20
High income
Irish potato
Sorghum
Belg and
23
Meher
Belg
22
20
It resist drought
20
It resist drought
KACHA KASHISO
Maize
Potatoes
Barley
Belg and
30
Meher
Belg and
55
Meher
Meher
45
40
Poor settlement
45
Yield increased
55
Poor settlement, Loss of soil fertility
KETELE
Maize
Belg and
25
Meher
33
Shortage of rainfall
147
Page 6 of 9
Wereda Disaster
Risk Profile
Data_Collected_Date
March 2017
Region
S.N.N.P
Zone
GAMO GOFA
National Disaster Risk Management
Commission (NDRMC)
Friday, July 21, 2017
Wereda
BONKE
Selected Indictor:
Kebele Name
KETELE
Agricultural Situation: Change in Crops Grown - Five major crops grown by proportion of total cultivated land
Major Crops
Main Season
Present
Cropped Area
Five_Years_Ago
Reason_For_Change
Sorghum
Belg
30
25
Access of improved seeds
Sweet Potato
Belg
10
8
Resistance if drought
Soya Bean
Belg
15
15
Teff
Meher
20
19
High income
KOLE KANCHAME
Potatoes
Beans
Belg and
34
Meher
Meher
6
25
Resist drought
10
Decrease soil fertility
Chick Pea
Meher
5
9
Decrease soil fertility
Barley
Meher
25
31
Low yield
Wheat
Meher
30
25
High yield
KOLE ZALE
Potatoes
Wheat
Belg and
35
Meher
Meher
21
30
To resist drought
27
Decrease soil fertility
Peas
Meher
5
8
Low yield
Beans
Meher
6
12
Low yield
Barley
Meher
25
20
Due to soil fertility
KOSHALE
Sorghum
Belg
75
90
To get high yield
148
Page 7 of 9

Wereda Disaster
Risk Profile
Data_Collected_Date
March 2017
Region
S.N.N.P
Zone
GAMO GOFA
National Disaster Risk Management
Commission (NDRMC)
Friday, July 21, 2017
Wereda
BONKE
Selected Indictor:
Kebele Name
KOSHALE
KOYRA MUKULA
Agricultural Situation: Change in Crops Grown - Five major crops grown by proportion of total cultivated land
Major Crops
Main Season
Present
Cropped Area
Five_Years_Ago
Reason_For_Change
Maize
Belg and
25
Meher
10
To get high yield
Teff
Belg and
40
25
High income
Meher
Maize
Belg and
45
Meher
30
High yield
Sorghum
Belg
35
20
High yield
Wheat
Belg
15
20
Climate change Grazing land
Barley
Meher
20
25
Climate change
KALO GAGULA
Irish potato
Barley
Belg and
20
Meher
Meher
30
15
To harvest in short period of time
25
Low yield
Sorghum
Belg
20
25
Low income
Wheat
Meher
30
35
High income
ZEGA
Teff
Maize
Haricot Bean
Belg and
25
Meher
Belg and
20
Meher
Belg and
30
Meher
40
Due to climate charge
10
Due to improved variety
20
New variety
149
Page 8 of 9
Wereda Disaster
Risk Profile
Data_Collected_Date
March 2017
Region
S.N.N.P
Zone
GAMO GOFA
National Disaster Risk Management
Commission (NDRMC)
Friday, July 21, 2017
Wereda
BONKE
Selected Indictor:
Kebele Name
ZEGA
Agricultural Situation: Change in Crops Grown - Five major crops grown by proportion of total cultivated land
Major Crops
Barley
Main Season
Belg and
Meher
Present
15
Cropped Area
Five_Years_Ago
25
Reason_For_Change
Due to seasonal change
Sorghum
Belg
10
15
Due to climate change
ZAZIE
Potatoes
Sorghum
Belg and
35
Meher
Meher
30
32
High yield
48
Low yield
Wheat
Meher
35
20
High yield
150
Page 9 of 9
Data_Collected_Date
March 2017
Region S.N.N.P
Zone GAMO GOFA
Wereda BONKE
Selected Indictor:
Agricultural Situation: Access to Extension - Perception of the community on
Access to Agricultural extension Services
Friday, July 21, 2017
KebeleName
Current_Level
Change_In_Last_Decade
Comments
ZEGA
Medium
FADELE
Good
GERIBANISHA
GALO
GERIBANISA
KARICHE
ZAZIE
Medium
Medium
Medium
GORATE
Good
GARIBANISA
SOROGE
KOLE KANCHAME
Medium
Medium
Increased
Increased
The same
Increased
Increased
Increased
Increased
Increased
There is no agricultural
extension
Increase the number of
experts
Access of agricultural
extension
There is agricultural
extension
The number of experts
increased
The number of experts
increased
The number of expert is
increased.
Supply increasing
KOLE ZALE
YELA
KOYRA MUKULA
Medium
Good
Good
Increased
Increased
Increased
There is agricultural
extension
There is agricultural
extension
Extension of technology
KETELE
FISHITO
Good
Increased
There is extension of
technology
DURIBE
ALGUDA
Medium
Good
Increased
Increased
Extension services are
increased
There are experts.
KACHA KASHISO
CHOSHA
KAMELE BARIE
ORO
Medium
Medium
Good
Increased
Increased
Increased
151
The number of experts
are increased
There is agricultural
extension
Increase number of
experts
Page 1 of 2

Data_Collected_Date
March 2017
Region S.N.N.P
Zone GAMO GOFA
Wereda BONKE
Selected Indictor:
Agricultural Situation: Access to Extension - Perception of the community on
Access to Agricultural extension Services
Friday, July 21, 2017
KebeleName
Current_Level
Change_In_Last_Decade
Comments
KALIBO LAKA
GEZESO
Good
Poor
Increased
Increased
The number of experts
increased
DENBILE OSA
Medium
The same
DESHKELE
Medium
Increased
There is accessibility.
KALO GAGULA
Medium
Increased
There is access.
GERASE ZALA
Medium
Increased
There is access
KALO GAGULA
Medium
DEMBILE OTORA
Medium
Increased
Increased
Access of extension
experts
There is access
KOSHALE
Medium
Increased
Change in awareness
GOBO BAKE
Medium
DIMELE FUSE
Good
Increased
Increased
The number of
agricultural experts is
increased.
Extension experts
152
Page 2 of 2
Data_Collected_Date
Region S.N.N.P
March 2017
Zone GAMO GOFA
Wereda
BONKE
Friday, July 21, 2017
Selected Indicator
Economic Vulnerability: Crops Grown - Types of crops grown by households
Major Crop Type
Maize
Type of Crops Grown
Last Year
27.98
Type of Crops Grown
Five Years Ago
25.97
Teff
22.33
20.22
Barley
18.07
18.98
Wheat
14.30
12.48
Sorghum
11.29
14.48
Peas
1.25
2.62
Beans
1.13
1.37
Root & tubers
0.88
0.50
Other grain (specify)
0.38
0.37
Coffee
0.38
0.25
Fruits
0.38
0.25
Vegetables
0.25
0.25
Other oilseed
0.25
0.12
Sesame
0.25
0.37
Other cash crop
0.25
Enset
0.25
0.37
Other pulses
0.13
0.12
Neug
0.13
Lentils
0.13
0.25
Sunflower
0.12
Millet
0.25
153
Page 1 of 2
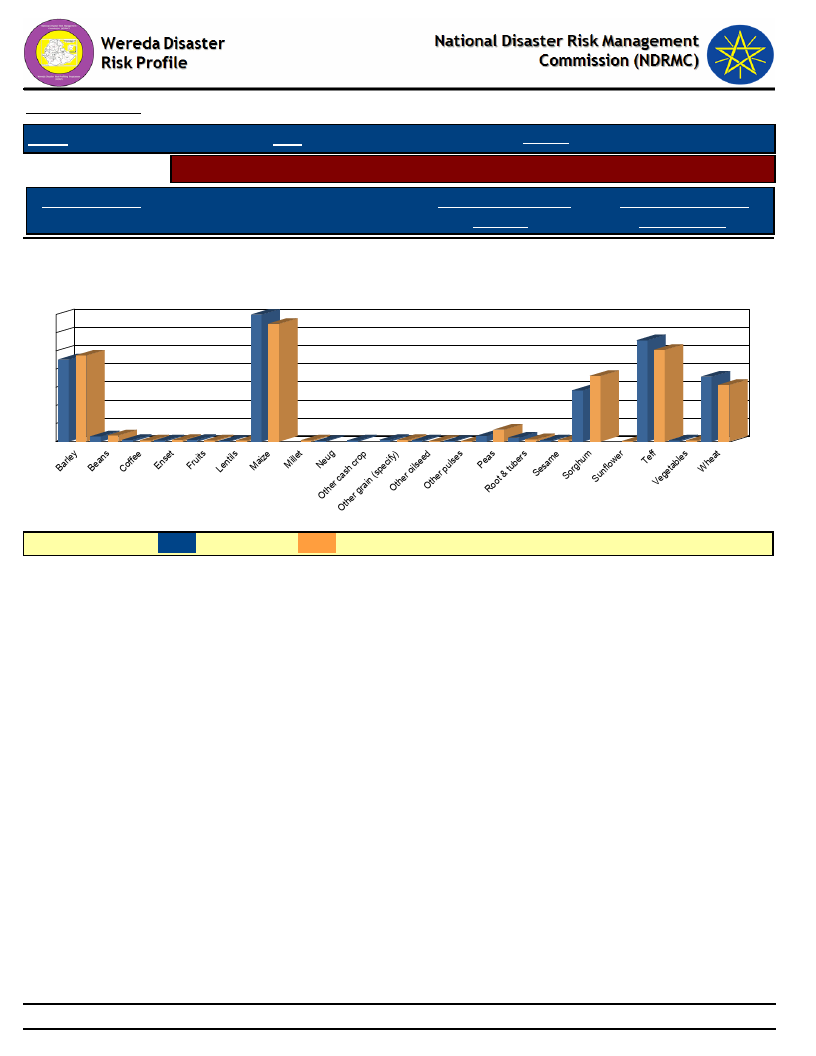
Data_Collected_Date
Region S.N.N.P
Selected Indicator
Major Crop Type
March 2017
Zone GAMO GOFA
Wereda
BONKE
Friday, July 21, 2017
Economic Vulnerability: Crops Grown - Types of crops grown by households
Type of Crops Grown
Last Year
Type of Crops Grown
Five Years Ago
Types of Crops Grown - Percent Responses of HHs for Last Year as compared to
Five Years Ago
28
24
20 18 19
28
26
22
20
16
14
14
12
12
11
8
4
1 10 00 00 00 0
0
3
00
0
0
00
00
1
0
1 10 0
0
00
LEGEND :
Last year
Five Years Ago
154
Page 2 of 2
Data_Collected_Date
Region S.N.N.P
March 2017
Zone
GAMO GOFA
Wereda BONKE
Selected Indictor:
Economic Vulnerability: Crops Grown - Proportion of households by amount of
yield of major crops (last year)
Friday, July 21, 2017
Barley
Beans
Coffee
Enset
Fruits
Lentils
Maize
Millet
Neug
Other cash crop
Other grain (specify)
Other oilseed
Other pulses
Peas
Root & tubers
Sesame
Sorghum
Sunflower
Teff
Vegetables
42.36
54.17
3.47
77.78
22.22
33.33
66.67
50.00
50.00
33.33
66.67
100.00
42.15
45.29
10.31
1.79
0.45
100.00
50.00
50.00
100.00
100.00
100.00
80.00
20.00
28.57
71.43
100.00
55.56
40.00
3.33
1.11
49.44
46.07
3.37
0.56
100.00
155
0.56
Page 1 of 2
Data_Collected_Date
Region S.N.N.P
March 2017
Zone
GAMO GOFA
Wereda BONKE
Selected Indictor:
Economic Vulnerability: Crops Grown - Proportion of households by amount of
yield of major crops (last year)
Friday, July 21, 2017
Wheat
39.47
51.75
7.02
0.88
0.88
156
Page 2 of 2
Data_Collected_Date
Region S.N.N.P
March 2017
Zone GAMO GOFA
Wereda BONKE
Friday, July 21, 2017
Selected Indictor:
Economic Vulnerability: Crops Grown - Proportion of households by amount of
yield of major crops (Five Years Ago)
Types of Major Crops
Category of Yield used to be obtained five years ago
Barley
Beans
Coffee
Enset
Fruits
Lentils
Maize
Millet
Neug
Other cash crop
Other grain (specify)
Other oilseed
Other pulses
Peas
Root & tubers
Sesame
35.53
57.89
4.61
0.66
0.66
0.66
81.82
18.18
100.00
33.33
66.67
50.00
50.00
50.00
50.00
21.63
59.62
15.38
1.92
1.44
100.00
80.00
100.00
61.90
50.00
66.67
20.00
100.00
100.00
38.10
33.33
157
50.00
Page 1 of 2
Data_Collected_Date
Region S.N.N.P
March 2017
Zone GAMO GOFA
Wereda BONKE
Friday, July 21, 2017
Selected Indictor:
Economic Vulnerability: Crops Grown - Proportion of households by amount of
yield of major crops (Five Years Ago)
Types of Major Crops
Category of Yield used to be obtained five years ago
Sorghum
Sunflower
Teff
Vegetables
Wheat
30.17
59.48
9.48
0.86
100.00
37.04
58.02
3.70
0.62
0.62
100.00
35.00
57.00
7.00
1.00
158
Page 2 of 2
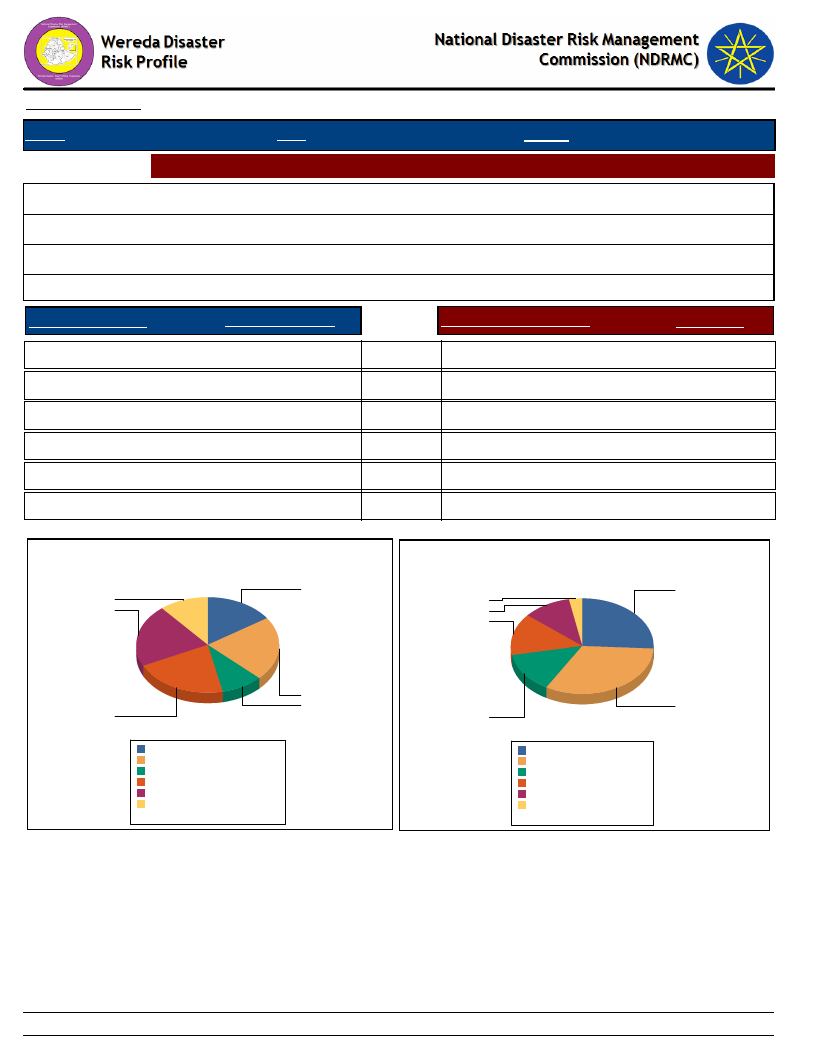
Data_Collected_Date
March 2017
Friday, July 21, 2017
Region S.N.N.P
Zone GAMO GOFA
Wereda BONKE
Selected Indictor: Economic Vulnerability: Land Ownership and Quality - Landownership of HHs
Households owning land (%)
Average landholding (in Hectares)s
Households cultivating land in last 12 months (%)
Average quantity of land cultivated (in hectares)
89.95
1.23
95.40
0.83
Range Land Holding
Percent_Response
Range of Cultivated Land
% Response
A - Less than 0.25 ha
16.0
B - 0.25 - 0.50 ha
22.0
C - 0.5 - 0.75 ha
9.0
D - 0.75 - 1 ha
21.0
E - 1 - 2 ha
21.0
F - More than 2 ha
11.0
IMPORTANT: ha = Hectars
Household Responses to Range Land Holding
A - Less than 0.25 ha
25.0
B - 0.25 - 0.50 ha
32.0
C - 0.5 - 0.75 ha
13.0
D - 0.75 - 1 ha
14.0
E - 1 - 2 ha
11.0
F - More than 2 ha
3.0
Household Responses to Range Cultivated Land
15.8
25.2
11.5
2.9
21.5
10.6
14.0
21.5
22.4
9.5
A - Less than 0.25 ha
B - 0.25 - 0.50 ha
C - 0.5 - 0.75 ha
D - 0.75 - 1 ha
E - 1 - 2 ha
F - More than 2 ha
15.4%
21.9%
9.3%
21.1%
21.1%
11.2%
Total:
100.0%
13.2
31.8
A - Less than 0.25 ha 25.2
B - 0.25 - 0.50 ha
31.8
C - 0.5 - 0.75 ha
13.2
D - 0.75 - 1 ha
14.0
E - 1 - 2 ha
10.6
F - More than 2 ha
2.9
Total:
97.7
159
Page 1 of 1
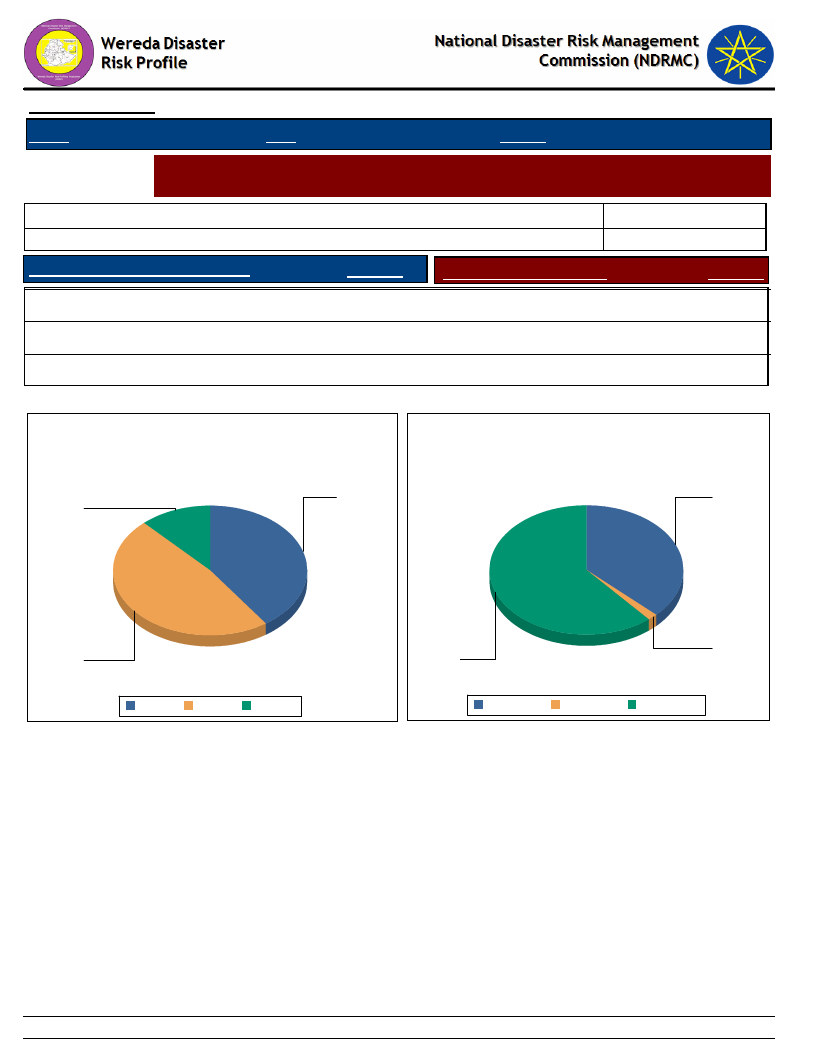
Data_Collected_Date
March 2017
Friday, July 21, 2017
Region S.N.N.P
Zone GAMO GOFA
Wereda BONKE
Selected Indictor:
Economic Vulnerability: Land Ownership and Quality - Farmers’ perception on the
quality of their agricultural land
Cropping_Intensity *
Households with enough land for farming
HHs with favourable location of farm
Response
Households with fertile soil
0.92
11.78
Response
Yes
11.92
Highly fertile
1.55
Partially
47.67
Fertile
37.21
No
40.41
Not fertile
61.24
* Cropping Intensity = (Gross Cropped Area / Net Cropped Area )x 100%
Household responses to the type of farm
location
Household responses tp the type of soil
fertility
40
37
12
48
No
Partially Yes
Gross Cropped Area = Irrigated Area + Unirrigated
Area
2
61
Fertile
Highly fertile Not fertile
Net Cropped Area = Total Cultivated Area in last
12 months
160
Page 1 of 1
Data_Collected_Date
March 2017
Friday, July 21, 2017
Region S.N.N.P
Selected Indictor:
KebeleName
ZEGA
FADELE
GERIBANISHA
GALO
GERIBANISA
KARICHE
ZAZIE
GORATE
GARIBANISA
SOROGE
KOLE KANCHAME
KOLE ZALE
YELA
KOYRA MUKULA
KETELE
FISHITO
DURIBE
ALGUDA
KACHA KASHISO
CHOSHA
KAMELE BARIE
ORO
KALIBO LAKA
GEZESO
DENBILE OSA
DESHKELE
Zone GAMO GOFA
Wereda BONKE
Agricultural Situation: Access to Inputs - Perception of the community on access
to improved agricultural inputs
Current_Level
Poor
Good
Medium
Change_In_Last_Decade
Increased
Increased
The same
Comments
Climate change, Shortage
of rain
Increase the number of
experts
Shortage of fund
Poor
Decreased
High price
Medium
Good
Good
Increased
Increased
Increased
High price to buy the
inputs
Access increased
Access was improved
Medium
Medium
Good
Medium
Good
Medium
Medium
Medium
Poor
Good
Medium
Increased
Decreased
Increased
Increased
Increased
Increased
Increased
Increased
Increased
Decreased
Increased
The number of experts
increasing
High price
Access increased
Good access
Access increased but in
high price
Unseasonal rainfall
High price
High price
Improved seeds access
High price
High price of inputs
Medium
Medium
Good
Medium
Increased
Increased
Increased
Increased
There is access
High price
The number is increased
161
Page 1 of 2
Data_Collected_Date
March 2017
Friday, July 21, 2017
Region S.N.N.P
Selected Indictor:
KebeleName
KALO GAGULA
GERASE ZALA
KALO GAGULA
DEMBILE OTORA
KOSHALE
GOBO BAKE
DIMELE FUSE
Zone GAMO GOFA
Wereda BONKE
Agricultural Situation: Access to Inputs - Perception of the community on access
to improved agricultural inputs
Current_Level
Change_In_Last_Decade
Comments
Good
Good
Medium
Good
Poor
Poor (Black leg, Anthrax)
Good
Increased
Increased
The same
Increased
The same
Increased
Increased
The number is increased.
The number is increased
Lack of fund
The number is increased
No more difference
Shortage of rain
Accessed
162
Page 2 of 2

Data_Collected_Date
Region S.N.N.P
March 2017
Zone GAMO GOFA
Wereda BONKE
Friday, July 21, 2017
Selected Indictor:
Agricultural Situation: Water for irrigation - Access to water for irrigation in the
community
KebeleName
Current_Level
Change_In_Last_Decade
Comments
ZEGA
No
FADELE
GERIBANISHA GALO
GERIBANISA
KARICHE
ZAZIE
GORATE
GARIBANISA
SOROGE
KOLE KANCHAME
KOLE ZALE
YELA
KOYRA MUKULA
KETELE
FISHITO
DURIBE
ALGUDA
KACHA KASHISO
CHOSHA
KAMELE BARIE ORO
KALIBO LAKA
GEZESO
DENBILE OSA
DESHKELE
KALO GAGULA
GERASE ZALA
Poor
Poor
Poor
Poor
Poor
Good
Poor
Medium
Medium
Poor
Poor
Poor
Poor
Poor
Poor
Poor
Poor
Medium
Poor
Poor
Poor
Poor
The same
Decreased
Decreased
Decreased
Increased
Decreased
Decreased
Decreased
Increased
Increased
Decreased
Decreased
The same
Decreased
Decreased
Decreased
Decreased
Decreased
Decreased
Increased
Decreased
Decreased
Decreased
Decreased
No water access, No capacity to
build
Shortage of rain
Climate change
High demand of water due to its
shortage
Lack of irrigation
Climate change
Shortage of rain
Climate change
Increase productivity
Climate change
Decrease productivity
No capacity to build
Lack of irrigation
Climate change
Climate change
Shortage of water
Deforestation
Climate change
Lack of irrigation
Climate change
Yield decreased
Yield decreased
Yield reduction
163
Page 1 of 2

Data_Collected_Date
Region S.N.N.P
March 2017
Zone GAMO GOFA
Wereda BONKE
Friday, July 21, 2017
Selected Indictor:
Agricultural Situation: Water for irrigation - Access to water for irrigation in the
community
KebeleName
Current_Level
Change_In_Last_Decade
Comments
KALO GAGULA
DEMBILE OTORA
KOSHALE
GOBO BAKE
DIMELE FUSE
Poor
Medium
Very poor
Poor
Poor
Decreased
Decreased
Decreased
Increased
Decreased
Climate change
Shortage of water
Climate change, Shortage of
rain
Productivity decreased
Climate change
164
Page 2 of 2
Data_Collected_Date
March 2017
Friday, July 21, 2017
Region S.N.N.P
Selected Indictor:
Kebele Name
Zone GAMO GOFA
Wereda BONKE
Agricultural Situation: Soil Fertility - Perception of the community on soil fertility
and its change over time
Current_Level
Change_In_Last_Decade
Comments
ZEGA
FADELE
Poor
Poor
Increased
Decreased
Poor soil conservation, Due
to high rainfall
Soil erosion
GERIBANISHA
GALO
GERIBANISA
KARICHE
ZAZIE
Poor
Poor
Poor
Decreased
Decreased
Increased
Poor soil conservation
Poor cultivation
Soil erosion
GORATE
Poor
Decreased
Poor cultivation system
GARIBANISA
SOROGE
KOLE KANCHAME
Poor
Poor
Decreased
Decreased
Lack of soil conservation
Poor settlement
KOLE ZALE
Medium
Decreased
Poor cultivation system
YELA
Poor
Decreased
Over cultivation
KOYRA MUKULA
Poor
Decreased
Poor soil conservation
KETELE
Poor
Decreased
Poor cultivation
FISHITO
Poor
Increased
Poor soil consecration
DURIBE
Poor
Decreased
Soil erosion, Deforestation
ALGUDA
Poor
Decreased
Poor cultivation
KACHA KASHISO
Poor
Decreased
Poor cultivation
CHOSHA
Poor
Decreased
Over cultivation
KAMELE BARIE
ORO
KALIBO LAKA
Poor
Poor
Decreased
Decreased
Erosion
Over cultivation
GEZESO
Poor
Increased
Soil erosion
165
Page 1 of 2
Data_Collected_Date
March 2017
Friday, July 21, 2017
Region S.N.N.P
Selected Indictor:
Kebele Name
Zone GAMO GOFA
Wereda BONKE
Agricultural Situation: Soil Fertility - Perception of the community on soil fertility
and its change over time
Current_Level
Change_In_Last_Decade
Comments
DENBILE OSA
Medium
Decreased
Over cultivation
DESHKELE
Poor
Decreased
Yield decreased
KALO GAGULA
poor
Decreased
Yield decreased
GERASE ZALA
Poor
Decreased
Yield reduction
KALO GAGULA
Poor
Decreased
Poor soil conservation
DEMBILE OTORA
Medium
Decreased
Yield loss
KOSHALE
Medium
Decreased
Deforestation
GOBO BAKE
DIMELE FUSE
Poor
Poor
Increased
Increased
Poor soil and water
conservation
Poor cultivation and soil
conservation
166
Page 2 of 2
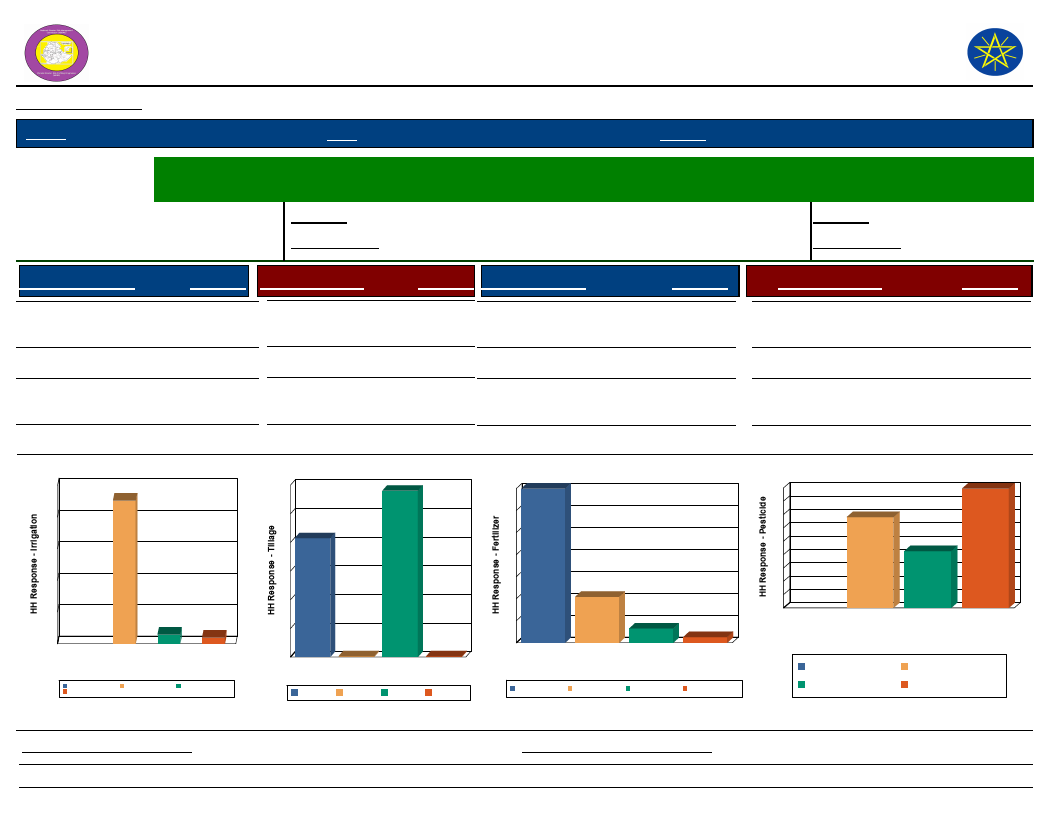
Wereda Disaster
Risk Profile
Data_Collected_Date
March 2017
Region S.N.N.P
Zone GAMO GOFA
National Disaster Risk Management
Commission (NDRMC)
Friday, July 21, 2017
Wereda BONKE
Selected Indictor:
Economic Vulnerability: Status of Agriculture - Methods of tillage, Irrigation and other agricultural input utilization
by households
Percentage of
Irrigated Area
Last Year
Five Years Ago
Percentage of households
with irrigated area
Last Year
Five Years Ago
10.03
0.26
Source of Irrigation
Response Method of Tillage
Response Type of Fertilizer
Response
Type of Pesticide
Response
River/Lake/Pond
Other (specify)
3.88 Oxen
5.68 Tractor
58.03 Chemical
0.26 Natural/Animal manure
20.89
6.53
Chemicals (insecticides,
fungicide, etc)
Natural methods
34.03
21.30
No Irrigation
(Rain-fed)
90.44
Source of Irrigation
100
90
80
60
40
20
6
4
0
Other (specify)
No Irrigation (Rain-fed)
River/Lake/Pond
Source of Irrigation
River/Lake/Pond
No Irrigation (Rain-fed)
Other (specify)
Manual
None
41.45
0.26
Both Chemical and
Natural
None
69.97
2.61
Method of Tillage
60
58
50
41
40
30
20
10
0
Manual
Manual
0
None
Oxen
Method of Tillage
None
Oxen
0
Tractor
Tractor
Type of Fertilizer
70
70
60
50
40
30
21
20
10
7
0
Both
Chemical and
Natural
Chemical Natural/Animal
manure
Type of Fertilizer
Both Chemical and
Natural
Chemical
Natural/Animal manure
3
None
None
None
44.68
Type of Pesticide
45
45
40
35
34
30
25
21
20
15
10
5
0
Chemicals
Natural
None
(insecticides,
methods
fungicide, etc)
Type of Pesticide
Natural methods
Chemicals (insecticides,
fungicide, etc)
None
Proportion_Improved_Seeds
95.01
Proportion_Agriculture_Service
167
95.26
Page 1 of 1
Data_Collected_Date
Region S.N.N.P
March 2017
Zone GAMO GOFA
Wereda BONKE
Friday, July 21, 2017
Selected Indictor:
Economic Vulnerability: Change in Agricultural Situation - Households perception
on changes of crop type, size of cultivated area and crop yields
Proportion of households reporting change in crops grown
Adequate fertilizer
23.83
%
1st
2nd
3rd
31.52
7.84
22.22
Adequate irrigation available
1.09
1.96
Adequate rainfall
2.17
5.88
Insufficient irrigation available
1.09
Less rainfall
25.00
3.92
More drought resistant crop
5.43
38.89
More Market Availability
1.96
11.11
More pest resistant crop
5.43
5.88
5.56
More yielding crop
19.57
47.06
Other
6.52
Proportion of households reporting change in size of area cultivated
12.37 %
Adequate fertilizer
1st
2nd
3rd
25.00
12.00
Adequate irrigation available
2.08
Adequate rainfall
2.08
8.00
22.22
Insufficient fertilizer
4.00
Insufficient irrigation available
2.08
12.00
11.11
Insufficient rainfall
25.00
4.00
11.11
168
Page 1 of 2
Data_Collected_Date
Region S.N.N.P
March 2017
Zone GAMO GOFA
Wereda BONKE
Friday, July 21, 2017
Selected Indictor:
Economic Vulnerability: Change in Agricultural Situation - Households perception
on changes of crop type, size of cultivated area and crop yields
1st
2nd
3rd
Landslides
8.33
8.00
More yielding crop
8.33
Other
4.17
4.00
Salinity problem
4.17
Water logging
4.17
Proportion of households reporting change in crop yield
Adequate fertilizer
Adequate irrigation available
Adequate rainfall
Better yielding crop
Improved variety of seeds
Insufficient fertilizer
Insufficient irrigation available
Insufficient rainfall
Other
82.22
%
1st
2nd
3rd
15.05
8.00
10.00
0.63
2.50
2.82
2.50
0.94
22.40
17.50
7.21
20.80
0.94
4.80
2.50
7.84
16.80
58.31
6.27
8.00
169
Page 2 of 2
Data_Collected_Date
Region S.N.N.P
March 2017
Zone GAMO GOFA
Wereda BONKE
Selected Indicator
Economic Vulnerability: Crops Grown - Number of crops grown by households
Friday, July 21, 2017
Number of Crops Grown
Crops Grown Last Year
Crops Grown Five Years Ago
One type
7.74
7.36
Two types
50.95
46.90
Three types
31.07
26.90
Four types
9.05
14.25
Five types
1.19
4.60
Avg Crops Grown Last Year
Avg Crops Grown Five Years Ago
2.16
2.24
Number of Crops Grown Last Year
60
51
50
40
31
30
20
10
9
8
1
0
Five types
Four types One type Three types
Number of Crops Grown
Two types
Five types
Two types
Four types
One type
Three types
Number of Crops Grown five years ago
50
47
40
30
27
20
14
10
7
5
0
Five types
Four types One type Three types Two types
Number of Crops Grown
Five types
Two types
Four types
One type
Three types
170
Page 1 of 1
WDRP Indicators
Livestock Production Characteristics
171
Data_Collected_Date
March 2017
Friday, July 21, 2017
Region S.N.N.P
Zone GAMO GOFA
Wereda BONKE
Selected Indictor:
Kebele Name
ZEGA
Agricultural Situation: Status of Livestock Disease - Change in Livestock Disease
Status
Current_Level
Change_Over_Last_Decade
Comment
Anthrax
Decreased
Animal health experts
FADELE
Poor (Anthrax, Back leg)
Decreased
Climate change
GERIBANISHA
GALO
GERIBANISA
KARICHE
ZAZIE
Black leg Anthrax
Good
Medium
Decreased
Decreased
Increased
Vaccination and Animal
health experts existence
Access of experts
Access of health experts
GORATE
Poor
Increased
Climate change
GARIBANISA
SOROGE
KOLE KANCHAME
KOLE ZALE
YELA
Medium
Poor (Anthrax)
High
Medium
Decreased
Increased
Increased
Decreased
Increment of health
experts
Shortage of livestock
pasture and water
Shortage of drugs and
vaccination support
Access of professionals
KOYRA MUKULA
Good
Increased
Vaccination
KETELE
FISHITO
Poor
Anthrax, Black leg
Increased
Increased
Shortage of livestock
forage
Climate change
DURIBE
Medium
Decreased
Access of health experts
ALGUDA
KACHA KASHISO
Poor
Medium
Increased
Decreased
Lack of experienced
experts
There are experts
CHOSHA
Good
Decreased
Access of experts
KAMELE BARIE ORO Poor
KALIBO LAKA
Poor
Increased
Increased
Climate change, Lack of
vaccination
Lack of vaccination
GEZESO
Poor
Increased
Access of health experts
172
Page 1 of 2
Data_Collected_Date
March 2017
Friday, July 21, 2017
Region S.N.N.P
Zone GAMO GOFA
Wereda BONKE
Selected Indictor:
Kebele Name
DENBILE OSA
Agricultural Situation: Status of Livestock Disease - Change in Livestock Disease
Status
Current_Level
Change_Over_Last_Decade
Comment
Medium
Decreased
There are experts
DESHKELE
KALO GAGULA
GERASE ZALA
KALO GAGULA
Poor (Black leg,
Anthrax)
Internal and external
parasite
Poor (Black leg)
Medium
Increased
Increased
Increased
Decreased
Lack of vaccination,
Shortage of animal feed
Lack of vaccination,
Shortage of pasture
Lack of vaccination,
Shortage of expert
Vaccination access
DEMBILE OTORA
KOSHALE
GOBO BAKE
DIMELE FUSE
Poor(Anthrax and black
leg)
Black leg, Anthrax
Poor
Poor
Increased
Increased
Decreased
Increased
Lack of vaccination, and
animal forage
Shortage of water and
animal forage
Access of veterinary
experts
Shortage of water and
forage
173
Page 2 of 2
Data_Collected_Date
March 2017
Friday, July 21, 2017
Region S.N.N.P
Zone GAMO GOFA
Wereda BONKE
Selected Indictor: Livestock Diseases Prevalece
Type of livestock diseases affected households in the last five years (households reporting in %)
1st
2nd
3rd
African horse disease
1.03
1.06
Anthrax affecting cattle
20.36
27.32
13.64
Black leg
44.59
36.07
14.69
CBPP
3.87
3.98
20.63
Contagious Caprine PLeuropneumonia (CCPP)
0.53
2.45
DK
0.26
0.80
0.70
Faciolosis
2.06
3.18
8.04
Foot and mouth disease
1.29
0.80
1.05
Heart water
0.80
2.10
Internal & External Parasites (Tick, mange, helminthiasis, fasci
1.03
2.92
9.09
Liverfluke (Sheep and cattle)
1.55
1.59
6.99
Lumpy Skin Disease (LSD)
0.27
0.70
Lymphangitis
1.33
1.40
Newcasle disease (Chicken)
0.52
1.86
2.45
No Disease
0.77
0.27
Pasteurellosis
0.26
0.80
PPR
0.26
0.53
1.05
Sheep pox
0.35
Tick born diseases
0.26
1.59
3.50
Trypanosomiasis
21.91
14.32
11.19
174
Page 1 of 1
Data_Collected_Date
March 2017
Friday, July 21, 2017
Region S.N.N.P
Selected Indictor:
Level of Access
Excellent
Good
Adequate
Poor
Very poor
Zone GAMO GOFA
Wereda BONKE
Evaluation of Access to Veternary Services and Livestock Drugs
Households’ evaluation on access to drugs and veterinary services
Veternary Service
Livestock_Drugs
7.22
6.96
12.37
11.08
13.92
13.40
56.70
56.70
9.79
11.86
Level of Access to Veternary Services
Access Level of Livestock Drugs
14
13
10
7
12
7
12
57
Adequate Excellent
Good
Poor
Very poor
11
57
Adequate Excellent
Good
Poor
Very poor
175
Page 1 of 1
Data_Collected_Date
March 2017
Friday, July 21, 2017
Region S.N.N.P
Selected Indictor:
Zone GAMO GOFA
Wereda BONKE
Agricultural Situation: Water Availability for Livestock - Water availability for
livestock in the community
KebeleName
Current_Level
Change_In_Last_Decade
Comments
ZEGA
FADELE
GERIBANISHA
GALO
GERIBANISA
KARICHE
ZAZIE
GORATE
GARIBANISA
SOROGE
KOLE KANCHAME
KOLE ZALE
YELA
KOYRA MUKULA
KETELE
FISHITO
DURIBE
ALGUDA
KACHA KASHISO
CHOSHA
KAMELE BARIE
ORO
KALIBO LAKA
GEZESO
DENBILE OSA
DESHKELE
KALO GAGULA
Poor
Poor
Partially poor
Poor
Medium
Poor
Good
Poor
Medium
Poor
Poor
Poor
Poor
Poor
Poor
Poor
Poor
Poor
Poor
Medium
Medium
Medium
Poor
Increased
Decreased
Decreased
Decreased
Increased
Decreased
Decreased
Decreased
Decreased
Decreased
Decreased
Decreased
Increased
Decreased
Decreased
Decreased
Decreased
Decreased
Decreased
Increased
Decreased
Decreased
Decreased
Due to climate change
Shortage of rain
Climate change
Climate change
Climate change
Climate change
Shortage of rain
Climate change
Climate change
Climate change
Climate change
Lack of water access
Climate change
Climate change
Climate change
Climate change
Climate change
Deforestation
Climate change
Climate change
Climate change
Shortage of water access
Shortage of water
176
Page 1 of 2
Data_Collected_Date
March 2017
Friday, July 21, 2017
Region S.N.N.P
Selected Indictor:
Zone GAMO GOFA
Wereda BONKE
Agricultural Situation: Water Availability for Livestock - Water availability for
livestock in the community
KebeleName
Current_Level
Change_In_Last_Decade
Comments
GERASE ZALA
KALO GAGULA
DEMBILE OTORA
KOSHALE
GOBO BAKE
DIMELE FUSE
Poor
Poor
Poor
Very poor
Poor
Poor
Decreased
Decreased
Decreased
Decreased
Increased
Decreased
Shortage of water
Climate change
Shortage of water
Climate change, Shortage
of rain
Climate change, Shortage
of water
Climate change
177
Page 2 of 2

Data_Collected_Date
March 2017
Friday, July 21, 2017
Region S.N.N.P
Zone GAMO GOFA
Wereda BONKE
Selected Indictor:
Agricultural Situation: Livestock Diversity - Type of livestock and their economic
importance in the community
Kebele Name
ALGUDA
Type of Livestock
Sheep
Avg_Number
1
Economic_Importance_Rank
For selling and for food
Horses
1
For transportation and carry
Mules
0
For transportation and carry
CHOSHA
Sheep
11 For sell and for food
Mules
1
For transportation
Horses
3
For carrying purpose
DEMBILE OTORA
Goats
11 For selling and for food
Sheep
1
For selling
Donkeys
1
For carry purpose
DENBILE OSA
Camels: Female
0
Goats
2
For selling and for food
Sheep
0
For selling and for food
DESHKELE
Camels: Female
0
Camels: Female
0
Sheep
3
For selling
DIMELE FUSE
Donkeys
0
For carry
Goats
3
For income source
DURIBE
Mules
Goats
0
For transportation and for carrying
purpose
1
For selling
Sheep
0
For selling
Camels: Female
0
FADELE
Sheep
0
For selling and for food
Mules
0
For transportation and carrying of goods
178
Page 1 of 4

Data_Collected_Date
March 2017
Friday, July 21, 2017
Region S.N.N.P
Zone GAMO GOFA
Wereda BONKE
Selected Indictor:
Agricultural Situation: Livestock Diversity - Type of livestock and their economic
importance in the community
Kebele Name
FADELE
Type of Livestock
Goats
Avg_Number
5
Economic_Importance_Rank
For selling and for food
FISHITO
Camels: Female
0
Camels: Female
0
Camels: Female
0
GARIBANISA SOROGE
Camels: Female
0
Horses
1
For transportation and carry
Sheep
3
For selling
GERASE ZALA
Sheep
1
For selling
Horses
0
For carrying
Goats
1
For selling
GERIBANISA
KARICHE
Horses
Goats
0
For transportation and carry
0
For source of income
Sheep
4
For source of income
GERIBANISHA GALO
Horses
0
For transportation
Sheep
2
For sell
Camels: Female
0
GEZESO
Sheep
1
For selling and for income source
Horses
1
For transpiration
Camels: Female
0
GOBO BAKE
Mules
0
For carrying of crop and other goods
Goats
0
For selling
Sheep
1
For selling, For food
GORATE
Goats
0
For source of income
179
Page 2 of 4
Data_Collected_Date
March 2017
Friday, July 21, 2017
Region S.N.N.P
Zone GAMO GOFA
Wereda BONKE
Selected Indictor:
Agricultural Situation: Livestock Diversity - Type of livestock and their economic
importance in the community
Kebele Name
GORATE
Type of Livestock
Sheep
Avg_Number
2
Economic_Importance_Rank
For source of income
Horses
0
For carry and transportation use
KACHA KASHISO
Mules
0
For transport and carry
Horses
2
For transport and carry
Sheep
5
For selling and income generation
KALIBO LAKA
Mules
0
For carry
Sheep
9
For selling
Horses
0
For transport and for carry
KALO GAGULA
Horses
1
For carrying purpose
Sheep
2
For selling
Mules
0
For carrying purpose
Goats
1
For selling
Sheep
9
For selling
Horses
0
For carry and transportation
KAMELE BARIE ORO
Mules
0
For carry and transportation
Sheep
4
For income generation
Horses
0
For carry and transportation
KETELE
Goats
7
For selling
Mules
0
For transportation and for carry
Donkeys
0
For carry
KOLE KANCHAME
Mules
0
For transportation and for carry use
Horses
1
For transportation and for carry use
Sheep
6
For selling
KOLE ZALE
Sheep
14 For source of income
180
Page 3 of 4
Data_Collected_Date
March 2017
Friday, July 21, 2017
Region S.N.N.P
Zone GAMO GOFA
Wereda BONKE
Selected Indictor:
Agricultural Situation: Livestock Diversity - Type of livestock and their economic
importance in the community
Kebele Name
KOLE ZALE
Type of Livestock
Goats
Avg_Number
0
Economic_Importance_Rank
For source of income
Horses
1
For transportation and for carry use
KOSHALE
Donkeys
6
For carry purpose
Goats
14 For selling and for food
Sheep
17 For selling and for food
KOYRA MUKULA
Goats
5
For selling
Donkeys
1
For carry purpose
Mules
0
For transportation and carry purpose
YELA
Mules
0
For carrying purpose
Horses
0
For transportation purpose
Sheep
3
For food and for selling
ZAZIE
Sheep
2
For source of income
Horses
0
For transportation
Camels: Female
0
ZEGA
Horses
0
For carrying goods
Goats
2
For sell
Sheep
1
For sell
181
Page 4 of 4
Wereda Disaster
Risk Profile
Data_Collected_Date
March 2017
National Disaster Risk Management
Commission (NDRMC)
Friday, July 21, 2017
Region S.N.N.P
Zone GAMO GOFA
Wereda BONKE
Selected Indictor:
Economic Vulnerability: Livestock Ownership and Changes - Percentage of households by number and type of
livestock owned
Bee keeping
A - None
80.41
B - 1 to 5
5.15
C - 6 to 10
4.90
D - 11 to 50
2.58
E - 51 to 100
1.29
F - More
than 100
1.03
Camels: Female
99.48
0.26
0.26
Camels: Male
99.48
0.52
Camels: Young Female
99.48
0.52
Camels: Young Male
99.48
0.52
Cattle: Female
51.80
22.16
14.43
4.38
1.80
1.03
Cattle: Male bulls
50.52
22.94
13.92
4.90
3.61
1.29
Cattle: Mature Female
12.37
32.99
22.68
11.34
7.22
2.32
Cattle: Mature Male
43.30
18.04
31.70
1.29
3.87
0.26
Cattle: under 1 year
40.72
29.90
15.98
5.93
2.84
1.80
Donkeys
84.79
7.99
3.35
1.80
0.52
0.26
Goats
66.75
4.64
7.47
4.90
2.84
2.84
Horses
86.34
10.05
2.84
0.52
0.26
182
Page 1 of 2
Wereda Disaster
Risk Profile
Data_Collected_Date
March 2017
National Disaster Risk Management
Commission (NDRMC)
Friday, July 21, 2017
Region S.N.N.P
Zone GAMO GOFA
Wereda BONKE
Selected Indictor:
Economic Vulnerability: Livestock Ownership and Changes - Percentage of households by number and type of
livestock owned
A - None
B - 1 to 5
C - 6 to 10
D - 11 to 50
E - 51 to 100
Mules
90.46
7.47
1.80
F - More
than 100
Poultry
52.84
3.61
11.08
8.51
8.25
5.93
Sheep
67.01
5.41
9.79
5.93
1.29
1.03
183
Page 2 of 2

Data_Collected_Date
Region S.N.N.P
March 2017
Zone GAMO GOFA
Wereda BONKE
Friday, July 21, 2017
Selected Indicator
Economic Vulnerability: Livestock Ownership and Changes - Households
perception on changes in livestock number in the last five years (response in %)
Type of Livestock Owned
Changes Observed By Households
Bee keeping
A - Decreased
16.21
B - Remained the Same
82.97
C - Increased
0.82
Camels: Female
0.55
99.45
Camels: Male
100.00
Camels: Young Female
100.00
Camels: Young Male
0.55
99.45
Cattle: Female
41.80
56.08
2.12
Cattle: Male bulls
40.70
57.95
1.35
Cattle: Mature Female
73.11
24.54
2.35
Cattle: Mature Male
46.68
52.52
0.80
Cattle: under 1 year
46.11
50.13
3.75
Donkeys
9.94
88.67
1.38
Goats
32.88
65.21
1.92
Horses
4.99
93.35
1.66
Mules
5.49
93.96
0.55
Poultry
33.06
62.90
4.03
Sheep
25.82
72.28
1.90
184
Page 1 of 3
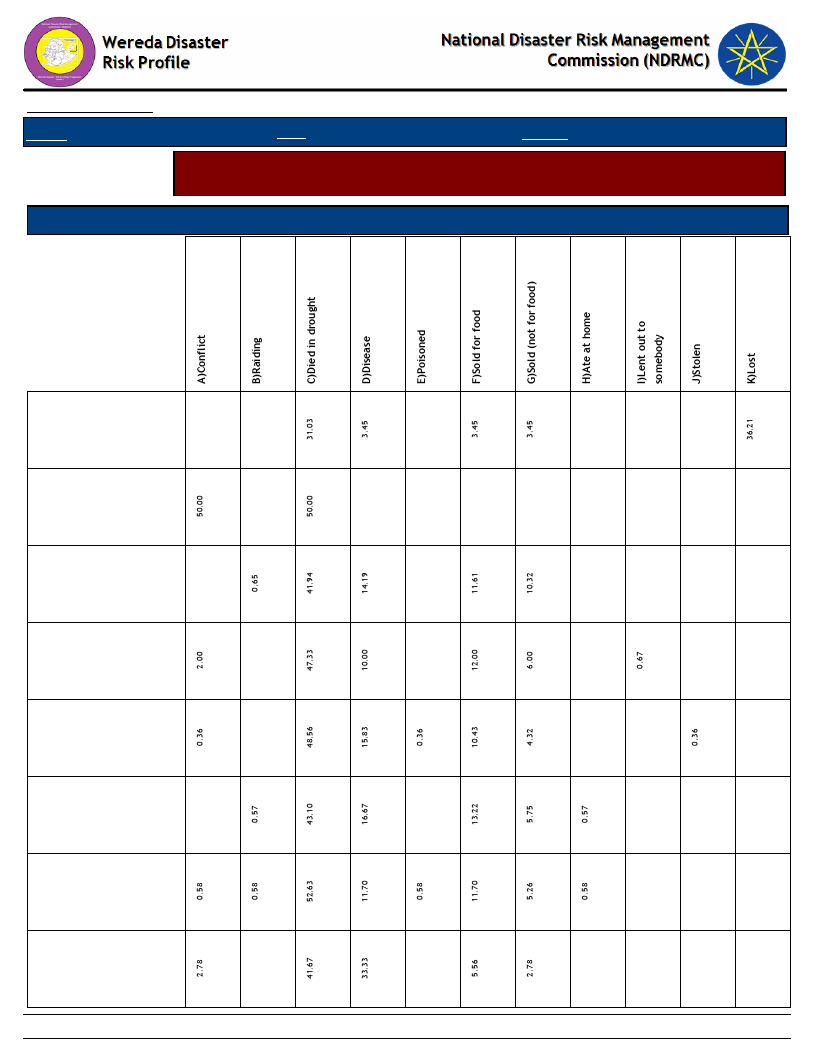
Data_Collected_Date
Region S.N.N.P
March 2017
Zone GAMO GOFA
Wereda BONKE
Friday, July 21, 2017
Selected Indicator
Economic Vulnerability: Livestock Ownership and Changes - Households
perception on changes in livestock number in the last five years (response in %)
Type of Livestock Owned
Reason for Decrease in Livestock Number
Bee keeping
Camels: Young
Male
Cattle: Female
Cattle: Male bulls
Cattle: Mature
Female
Cattle: Mature
Male
Cattle: under 1
year
Donkeys
185
Page 2 of 3
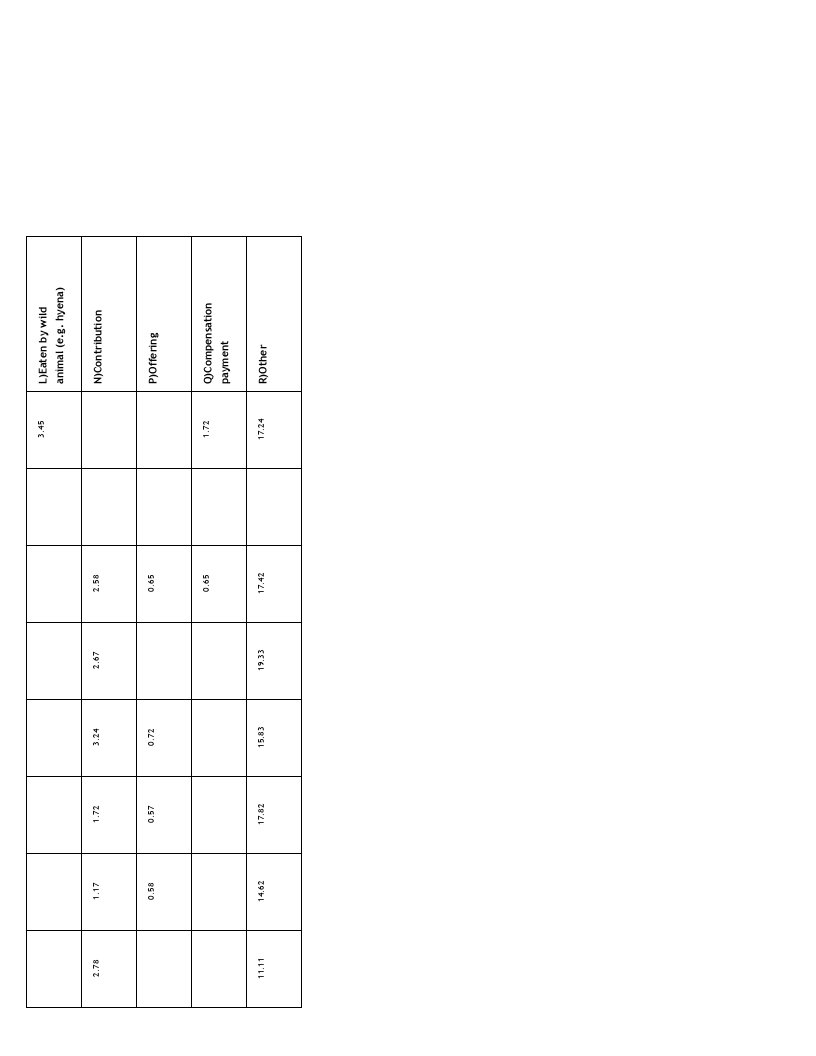
186
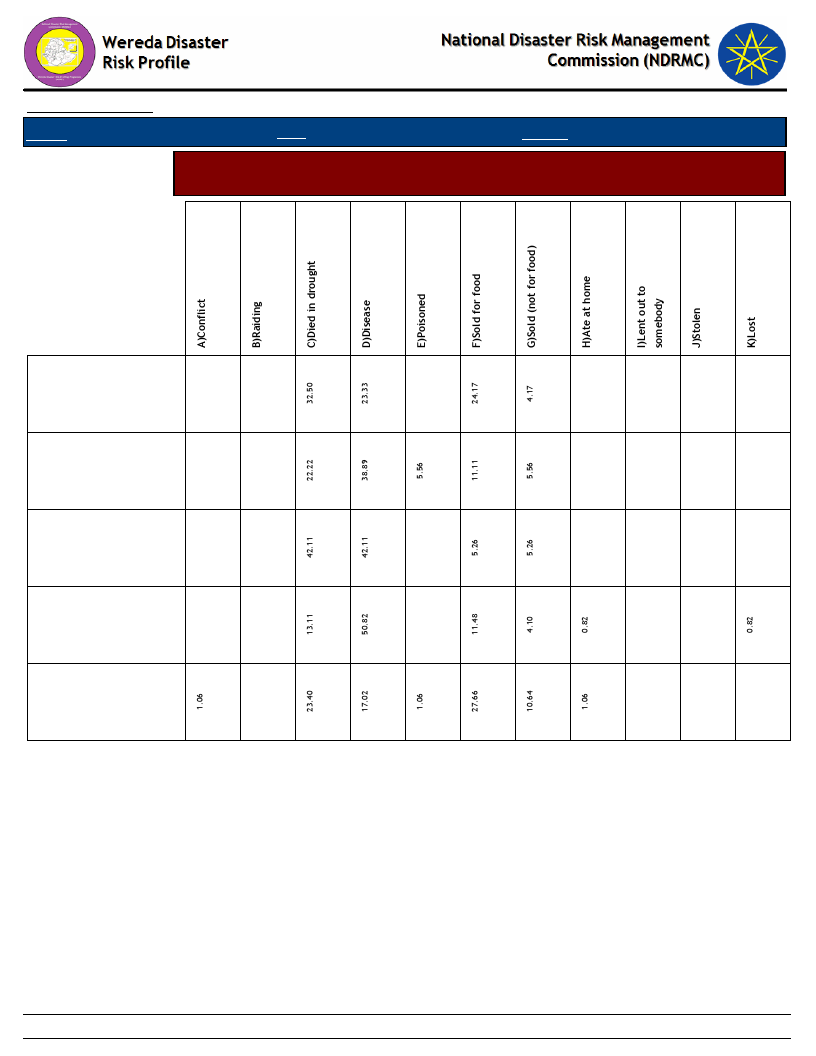
Data_Collected_Date
Region S.N.N.P
March 2017
Zone GAMO GOFA
Wereda BONKE
Friday, July 21, 2017
Selected Indicator
Economic Vulnerability: Livestock Ownership and Changes - Households
perception on changes in livestock number in the last five years (response in %)
Goats
Horses
Mules
Poultry
Sheep
187
Page 3 of 3
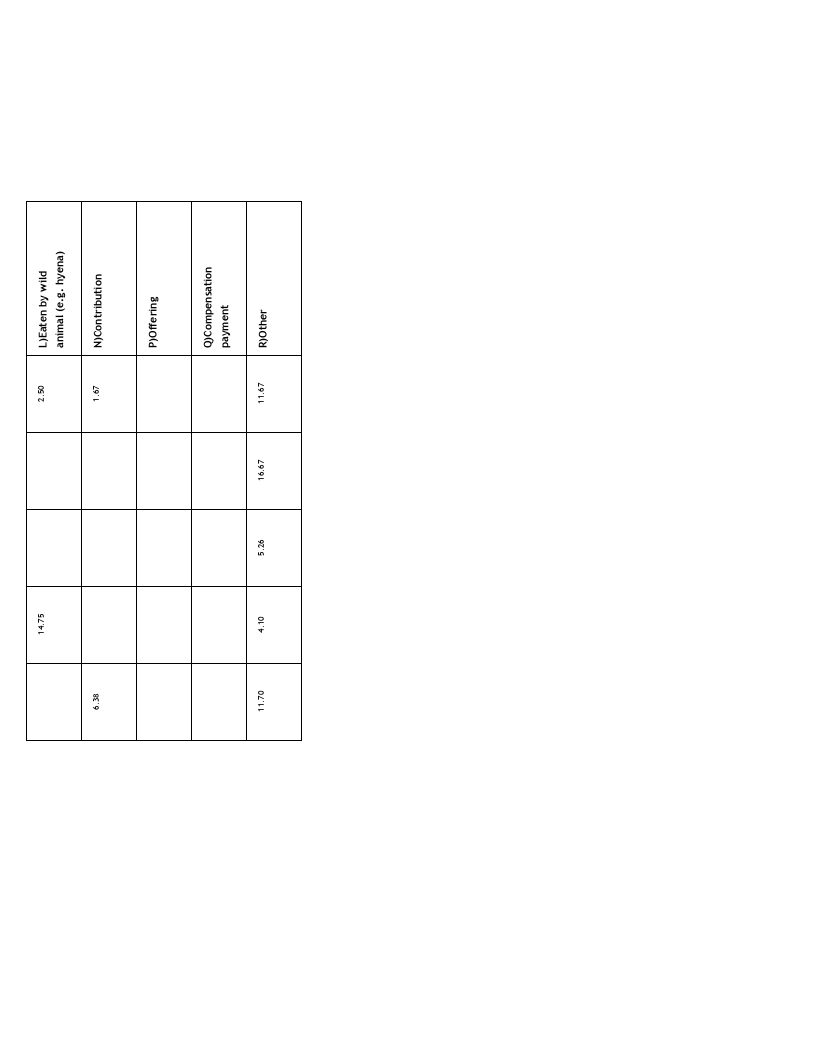
188
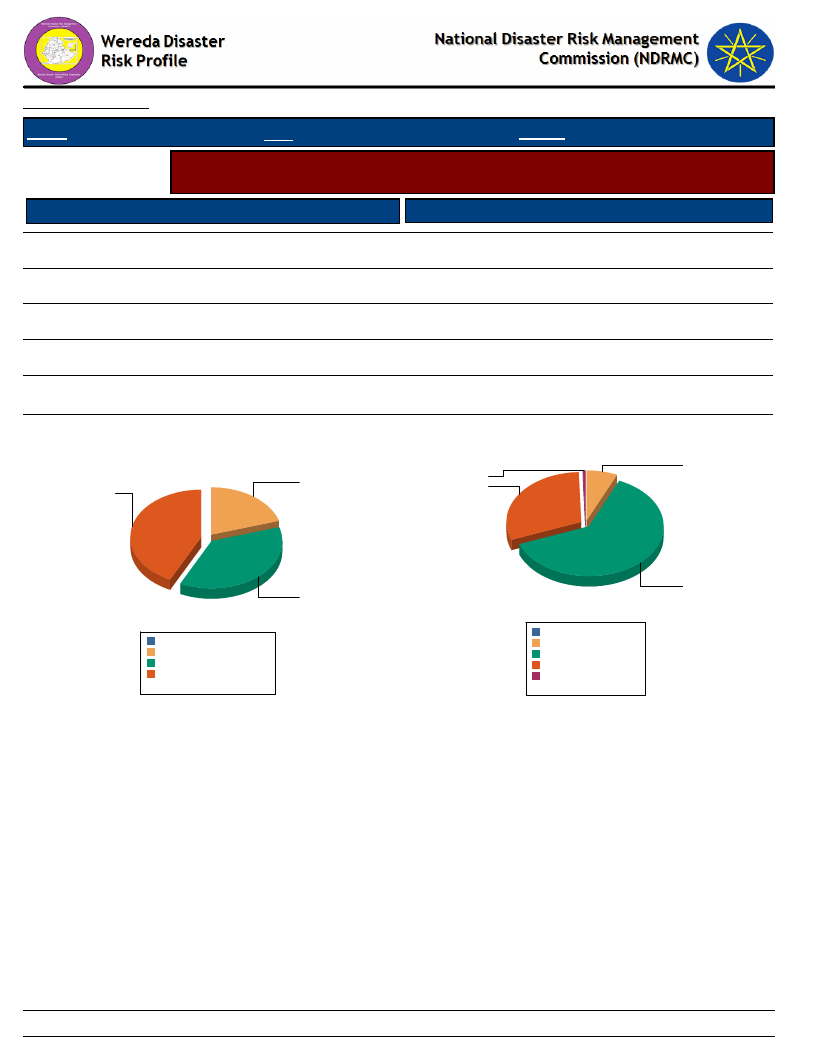
Data_Collected_Date
March 2017
Friday, July 21, 2017
Region S.N.N.P
Zone GAMO GOFA
Wereda BONKE
Selected Indicator
Agriculture (Livestock): Pasture Availability - Households perception on access
and quality of pasture
Access to Pasture
Response Percent
Quality of Pasture
Response Percent
Seldom available
42.89
C - Adequate
6.63
Never available
20.16
D - Poor
61.01
E - Very poor
29.44
F - DK
0.53
Occasionally
36.95
Household responses to Access to Pasture for
Livestock
20.2
42.9
Household responses to Quality of Pasture
6.6
0.5
29.4
37.0
Never available
Occasionally
0.0%
20.2%
37.0%
Seldom available 42.9%
Total:
100.0%
0.0%
C - Adequate 6.8%
D - Poor
62.5%
E - Very poor 30.2%
F - DK
0.5%
Total:
100.0%
61.0
189
Page 1 of 1
Data_Collected_Date
Region S.N.N.P
March 2017
Zone GAMO GOFA
Wereda BONKE
Friday, July 21, 2017
Selected Indicator
Agriculture (Livestock): Pasture Availability - Households perception on
problematic months for pasture availability
Problematic Months
Order of Severity
A - Sep (Meskerem)
B - Oct (Tikimt)
C - Nov (Hidar)
D - Dec (Tahsas)
E - Jan (Tir)
F - Feb (Yekatit)
G - Mar (Megabit)
H - Apr (Meazea)
I - May (Ginbot)
K - Jul (Hamle)
L - Aug (Nehase)
1st
0.52
8.25
71.13
8.76
10.82
0.26
0.26
2nd
0.26
0.26
5.41
15.21
74.48
3.61
0.26
0.26
0.26
3rd
0.26
0.52
4.96
9.40
14.88
65.80
2.61
1.31
0.26
190
Page 1 of 1
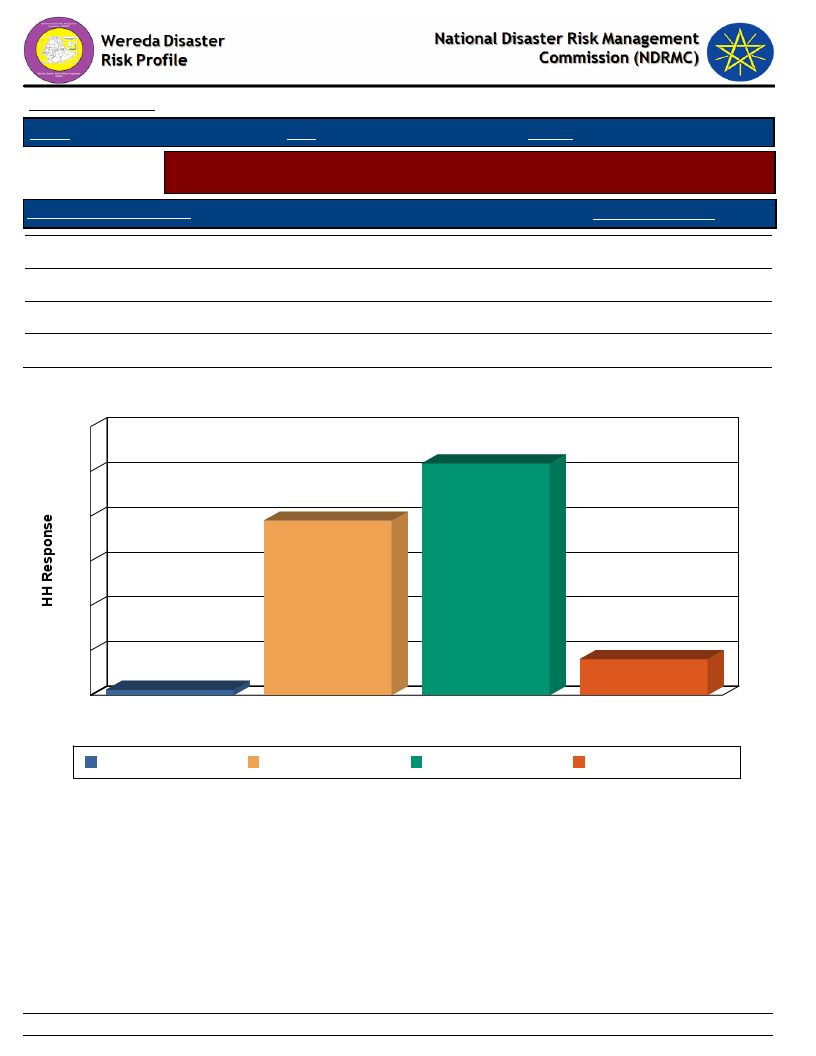
Data_Collected_Date
Region S.N.N.P
March 2017
Zone GAMO GOFA
Wereda BONKE
Friday, July 21, 2017
Selected Indicator
Agriculture (Livestock): Water Availability - Households response on water
availability for livestock
Access to Water - Livestock
Household Response
A - Regularly available
B - Occasionally
C - Seldom available
D - Never available
1.19
38.99
51.79
8.04
Household Access to Water for Livestock
60
52
50
40
39
30
20
10
1
0
A - Regularly available
A - Regularly available
B - Occasionally
C - Seldom available
Access to Water - Livestock
B - Occasionally
C - Seldom available
8
D - Never available
D - Never available
191
Page 1 of 1

Data_Collected_Date
Region S.N.N.P
March 2017
Zone GAMO GOFA
Wereda BONKE
Friday, July 21, 2017
Selected Indicator
Agriculture (Livestock): Water Availability - Households perception on
problematic months for water availability for Livestock
Problematic Months
Order of Severity
A - Sep (Meskerem)
B - Oct (Tikimt)
C - Nov (Hidar)
D - Dec (Tahsas)
E - Jan (Tir)
F - Feb (Yekatit)
G - Mar (Megabit)
H - Apr (Meazea)
I - May (Ginbot)
1st
0.26
7.47
68.56
10.31
11.86
0.26
1.29
2nd
5.45
16.36
72.47
4.94
0.78
3rd
0.26
0.53
0.26
4.75
11.61
14.25
65.17
3.17
192
Page 1 of 1
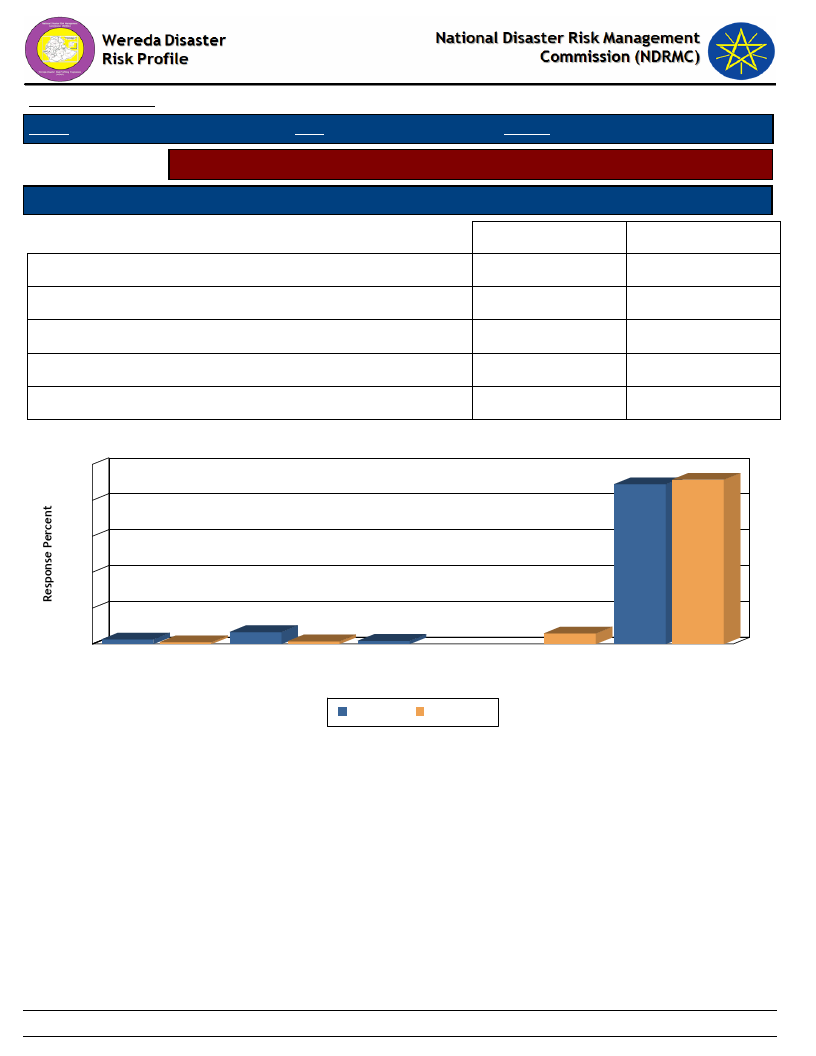
Data_Collected_Date
Region S.N.N.P
March 2017
Zone GAMO GOFA
Wereda BONKE
Friday, July 21, 2017
Selected Indicator
Sources of water for livestock (households response in %)
Type of Livestock Owned
Changes Observed By Households
Communal tap (Bono)
Open/Deep well
Piped water outside the house
Rainwater harvesting
River, stream
Dry Season
2.58
6.70
1.80
88.92
Wet Season
1.03
1.55
5.93
91.49
Household Responses to Type of Water Source and Season for Livestock
100
89
91
80
60
40
20
3
1
0
Communal tap (Bono)
7
6
2
2
Open/Deep well
Piped water outside the
house
Rainwater harvesting
Type of Water Source & Season
Dry Season
Wet Season
River, stream
193
Page 1 of 1
WDRP Indicators
Access to Market and Credit
194

Wereda Disaster
Risk Profile
Data_Collected_Date March 2017
National Disaster Risk Management
Commission (NDRMC)
Friday, July 21, 2017
Region S.N.N.P
Zone GAMO GOFA
Wereda BONKE
Selected Indictor:
Economic Vulnerability: Proportion of Produce Sold and Market - Proportion of crops and livestock sold from total
production and markets
KebeleName
Market_For_Crops
Market_For_Livestock_Produce
Percent
Livestock_Sold
Total_% Comments
Sold
ZEGA
65
30
There is no enough product to
sell.
FADELE
Geresse, Dimale
Geresse, Dimale
60
0
The production is not enough,
neither for sell nor for keeping,
the productivity decreased time
to time.
GERIBANISHA GALO
Galo market, Gina
Galo market, Gina market
50
market
0
0% sell shows very low yield of
crops, High amount of livestock
sell.
GERIBANISA
Kole Zale, Kole
Kole Zale, Kole kanchame
25
KARICHE
kanchame
0
Crop and livestock production is
not enough for food.
ZAZIE
Gerrise
Gerrise
75
0
Due to less fertile soil and
shortage of rain, the product is
not enough for sell.
GORATE
Geresse
Geresse
25
0
There is food shortage, and the
product is not sufficient for sell
and for storing for long years.
GARIBANISA
Kole zale, Kole
Kole zale, Kole kanchame
25
SOROGE
kanchame
0
There is no enough product to
keep, due to less yield.
KOLE KANCHAME
Kole kanchame
Kole kanchame
30
0
The crop and livestock product is
not enough for sell and for food
consumption.
195
Page 1 of 4
Wereda Disaster
Risk Profile
Data_Collected_Date March 2017
National Disaster Risk Management
Commission (NDRMC)
Friday, July 21, 2017
Region S.N.N.P
Zone GAMO GOFA
Wereda BONKE
Selected Indictor:
KebeleName
KOLE ZALE
YELA
KOYRA MUKULA
KETELE
FISHITO
Economic Vulnerability: Proportion of Produce Sold and Market - Proportion of crops and livestock sold from total
production and markets
Market_For_Crops
Market_For_Livestock_Produce
Percent
Livestock_Sold
Total_% Comments
Sold
Beza, Kanchane
Beza, Kanchane
25
0
The product is not enough for sell
and to keep for long.
Chenecha,
Arbaminch
Cosha
30
65
The production is not enough to
sell.
Demale, Fussie,
Demale, Fussie, Denbile, Dtora
30
Denbile, Dtora
15
Low productivity of crops due to
climate change.
Dimale, Fussie,
Dimale, Fussie, Geresse
40
Geresse
10
There is no enough product for
sell and for keeping.
DURIBE
Geresse, Denbile
Geresse, Denbile Osa
40
Osa
ALGUDA
Geresse
Geresse
40
KACHA KASHISO
Kashaso
Kashaso
0
There is no enough product for
sell and for keeping, due to
shortage of water. There is food
gap.
0
There is no enough product for
sell and for keeping due to low
productivity.
CHOSHA
Chosha
Chosha
25
30
The product is not enough to sell.
KAMELE BARIE ORO
Geresse
Geresse
20
196
0
The product is not enough, due to
shortage of rain and loss of soil
fertility.
Page 2 of 4

Wereda Disaster
Risk Profile
Data_Collected_Date March 2017
National Disaster Risk Management
Commission (NDRMC)
Friday, July 21, 2017
Region S.N.N.P
Zone GAMO GOFA
Wereda BONKE
Selected Indictor:
KebeleName
KALIBO LAKA
GEZESO
Economic Vulnerability: Proportion of Produce Sold and Market - Proportion of crops and livestock sold from total
production and markets
Market_For_Crops
Market_For_Livestock_Produce
Percent
Livestock_Sold
Total_% Comments
Sold
Chosha, Kole
Chosha, Kole kanchame
50
kanchame
0
The product is not enough for sell.
Chosha
Chosha
50
5
DENBILE OSA
20
DESHKELE
Bula, Geressie
Bula, Geressie
40
KALO GAGULA
Chosha, Belta
Chosha, Belta
40
GERASE ZALA
Geressie
Geressie
50
KALO GAGULA
Gobo, Kole zale
Gobo, Kole zale
40
DEMBILE OTORA
Denble, Geressie
Denble, Geressie
75
KOSHALE
Koshale, Dimale
Koshale, Dimale fussie
60
fussie
25
Due to shortage of water, yield
decreased, so that the product is
not enough to sell.
0
There is no enough product for
sell.
0
There is no enough product for
sell and to keep.
0
The product is not enough to sell
and to keep.
0
The is shortage of production for
food.
30
There is no enough product to sell
due to drought.
0
Crop and livestock production is
insufficient due to shortage of
rain fall, livestock pasture and
irrigation.
197
Page 3 of 4
Wereda Disaster
Risk Profile
Data_Collected_Date March 2017
National Disaster Risk Management
Commission (NDRMC)
Friday, July 21, 2017
Region S.N.N.P
Zone GAMO GOFA
Wereda BONKE
Selected Indictor:
KebeleName
GOBO BAKE
DIMELE FUSE
Economic Vulnerability: Proportion of Produce Sold and Market - Proportion of crops and livestock sold from total
production and markets
Market_For_Crops
Shelle (Saturday
and Thursday)
Market_For_Livestock_Produce
Shelle (Saturday and Thursday)
Percent
Livestock_Sold
20
Total_%
Sold
0
Comments
There is no enough product to sell
and to keep due to shortage of
rain fall.
Dimale Fussie,
Dimale Fussie, Geresse
50
Geresse
30
There is no enough product to sell
and to keep due to low
productivity after 2007 E.C.
198
Page 4 of 4
Data_Collected_Date
Region S.N.N.P
Selected Indicator
Kebele Name
ZEGA
FADELE
GERIBANISHA GALO
GERIBANISA KARICHE
ZAZIE
GORATE
GARIBANISA SOROGE
KOLE KANCHAME
KOLE ZALE
YELA
KOYRA MUKULA
KETELE
FISHITO
DURIBE
ALGUDA
KACHA KASHISO
CHOSHA
KAMELE BARIE ORO
KALIBO LAKA
GEZESO
DENBILE OSA
DESHKELE
KALO GAGULA
GERASE ZALA
KALO GAGULA
DEMBILE OTORA
March 2017
Zone GAMO GOFA
Wereda BONKE
Friday, July 21, 2017
Economic Vulnerability: Kebele Access to Markets - Access to market by Kebele
Market_Access_Comments
Good market linkage
There is no big market linkage problem.
Partially accessible, because there is road linkage problem in summer season.
There is road access problem to link the community with the market.
There is a market linkage problem in case of road inaccessibility.
There is market linkage problem, due to road inaccessibility.
There is market linkage problem due to inaccessibility of road.
Good market linkage, but there is shortage of road access.
There is market linkage problem, due to road inaccessibility.
There is poor market linkage, due to inaccessibility of roads.
Poor market linkage
There is low market linkage, due to long distance.
There is market linkage problem, due to distance.
There is road access problem.
There is road access problem and market linkage limitation.
There is road problem.
There is market linkage problem, due to road inaccessibility.
There is market linkage problem due to road inaccessibility.
There is no market linkage problem.
There is road access problem
Poor market linkage due to road inaccessibility.
199
Page 1 of 2

Data_Collected_Date
Region S.N.N.P
Selected Indicator
Kebele Name
KOSHALE
GOBO BAKE
DIMELE FUSE
March 2017
Zone GAMO GOFA
Wereda BONKE
Friday, July 21, 2017
Economic Vulnerability: Kebele Access to Markets - Access to market by Kebele
Market_Access_Comments
There is market linkage problem, due to road inaccessibility.
Market linkage problem, No road access
No market linkage problem
200
Page 2 of 2
Data_Collected_Date
Region S.N.N.P
March 2017
Zone GAMO GOFA
Wereda BONKE
Friday, July 21, 2017
Selected Indicator
Economic Vulnerability: Formal & Informal Transfers - Percentage of
households reporting received formal transfers
Type of Formal Transfer
Food aid
HH Response Type of Informal Transfer
Formal
14.73 Remittances (from relative living elsewhere)
HH Response
0.26
Food-for-Work project
0.52 Zakaat
1.04
Cash-for-Work project
4.68 Other cash gift
2.08
Faffa
4.97 Cash loan (no interest)
13.92
Free cash
2.88 Food or grain gift
2.08
Seeds
7.35 Grain loan (no interest)
6.49
Credit support
1.84 Seed gift
0.52
Livestock
Seed loan
8.31
Tools
0.26 Free labour
10.91
Cash or kind gift to married daughters when they
3.38
visit parents or relatives
Gift of livestock to newly-weds
0.52
Donation or loan of milking animals to a relative or
0.26
friend
Dowry given to bride’s parents
1.56
Donations of cash or animals to disaster stricken
3.12
people
Blood money – compensation
1.32
Free use of oxen or plough
8.05
Free use of pack animals (camels or donkeys)
8.31
Restocking of poorer relatives
1.30
Distribution of meat to neighbours after a slaughter
4.42
takes place
Sacrifice made to feed the poor
3.12
201
Page 1 of 2
Data_Collected_Date
Region S.N.N.P
March 2017
Zone GAMO GOFA
Wereda BONKE
Selected Indicator
Economic Vulnerability: Formal & Informal Transfers - Percentage of
households reporting received formal transfers
Type of Formal Transfer
HH Response Type of Informal Transfer
Formal
Type of Formal Transfer Received By Households
Friday, July 21, 2017
HH Response
0.3
7.3
2.9
0.5
14.7
4.7
1.8
5.0
0.0%
Cash-for-Work project 12.6%
Credit support
4.9%
Faffa
13.3%
Food aid
39.6%
Food-for-Work project 1.4%
Free cash
7.7%
Livestock
0.0%
Seeds
19.7%
Tools
0.7%
Total:
100.0%
202
Page 2 of 2
Data_Collected_Date
Region S.N.N.P
March 2017
Zone
GAMO GOFA
Wereda BONKE
Friday, July 21, 2017
Selected Indicator
Capacity: Access to Credit Facilities - Households access to credit facilities
Type of Access To Credit Facilities
Indicator_Value
Households with membership in any credit /micro finance society (%)
Households who borrowed any money in the last one year (%)
Households who tried to borrow 1-2
Households who tried to borrow 3-4
Households who tried to borrow 5 & Above
Households who managed to get credit 1-2
Households who managed to get credit 3-4
Average No. of HHs Tried to get Credit
Average No. HHs Managed to get Credit
30.13
9.82
76.74
20.93
2.33
88.89
11.11
1.12
1.93
203
Page 1 of 1
Data_Collected_Date
Region S.N.N.P
March 2017
Zone
GAMO GOFA
Wereda BONKE
Friday, July 21, 2017
Selected Indicator
Capacity: Access to Credit Facilities - Percentage of households by major
reasons of borrowing money
Type of Borrowing Reason
Degree of Importance of the Borrowing Reasons - HH Respones
Buy agricultural input
Buy food
Others (specify)
Pay for education
Pay for health care
1st
Important
23.68
42.11
18.42
10.53
5.26
2nd
Important
19.23
11.54
3.85
30.77
34.62
3rd
Important
62.50
12.50
12.50
12.50
204
Page 1 of 1
Data_Collected_Date
March 2017
Friday, July 21, 2017
Region S.N.N.P
Zone GAMO GOFA
Wereda BONKE
Selected Indicator
Capacity: Access to Credit Facilities - Percentage of households by major
sources of credit
Major Sources of Credit for Households
Degree of Importance of the Credit Source
Bank/formal lending institution
1st
Important
12.96
2nd
Important
5.88
3rd
Important
Friends/relatives
9.26
2.94
20.00
Help associations (Edir)
12.96
5.88
35.00
Informal savings group (Ekub)
7.41
50.00
10.00
Local shops / moneylenders
20.37
5.88
20.00
Neighbors
20.37
23.53
15.00
Others (specify)
16.67
5.88
205
Page 1 of 1
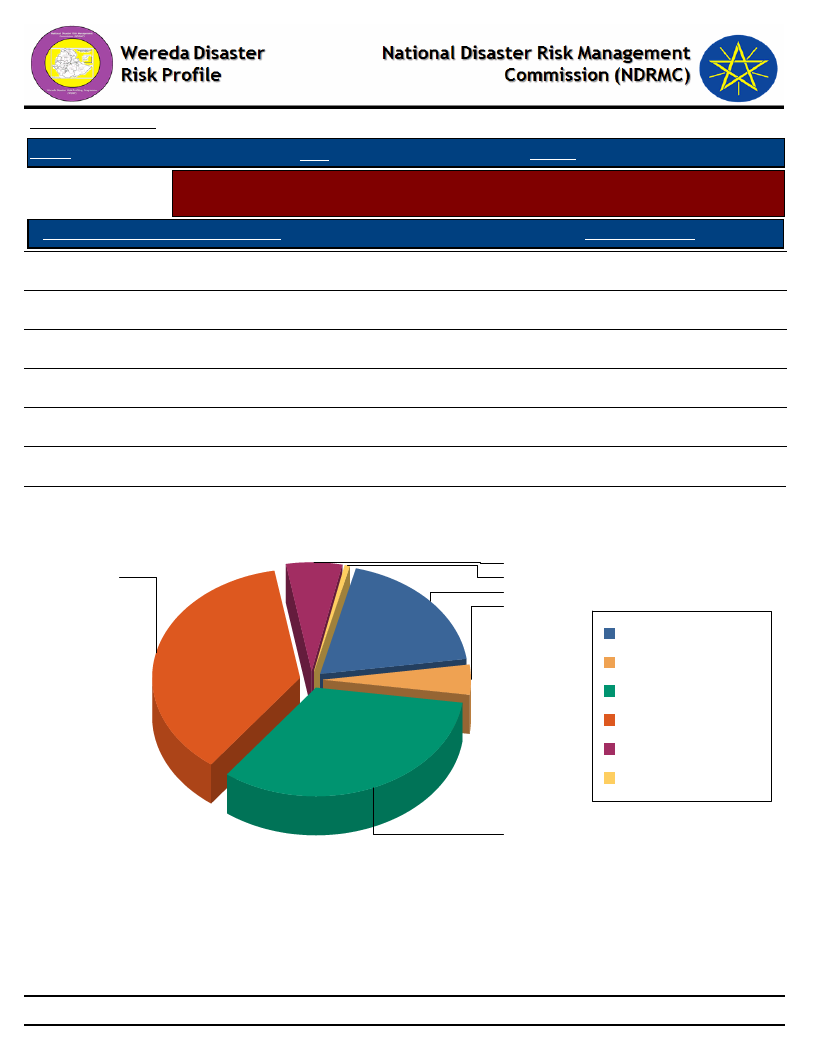
Data_Collected_Date
March 2017
Friday, July 21, 2017
Region S.N.N.P
Zone GAMO GOFA
Wereda BONKE
Selected Indicator
Capacity: Access to Credit Facilities - Percent of households with ability to raise
500 birr in one week
HH Ability To Raise 500 Br in One Week
Response_Percent
Yes, we would use our savings
6.20
Yes, by borrowing money
33.07
Yes, with some help from others
0.52
Yes, by selling asset or livestock
36.95
Perhaps, but I doubt it
4.39
No, it would be impossible
18.86
Households' Ability To Raise 500 Br in One Week
6
37
1
19
4
No, it would be
impossible
Perhaps, but I doubt it
Yes, by borrowing
money
Yes, by selling asset or
livestock
Yes, we would use our
savings
Yes, with some help
from others
33
206
Page 1 of 1
WDRP Indicators
Health and Sanitation
Characteristics
207
Data_Collected_Date
Region S.N.N.P
March 2017
Zone GAMO GOFA
Wereda BONKE
Friday, July 21, 2017
Selected Indicator
Household Access to Health Facilities - Where do patients go for health care?
Constraints to adequate healthcare
Where do Patients Go for Healthcare
HH Response Constraints to Adequate Health Care
Response
Did not get Health Care
Central Hospital
District/Municipal hospital/health
centre/ clinic
Other public
Community health worker
Private hospital/clinic
Pharmacy
Other private
Traditional healer
Spiritual healer
4.52
1.10
1.34
8.30
79.24
0.37
1.47
7.08
0.12
0.61
0.37
No money for treatment costs
100.00
Where Do Patients go for Health care?
5
1
1
0
0
1
1
7
8
0
Constraints to Adequate Health Care
79
Central Hospital
Community health worker
Did not get Health Care
District/Municipal hospital/health centre/ clinic
Other private
Other public
Pharmacy
Private hospital/clinic
Spiritual healer
Traditional healer
4.3%
1.3%
0.4%
1.1%
7.9%
0.1%
75.8%
6.8%
1.4%
0.4%
0.6%
Total:
100.0%
100
208
0.0%
No money for treatment costs 100.0%
Total:
100.0%
Page 1 of 1
Data_Collected_Date
Region S.N.N.P
March 2017
Zone GAMO GOFA
Friday, July 21, 2017
Wereda BONKE
Selected Indicator
Hazards: Health problems and changes over the last decade
Kebele Name
Health_Problems
Changes_In_Last_Decade
ZEGA
FADELE
GERIBANISHA
GALO
GERIBANISA
KARICHE
ZAZIE
GORATE
GARIBANISA
SOROGE
KOLE KANCHAME
KOLE ZALE
YELA
KOYRA MUKULA
KETELE
FISHITO
DURIBE
ALGUDA
KACHA KASHISO
CHOSHA
Caused By
Caused By
Caused By
Typhoid typhus Caused By Lack of hygiene water and
result Economic loss
Typhoid Caused By Shortage of water and food, result in
illness
Caused By
Caused By
Caused By
Caused By
Health problem (scarpus), Food shortage scarps Caused
By Shortage of food and clean water, result in health
problem
Goiter Caused By Shortage of clean water, leads to
human death
Malaria Caused By Shortage of food and clean water,
result in human death
Health problem (Goiter) Caused By Lack of water and it
lead death
Diarrhea, Measles Caused By Water and food shortage
and Illness of all groups
Scabies Caused By Shortage of food and clean water
leads to illness
Health problem (Stomach) Caused By Food shortage and
result in death
Health problem (Typhoid typhus) Caused By Shortage of
clean water and leads to health problem and loss of
income
209
Increased
Increased
Increased
Decreased
Increased
Increased
Increased
Increased
Increased
Increased
Page 1 of 2
Data_Collected_Date
Region S.N.N.P
March 2017
Zone GAMO GOFA
Friday, July 21, 2017
Wereda BONKE
Selected Indicator
Hazards: Health problems and changes over the last decade
Kebele Name
Health_Problems
Changes_In_Last_Decade
KAMELE BARIE
ORO
KALIBO LAKA
GEZESO
DENBILE OSA
DESHKELE
KALO GAGULA
GERASE ZALA
KALO GAGULA
DEMBILE OTORA
KOSHALE
GOBO BAKE
DIMELE FUSE
Caused By
Scabies Caused By Shortage of food and water, leads to
illness
Scabies disease Caused By Water and food shortage,
Illness of children happened
Malaria Caused By Shortage of food, Illness
Scabies Caused By Shortage of food and water, Illness
happened
Scabies Caused By Shortage of food and water, leads to
illness
Health problem (Diarrhea) Caused By Shortage of water
and food, lead to health problem
Caused By
Health problem (Malaria, Typhoid typhus) Caused By
Shortage of clean water, result in Human health problem
and loss of income
Malaria Caused By Lack of clean water and food
shortage, leads to illness and death
Caused By
Cough Caused By Climate change, result in loss of
income for vaccination
Increased
Increased
Increased
Increased
Increased
Increased
Increased
Increased
Increased
210
Page 2 of 2
Wereda Disaster
Risk Profile
Data_Collected_Date
March 2017
National Disaster Risk Management
Commission (NDRMC)
Friday, July 21, 2017
Region S.N.N.P
Zone GAMO GOFA
Wereda BONKE
Selected Indicator
Household Health Status - Households health condition and major health problems
Health Condition
HH Response Population Sickness
HH Response Children Sickness
HH Response
Good health
Ill for <3 months
Ill for more than three months
70.29
24.50
5.21
Chronic fever
Malaria
Diarrhea
Back ache
Stomach pain
Mental illness
Others
Headache
Tuberculosis
Pneumonia/ lung problem
Hyper tension
Eye problems
8.12
36.35
8.82
5.41
12.71
0.71
10.24
7.41
0.82
3.88
2.24
3.29
Chronic fever
Malaria
Diarrhea
Others
Headache
Pneumonia/ lung problem
Hyper tension
Eye problems
Stomach pain
17.09
30.38
22.15
10.76
10.13
3.80
1.27
3.16
0.63
211
Page 1 of 2
Wereda Disaster
Risk Profile
Data_Collected_Date
March 2017
National Disaster Risk Management
Commission (NDRMC)
Friday, July 21, 2017
Region S.N.N.P
Zone GAMO GOFA
Wereda BONKE
Selected Indicator
Household Health Status - Households health condition and major health problems
Health Condition
HH Response Population Sickness
HH Response Children Sickness
HH Response
Health Condition of the Community
5.2
24.5
70.3
Good health
Ill for <3 months
Ill for more than three months
0.0%
70.3%
24.5%
5.2%
Total:
100.0%
40
35
30
25
20
15
10
5
5
0
Back ache
8
Chronic
fever
Population Sickness in the Community
36
9
7
3
2
Diarrhea
Eye
problems
Headache
Hyper
tension
Malaria
Population Sickness
1
Mental
illness
13
10
4
1
Others Pneumonia/ Stomach
lung problem
pain
Tuberculosis
Children Sickness in the Community
32
30
28
24
22
20
17
16
12
10
11
8
4
3
4
1
1
0
Chronic fever Diarrhea Eye problems Headache Hyper tension
Malaria
Others
Pneumonia/ Stomach pain
lung problem
Children Sickness
Back ache
Chronic fever
Diarrhea
Eye problems
Headache
Hyper tension
Malaria
Mental illness
Others
Pneumonia/ lung
problem
Stomach pain
Tuberculosis
Chronic fever
Diarrhea
Eye problems
Headache
Hyper tension
Malaria
Others
Pneumonia/ lung
problem
Stomach pain
212
Page 2 of 2
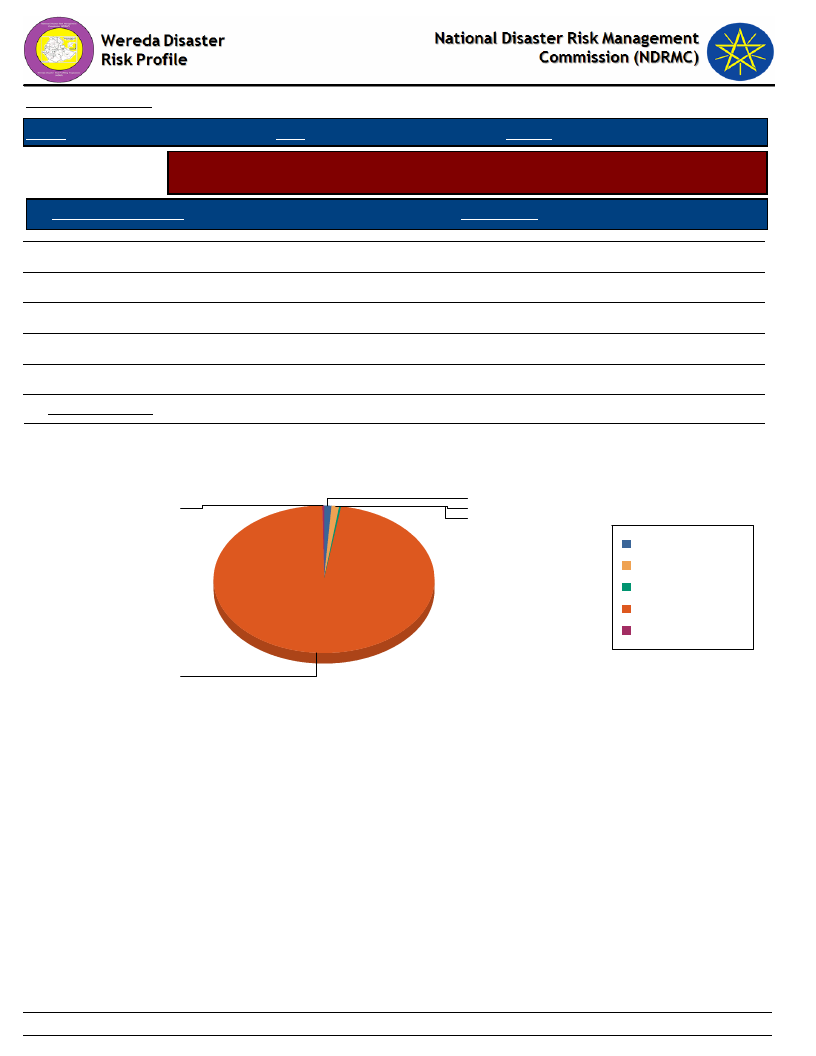
Data_Collected_Date
March 2017
Region S.N.N.P
Zone GAMO GOFA
Wereda BONKE
Selected Indicator
Household Access to Sanitation - Percentage of households with access to
different kind of toilet facilities
Type of Toilet Facility
HH Response
Modern water closet
Ventilated, build in latrine
Outdoors latrine/hole on plot
No facilities/Open Space
Other
HH Sharing Toilet
1.03
0.26
97.16
1.29
0.26
0.00
Household Responses to the type of toilet facilities in the community
Friday, July 21, 2017
0.3
97.2
1.0
1.3
0.3
Modern water closet
No facilities/Open Space
Other
Outdoors latrine/hole on
plot
Ventilated, build in
latrine
213
Page 1 of 1
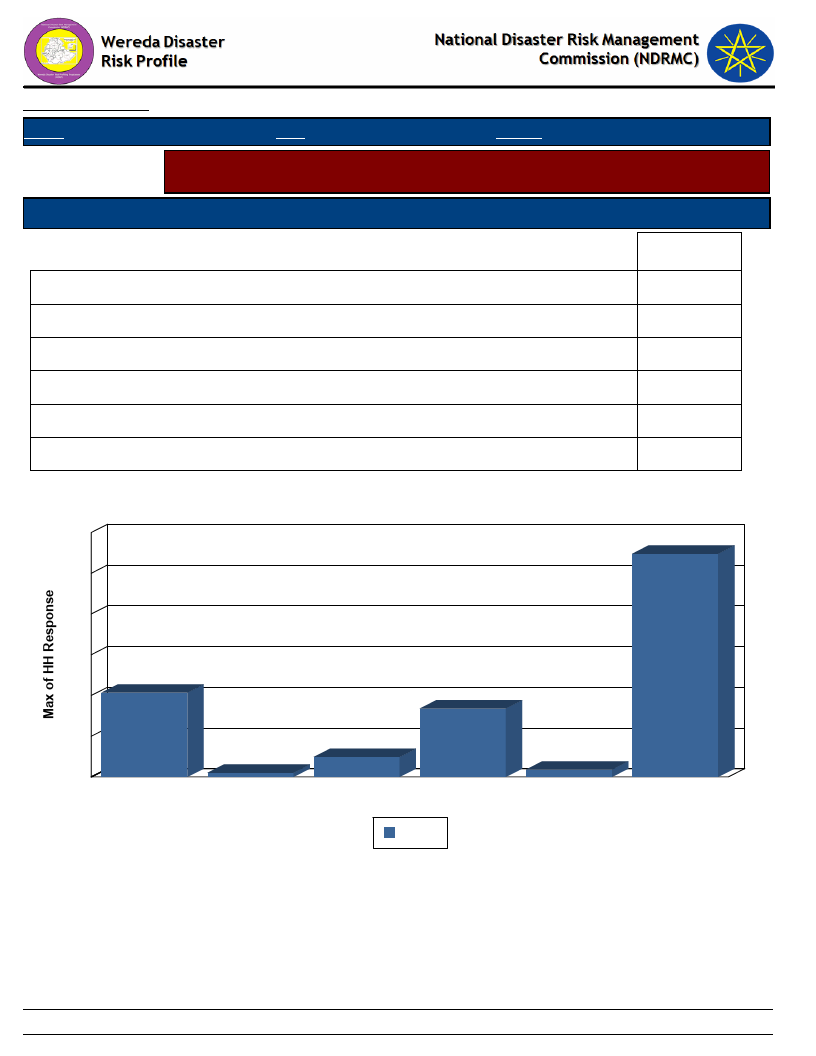
Data_Collected_Date
Region S.N.N.P
March 2017
Zone GAMO GOFA
Wereda BONKE
Friday, July 21, 2017
Selected Indicator
Household Access to Drinking Water - Sources of drinking water for households
(response in %)
Sources of drinking water for Households
Priority of the Water Source
Main
Communal tap (Bono)
Covered well or borehole
Open well
Piped water outside the house
Pond or lake (fenced)
River, stream
20.67
1.03
4.91
16.80
1.81
54.78
Source of Drinking Water & Type of Source
60
55
50
40
30
21
20
10
0
Communal tap
(Bono)
1
Covered well or
borehole
17
5
Open well
Piped water
outside the house
Main
2
Pond or lake
(fenced)
River, stream
214
Page 1 of 1
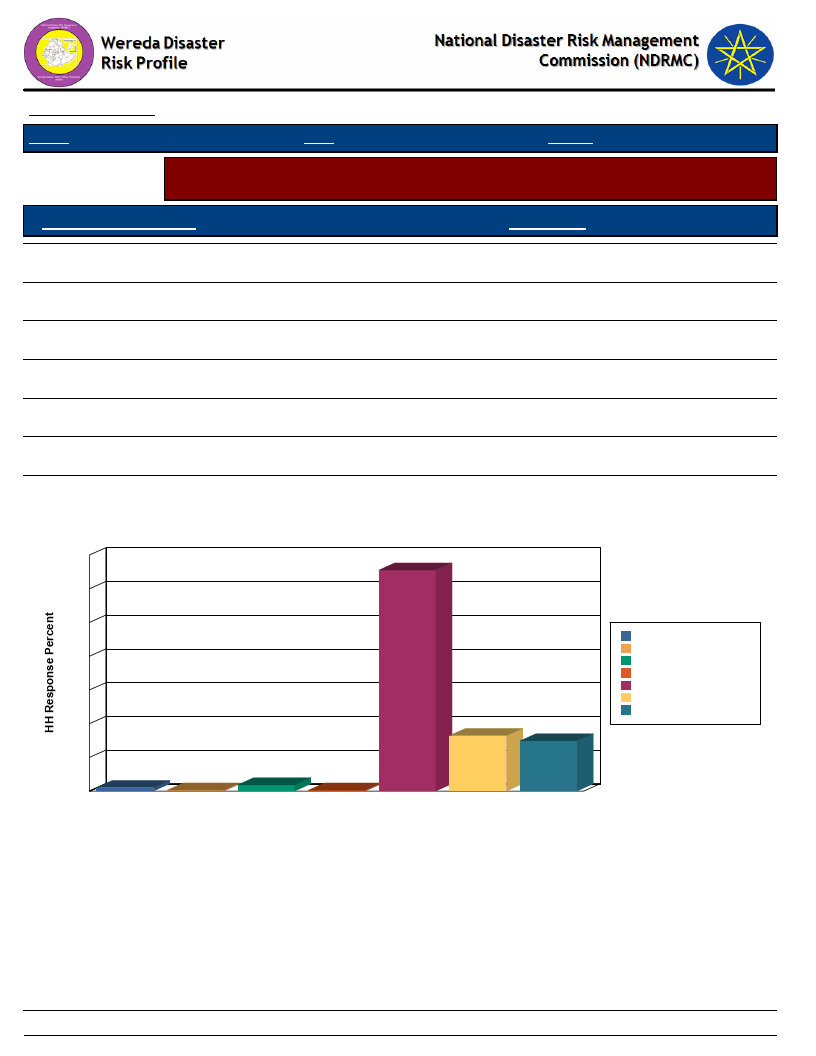
Data_Collected_Date
Region S.N.N.P
March 2017
Zone GAMO GOFA
Friday, July 21, 2017
Wereda BONKE
Selected Indicator
Household Access to Drinking Water - Households methods of treating drinking
water
Method of Treating Water
HH Response
Boil
1.04
Water Guard
14.88
Use filter
16.45
Other chemicals
0.26
Other Method (specify)
65.54
None
1.83
DK
0.26
70
60
50
40
30
20
10
1
0
Boil
Method of Treating Water by Households
66
16
15
0
2
0
DK
None
Other Other Method Use filter Water Guard
chemicals (specify)
Water Treatment Method
Boil
DK
None
Other chemicals
Other Method (specify)
Use filter
Water Guard
215
Page 1 of 1
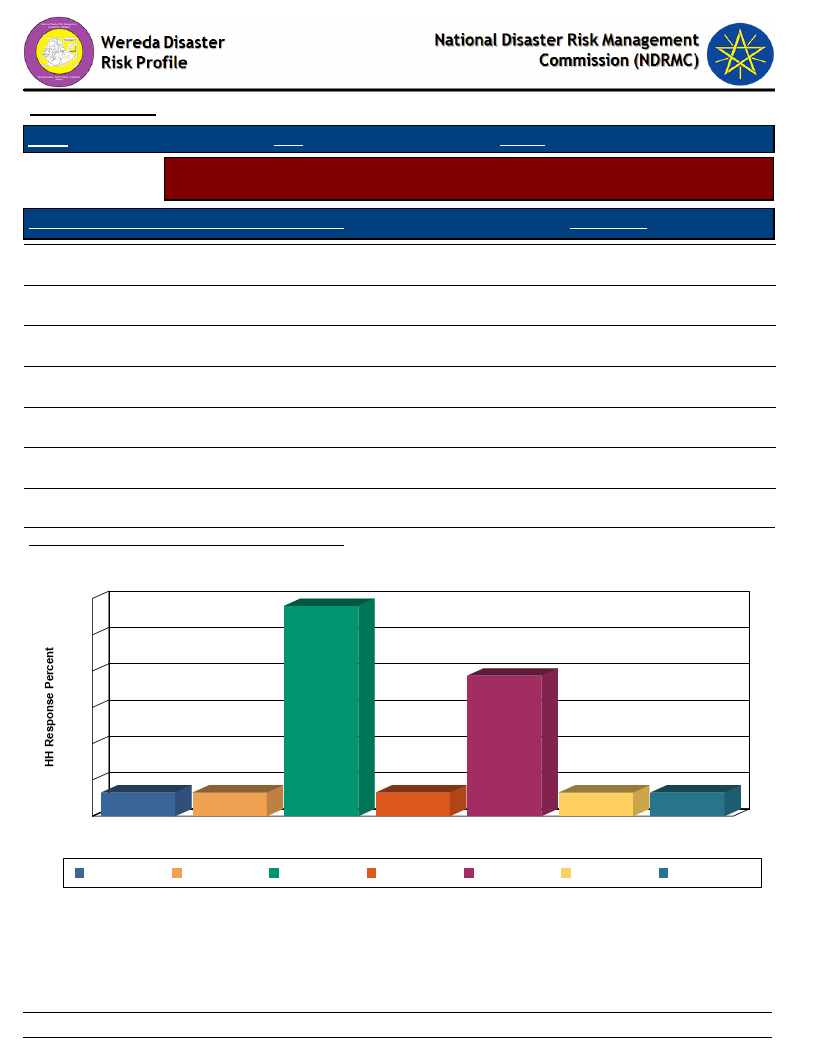
Data_Collected_Date
March 2017
Friday, July 21, 2017
Region S.N.N.P
Zone GAMO GOFA
Wereda BONKE
Selected Indicator
Household Access to Drinking Water - Number of times households fetch water
in a week
Number of Times Households Fetch Water in a Week
HH Response
Once
0.26
Twice
0.26
Three times
0.26
Four times
2.32
Five times
0.26
Seven times
1.55
Eight and more
Average Number of Times HH Fetch Water Per Week
Number of Times HH Fetch Water in a Week
2.4
2
0.26
16.32
2
1.6
2
1.2
0.8
0.4
0
0
Eight and more
0
Five times
Eight and more Five times
0
Four times
Once
Seven times
Number of Times HH Fetch Water in a Week
Four times
Once
Seven times
0
Three times
Three times
0
Twice
Twice
216
Page 1 of 1
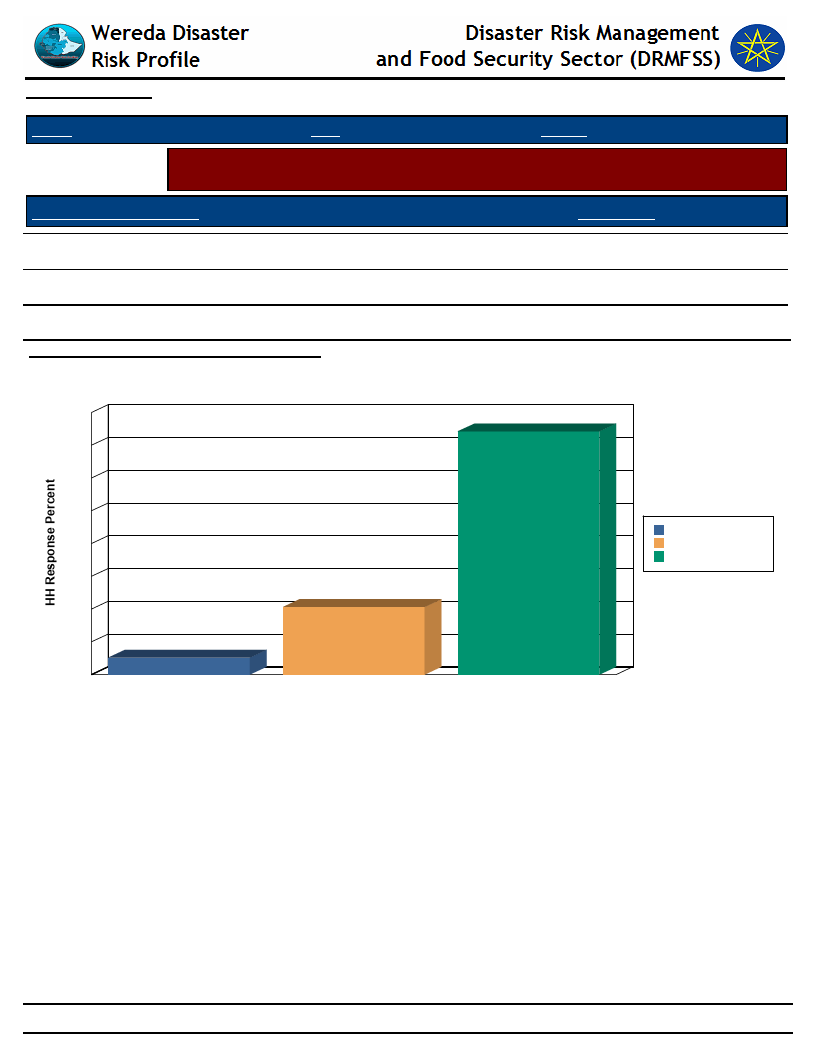
Data_Collected_Date
March 2017
Friday, July 21, 2017
Region S.N.N.P
Zone GAMO GOFA
Wereda BONKE
Selected Indicator
Household Access to Drinking Water - Time taken per day to fetch water for
households
Time Taken To Fetch Water
HH Response
Less than 30 min
74.23
30 min - 1 hr
20.62
1 hr and Above
Average Number of Times Taken To Fetch Water
5.15
29.62
Time Taken To Fetch Water for the HH
80
74
70
60
50
40
30
21
20
10
5
0
1 hr and Above
30 min - 1 hr
Less than 30 min
Time Taken To Fetch Water
1 hr and Above
30 min - 1 hr
Less than 30 min
217
Page 1 of 1
WDRP Indicators
Coping Mechanisms and
Preparedness
218

Wereda Disaster Risk
Profile
Data_Collected_Date
March 2017
Region S.N.N.P
Zone GAMO GOFA
National Disaster Risk Management
Commission (NDRMC)
Friday, July 21, 2017
Wereda BONKE
Selected Indicator
KebeleName
Capacity: Community Preparedness against Sudden Onset Disasters
Precaution_1
Comment_1
Precaution_2
Comment_2
Precaution_3
Comment_3
ZEGA
FADELE
GERIBANISHA
GALO
GERIBANISA
KARICHE
ZAZIE
GORATE
GARIBANISA
SOROGE
KOLE KANCHAME
KOLE ZALE
YELA
Co-operative work
Report to concerned
body
Working together
Working together
Co-operation works
Report to woreda
concerned bodies
Work together
Report to Early
Warning
Report to Early
warning
Working together
To escape from the
disaster impact
To get relief
response
To save their life
To help affected
family in disaster
To mitigate the
impacts of disaster
To get relief
response
To save the family
life from disaster
To get relief
response
To get relief
response
To help the affected
community
Reporting to
concerned body
Destocking
Reporting to chair
man
Report to the chair
man
Report to kebele
concerned bodies
Report to the chair
man
219
To get food and
other support.
To buy food and
crops
To get the response
to the disaster
To get temporary
response for the
disaster impact
Reporting to
early warning
Report to the
Early Warning
To make ready for
response when
disaster happen. To
get relief support.
To get response for
the disaster
Report to the
woreda early
warning
To get relief
support
To get relief
response
continuously
To get any
support
continuously
Page 1 of 3

Wereda Disaster Risk
Profile
Data_Collected_Date
March 2017
Region S.N.N.P
Zone GAMO GOFA
National Disaster Risk Management
Commission (NDRMC)
Friday, July 21, 2017
Wereda BONKE
Selected Indicator
KebeleName
Capacity: Community Preparedness against Sudden Onset Disasters
Precaution_1
Comment_1
Precaution_2
Comment_2
Precaution_3
Comment_3
KOYRA MUKULA
KETELE
Report to concerned
body
Destocking
To get response for
affected community
Work with
co-operation
To buy food crops
Migration
To resist the
disaster impacts
with out harm.
To get labor work
FISHITO
DURIBE
Co-operation work
Destocking
To escape from
disaster
To buy food crops
Report to
concerned body
To get support
ALGUDA
Migration
For labor work
Destocking
To buy food crops
KACHA KASHISO
CHOSHA
Report to concerned
bodies
Working together
KAMELE BARIE ORO
KALIBO LAKA
Report to the
concerned body
Migration
For Woreda
administration
To help affected
families
To get response
support
For labor labor
Relief support
Report to the
kebele chair man
To fulfill the food
gap
To get response fro
disaster
Report to the
woreda early
warning office
To get relief and
other support
from the woreda
GEZESO
DENBILE OSA
Migration
Co-operation
For labor work and
source of income
To save life
Report to the chair
man
To get response
like shelter
Report to the
woreda
To get
continuous
support
220
Page 2 of 3

Wereda Disaster Risk
Profile
Data_Collected_Date
March 2017
Region S.N.N.P
Zone GAMO GOFA
National Disaster Risk Management
Commission (NDRMC)
Friday, July 21, 2017
Wereda BONKE
Selected Indicator
KebeleName
Capacity: Community Preparedness against Sudden Onset Disasters
Precaution_1
Comment_1
Precaution_2
Comment_2
Precaution_3
Comment_3
DESHKELE
KALO GAGULA
Co-operation work
Destocking
To save life
To buy food
Report to
concerned bodies
Migration
To get support like
food and shelter
For labor work
GERASE ZALA
Co-operation work
KALO GAGULA
DEMBILE OTORA
KOSHALE
GOBO BAKE
DIMELE FUSE
Working with
together
Co-operation work
Report to the
concerned body
Working with
together
Work with
co-operation
To alleviate disaster
and to save the
family members
To save life
To escape from
disaster
To get relief support
To save life and to
protect disaster
To save life
Support in
materials
Report to chair
man
Support in material
Lend and borrow
food and money
Report to
concerned body
Report to the chair
man
To protect from
death
To get response for
disaster
To save from death
To save life
To gain support
To get response
Report to early
warning
To get relief and
other supports
Report to early
warning
To get relief
support like
shelter
221
Page 3 of 3

Wereda Disaster
Risk Profile
Data_Collected_Date
Region S.N.N.P
March 2017
Zone GAMO GOFA
National Disaster Risk Management
Commission (NDRMC)
Friday, July 21, 2017
Wereda BONKE
Selected Indicator
KebeleName
ZEGA
FADELE
Capacity: Community Preparedness against Increase in Disaster Intensity
Precaution_1
Comment_1
Precaution_2
Comment_2
Afforestation
Planting of short
cycle crops
To protect from the
climate change
To resist drought
impacts
Soil and water
consevation works
A forestation
To protect landslide
and flood
To prevent climate
chanege
GERIBANISHA
GALO
GERIBANISA
KARICHE
ZAZIE
GORATE
Construction of
irrigation canals
Inform to
concerned body
Migration
Migration
To produce crops,
To be independent
of rain feeed
agriculture
To get any support
like food and
temporary shelter
To protect their
family from the
impacts of disaster.
For labor work
Shifting cultivation
Migration
To keep the fertility
of the land, To
minimize the erosion
To save their life
Precaution_3
Collection of
animal feed
Migration
Migration
Soil
conservation
Comment_3
To escape from
drought season
To get labor
work to fill the
food gap.
To do labor
work, To save
their family
To protect flood
and land slide
GARIBANISA
SOROGE
KOLE KANCHAME
KOLE ZALE
Migration
Plant short cycle
crops
Plant short cycle
crops
To save their life
To feed in dry
season
To feed in dry
season
Soil conservation
works
Labor work
Labor work
To protect flood and
land slide
To fill the food gap
To fill the food gap
222
Page 1 of 4

Wereda Disaster
Risk Profile
National Disaster Risk Management
Commission (NDRMC)
Data_Collected_Date
Region S.N.N.P
March 2017
Zone GAMO GOFA
Wereda BONKE
Friday, July 21, 2017
Selected Indicator
Capacity: Community Preparedness against Increase in Disaster Intensity
KebeleName
YELA
KOYRA MUKULA
KETELE
Precaution_1
Inform to
concerned bodies
Use of crop
pesticides
Report to
concerned bodies
FISHITO
A forestation
DURIBE
Soil and water
conservation
ALGUDA
KACHA KASHISO
CHOSHA
Report to
concerned bodies
Soil and water
conservtion
Inform to
concerned body
KAMELE BARIE ORO
KALIBO LAKA
Soil and water
conservation
Use of pesticides
Comment_1
To get any support
like, pesticides
To increase
productivity
To get relief and
response
To prevent climate
change
To increase
productivity and
moisture of soil
To get relief
response
To increase
productivity
To get support for
crop and livestock
disease
To increase
productivity
To prevent crop
disease
Precaution_2
Soil conservation
works
Produce short cycle
crops
Soil and water
conservation
Soil and water
conservation works
Plant short cycle
crops
Comment_2
To protect flood and
land slide
To resist drought
To mitigate flood
impact and soil
erosion
To protect soil from
land slide
To resist drought
Precaution_3
Reforestation
Reforestation
Comment_3
To prevent
climate chanage
To prevent
climate change
Soil and water
conservation
Irrigation works
(traitional)
Migration
To keep soil fertility
To improve
productivity
For daily labor work
to get money
Cut off drian
To mitigate
flood
Irrigation
construction
Use of improved
seed varaties
223
To incrtease
productivity
To increase crop
production
Use of soil and
wayter
conservation
To prevent soil
erosion, and
land slide
Page 2 of 4

Wereda Disaster
Risk Profile
Data_Collected_Date
Region S.N.N.P
March 2017
Zone GAMO GOFA
National Disaster Risk Management
Commission (NDRMC)
Friday, July 21, 2017
Wereda BONKE
Selected Indicator
Capacity: Community Preparedness against Increase in Disaster Intensity
KebeleName
Precaution_1
Comment_1
Precaution_2
Comment_2
Precaution_3
Comment_3
GEZESO
DENBILE OSA
DESHKELE
KALO GAGULA
GERASE ZALA
KALO GAGULA
DEMBILE OTORA
KOSHALE
Migration
Destocking
Report to early
warning office
Report to early
warning
Report early
warning
Use of crop
pesticides
Repor to early
warning
Report to
concerned bodies
to irrigate "Dancha
River"
For labor work
To buy foods in
drought season
To get support
To get relief
support
To get relief and
other support
To prevent crop
disese and to
improve
productiviuty
To get relief
support
To produce crops,
To reduce food gap,
To be independent
of rainfeed
agriculture
Soil and water
conservation
Store animal feed
Increase
productivity of
vegetables
Soil and water
conservation
Planting of drought
resistant crops
Migration
Soil and water
conservation
Awareness creation
to vaccine livestock
and medical
treatment for
humans
To protect from soil
erosion and land slide
To feed in drought
season
High market value
Planting of
short cycle
crops
Soil and water
conservation
To resist
drought
To increase
fertility
To improve soil
fertility
To escape from
disaster
For labor work
Production of
vegetables
High market
value
Reforestation
To protect land
slide
To increase soil
fertility, To protect
from flood
Tp protect from
disease
Ask governmnet
to get relief
support
To fill food gap
problem
224
Page 3 of 4

Wereda Disaster
Risk Profile
National Disaster Risk Management
Commission (NDRMC)
Data_Collected_Date
Region S.N.N.P
March 2017
Zone GAMO GOFA
Wereda BONKE
Friday, July 21, 2017
Selected Indicator
Capacity: Community Preparedness against Increase in Disaster Intensity
KebeleName
Precaution_1
Comment_1
Precaution_2
Comment_2
Precaution_3
Comment_3
GOBO BAKE
DIMELE FUSE
Soil and water
conservation
Destocking to buy
food
To protect from
flood and soil
erosion
To store food for
the use of drought
season
A forestation
Storing of animal
forage
To protect soil
erosion and climate
chanage
To feed their
livestock s in dry
season
Prepare graing
land and
livestock forage
Planting of
short cycle
crops
To mitigate
livestock
disease impact
To resist
drought
225
Page 4 of 4

Wereda Disaster
Risk Profile
Data_Collected_Date
March 2017
Region S.N.N.P
Zone
GAMO GOFA
Selected Indicator
Capacity: Community Preparedness against Disasters
Kebele Name
Precaution 1
Comment 1
Precaution 2
ZEGA
FADELE
Planting local inset
and potato
Store food and
crops
It is drought resistance
plant and used for
food.
To use in drought
season
Collect food
Store animal
forage
GERIBANISHA
GALO
GERIBANISA
KARICHE
Migrating to labor
work
Soil and water
conservation
Partially to fill food
gap
To keep fertility and
increase productivity
Destocking
Construction for
irrigation use
ZAZIE
GORATE
GARIBANISA
SOROGE
KOLE KANCHAME
Soil and water
conservation
Migration
Shifting the
community into
other better places
Planting short
cycle crops
To protect soil erosion
To get labor work
inorder to fill their
food gap
To escape from the
disaster
To resist drought
A forestation
Soil and water
conservation
Soil and water
conservation
Migration
226
National Disaster Risk Management
Commission (NDRMC)
Friday, July 21, 2017
Wereda BONKE
Comment 2
To use in dry
season
Precaution 3
Soil and water
conservation
Comment 3
To protect
landslide and flood
To feed in dry
season
To buy crops
Migrate with
livestock
To feed and to
save their
livestock s life.
To be out from
rain feed
agriculture
dependency
To protect land
slide
To decrease the
land slide, flood
and erosion.
To increase soil
fertility
For labor work,
To fill their food
gap partially
Planting of short
cycle crops
Plantation of short
cycle crops
Construct irrigation
They have high
capacity to resist
an impact.
They are quick for
harvesting.
To mitigate the
impacts of
shortage of water
Page 1 of 4
Wereda Disaster
Risk Profile
Data_Collected_Date
March 2017
Region S.N.N.P
Zone
GAMO GOFA
Selected Indicator
Capacity: Community Preparedness against Disasters
Kebele Name
Precaution 1
Comment 1
Precaution 2
KOLE ZALE
Planting of short
cycle crops
To resist drought
Migration
YELA
Soil and water
conservation
KOYRA MUKULA
Soil and water
conservation
To protect soil fertility
and to increase
productivity
To increase soil
fertility
Use of pesticides
Reforestation
KETELE
FISHITO
DURIBE
ALGUDA
Store animal
forage
Collect and store
food
Store food crops
To feed in dry season,
to save their life fro
death.
To use in dry season
To use in drought
season
Store short cycle
crops
Planting of local
food ( Inset )
Store animal
forage
Store food crops
To use in drought
season
Store animal
pasture
227
National Disaster Risk Management
Commission (NDRMC)
Friday, July 21, 2017
Wereda BONKE
Comment 2
For labor work,
partially, to fill
the food gap
To protect crop
disease
Precaution 3
To protect the
environment in
safe and to
prevent from
climate change.
To sow in dry
season
Prepare livestock
forage
Store food crops
It is drought
resistant.
To feed in dry
season, to save
their life from
death
To feed in dry
season, to save
their life from
death
Comment 3
To feed their
livestock s in
disaster time.
To use in drought
season
Page 2 of 4

Wereda Disaster
Risk Profile
Data_Collected_Date
March 2017
Region S.N.N.P
Zone
GAMO GOFA
Selected Indicator
Capacity: Community Preparedness against Disasters
Kebele Name
Precaution 1
Comment 1
Precaution 2
KACHA KASHISO
Soil and water
conservation
CHOSHA
KAMELE BARIE
ORO
KALIBO LAKA
Planting of short
cycle crops
Cut off drain
Soil and water
conservation
GEZESO
Soil and water
conservation
Partially effective,
because fertility
increased
To resist disaster
impact
To mitigate land slide
To protect soil fertility
and to prevent from
soil erosion
Protect soil erosion
and keep soil fertility
Construct for
irrigation
Shifting of
cultivation
Cut off drain
A forestation
DENBILE OSA
DESHKELE
KALO GAGULA
GERASE ZALA
Producing of short
cycle crops
Migration
To resist drought, To
increase yield
To get labor work
Migration
To gain labor work
Migration
For labor work
Store food
Store food crops
Store food
Store food
National Disaster Risk Management
Commission (NDRMC)
Friday, July 21, 2017
Wereda BONKE
Comment 2
Precaution 3
Comment 3
To increase
productivity
To prevent crop
disease
To mitigate land
slide
Soil and water
conservation
Use of pesticides
Protect the
environment and
prevent from
climate change
To feed in
drought season
To use in
drought season
To use in
drought season
To use in
drought season
Store animal
pasture
Store animal
pasture
Store animal
pasture
To increase
productivity
To prevent crop
disease
To feed in dry
season
To feed in dry
season
To feed in dry
season
228
Page 3 of 4

Wereda Disaster
Risk Profile
Data_Collected_Date
March 2017
Region S.N.N.P
Zone
GAMO GOFA
Selected Indicator
Capacity: Community Preparedness against Disasters
Kebele Name
Precaution 1
Comment 1
Precaution 2
KALO GAGULA
Soil and water
conservation
DEMBILE OTORA
Store food
KOSHALE
GOBO BAKE
Collecting of
animal pasture
Cut off drain
To keep soil fertility
and to increase
productivity
To use in drought
season
To feed their livestock
in dry season
To control flood
Migration
Store animal
pasture
Livelihood
diversification
Vaccination
DIMELE FUSE
Storing of animal
forage
To feed in dry season
Planting of short
cycle crops
National Disaster Risk Management
Commission (NDRMC)
Friday, July 21, 2017
Wereda BONKE
Comment 2
For labor work to
fill their food
gap
To feed in dry
season
To store for
drought time
To prevent
livestock dieses
and to increase
productivity
To get high yield
in short period of
time.
Precaution 3
Reforestation
Construction of
irrigation
Comment 3
To protect
landslide
To alleviate water
shortage problem
229
Page 4 of 4

Wereda Disaster
Risk Profile
Data_Collected_Date
Region S.N.N.P
March 2017
Zone
GAMO GOFA
Selected Indicator
Kebele Name
Hazard: Coping and recovering during last Disaster
ALGUDA
Type of Disaster(s)
Coping_Strategy
Crop disease
labor work
Description
Not effective, because the wage price is low.
Recovery_Strategy
Destocking, Daily labor work
Description
Community
Participation_Ways
Description
Not effective, because of low price of livestock and wage.
By co-operation
Not effective, because the response is for short period of time.
Kebele Name
Type of Disaster(s)
Coping_Strategy
Description
Recovery_Strategy
Description
Community
Participation_Ways
Description
CHOSHA
Crop disease
Use of pesticides
To prevent crop disease
Migration
It is effective, the have got money.
By co-operation work
Partially effective, there is good social interaction.
230
National Disaster Risk Management
Commission (NDRMC)
Friday, July 21, 2017
Wereda BONKE
Page 1 of 15

Wereda Disaster
Risk Profile
Data_Collected_Date
Region S.N.N.P
March 2017
Zone
GAMO GOFA
Selected Indicator
Kebele Name
Hazard: Coping and recovering during last Disaster
DEMBILE OTORA
Type of Disaster(s)
Coping_Strategy
Drought
Planting of short cycle crops
Description
Partially effective, it helps to fulfill their food gap
Recovery_Strategy
Produce drought resistant crops like kasaba
Description
Community
Participation_Ways
Description
It used for drought resistivity
Good co-operation
Effective, to prevent from disaster.
Kebele Name
Type of Disaster(s)
Coping_Strategy
Description
Recovery_Strategy
Description
Community
Participation_Ways
Description
DENBILE OSA
Drought
Plant and produce root crops, Irrigation use
Partially effective, to fill the food gap
Plant and produce short cycle crops
To resist drought and o produce in short period of time.
Good co-operation
Partially effective, to save life
231
National Disaster Risk Management
Commission (NDRMC)
Friday, July 21, 2017
Wereda BONKE
Page 2 of 15

Wereda Disaster
Risk Profile
Data_Collected_Date
Region S.N.N.P
March 2017
Zone
GAMO GOFA
Selected Indicator
Kebele Name
Hazard: Coping and recovering during last Disaster
DESHKELE
Type of Disaster(s)
Coping_Strategy
Drought
Migration
Description
For labor work
Recovery_Strategy
Planting of short cycle crops and drought resistant crops
National Disaster Risk Management
Commission (NDRMC)
Friday, July 21, 2017
Wereda BONKE
Description
Community
Participation_Ways
Description
Partially effective, because they are essential in drought time to cope the impact.
Co-operation
Not effective, the support is for short period of time.
Kebele Name
Type of Disaster(s)
Coping_Strategy
Description
Recovery_Strategy
Description
Community
Participation_Ways
Description
DIMELE FUSE
Drought
Store food and animal forage
Not effective, because the measurement was for short period of time.
Planting of short cycle crops
Partially effective, it could fill a food gap for short time.
By co-operation
Partially effective, because they saved life.
232
Page 3 of 15

Wereda Disaster
Risk Profile
Data_Collected_Date
Region S.N.N.P
March 2017
Zone
GAMO GOFA
National Disaster Risk Management
Commission (NDRMC)
Friday, July 21, 2017
Wereda BONKE
Selected Indicator
Kebele Name
Hazard: Coping and recovering during last Disaster
DURIBE
Type of Disaster(s)
Coping_Strategy
Drought
Destocking
Description
Not effective, because of low price for their livestock and it is not enough to buy food.
Recovery_Strategy
Plant short cycle crops
Description
Community
Participation_Ways
Description
Not effective, because the community is highly vulnerable to shortage of water.
By co-operation
Not effective, because the support is not enough to cope from disaster.
Kebele Name
Type of Disaster(s)
Coping_Strategy
Description
Recovery_Strategy
Description
Community
Participation_Ways
Description
FADELE
Drought
Migration
Not effective because the work wage is low.
Report to concerned bodies
Not effective because the response is not enough.
By co-operation
The effectiveness is low because the support is for short period of time.
233
Page 4 of 15
Wereda Disaster
Risk Profile
Data_Collected_Date
Region S.N.N.P
March 2017
Zone
GAMO GOFA
Selected Indicator
Kebele Name
Hazard: Coping and recovering during last Disaster
FISHITO
Type of Disaster(s)
Coping_Strategy
Drought
Migration, Soil and water conservation
Description
To save life from death, To protect soil erosion and land slide
Recovery_Strategy
Food and other materials support from the government and NGO s
Description
Community
Participation_Ways
Description
Partially effective, it saved life.
Co-operation work, Borrowing money
To help each other, It was partially effective.
Kebele Name
Type of Disaster(s)
Coping_Strategy
Description
Recovery_Strategy
Description
Community
Participation_Ways
Description
GARIBANISA SOROGE
Land slide
Co-operation, Labor work
Not effective, they have no enough capacity to cope.
Borrowing of money and food each other
Not effective, because the interaction is for short period of time.
By giving shelter and food.
Not effective, because the support is for short time.
234
National Disaster Risk Management
Commission (NDRMC)
Friday, July 21, 2017
Wereda BONKE
Page 5 of 15

Wereda Disaster
Risk Profile
Data_Collected_Date
Region S.N.N.P
March 2017
Zone
GAMO GOFA
Selected Indicator
Kebele Name
Hazard: Coping and recovering during last Disaster
GERASE ZALA
Type of Disaster(s)
Coping_Strategy
Drought
Migration
Description
For labor work
Recovery_Strategy
Planting of short cycle and drought resistant crops
Description
Community
Participation_Ways
Description
Partially effective, because it used as food
By co-operation work
Not effective, the support is for short period of time.
Kebele Name
Type of Disaster(s)
Coping_Strategy
Description
Recovery_Strategy
Description
Community
Participation_Ways
Description
GERIBANISA KARICHE
Land slide
Migrate to labor work
Not effective, because it is temporary.
Daily labor
Partially effective, they can get daily income for their food.
Co-operation
Effective, there is good social interaction.
235
National Disaster Risk Management
Commission (NDRMC)
Friday, July 21, 2017
Wereda BONKE
Page 6 of 15

Wereda Disaster
Risk Profile
Data_Collected_Date
Region S.N.N.P
March 2017
Zone
GAMO GOFA
Selected Indicator
Kebele Name
Hazard: Coping and recovering during last Disaster
GERIBANISHA GALO
Type of Disaster(s)
Coping_Strategy
Drought
Migration
Description
Not effective, because of less pay for wage and malaria disease in the area.
Recovery_Strategy
Food support from the government and NGO s, Borrowing money
Description
Community
Participation_Ways
Description
Not effective, because there is no enough support to fill their food gap.
Constructing of shelters, Giving of food for a day
Not effective, the response is not continuous.
Kebele Name
Type of Disaster(s)
Coping_Strategy
Description
Recovery_Strategy
Description
Community
Participation_Ways
Description
GEZESO
Crop disease (Rust)
Plant short cycle crops
Partially effective, resist drought
Plant short cycle crops and horticulture crops
Effective, in short period
Co-operation
Not effective, because the support is not enough.
236
National Disaster Risk Management
Commission (NDRMC)
Friday, July 21, 2017
Wereda BONKE
Page 7 of 15

Wereda Disaster
Risk Profile
Data_Collected_Date
Region S.N.N.P
March 2017
Zone
GAMO GOFA
Selected Indicator
Kebele Name
Hazard: Coping and recovering during last Disaster
GOBO BAKE
Type of Disaster(s)
Coping_Strategy
Crop disease
Migration, Store crops, Destocking
Description
For labor work, To use in future time, To save life
Recovery_Strategy
Soil and water conservation
Description
Community
Participation_Ways
Description
Partially effective, because they have high rain fall.
Co-operation work in together
Partially effective
National Disaster Risk Management
Commission (NDRMC)
Friday, July 21, 2017
Wereda BONKE
Kebele Name
Type of Disaster(s)
Coping_Strategy
Description
Recovery_Strategy
Description
Community
Participation_Ways
Description
GORATE
Drought
Migration
Not effective, It is not enough to fill their food gap.
Plant crops like sweet potato
Not effective, because there is lack of irrigation and shortage of water. There is low production.
By co-operation
Not effective, because the support is for short period.
237
Page 8 of 15

Wereda Disaster
Risk Profile
Data_Collected_Date
Region S.N.N.P
March 2017
Zone
GAMO GOFA
Selected Indicator
Kebele Name
Hazard: Coping and recovering during last Disaster
KACHA KASHISO
Type of Disaster(s)
Coping_Strategy
Flood
Cut off drain
Description
Partially effective
Recovery_Strategy
Soil and water conservation
Description
Community
Participation_Ways
Description
Partially effective, but it needs continuous conservation work.
By co-operation
Effective
National Disaster Risk Management
Commission (NDRMC)
Friday, July 21, 2017
Wereda BONKE
Kebele Name
Type of Disaster(s)
Coping_Strategy
Description
Recovery_Strategy
Description
Community
Participation_Ways
Description
KALIBO LAKA
Crop disease
Migration
Not effective, the wage price of labor work is vey low, so it is difficult to cope.
Destocking
Not effective, because at the of disaster the price of livestock was decreased.
Co-operation
Not effective, because the response is insufficient and for short period of time.
238
Page 9 of 15
Wereda Disaster
Risk Profile
Data_Collected_Date
Region S.N.N.P
March 2017
Zone
GAMO GOFA
Selected Indicator
Kebele Name
Hazard: Coping and recovering during last Disaster
KALO GAGULA
Type of Disaster(s)
Coping_Strategy
Crop disease
Migration
Description
Not effective, the wage price is low.
Recovery_Strategy
Planting of vegetables
Description
Community
Participation_Ways
Description
Partially effective, it used for source of income.
By co-operation
Not effective, the support is for short period of time.
National Disaster Risk Management
Commission (NDRMC)
Friday, July 21, 2017
Wereda BONKE
Type of Disaster(s)
Coping_Strategy
Description
Recovery_Strategy
Description
Community
Participation_Ways
Description
Drought
Co-operation work
Not effective, there is low capacity to cope disaster.
Labor work in long
Partially effective, because they could fill their food gap.
By co-operation
Partially effective, because for the time being they saved life in their activities.
Kebele Name
KAMELE BARIE ORO
239
Page 10 of 15

Wereda Disaster
Risk Profile
Data_Collected_Date
Region S.N.N.P
March 2017
Zone
GAMO GOFA
Selected Indicator
Type of Disaster(s)
Hazard: Coping and recovering during last Disaster
Drought
Coping_Strategy
Destocking
Description
Not effective, because the price is low.
Recovery_Strategy
Planting of short cycle and drought resistant crops
Description
Community
Participation_Ways
Description
Partially effective
Co-operation
Not effective, the response was for short period of time.
National Disaster Risk Management
Commission (NDRMC)
Friday, July 21, 2017
Wereda BONKE
Kebele Name
Type of Disaster(s)
Coping_Strategy
Description
Recovery_Strategy
Description
Community
Participation_Ways
Description
KETELE
Drought
Planting of short cycle crops
Partially effective, to resist drought
Destocking
Not effective, because they sold their animals in low price.
By co-operation
Not effective, because the response is for short period of time and it is not sufficient in amount.
Kebele Name
KOLE KANCHAME
240
Page 11 of 15

Wereda Disaster
Risk Profile
Data_Collected_Date
Region S.N.N.P
March 2017
Zone
GAMO GOFA
Selected Indicator
Type of Disaster(s)
Hazard: Coping and recovering during last Disaster
Crop diseases
Coping_Strategy
Migration
Description
Not effective, filling their food gap in labor work is not possible.
Recovery_Strategy
Planting of crops
Description
Community
Participation_Ways
Description
Not effective, because there is less yield due to low soil productivity status.
By co-operation
Not effective, the support is for short period of time.
Kebele Name
Type of Disaster(s)
Coping_Strategy
Description
Recovery_Strategy
Description
Community
Participation_Ways
Description
KOLE ZALE
Crop disease
Migration
Not effective, It is not enough to fulfill the food gap.
Planting crops
Not effective, due to low productivity
By co-operation
Not effective, the support is for short period of time.
Kebele Name
KOSHALE
241
National Disaster Risk Management
Commission (NDRMC)
Friday, July 21, 2017
Wereda BONKE
Page 12 of 15
Wereda Disaster
Risk Profile
Data_Collected_Date
Region S.N.N.P
March 2017
Zone
GAMO GOFA
Selected Indicator
Type of Disaster(s)
Coping_Strategy
Hazard: Coping and recovering during last Disaster
Drought
Destocking, Migration
National Disaster Risk Management
Commission (NDRMC)
Friday, July 21, 2017
Wereda BONKE
Description
Not effective, because they enforced to migrate in case of food and water shortage, and productivity increased.
Recovery_Strategy
Relief support, Report to concerned bodies
Description
Community
Participation_Ways
Description
Not effective, because the measure is not enough for recovery from disaster in short period of time.
Borrowing of money, Exchanging of livestock with food
Not effective, because it is for short period of time to save life.
Kebele Name
Type of Disaster(s)
Coping_Strategy
Description
Recovery_Strategy
Description
Community
Participation_Ways
Description
KOYRA MUKULA
Drought
Destocking
Partially effective, they could cope by buying food crops.
Harvest short cycle crops, Soil and water conservation
Partially effective, because they need water for crop production.
Co-operation
Partially effective, it is not for long time.
Kebele Name
YELA
242
Page 13 of 15

Wereda Disaster
Risk Profile
Data_Collected_Date
Region S.N.N.P
March 2017
Zone
GAMO GOFA
Selected Indicator
Type of Disaster(s)
Hazard: Coping and recovering during last Disaster
Crop disease
Coping_Strategy
Soil and water conservation
Description
To mitigate land slide and flood
Recovery_Strategy
Temporary migration for labor work
Description
Community
Participation_Ways
Description
They are effective in getting money.
By co-operation work
Partially effective, there is good social interaction.
National Disaster Risk Management
Commission (NDRMC)
Friday, July 21, 2017
Wereda BONKE
Kebele Name
Type of Disaster(s)
Coping_Strategy
Description
Recovery_Strategy
Description
Community
Participation_Ways
Description
ZAZIE
Drought
Destocking
Not effective, because the price of livestock is not attractive. It is not enough to buy crops and foods.
Planting of short cycle crops
Not effective, because the community is highly vulnerable to shortage of water.
Co-operation
Not effective, because the support is not sufficient to cope disaster.
Kebele Name
ZEGA
243
Page 14 of 15
Wereda Disaster
Risk Profile
Data_Collected_Date
Region S.N.N.P
March 2017
Zone
GAMO GOFA
Selected Indicator
Type of Disaster(s)
Coping_Strategy
Hazard: Coping and recovering during last Disaster
Drought
Migration, Soil and water conservation
National Disaster Risk Management
Commission (NDRMC)
Friday, July 21, 2017
Wereda BONKE
Description
Daily labor for seeking money, To keep soil fertility and To protect from land slide and flood.
Recovery_Strategy
Food and other materials support from the government
Description
Community
Participation_Ways
Description
Partially effective
Working with co-operation
Help each other to escape from the impact.
244
Page 15 of 15
Data_Collected_Date
Region S.N.N.P
March 2017
Zone GAMO GOFA
Selected Indicator
Capacity: Type Community Participation
Kebele Name
Levels_Comm_Participation
ZEGA
FADELE
GERIBANISHA
GALO
GERIBANISA
KARICHE
ZAZIE
GORATE
GARIBANISA
SOROGE
KOLE KANCHAME
KOLE ZALE
YELA
KOYRA MUKULA
KETELE
FISHITO
DURIBE
ALGUDA
KACHA KASHISO
CHOSHA
KAMELE BARIE
ORO
KALIBO LAKA
Very good co-operation work
Poor co-operation
Good co-operation
Good co-operation
Poor co-operation
Good co-operation
Good co-operation
Good co-operation
Good co-operation
Very good social interaction
Good co-operation
Good co-operation
Very good co-operation work in the
community
Good co-operation
Good co-operation
Good co-operation
Good co-operation
Good co-operation
Good co-operation
245
Wereda BONKE
Friday, July 21, 2017
Changes_In_Last_Decade
Increased
Increased
Increased
Increased
Decreased
Increased
Decreased
Increased
Increased
Increased
Increased
Increased
Increased
Increased
Increased
Increased
Increased
Increased
Increased
Page 1 of 2

Data_Collected_Date
Region S.N.N.P
March 2017
Zone GAMO GOFA
Selected Indicator
Capacity: Type Community Participation
Kebele Name
Levels_Comm_Participation
GEZESO
DENBILE OSA
DESHKELE
KALO GAGULA
GERASE ZALA
KALO GAGULA
DEMBILE OTORA
KOSHALE
GOBO BAKE
DIMELE FUSE
Good co-operation
Good co-operation
Good co-operation
Good co-operation
Good co-operation
Good co-operation
Good co-operation
Medium
Very good co-operation
Good co-operation
Wereda BONKE
Friday, July 21, 2017
Changes_In_Last_Decade
Increased
Increased
Increased
Increased
Increased
Increased
Increased
Increased
Increased
Increased
246
Page 2 of 2
Data_Collected_Date
Region S.N.N.P
March 2017
Zone GAMO GOFA
Wereda BONKE
Friday, July 21, 2017
Selected Indicator
Capacity: Recovery from Losses from Disasters - Percentage of Households who
have managed to recover from losses of disasters
Percentage of households who have managed to recover from losses of disasters
Comments
19.25 %
247
Page 1 of 1

Wereda Disaster
Risk Profile
National Disaster Risk Management
Commission (NDRMC)
Data_Collected_Date
Region S.N.N.P
March 2017
Zone GAMO GOFA
Wereda BONKE
Friday, July 21, 2017
Selected Indicator
Capacity: Coping Strategies Adopted by Households - Main coping strategies adopted by households to recover
from respective losses
Type of Coping Strategy Adopted
Type of Loss
Begging for money or for food
Borrowing of food or cash
(including purchasing food on
credit)
Collection of wild food
Consumption rather than sale
of crop surplus
248
Page 1 of 6

Wereda Disaster
Risk Profile
National Disaster Risk Management
Commission (NDRMC)
Data_Collected_Date
Region S.N.N.P
March 2017
Zone GAMO GOFA
Wereda BONKE
Friday, July 21, 2017
Selected Indicator
Capacity: Coping Strategies Adopted by Households - Main coping strategies adopted by households to recover
from respective losses
Type of Coping Strategy Adopted
Type of Loss
Increased working hours
Limit portion size at meals
Long-term / permanent
migration (including distress
migration of whole families)
No coping strategy adopted
249
Page 2 of 6
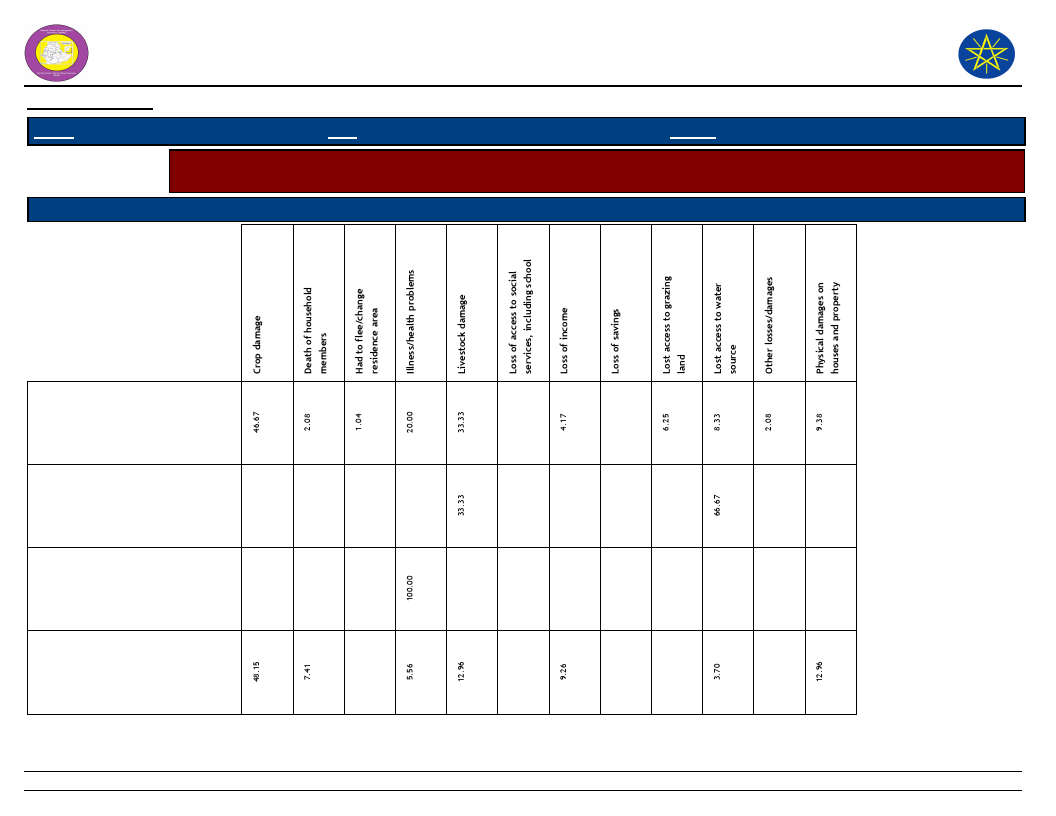
Wereda Disaster
Risk Profile
National Disaster Risk Management
Commission (NDRMC)
Data_Collected_Date
Region S.N.N.P
March 2017
Zone GAMO GOFA
Wereda BONKE
Friday, July 21, 2017
Selected Indicator
Capacity: Coping Strategies Adopted by Households - Main coping strategies adopted by households to recover
from respective losses
Type of Coping Strategy Adopted
Type of Loss
Others -
Reduce number of meals eaten
in a day
Reduced expenditure on health
and education (including taking
children out of school)
Reduced expenditure on
non-essential items (beer,
cigarettes, clothes, meat, etc.)
250
Page 3 of 6

Wereda Disaster
Risk Profile
National Disaster Risk Management
Commission (NDRMC)
Data_Collected_Date
Region S.N.N.P
March 2017
Zone GAMO GOFA
Wereda BONKE
Friday, July 21, 2017
Selected Indicator
Capacity: Coping Strategies Adopted by Households - Main coping strategies adopted by households to recover
from respective losses
Type of Coping Strategy Adopted
Type of Loss
Reduced expenditure on
productive inputs (fertilizer,
seeds, livestock drugs, etc.)
Rely on less preferred and less
expensive food
Restrict consumption by adults
in order for small children to
eat
Sale of non-productive assets
(Jewelry, clothing, etc.)
251
Page 4 of 6

Wereda Disaster
Risk Profile
National Disaster Risk Management
Commission (NDRMC)
Data_Collected_Date
Region S.N.N.P
March 2017
Zone GAMO GOFA
Wereda BONKE
Friday, July 21, 2017
Selected Indicator
Capacity: Coping Strategies Adopted by Households - Main coping strategies adopted by households to recover
from respective losses
Type of Coping Strategy Adopted
Type of Loss
Sale of productive assets (land,
farm implements, vehicle, etc.)
Seek alternative or additional
jobs
Sell more livestock than usual
Sending children of household
for work
252
Page 5 of 6

Wereda Disaster
Risk Profile
National Disaster Risk Management
Commission (NDRMC)
Data_Collected_Date
Region S.N.N.P
March 2017
Zone GAMO GOFA
Wereda BONKE
Friday, July 21, 2017
Selected Indicator
Capacity: Coping Strategies Adopted by Households - Main coping strategies adopted by households to recover
from respective losses
Type of Coping Strategy Adopted
Type of Loss
Short-term / seasonal labor
migration
253
Page 6 of 6
Data_Collected_Date
Region S.N.N.P
March 2017
Zone GAMO GOFA
Wereda BONKE
Friday, July 21, 2017
Selected Indicator
Capacity: Coping Strategies Adopted by Households - Percentage of households
by frequency of main coping strategies adopted
Type of Coping Strategy Adopted
Frequency of Adoption
Begging for money or for food
Borrowing of food or cash (including purchasing
food on credit)
Collection of wild food
Consumption rather than sale of crop surplus
Increased working hours
Limit portion size at meals
Long-term / permanent migration (including
distress migration of whole families)
No coping strategy adopted
Others -
Reduce number of meals eaten in a day
Reduced expenditure on health and education
(including taking children out of school)
Reduced expenditure on non-essential items
(beer, cigarettes, clothes, meat, etc.)
33.33
1.92
100.00
2.82
65.97
2.70
5.77
1.13
2.08
2.70
28.57
33.33
3.61
33.33
2.00
3.85
5.08
3.47
16.22
14.46
42.86
8.00
66.67
86.54
1.92
85.31
27.08
78.38
42.86
66.27
66.67
57.14
84.00
5.65
1.39
28.57
100.00
6.00
254
Page 1 of 2
Data_Collected_Date
Region S.N.N.P
March 2017
Zone GAMO GOFA
Wereda BONKE
Friday, July 21, 2017
Selected Indicator
Capacity: Coping Strategies Adopted by Households - Percentage of households
by frequency of main coping strategies adopted
Type of Coping Strategy Adopted
Frequency of Adoption
Reduced expenditure on productive inputs
(fertilizer, seeds, livestock drugs, etc.)
Rely on less preferred and less expensive food
Restrict consumption by adults in order for small
children to eat
Sale of non-productive assets (Jewelry, clothing,
etc.)
Sale of productive assets (land, farm implements,
vehicle, etc.)
Seek alternative or additional jobs
Sell more livestock than usual
Sending children of household for work
Short-term / seasonal labor migration
15.22
4.17
3.92
1.36
14.29
2.17
4.08
10.53
17.39
12.50
14.29
23.53
8.16
15.79
14.29
88.89
65.22
100.00
83.33
85.71
72.55
85.71
63.16
71.43
11.11
0.68
10.53
255
Page 2 of 2
Wereda Disaster
Risk Profile
Data_Collected_Date
March 2017
National Disaster Risk Management
Commission (NDRMC)
Friday, July 21, 2017
Region S.N.N.P
Zone GAMO GOFA
Wereda BONKE
Selected Indicator
Kebele Name
ZEGA
FADELE
Capacity: Alternative Livelihood Sources - Alternative livelihood sources suggested by the community
Work_Option_1
Comment_1
Work_Option_2
Comment_2
Work_Option_3
Daily labor
Planting of short
cycle crops
To get money for
buying food and other
materials.
To resist drought
Construction of
irrigation canals
To be independent of
rainfall
A forestation
GERIBANISHA
GALO
GERIBANISA
KARICHE
ZAZIE
GORATE
GARIBANISA
SOROGE
Daily labor
Labor work
Labor work
Planting trees
Plantation of
short cycle crops
To feed themselves
To fed the family
To generate
additional income
For income
generation
To resist drought
Migration
Construct
irrigation
Searching of job and
farm land
To prevent shortage of
rain
Vaccination
KOLE KANCHAME
KOLE ZALE
Modern irrigation
system
Petty trade
To produce in dry
season and to be
independent of
rainfall.
To create job
opportunity
Job Opportunity
To create a job for un
employees.
256
Comment_3
To prevent
climate
change
To prevent
livestock
disease and to
increase
productivity
Page 1 of 3
Wereda Disaster
Risk Profile
Data_Collected_Date
March 2017
National Disaster Risk Management
Commission (NDRMC)
Friday, July 21, 2017
Region S.N.N.P
Zone GAMO GOFA
Wereda BONKE
Selected Indicator
Kebele Name
YELA
KOYRA MUKULA
KETELE
FISHITO
DURIBE
ALGUDA
KACHA KASHISO
CHOSHA
KAMELE BARIE
ORO
KALIBO LAKA
GEZESO
DENBILE OSA
DESHKELE
KALO GAGULA
Capacity: Alternative Livelihood Sources - Alternative livelihood sources suggested by the community
Work_Option_1
Comment_1
Work_Option_2
Comment_2
Work_Option_3
Daily labor
Livestock
production
Plant short cycle
crops
Daily labor
To feed the family
member
It is income source
and used for food.
To resist drought
To gain money for
buying food
Migrate to labor
work
To get additional
income
Construction of
irrigation
To be independent
from rain fall
Migration
To fulfill their food gap
Use of improved
varieties and
pesticides
Daily labor work
To get income source
Petty trade
Produce cash
crops
For source of income
To resist drought
Labor work
Planting of root
crops
For source of income
To gain high yield and
high market value.
Comment_3
To increase
productivity
257
Page 2 of 3
Wereda Disaster
Risk Profile
Data_Collected_Date
March 2017
National Disaster Risk Management
Commission (NDRMC)
Friday, July 21, 2017
Region S.N.N.P
Zone GAMO GOFA
Wereda BONKE
Selected Indicator
Kebele Name
GERASE ZALA
KALO GAGULA
DEMBILE OTORA
KOSHALE
GOBO BAKE
DIMELE FUSE
Capacity: Alternative Livelihood Sources - Alternative livelihood sources suggested by the community
Work_Option_1
Comment_1
Work_Option_2
Comment_2
Work_Option_3
Migration
Produce cash crop
like vegetables
Bee keeping
For labor work
To resist drought and
to harvest in short
period of time
There is comfort
environment for
honey production.
Preparing of
local drink
(Chaka)
It has high income, Its
demand is high in the
community.
Planting of short
cycle crop
To resist drought
Sowing of root
crops
Due to high yield and
high market value
Comment_3
258
Page 3 of 3
Data_Collected_Date
Region S.N.N.P
March 2017
Zone GAMO GOFA
Wereda BONKE
Friday, July 21, 2017
Selected Indicator
Type of Disaster
Capacity: Recovery from Losses from Disasters - Percentage of households
recovered from past disasters by type of Disasters
Recovered Percentage
Drought
23.24
Flood
23.24
Landslide
7.57
Crop diseases
16.22
Livestock diseases
9.19
Human diseases
10.27
Storms / hail storm
0.54
Heavy Rain
8.11
Frost / Cold waves
0.54
Heat waves/ High temp
1.08
259
Page 1 of 1
Data_Collected_Date
Region S.N.N.P
March 2017
Zone GAMO GOFA
Wereda BONKE
Selected Indicator:
Capacity: Recovery from Losses from Disasters - Proportion of households
recovered by type of Losses
Type of Loss
Physical damages on houses and property
Crop damage
Livestock damage
Death of household members
Illness/health problems
Loss of income
Lost access to grazing land
Lost access to water source
Had to flee/change residence area
Friday, July 21, 2017
Percentage
8.70
61.41
11.96
2.72
7.61
3.26
2.72
1.09
0.54
260
Page 1 of 1

Data_Collected_Date
Region S.N.N.P
March 2017
Zone
GAMO GOFA
Wereda BONKE
Selected Indicator
Capacity: Coping Options if More Resources Available - What coping strategy
could be adopted if more resource were available?
Coping Strategy To Be Adopted
Adaptation of economic activities to hazards season (e.g. cropping cycle, short term
crops, etc.)
Storage of food and other necessities
Physical protection of buildings and property
Changing residence area/migration
None
Friday, July 21, 2017
Response (%)
42.38
25.32
30.23
1.81
0.26
261
Page 1 of 1
Data_Collected_Date
March 2017
Friday, July 21, 2017
Region S.N.N.P
Selected Indictor:
Zone GAMO GOFA
Wereda BONKE
Capacity: Coping Strategies Adopted by Households - Percentage of households by
major type of coping strategies adopted (at least once)
Coping Strategy Adopted
Main Strategy
Secondary Strategy
Reduced expenditure on non-essential items (beer, cigarettes,
clothes, meat, etc.)
Consumption rather than sale of crop surplus
5.59
3.28
20.12
8.76
Sell more livestock than usual
16.06
13.14
Borrowing of food or cash (including purchasing food on credit)
6.40
5.84
Sale of non-productive assets (Jewelry, clothing, etc.)
2.74
3.65
Sale of productive assets (land, farm implements, vehicle, etc.)
0.91
1.09
Sending children of household for work
2.03
2.55
Reduced expenditure on health and education (including taking
children out of school)
Reduced expenditure on productive inputs (fertilizer, seeds,
livestock drugs, etc.)
Short-term / seasonal labor migration
0.71
0.36
0.91
1.82
0.71
1.46
Long-term / permanent migration (including distress migration of
whole families)
Increased working hours
0.81
15.45
22.63
18.98
Seek alternative or additional jobs
5.79
0.36
Collection of wild food
0.10
6.93
Rely on less preferred and less expensive food
5.08
2.55
262
Page 1 of 2
Data_Collected_Date
March 2017
Friday, July 21, 2017
Region S.N.N.P
Selected Indictor:
Zone GAMO GOFA
Wereda BONKE
Capacity: Coping Strategies Adopted by Households - Percentage of households by
major type of coping strategies adopted (at least once)
Coping Strategy Adopted
Main Strategy
Secondary Strategy
Limit portion size at meals
4.47
0.73
Restrict consumption by adults in order for small children to eat
0.10
0.36
Begging for money or for food
0.30
3.28
Reduce number of meals eaten in a day
0.30
1.82
Others -
9.76
0.36
Others -
1.52
No coping strategy adopted
0.10
263
Page 2 of 2
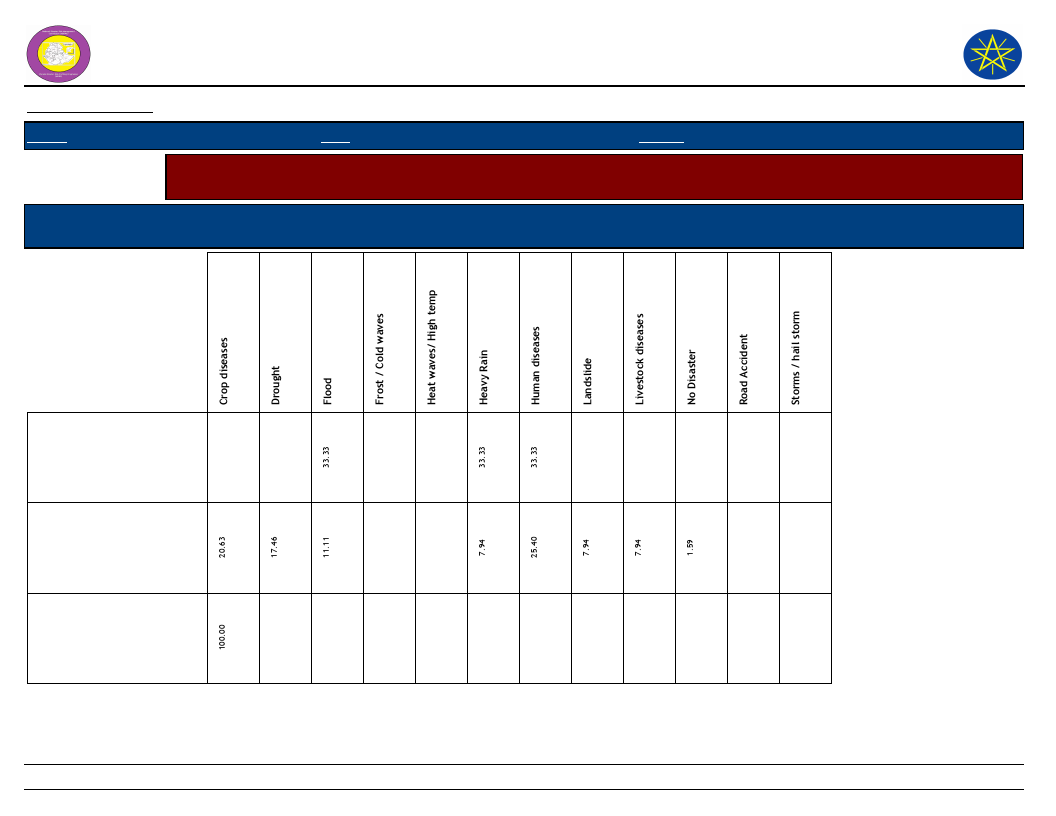
Wereda Disaster
Risk Profile
National Disaster Risk Management
Commission (NDRMC)
Data_Collected_Date
March 2017
Region S.N.N.P
Zone GAMO GOFA
Wereda BONKE
Selected Indicator
Capacity: Coping Strategies Adopted by Households - Main coping strategies adopted by households for respective
disasters
Coping Strtegies Adopted
Types of disaters for which HHs in the community adopt the listed
Coping Strtegies
Friday, July 21, 2017
Begging for money or for
food
Borrowing of food or cash
(including purchasing food
on credit)
Collection of wild food
264
Page 1 of 7

Wereda Disaster
Risk Profile
National Disaster Risk Management
Commission (NDRMC)
Data_Collected_Date
March 2017
Region S.N.N.P
Zone GAMO GOFA
Wereda BONKE
Selected Indicator
Capacity: Coping Strategies Adopted by Households - Main coping strategies adopted by households for respective
disasters
Coping Strtegies Adopted
Types of disaters for which HHs in the community adopt the listed
Coping Strtegies
Friday, July 21, 2017
Consumption rather than
sale of crop surplus
Increased working hours
Limit portion size at meals
265
Page 2 of 7

Wereda Disaster
Risk Profile
National Disaster Risk Management
Commission (NDRMC)
Data_Collected_Date
March 2017
Region S.N.N.P
Zone GAMO GOFA
Wereda BONKE
Selected Indicator
Capacity: Coping Strategies Adopted by Households - Main coping strategies adopted by households for respective
disasters
Coping Strtegies Adopted
Types of disaters for which HHs in the community adopt the listed
Coping Strtegies
Friday, July 21, 2017
Long-term / permanent
migration (including
distress migration of
whole families)
No coping strategy
adopted
Others -
266
Page 3 of 7
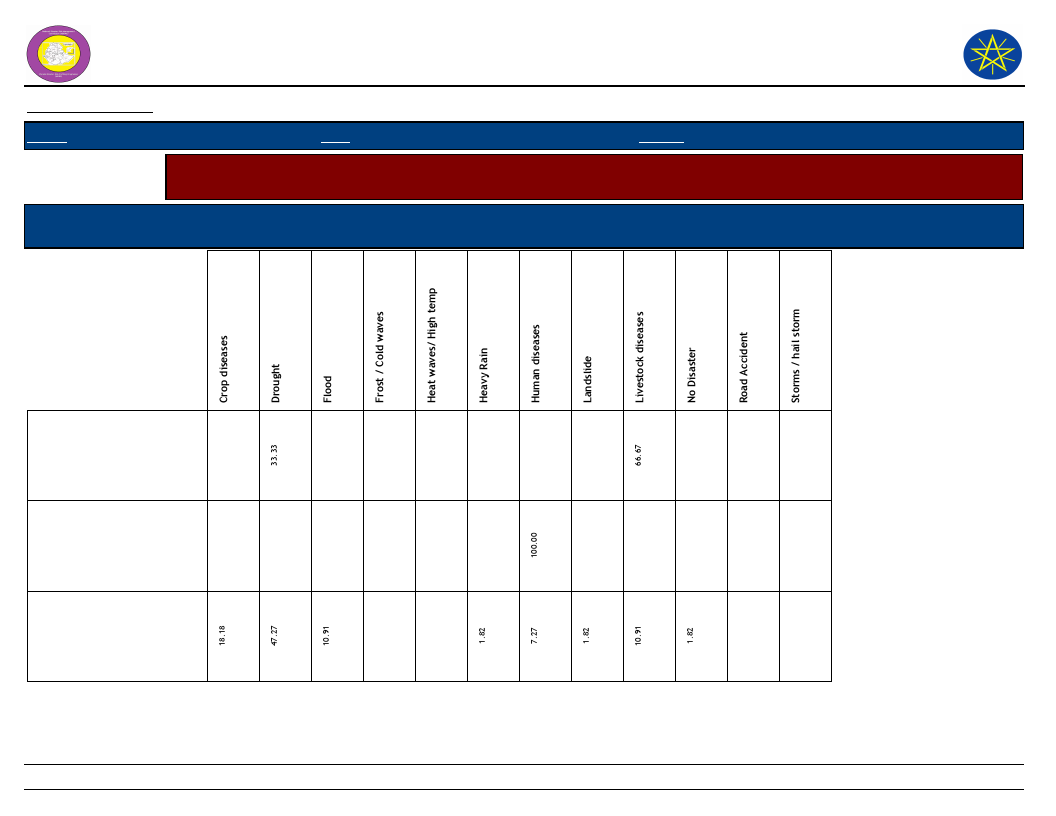
Wereda Disaster
Risk Profile
National Disaster Risk Management
Commission (NDRMC)
Data_Collected_Date
March 2017
Region S.N.N.P
Zone GAMO GOFA
Wereda BONKE
Selected Indicator
Capacity: Coping Strategies Adopted by Households - Main coping strategies adopted by households for respective
disasters
Coping Strtegies Adopted
Types of disaters for which HHs in the community adopt the listed
Coping Strtegies
Friday, July 21, 2017
Reduce number of meals
eaten in a day
Reduced expenditure on
health and education
(including taking children
out of school)
Reduced expenditure on
non-essential items (beer,
cigarettes, clothes, meat,
etc.)
267
Page 4 of 7

Wereda Disaster
Risk Profile
National Disaster Risk Management
Commission (NDRMC)
Data_Collected_Date
March 2017
Region S.N.N.P
Zone GAMO GOFA
Wereda BONKE
Selected Indicator
Capacity: Coping Strategies Adopted by Households - Main coping strategies adopted by households for respective
disasters
Coping Strtegies Adopted
Types of disaters for which HHs in the community adopt the listed
Coping Strtegies
Friday, July 21, 2017
Reduced expenditure on
productive inputs
(fertilizer, seeds,
livestock drugs, etc.)
Rely on less preferred and
less expensive food
Restrict consumption by
adults in order for small
children to eat
268
Page 5 of 7
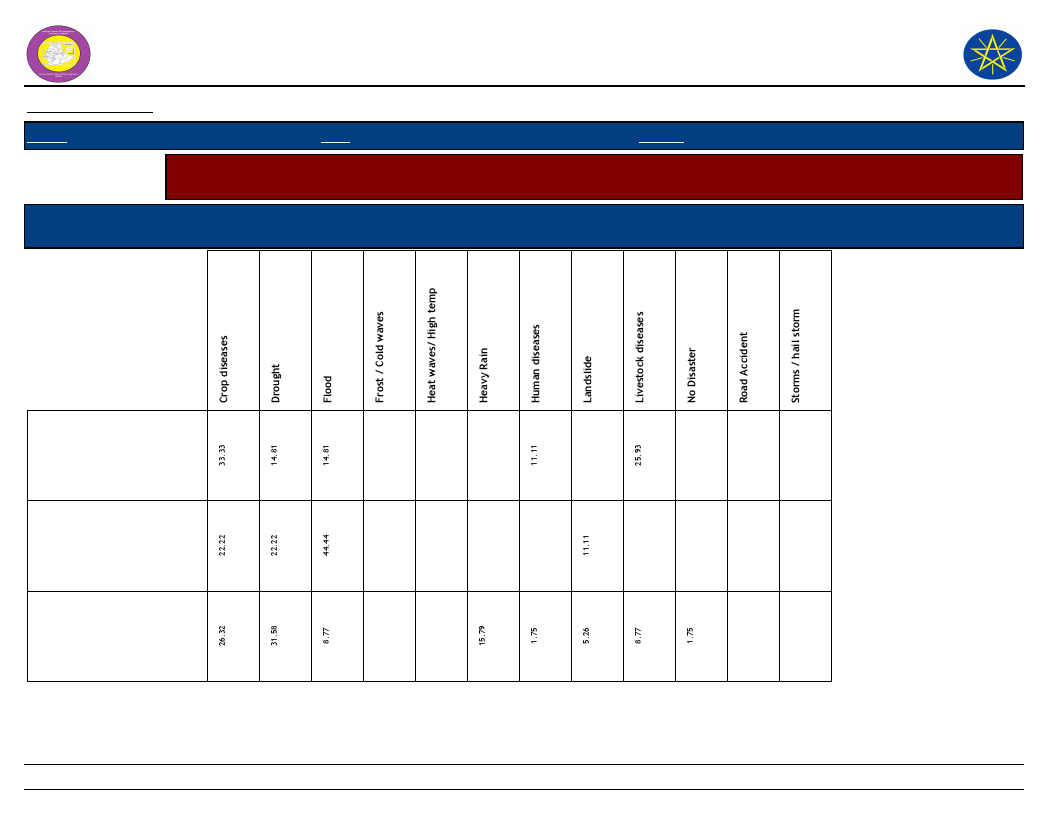
Wereda Disaster
Risk Profile
National Disaster Risk Management
Commission (NDRMC)
Data_Collected_Date
March 2017
Region S.N.N.P
Zone GAMO GOFA
Wereda BONKE
Selected Indicator
Capacity: Coping Strategies Adopted by Households - Main coping strategies adopted by households for respective
disasters
Coping Strtegies Adopted
Types of disaters for which HHs in the community adopt the listed
Coping Strtegies
Friday, July 21, 2017
Sale of non-productive
assets (Jewelry, clothing,
etc.)
Sale of productive assets
(land, farm implements,
vehicle, etc.)
Seek alternative or
additional jobs
269
Page 6 of 7

Wereda Disaster
Risk Profile
National Disaster Risk Management
Commission (NDRMC)
Data_Collected_Date
March 2017
Region S.N.N.P
Zone GAMO GOFA
Wereda BONKE
Selected Indicator
Capacity: Coping Strategies Adopted by Households - Main coping strategies adopted by households for respective
disasters
Coping Strtegies Adopted
Types of disaters for which HHs in the community adopt the listed
Coping Strtegies
Friday, July 21, 2017
Sell more livestock than
usual
Sending children of
household for work
Short-term / seasonal
labor migration
270
Page 7 of 7

Wereda Disaster Risk
Profile
National Disaster Risk Management
Commission (NDRMC)
Data_Collected_Date
Region S.N.N.P
March 2017
Zone
GAMO GOFA
Wereda BONKE
Friday, July 21, 2017
Selected Indicator
Capacity: Coping Strategies Adopted by Households - Secondary coping strategies adopted by households for
respective disasters
Begging for money or for
food
Borrowing of food or cash
(including purchasing food
on credit)
Collection of wild food
Consumption rather than
sale of crop surplus
Increased working hours
Limit portion size at meals
271
Page 1 of 4
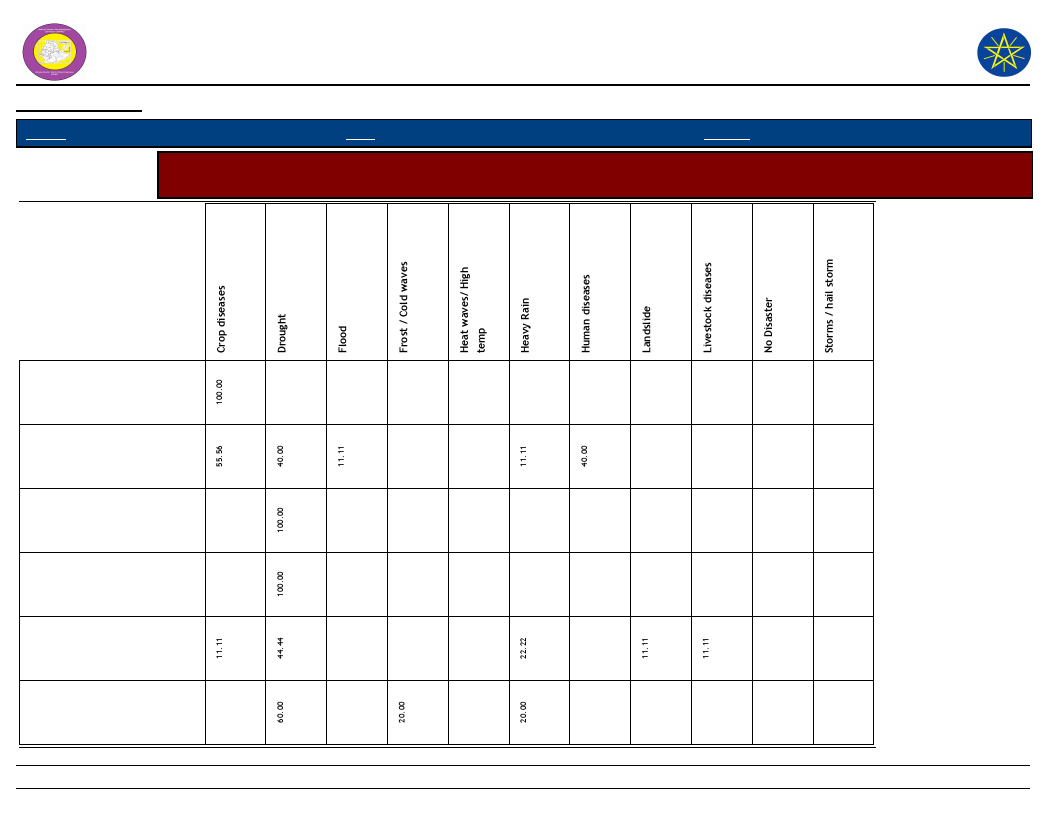
Wereda Disaster Risk
Profile
National Disaster Risk Management
Commission (NDRMC)
Data_Collected_Date
Region S.N.N.P
March 2017
Zone
GAMO GOFA
Wereda BONKE
Friday, July 21, 2017
Selected Indicator
Capacity: Coping Strategies Adopted by Households - Secondary coping strategies adopted by households for
respective disasters
No coping strategy adopted
Others -
Reduce number of meals
eaten in a day
Reduced expenditure on
health and education
(including taking children
Reduced expenditure on
non-essential items (beer,
cigarettes, clothes, meat,
Reduced expenditure on
productive inputs
(fertilizer, seeds, livestock
272
Page 2 of 4
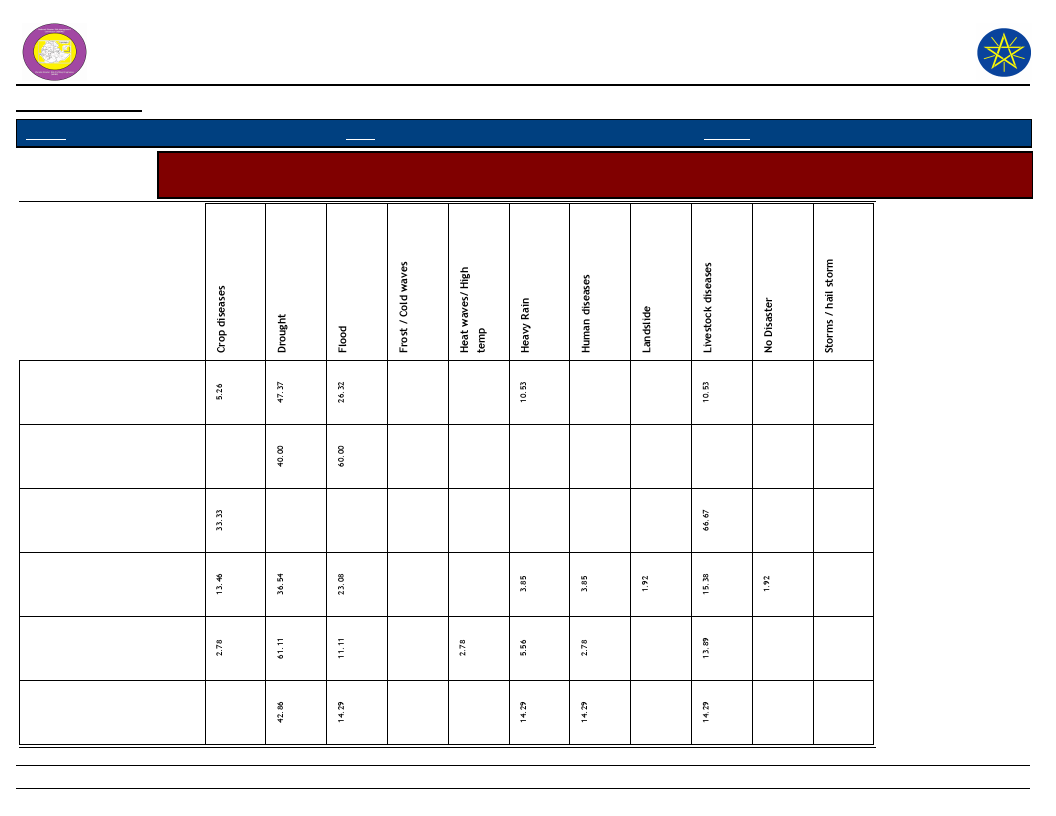
Wereda Disaster Risk
Profile
National Disaster Risk Management
Commission (NDRMC)
Data_Collected_Date
Region S.N.N.P
March 2017
Zone
GAMO GOFA
Wereda BONKE
Friday, July 21, 2017
Selected Indicator
Capacity: Coping Strategies Adopted by Households - Secondary coping strategies adopted by households for
respective disasters
Rely on less preferred and
less expensive food
Sale of non-productive
assets (Jewelry, clothing,
etc.)
Sale of productive assets
(land, farm implements,
vehicle, etc.)
Seek alternative or
additional jobs
Sell more livestock than
usual
Sending children of
household for work
273
Page 3 of 4

Wereda Disaster Risk
Profile
National Disaster Risk Management
Commission (NDRMC)
Data_Collected_Date
Region S.N.N.P
March 2017
Zone
GAMO GOFA
Wereda BONKE
Friday, July 21, 2017
Selected Indicator
Capacity: Coping Strategies Adopted by Households - Secondary coping strategies adopted by households for
respective disasters
Short-term / seasonal labor
migration
274
Page 4 of 4
WDRP Indicators
Community
Perceptions and Suggestions
275
Wereda Disaster
Risk Profile
Data_Collected_Date
March 2017
National Disaster Risk Management
Commission (NDRMC)
Friday, July 21, 2017
Region S.N.N.P
Zone
GAMO GOFA
Wereda BONKE
Selected Indicator
Kebele Name
Interventions: Community Perception on Mediums to Influence DRM Actors - Community perception on the
effectiveness of institutional channels to use to influence DRM actors
Institution_1
Process_Description
Institution_2 Process_Description
Institution_3
Process_Description
ZEGA
FADELE
GERIBANISHA
GALO
GERIBANISA
KARICHE
ZAZIE
GORATE
GARIBANISA
SOROGE
Kebele Chair man
The discuss with the
community leaders
Community leader
Community leader
Community leader
Community leader
Community leader
TO Discuss about the
issue with the
leaders.
Discuss with
community leader
for their issues
Discuss with
community leader
and report to chair
man
Discuss with
communities in
different issues.
To discuss about the
issues with the
community member.
Community leader
Discuss with the
community and
report to kebele.
Woreda
Agriculture
Office
Chair man
Chair man
Chair man
Kebele office
Kebele chair
man
Chair man
Discuss with kebele
agricultural office
Discuss with the
kebele concerned
bodies.
Discuss with kebele
chair man and
agricultural office
Discuss in kebele
level and report to
the woreda
Discuss with kebele
concerned bodies.
Discuss with kebele
agricultural experts
and other concerned
bodies
Discuss at kebele
level and report to
concerned body.
Woreda
administration
Woreda Early
Warning
Woreda
administration
Discuss with the
woreda concerned
bodies.
Report Discuss with
head of the office and
coordinator
Discuss in the report
Woreda
Administration
Discuss with woreda
concerned bodies.
Early warning
Discuss with early
warning members about
the issues.
Woreda
administration
Discuss with the
administration.
276
Page 1 of 4

Wereda Disaster
Risk Profile
Data_Collected_Date
March 2017
National Disaster Risk Management
Commission (NDRMC)
Friday, July 21, 2017
Region S.N.N.P
Zone
GAMO GOFA
Wereda BONKE
Selected Indicator
Kebele Name
Interventions: Community Perception on Mediums to Influence DRM Actors - Community perception on the
effectiveness of institutional channels to use to influence DRM actors
Institution_1
Process_Description
Institution_2 Process_Description
Institution_3
Process_Description
KOLE KANCHAME
KOLE ZALE
YELA
KOYRA MUKULA
KETELE
FISHITO
DURIBE
ALGUDA
Community leader
Community leader
Community leader
Community leader
Discuss with 1 to 5
leaders and report
to chair man
Discuss in
community level
Discuss with 1 to 5
community leader
and report to chair
man.
Discuss with
community leader
Community leader
Kebele chair man
Community leader
Community leader
Discuss with the
community
Discuss with
community leader
Discuss with the
community in
different issues
Discuss with
community
Chair man
Chair man
Chair man
Discuss with kebele
leader and report to
the woreda
Discuss with kebele
concerned bodies
Discuss with kebele
leader and report to
the woreda.
Woreda
Administration
Woreda Early
Warning
Discuss with concerned
bodies at woreda
report
Discuss with woreda
early warning
Chair man
(Agriculture
office)
Chair man
Woreda early
warning office
Kebele office
Discuss with chairman
and agriculture
experts
Discuss with kebele
concerned bodies
Discuss with kebele
experts
Discuss with kebele
concerned bodies
Woreda
Administration
Report and discuss in
different issues
Woreda
administration
Discuss about the issues
with concerned bodies
Woreda
administration
Discuss with kelebe
heads
chair man
Discuss with kebele
concerned bodies
Woreda
Administration
Discuss with concerned
bodies
277
Page 2 of 4

Wereda Disaster
Risk Profile
Data_Collected_Date
March 2017
National Disaster Risk Management
Commission (NDRMC)
Friday, July 21, 2017
Region S.N.N.P
Zone
GAMO GOFA
Wereda BONKE
Selected Indicator
Interventions: Community Perception on Mediums to Influence DRM Actors - Community perception on the
effectiveness of institutional channels to use to influence DRM actors
Kebele Name
KACHA KASHISO
CHOSHA
KAMELE BARIE
ORO
KALIBO LAKA
GEZESO
DENBILE OSA
DESHKELE
KALO GAGULA
GERASE ZALA
Institution_1
Community leader
Process_Description
Discuss with
community member
Institution_2
Chair man
Process_Description
Discuss with kebele
concerned bodies
Community leader
Contact with
community
Community leader
Discuss with 1 to 5
community leader
and report to chair
man
Discuss with the
community member
To discuss with
community members
Community leader
Community leader
Community leader
Community leader
Community leader
Discuss with the
community about
the issues
Discuss with the
community
Discuss with 1 to 5
leaders in the
community
Discuss with
community member
Discuss with
community member
Chair man
Discuss with kebele
leader and report to
the woreda
Kebele chair
man
Chair man
Kebele office
Discuss with kebele
concerned bodies
To discuss with
kebele concerned
bodies
Discuss with kebele
concerned bodies
Chair man
Chair man
Discuss with kebele
concerned bodies
Discuss with kebele
concerned bodies
Chair man
Chair man
278
Discuss with kebele
concerned bodies
Discuss with kebele
concerned bodies
Institution_3
Woreda
administration
Woreda
administration
Process_Description
Discuss in the issue
with woreda
administration
Discuss at woreda
concerned body and
give response.
Woreda
administration
Early warning
Discuss with woreda
concerned bodies
To discuss with early
warning bodies
Woreda
administration
Woreda
administration
Worda
administration
Discuss with kebele
head to woreda
concerned bodies
Discuss with concerned
bodies
Discuss with concerned
bodies in the issues
Woreda
Administration
Woreda
administration
Discuss with concerned
bodies in the issues
Discuss with concerned
bodies in the issues
Page 3 of 4

Wereda Disaster
Risk Profile
Data_Collected_Date
March 2017
National Disaster Risk Management
Commission (NDRMC)
Friday, July 21, 2017
Region S.N.N.P
Zone
GAMO GOFA
Wereda BONKE
Selected Indicator
Kebele Name
Interventions: Community Perception on Mediums to Influence DRM Actors - Community perception on the
effectiveness of institutional channels to use to influence DRM actors
Institution_1
Process_Description
Institution_2 Process_Description
Institution_3
Process_Description
KALO GAGULA
DEMBILE OTORA
KOSHALE
GOBO BAKE
DIMELE FUSE
Community leader
Community leader
Chair man
Kebele chair man
Discuss with
community leader in
the issue
Discuss with 1 to 5
leader
To discuss with
community leader
and elders
Discuss with
community leaders
Community
Discuss with
community leader
Chair man
(Agriculture
office)
Chair man
Woreda early
warning
Discuss with kebele
chair man and
Agriculture office
Discuss with kebele
concerned bodies
To make discussion in
different issues
Woreda early
warning office
Chair man
(Agricultural
office)
Discuss with kebele
and woreda
agricultural office
Discuss with kebele
concerned bodies
Woreda
administration
Report and Discuss in
the issue
Woreda
Administration
Discuss with concerned
bodies
Early warning
Report and Discuss
279
Page 4 of 4

Data_Collected_Date
Region S.N.N.P
March 2017
Zone
GAMO GOFA
Wereda BONKE
Selected Indicator
Interventions: Community Perception on their Knowledge used in DRM Process -
Perception of the community on how their knowledge influences the priorities
and measures of DRM actors
Friday, July 21, 2017
KebeleName
Community_Suggestions
ZEGA
Partially effective
FADELE
There is no enough response.
GERIBANISHA
GALO
GERIBANISA
KARICHE
ZAZIE
GORATE
No, because their influence has no value to get response for the community from
the authority.
No, many times their influence has no response.
It has its own limitation in the authorities to make discussion with the community,
especially, in supply of fertilizers and land use management issues.
There influence has not any result.
GARIBANISA
SOROGE
KOLE KANCHAME
KOLE ZALE
YELA
Partially, their influence got a response. But, there is some limitation in response
works.
Their influence is not effective, when they asked about the construction of clean
water, electricity, road, and irrigation, there was no attractive response.
Their influence is not effective. When they asked about construction of clean
water, electricity, road and irrigation, there is no response.
KOYRA MUKULA
There influence is not effective.
KETELE
Their influence was not effective, there was no any response for them.
FISHITO
Not effective
DURIBE
Not effective
ALGUDA
Not effective
KACHA KASHISO
Partially effective
CHOSHA
280
Page 1 of 2
Data_Collected_Date
Region S.N.N.P
March 2017
Zone
GAMO GOFA
Wereda BONKE
Selected Indicator
Interventions: Community Perception on their Knowledge used in DRM Process -
Perception of the community on how their knowledge influences the priorities
and measures of DRM actors
Friday, July 21, 2017
KebeleName
Community_Suggestions
KAMELE BARIE
ORO
KALIBO LAKA
GEZESO
Not effective
Not effective, because their question couldn t get a response and still they are with
a problems like lack of road access, irrigation, electricity and clean water access.
Effective
DENBILE OSA
Not effective
DESHKELE
KALO GAGULA
GERASE ZALA
KALO GAGULA
Not effective and has no value, their question in clean water supply, modern
irrigation system and health center construction was not solved.
Not effective, because their question was not answered like, clean water, road
access, modern irrigation system.
Not effective
DEMBILE OTORA
KOSHALE
Partially effective, their influence has its own value.
GOBO BAKE
Not effective
DIMELE FUSE
Partially effective, because there was some responses.
281
Page 2 of 2
Wereda Disaster Risk
Profile
National Disaster Risk Management
Commission (NDRMC)
Data_Collected_Date
Region
Zone
Wereda
Friday, July 21, 2017
Selected Indicator
Interventions: Suggestions to improve preparedness - Interventions suggested by the community to development
actors to improve preparedness in the area
KebeleName
Measure 1
Comment 1
Measure 2
Comment 2
Measure 3
Comment 3
282
Page 1 of 1
Wereda Disaster Risk
Profile
National Disaster Risk Management
Commission (NDRMC)
Data_Collected_Date
Region S.N.N.P
March 2017
Zone GAMO GOFA
Wereda BONKE
Friday, July 21, 2017
Selected Indicator
Interventions: Suggestions to DRM Actors in the Area - Community suggested measures to DRM actors in the area
for effective DRM actions
Kebele Name
ZEGA
Measure 1
Construction of
irrigation dams
FADELE
Construction of
irrigation canals
GERIBANISHA
GALO
Soil and water
conservation
GERIBANISA
KARICHE
ZAZIE
GORATE
Soil and water
conservation,
Reforestation
Construction for
clean water
Irrigation
constructions
Comment 1
To increate
productivity, To
reduce the
impact
To out from
rainfall
dependency
To mitigate soil
erosion and flood
Measure 2
Support improved
seed, Coffee
Construction of clean
water
Construction of health
center for human and
livestock
To keep soil
fertility, To
increase
productivity
To get clean
water
Improved seeds and
animals
Vaccination
To increase yield
and productivity
Improved seeds
varieties and livestock
with low price
Comment 2
To get high
product and
increase income
Measure 3
Construction of
drinking water
pumps
To protect water
born disease
Soil and water
conservation
To prevent
disease, To
increases
productivity of
livestock
To increase
agricultural
productivity
Access of
improved seed
varieties and
pesticides with
low price
Support to
educate the
children
To prevent animal
disease
To increase crop
and livestock
productivity.
Access of
improved seed
varieties
Clean water
Comment 3
To gain clean
water for
drinking
To increase soil
fertility
To prevent crop
diseases
To solve the
problem of fund
shortage
To increase
productivity
To get clean
water service.
283
Page 1 of 5
Wereda Disaster Risk
Profile
National Disaster Risk Management
Commission (NDRMC)
Data_Collected_Date
Region S.N.N.P
March 2017
Zone GAMO GOFA
Wereda BONKE
Friday, July 21, 2017
Selected Indicator
Interventions: Suggestions to DRM Actors in the Area - Community suggested measures to DRM actors in the area
for effective DRM actions
Kebele Name
GARIBANISA
SOROGE
Measure 1
Irrigation
KOLE
KANCHAME
KOLE ZALE
Support improved
seeds and livestock
varieties
Modern irrigation
system
YELA
Road access
KOYRA MUKULA Construct irrigation
KETELE
Construct irrigation
FISHITO
Fund release
support
Comment 1
For water access
and to increase
productivity
To increase yield
and productivity
Measure 2
Improved varieties of
seeds and animals with
low price
Construction of
drinking water access
To increase
productivity, to
be out from rain
fall dependency
For market
linkage
Shortage of water
To be
independent of
rain fall, to
improve
productivity
To fill the food
gap problem
Improved seed variety
(potato)
Electricity
Increase livestock
experts
Reforestation
Construct drinking
water access
Comment 2
To increase
productivity
Measure 3
Soil and water
conservation
To reduce human
disease
Road access
To increase yield
Construct clean
water
To use
technologies
There is no enough
livestock experts.
To prevent from
climate change
and soil erosion
Market access
Clean water
supply
Relief support
To gain clean
water, To reduce
human disease
Create new job
opportunity
Comment 3
To keep soil
fertility
For social
interaction and
market linkage
There is shortage
of clean water
For selling of
crop products
To prevent form
disease
To fill the food
gap
To participate
youths in new
works
284
Page 2 of 5
Wereda Disaster Risk
Profile
National Disaster Risk Management
Commission (NDRMC)
Data_Collected_Date
Region S.N.N.P
March 2017
Zone GAMO GOFA
Wereda BONKE
Friday, July 21, 2017
Selected Indicator
Interventions: Suggestions to DRM Actors in the Area - Community suggested measures to DRM actors in the area
for effective DRM actions
Kebele Name
DURIBE
Measure 1
Irrigation
construction
Comment 1
To increase
productivity
Measure 2
Clean water
construction
ALGUDA
Construction for
clean water
To prevent water
born disease
Construction for
irrigation
KACHA KASHISO Road access
For market
linkage
Electricity
CHOSHA
Clean water
construction
KAMELE BARIE
ORO
Road construction
To get clean
drinking water, to
prevent disease
For social
interaction and
market linkage
Road construction
Irrigation and clean
water construction
KALIBO LAKA
Modern irrigation
system Construction
To improve
productivity
Construction of clean
water
Comment 2
To decrease water
born disease
To increase
productivity
To use electric
power
For enhancement
of market linkage
Measure 3
Vaccination
Access of seed
varieties and
pesticides in low
price
Modern irrigation
system, Improved
seeds variety
Creation of job
opportunity
Comment 3
To prevent
livestock disease
and increase
productivity
To increase
productivity
To enhance
productivity
To reduce un
employment
To increase clean
water supply
To prevent water
born disease
Supply of
improved variety
of seed and
livestock
Construction of
bridge and road
To increase
productivity
For social
interaction and
market linkage
285
Page 3 of 5
Wereda Disaster Risk
Profile
National Disaster Risk Management
Commission (NDRMC)
Data_Collected_Date
Region S.N.N.P
March 2017
Zone GAMO GOFA
Wereda BONKE
Friday, July 21, 2017
Selected Indicator
Interventions: Suggestions to DRM Actors in the Area - Community suggested measures to DRM actors in the area
for effective DRM actions
Kebele Name
GEZESO
DENBILE OSA
Measure 1
Access of improved
seeds (potato,
animal species)
Construct water
project
Comment 1
To increase
productivity
To increase yield,
To get clean
drinking water
Measure 2
Construction of
veterinary health
center
Improved seed
varieties
DESHKELE
Modern irrigation
system
To produce crops
and to increase
yield
Electricity
KALO GAGULA
Modern irrigation
system
To produce crops,
To increase yield
Clean water
construction
GERASE ZALA
Clean water
construction
KALO GAGULA
Food (relief)
support
To get clean
water
To cope food
shortage
Modern irrigation
system
Improved seeds access
Comment 2
To prevent from
animal diseased
Measure 3
Clean water
construction
To resist drought
impact and to
produce short
period
To use electricity,
to create new job
opportunity
To prevent water
born disease
To produce crop
and to improve
yield
To increase
productivity
Improved
varieties of
livestock and
crops
Ambulance
service,
Construction of
health centers
Road access
Fund to use
fertilizer and
pesticides
Comment 3
For clean water
access
To increase
productivity
To save pregnant
women from
death, To get
health service
For market
linkage
To increase yield
286
Page 4 of 5
Wereda Disaster Risk
Profile
National Disaster Risk Management
Commission (NDRMC)
Data_Collected_Date
Region S.N.N.P
March 2017
Zone GAMO GOFA
Wereda BONKE
Friday, July 21, 2017
Selected Indicator
Interventions: Suggestions to DRM Actors in the Area - Community suggested measures to DRM actors in the area
for effective DRM actions
Kebele Name
DEMBILE
OTORA
Measure 1
Modern irrigation
KOSHALE
Constructing
irrigation like
"Dancha river"
GOBO BAKE
Construction of
health center
DIMELE FUSE
Access of water
Comment 1
To produce crop
and to increase
yield
To increase
productivity, To
produce livestock
forage
To reduce disease
and death
Measure 2
Construction of clean
water
Construct health
centers and clean
water
Electricity
For consumption,
for crop
production and
livestock use
Access of irrigation
Comment 2
To reduce human
disease
Measure 3
Electricity
To prevent disease
and to reduce
death
Relief support
To use eclectic
power
Construction of
drinking water
To be independent
from rain fall
Improved seeds
variety in low
price
Comment 3
To use eclectic
power
To fulfill food
gap
To reduce human
disease and
death
To increase
productivity
287
Page 5 of 5

Wereda Disaster Risk
Profile
National Disaster Risk Management
Commission (NDRMC)
Data_Collected_Date
Region S.N.N.P
March 2017
Zone GAMO GOFA
Wereda BONKE
Friday, July 21, 2017
Selected Indicator
Economic Vulnerability: Community Suggestions to Improve Economic Situation - Community suggested measures
to improve the economic situation of the area
KebeleName
Measure 1
Comment 1
Measure 2
Comment 2
Measure 3 Comment 3
ZEGA
FADELE
Plantation
GERIBANISHA
GALO
Use of irrigation
GERIBANISA
KARICHE
Soil and water
conservation
ZAZIE
Construction for
irrigation use
GORATE
Modern irrigation
system
As income source
To be independent of rain
fall
To increase fertility
To increase productivity
To increase yield
To plant cash crops
e.g. banana
Migration
Improve irrigation
use
Reforestation
Improved seed
varieties and
livestock s
As income source
To get farm land
To be independent
of rain fall
To prevent climate
change
To increase
productivity
To plant
widely
improved
coffee
varieties
To increase
income
Use of
pesticides and
improved
seeds
To increase
yield
Support
improved
livestock
varieties
Lack of
funding
Construction
for drinking
water
To get clean
water and to
decrease
disease
Clean water
To get clean
water service
288
Page 1 of 5

Wereda Disaster Risk
Profile
National Disaster Risk Management
Commission (NDRMC)
Data_Collected_Date
Region S.N.N.P
March 2017
Zone GAMO GOFA
Wereda BONKE
Friday, July 21, 2017
Selected Indicator
Economic Vulnerability: Community Suggestions to Improve Economic Situation - Community suggested measures
to improve the economic situation of the area
KebeleName
Measure 1
Comment 1
Measure 2
Comment 2
Measure 3 Comment 3
GARIBANISA
SOROGE
Irrigation activities
KOLE KANCHAME
Improved seeds access
with low price
KOLE ZALE
Access of pesticides and
improved seed
YELA
Road access
KOYRA MUKULA
Access of irrigation
KETELE
FISHITO
Construct irrigation
To mitigate shortage of
water
To increase yield
To increase productivity
For market linkage
To be independent of rain
fall
To increase yield
Access of pesticides
and improved seeds
with low price
Access of fertilizer
with low price
To improve
productivity
To increase yield
Support of
improved livestock
varieties from the
government and
NGO s
Support improved
seed varieties
Increase livestock
experts,
Vaccination
Lack of funding
To increase
productivity
To increase
productivity
Plant short cycle
crops
To increase yield
Soil and
water
conservation
Access of
improved
livestock
varieties
To keep soil
fertility
To increase
livestock
productivity
Access of
fertilizer with
low price and
pesticides
Construct
health center
To increase
productivity
Medical
treatment
289
Page 2 of 5
Wereda Disaster Risk
Profile
National Disaster Risk Management
Commission (NDRMC)
Data_Collected_Date
Region S.N.N.P
March 2017
Zone GAMO GOFA
Wereda BONKE
Friday, July 21, 2017
Selected Indicator
Economic Vulnerability: Community Suggestions to Improve Economic Situation - Community suggested measures
to improve the economic situation of the area
KebeleName
Measure 1
Comment 1
Measure 2
Comment 2
Measure 3 Comment 3
DURIBE
ALGUDA
Irrigation construction
Irrigation construction
KACHA KASHISO
To increase productivity
To increase yield
Reforestation
Improved seed
varieties and
pesticides with low
price
To prevent climate
change
To increase
productivity
Clean water
construction
Construct
health center
for livestock
To prevent
disease
For
vaccination
CHOSHA
KAMELE BARIE
ORO
KALIBO LAKA
GEZESO
Improved irrigation
system
To increase yield
Irrigation water
construction
To increase productivity
Construction of modern
irrigation technologies
Petty trade
To increase income
Support improved
seeds and livestock
s
Clean water
construction
Construction of
road
Irrigation
construction
To increase
productivity
Road access
For market
linkage
To increase access
of clean drinking
water
To increase
productivity
Soil and
water
conservation
Access of
improved
seeds and
livestock
Plantation of
short cycle
crops
To increase
fertility
To increase
productivity
290
Page 3 of 5

Wereda Disaster Risk
Profile
National Disaster Risk Management
Commission (NDRMC)
Data_Collected_Date
Region S.N.N.P
March 2017
Zone GAMO GOFA
Wereda BONKE
Friday, July 21, 2017
Selected Indicator
Economic Vulnerability: Community Suggestions to Improve Economic Situation - Community suggested measures
to improve the economic situation of the area
KebeleName
DENBILE OSA
Measure 1
Access of irrigation
Comment 1
For shortage of water
Measure 2
Vaccination
Comment 2
To increase
livestock
productivity
Measure 3
Access of
fertilizer with
low price
Comment 3
To increase
productivity
DESHKELE
Irrigation construction
To increase productivity
Clean water
construction
To prevent disease
Electricity
construction
For electric
power use
KALO GAGULA
Irrigation construction
To improve productivity
Clan water
construction
To prevent disease
Construction
of health
centers
For health
service
GERASE ZALA
Irrigation construction
To increase productivity
Clean water
construction
To decrease
human disease
Road access
To minimize
women and
children
death
KALO GAGULA
Access of irrigation
To be out from rain fall
dependence
Improved seeds
varieties
To increase yield
Access of
fertilizer with
low price
To increase
productivity
DEMBILE OTORA
Irrigation construction
To increase productivity
Clean water
construction
To prevent disease Electricity
For the use
of eclectic
power
KOSHALE
Irrigate "Duncha river"
To increase productivity
Use of modern
honey hey
To increase
productivity
Access of
improved
variety
livestock
To increase
livestock
productivity
291
Page 4 of 5

Wereda Disaster Risk
Profile
National Disaster Risk Management
Commission (NDRMC)
Data_Collected_Date
Region S.N.N.P
March 2017
Zone GAMO GOFA
Wereda BONKE
Friday, July 21, 2017
Selected Indicator
Economic Vulnerability: Community Suggestions to Improve Economic Situation - Community suggested measures
to improve the economic situation of the area
KebeleName
Measure 1
Comment 1
Measure 2
Comment 2
Measure 3 Comment 3
GOBO BAKE
DIMELE FUSE
Use of improved seeds
variety
Access of irrigation
To get high crop
production
Shortage of rainfall
Use of improved
livestock variety
Access to improved
and short cycle
crop seeds
To get high
livestock
production
To increase
productivity
Access of
fertilizer with
low price
To improve
access
292
Page 5 of 5

Wereda Disaster
Risk Profile
Data_Collected_Date
March 2017
Region S.N.N.P
Zone GAMO GOFA
Selected Indicator
Community Awareness of Disaster Risk Management System and Actors
Kebele Name
ALGUDA
Institution 1
Responsibility
Activity
Health extension
To create awareness about health issues
To prevent from disease
Institution 2
Responsibility
Activity
Agricultural office
To the extension of agricultural technology
To increase crop and livestock productivity
Institution 3
Responsibility
Activity
Kebele Name
School
To teach the community
To create educated man power
CHOSHA
Institution 1
Responsibility
Activity
Agriculture office
Extension of agricultural technology
To increase crop and livestock productivity
Institution 2
Responsibility
Activity
Health extension
Awareness creation about health
To prevent disease
Institution 3
Responsibility
Activity
Police office
Prevent any complain
To keep peace and security
National Disaster Risk
Management Comission (NDRMC)
Friday, July 21, 2017
Wereda BONKE
293
Page 1 of 15

Wereda Disaster
Risk Profile
Data_Collected_Date
March 2017
Region S.N.N.P
Zone GAMO GOFA
Selected Indicator
Community Awareness of Disaster Risk Management System and Actors
Kebele Name
DEMBILE OTORA
Institution 1
Responsibility
Activity
Agriculture office
To extent technology
To increase agricultural productivity
Institution 2
Responsibility
Activity
Health extension
Aware to care their health
To protect from disease
Institution 3
Responsibility
Activity
Kebele Name
Police
To prevent any complain
To keep peace and security
DENBILE OSA
Institution 1
Responsibility
Activity
Agricultural office
Extension of agricultural technology
Increase crop production
Institution 2
Responsibility
Activity
Health extension
Awareness creation about health
Protect from disease
Institution 3
Responsibility
Activity
Police office
To prevent any complain
Keep peace and security
National Disaster Risk
Management Comission (NDRMC)
Friday, July 21, 2017
Wereda BONKE
294
Page 2 of 15
Wereda Disaster
Risk Profile
Data_Collected_Date
March 2017
Region S.N.N.P
Zone GAMO GOFA
Selected Indicator
Community Awareness of Disaster Risk Management System and Actors
Kebele Name
DESHKELE
Institution 1
Responsibility
Activity
Agriculture office
To extent technology
To increase productivity
Institution 2
Responsibility
Activity
Health extension
To aware about health
To prevent disease
Institution 3
Responsibility
Activity
Kebele Name
School
To teach the community
To create educated man power
DIMELE FUSE
Institution 1
Responsibility
Activity
Health extension
Awareness creation about health
To protect from disease
Institution 2
Responsibility
Activity
Agricultural office
Extension of agricultural technology
To increase crop and livestock productivity
Institution 3
Responsibility
Activity
School
To tech the community
To create educated man power
National Disaster Risk
Management Comission (NDRMC)
Friday, July 21, 2017
Wereda BONKE
295
Page 3 of 15

Wereda Disaster
Risk Profile
Data_Collected_Date
March 2017
Region S.N.N.P
Zone GAMO GOFA
Selected Indicator
Community Awareness of Disaster Risk Management System and Actors
Kebele Name
DURIBE
Institution 1
Responsibility
Activity
Agriculture office
Extension of agricultural technology
To increase crop and livestock productivity
Institution 2
Responsibility
Activity
Health office
For health extension
To decrease the extent of disease
Institution 3
Responsibility
Activity
Kebele Name
School
To teach the community
To create educated man power
FADELE
Institution 1
Responsibility
Activity
Agricultural office
For technology extension
To increase agricultural productivity.
Institution 2
Responsibility
Activity
Health extension
To reduce diseases
To aware about health extension
Institution 3
Responsibility
Activity
Police office
To prevent from complains
To keep peace and security
National Disaster Risk
Management Comission (NDRMC)
Friday, July 21, 2017
Wereda BONKE
296
Page 4 of 15

Wereda Disaster
Risk Profile
Data_Collected_Date
March 2017
Region S.N.N.P
Zone GAMO GOFA
Selected Indicator
Community Awareness of Disaster Risk Management System and Actors
Kebele Name
FISHITO
Institution 1
Responsibility
Activity
Health extension
Aware to care for their health
Protect from disease
Institution 2
Responsibility
Activity
Agriculture office
Extension of agricultural technology
Increase crop and livestock productivity
Institution 3
Responsibility
Activity
Kebele Name
School
To tech the community
To create educated man power
GARIBANISA SOROGE
Institution 1
Responsibility
Activity
Agricultural office
Extension of agricultural technology
To increase the productivity of crop and livestock
Institution 2
Responsibility
Activity
Health extension
Awareness creation about health issues
To protect from diseases
Institution 3
Responsibility
Activity
Police office
To prevent any complain
To keep peace and security
National Disaster Risk
Management Comission (NDRMC)
Friday, July 21, 2017
Wereda BONKE
297
Page 5 of 15

Wereda Disaster
Risk Profile
Data_Collected_Date
March 2017
Region S.N.N.P
Zone GAMO GOFA
Selected Indicator
Community Awareness of Disaster Risk Management System and Actors
Kebele Name
GERASE ZALA
Institution 1
Responsibility
Activity
Agriculture office
Extension of agricultural technology
To increase productivity
Institution 2
Responsibility
Activity
Health extension
Aware to care for their health
Protect from disease
Institution 3
Responsibility
Activity
Kebele Name
School
To teach the community
To create educated man power
GERIBANISA KARICHE
Institution 1
Responsibility
Activity
Agricultural office
Extension of agricultural technology
To increase crop and livestock productivity
Institution 2
Responsibility
Activity
Health extension
Awareness creation about health issues
To protect from disease
Institution 3
Responsibility
Activity
Police office
To prevent any complain
To keep peace and security
National Disaster Risk
Management Comission (NDRMC)
Friday, July 21, 2017
Wereda BONKE
298
Page 6 of 15

Wereda Disaster
Risk Profile
Data_Collected_Date
March 2017
Region S.N.N.P
Zone GAMO GOFA
Selected Indicator
Community Awareness of Disaster Risk Management System and Actors
Kebele Name
GERIBANISHA GALO
Institution 1
Responsibility
Activity
Health extension
Aware to care their health
Protect from diseases
Institution 2
Responsibility
Activity
Agricultural office
To teach about agricultural technology
Increase agricultural productivity
Institution 3
Responsibility
Activity
Kebele Name
Police office
To prevent any complain
Keep peace and security
GEZESO
Institution 1
Responsibility
Activity
Agriculture office
Extension of agricultural technology
To increase crop and livestock productivity
Institution 2
Responsibility
Activity
Health office
For health extension
To prevent disease
Institution 3
Responsibility
Activity
School
To teach the community
To create educated man power
National Disaster Risk
Management Comission (NDRMC)
Friday, July 21, 2017
Wereda BONKE
299
Page 7 of 15

Wereda Disaster
Risk Profile
Data_Collected_Date
March 2017
Region S.N.N.P
Zone GAMO GOFA
Selected Indicator
Community Awareness of Disaster Risk Management System and Actors
Kebele Name
GOBO BAKE
Institution 1
Responsibility
Activity
Health extension
Aware to car their health
Protect from disease
Institution 2
Responsibility
Activity
Agriculture office
Aware about agricultural technologies
Increase crop and livestock productivity
Institution 3
Responsibility
Activity
Kebele Name
School
Teach the community
To create educated man power
GORATE
Institution 1
Responsibility
Activity
Agricultural office
To provide technology extension
To increase the productivity of crops and livestock
Institution 2
Responsibility
Activity
Health extension
To have healthy community
To decrease disease
Institution 3
Responsibility
Activity
School
To teach the community
To create educated man power
National Disaster Risk
Management Comission (NDRMC)
Friday, July 21, 2017
Wereda BONKE
300
Page 8 of 15

Wereda Disaster
Risk Profile
Data_Collected_Date
March 2017
Region S.N.N.P
Zone GAMO GOFA
Selected Indicator
Community Awareness of Disaster Risk Management System and Actors
Kebele Name
KACHA KASHISO
Institution 1
Responsibility
Activity
Agriculture office
Extension of new technologies
To increase crop and livestock productivity
Institution 2
Responsibility
Activity
Health extension
Awareness creation about health
To prevent disease
Institution 3
Responsibility
Activity
Kebele Name
Police office
To prevent any complain
To keep peace and security
KALIBO LAKA
Institution 1
Responsibility
Activity
Agricultural office
Extension of agricultural technology
Increase crop and livestock productivity
Institution 2
Responsibility
Activity
Health extension
Awareness creation about health
To prevent disease
Institution 3
Responsibility
Activity
Police office
To prevent any complain in the area
To keep peace and security
National Disaster Risk
Management Comission (NDRMC)
Friday, July 21, 2017
Wereda BONKE
301
Page 9 of 15
Wereda Disaster
Risk Profile
Data_Collected_Date
March 2017
Region S.N.N.P
Zone GAMO GOFA
Selected Indicator
Community Awareness of Disaster Risk Management System and Actors
Kebele Name
KALO GAGULA
Institution 1
Responsibility
Activity
Agriculture office
To extent technology
To increase agricultural productivity
Institution 2
Responsibility
Activity
Health extension
To aware about health
To protect from disease
Institution 3
Responsibility
Activity
School
To tech the community
To create educated man power
Institution 1
Responsibility
Activity
Health extension
Awareness creation about health
To protect from disease
Institution 2
Responsibility
Activity
Agricultural office
Extension of agricultural technology
To increase agricultural productivity
Institution 3
Responsibility
Activity
Kebele Name
School
To tech the community
To create educated man power
KAMELE BARIE ORO
National Disaster Risk
Management Comission (NDRMC)
Friday, July 21, 2017
Wereda BONKE
302
Page 10 of 15

Wereda Disaster
Risk Profile
Data_Collected_Date
March 2017
Region S.N.N.P
Selected Indicator
Zone GAMO GOFA
Community Awareness of Disaster Risk Management System and Actors
Institution 1
Responsibility
Activity
Agriculture office
Extension of technology
To increase agricultural productivity
Institution 2
Responsibility
Activity
Health office
To keep health care
To prevent disease
Institution 3
Responsibility
Activity
Kebele Name
Police office
To prevent complain
To keep peace and security
KETELE
Institution 1
Responsibility
Activity
Agricultural office
Agricultural technology extension
To increase crop and livestock production
Institution 2
Responsibility
Activity
Health extension
Awareness creation about health
To decrease disease
Institution 3
Responsibility
Activity
Kebele Name
Police office
To prevent any complain
Keep peace and security
KOLE KANCHAME
National Disaster Risk
Management Comission (NDRMC)
Friday, July 21, 2017
Wereda BONKE
303
Page 11 of 15
Wereda Disaster
Risk Profile
Data_Collected_Date
March 2017
Region S.N.N.P
Selected Indicator
Zone GAMO GOFA
Community Awareness of Disaster Risk Management System and Actors
Institution 1
Responsibility
Activity
Health office
To protect the community health
To decrease disease
Institution 2
Responsibility
Activity
Agriculture office
Extension of agricultural technology
To increase crop and livestock productivity
Institution 3
Responsibility
Activity
Kebele Name
School
To teach the community
To create educated manpower
KOLE ZALE
Institution 1
Responsibility
Activity
Agriculture office
To protect the community health
To decrease disease
Institution 2
Responsibility
Activity
Health extension
Extension of agricultural technology
To increase productivity of crop and livestock
Institution 3
Responsibility
Activity
Kebele Name
Police office
To prevent complains
To keep peace and security
KOSHALE
National Disaster Risk
Management Comission (NDRMC)
Friday, July 21, 2017
Wereda BONKE
304
Page 12 of 15

Wereda Disaster
Risk Profile
Data_Collected_Date
March 2017
Region S.N.N.P
Selected Indicator
Zone GAMO GOFA
Community Awareness of Disaster Risk Management System and Actors
Institution 1
Responsibility
Activity
Health extension
Aware to care their health
Protect from disease
Institution 2
Responsibility
Activity
Agriculture office
To educate about agricultural technology
Increase crop and livestock productivity
Institution 3
Responsibility
Activity
Kebele Name
Police office
To prevent any complain in the area
Keep peace and security
KOYRA MUKULA
Institution 1
Responsibility
Activity
Health extension
Awareness creation about health issues.
Prevent from disease
Institution 2
Responsibility
Activity
Agricultural office
Extension of agricultural technology
Increase crop and livestock productivity
Institution 3
Responsibility
Activity
Kebele Name
School
To teach the community
To create educated man power
YELA
National Disaster Risk
Management Comission (NDRMC)
Friday, July 21, 2017
Wereda BONKE
305
Page 13 of 15

Wereda Disaster
Risk Profile
Data_Collected_Date
March 2017
Region S.N.N.P
Selected Indicator
Zone GAMO GOFA
Community Awareness of Disaster Risk Management System and Actors
Institution 1
Responsibility
Activity
Agriculture office
Provision of agricultural extension services
To increase productivity
Institution 2
Responsibility
Activity
Health extension
Awareness creation about health issues
To protect from disease
Institution 3
Responsibility
Activity
Kebele Name
Police office
To prevent from any complains
To keep peace and security
ZAZIE
Institution 1
Responsibility
Activity
Agricultural office
Extension of agricultural services
To increase crop and livestock productivity
Institution 2
Responsibility
Activity
Health office
Provision of health extension services
To prevent disease
Institution 3
Responsibility
Activity
Kebele Name
School
To teach the community
To create educated manpower
ZEGA
National Disaster Risk
Management Comission (NDRMC)
Friday, July 21, 2017
Wereda BONKE
306
Page 14 of 15
Wereda Disaster
Risk Profile
Data_Collected_Date
March 2017
Region S.N.N.P
Selected Indicator
Zone GAMO GOFA
Community Awareness of Disaster Risk Management System and Actors
Institution 1
Responsibility
Activity
Health extension
Aware to care their health
Protect from diseases
Institution 2
Responsibility
Activity
Agricultural office
To aware about agricultural technologies
Increase crop and livestock production
Institution 3
Responsibility
Activity
School
To teach the community
To make the community educated
National Disaster Risk
Management Comission (NDRMC)
Friday, July 21, 2017
Wereda BONKE
307
Page 15 of 15
Wereda Disaster
Risk Profile
National Disaster Risk Management
Commission (NDRMC)
Data_Collected_Date
March 2017
Friday, July 21, 2017
Region S.N.N.P
Zone GAMO GOFA
Wereda BONKE
Selected Indicator
Community Perception of DRM System and Actors - Perception of the community on the effectiveness of DRM
system in helping them to prevent, cope and recover from disasters
KebeleName
Prevention
Coping
Recovery
Overall_Effectiveness
ZEGA
FADELE
GERIBANISHA GALO
GERIBANISA KARICHE
Health sector is partially
effective through creating
awareness in sanitation and
hygiene, Agricultural office
also partially effective and
improved seed.
Partially effective, they
teach how to protect from
disaster.
Effective, by creating
awareness in health
extension but, police office
and others are partially
effective.
Partially effective, because
they use soil and water
conservation and prevent
human and animal diseases.
All sectors are partially
effective in coping the risk
of food gap.
Partially effective,
sometimes there is relief
response, but it is not
enough.
Partially effective by giving
drugs. The response is not
effective in agricultural
office.
Partially effective, because
in awareness creation to
children death become
decreased, and there is
access of improved seeds
and animals.
They are partially
effective in vaccination,
improved seed variety,
and Aware the
community to save the
money for the future
use.
Not effective, because
there is no sufficient
activity to recover from
disaster.
Partially effective, by
creating awareness to
disaster response.
Partially effective,
however, the
effectiveness is not
enough to recover from
the disaster.
Lack of awareness, Climate
change and Lack of fund.
Not effective, because
there is no irrigation to crop
production, clean water and
improved seed varieties.
Limited number of experts
to create awareness,
Shortage of funds for
irrigation, for vaccination
and to store food.
Low access of fertilizer and
improved seeds variety and
animals due to high price
and poor road linkage.
308
Page 1 of 7

Wereda Disaster
Risk Profile
National Disaster Risk Management
Commission (NDRMC)
Data_Collected_Date
March 2017
Friday, July 21, 2017
Region S.N.N.P
Zone GAMO GOFA
Wereda BONKE
Selected Indicator
Community Perception of DRM System and Actors - Perception of the community on the effectiveness of DRM
system in helping them to prevent, cope and recover from disasters
KebeleName
ZAZIE
GORATE
GARIBANISA SOROGE
KOLE KANCHAME
KOLE ZALE
Prevention
In agricultural center only
animal health is effective,
but in an other activities, it
is not effective.
Partially effective, because
they tried to create
awareness to prevent
disaster in their experience.
In health extension services
death of children is
decreased. In Agricultural
office except climate change
the office is effective.
Partially effective, because
there is use of new varieties
of seed and water
conservation, and in
prevention of human and
livestock diseases
Partially effective, because
they used new seed
varieties, water conservation
and prevent human and
livestock disease.
Coping
Partially effective, because
there is some responses like
vaccination, but, It has its
own limitation.
Not effective, because
there is no relief response.
Partially effective, the
number of death is
decreased, conflict
decreased. There is
response and relief works.
Partially effective, there is
awareness creation about
health, child care, Hygiene,
access of improved seeds,
peace and security.
Partially effective, through
awareness creation about
health, hygiene, and
improved seeds.
Recovery
Not effective
Overall_Effectiveness
Not effective
Not effective, because
they couldn t monitor
their work to recover
from disaster.
Partially effective in
recovery activities.
Not effective, because
there is a gap with in
vaccination, relief works
and in teaching activities.
Low access of both crop and
animal varieties due to high
price and shortage of water
result in low productivity.
Partially effective, but,
it is not enough to
recover from disaster.
Partially effective,
however it is not enough
to recover from disaster.
Limited access of improved
seeds and livestock s due to
their high price. Shortage of
health expert due to the
community wide area
coverage.
Limited access of improved
crops and livestock s , due
to their high price. Shortage
of health professionals for
the community.
309
Page 2 of 7

Wereda Disaster
Risk Profile
National Disaster Risk Management
Commission (NDRMC)
Data_Collected_Date
March 2017
Friday, July 21, 2017
Region S.N.N.P
Zone GAMO GOFA
Wereda BONKE
Selected Indicator
Community Perception of DRM System and Actors - Perception of the community on the effectiveness of DRM
system in helping them to prevent, cope and recover from disasters
KebeleName
Prevention
Coping
Recovery
Overall_Effectiveness
YELA
KOYRA MUKULA
KETELE
FISHITO
Partially effective, because
they took different measures
like, prevention of crop
disease, use of new
technology to prevent human
disease, Protect conflict.
Partially effective, they tried
to prevent from disaster and
create awareness.
Partially effective, because
each organization tried to
teach how to prevent
disaster in their experience.
Partially effective, in
awareness creation about
sanitation and hygiene,
Agricultural office also
support farmers and tech
them.
Effective, through
awareness creation about
soil and water conservation,
health, sanitation and
decrease women and
children death.
Partially effective, because
they got relief response,
vaccination and medical
treatment.
Partially effective, there is
relief response, vaccination
and teaching of the
community to get educated
man power.
All sectors are partially
effective, in coping of food
gap problem.
Partially effective, how
ever, it is not enough to
recover from disaster
fully.
Partially effective,
because it is not enough
to recover from disaster.
Partially effective, but,
the response is nor
enough to recover from
disaster.
They are partially
effective, in vaccination
support, in provision of
improved seed varieties.
Shortage of health extension
experts, Topography,
Limited access of pesticides
due to high price of it.
The response is not
effective.
Limited access of improved
seeds and fertilizer supply,
lack of awareness, limited
attention to peace and
security.
Not effective, there is lack
of irrigation, lack of soil
conservation, lack of forest
management, and lack of
health expert.
310
Page 3 of 7

Wereda Disaster
Risk Profile
National Disaster Risk Management
Commission (NDRMC)
Data_Collected_Date
March 2017
Friday, July 21, 2017
Region S.N.N.P
Zone GAMO GOFA
Wereda BONKE
Selected Indicator
Community Perception of DRM System and Actors - Perception of the community on the effectiveness of DRM
system in helping them to prevent, cope and recover from disasters
KebeleName
DURIBE
ALGUDA
KACHA KASHISO
CHOSHA
KAMELE BARIE ORO
Prevention
Partially effective, because
they tried to help how to
prevent disaster, but, there
is a gap in awareness
creation.
Partially effective, through
awareness creation on health
issues and how to use new
technology. but, in school,
there is a gap in awareness
creation.
Partially effective, because
they took different measures
for crop disease in awareness
creation.
Partially effective, because
they took measures like
prevention of crop, livestock
and human disease, and
protection from conflict.
Effective, they tried to
prevent disaster in
awareness creation.
Coping
Partially effective, because
there is a response like
vaccination support, but it
has its own limitation.
Partially effective, the
response is nor enough to
cope disaster.
Partially effective
Partially effective, because
they are effective in
awareness creation about
health, sanitation. Access
of improved seeds and
pesticide.
Partially effective, but it is
not enough response.
311
Recovery
Not effective
Overall_Effectiveness
Shortage of water, lack of
irrigation, lack of awareness
Partially effective,
because the response is
not sufficient for
recovery.
Lack of awareness in health
issues. High price of
improved varieties and
pesticides.
Partially effective
Partially effective, how
ever it is not enough for
recovery.
Not effective, because the
it is not enough for fully
recovery.
Shortage of agriculture and
health experts, Limited
access of pesticides and
improved varieties.
Partially effective, there
is a gap in recovery
works.
Lack of soil and water
conservation, Irrigation
system, Vaccination, and
improved seeds.
Page 4 of 7

Wereda Disaster
Risk Profile
National Disaster Risk Management
Commission (NDRMC)
Data_Collected_Date
March 2017
Friday, July 21, 2017
Region S.N.N.P
Zone GAMO GOFA
Wereda BONKE
Selected Indicator
Community Perception of DRM System and Actors - Perception of the community on the effectiveness of DRM
system in helping them to prevent, cope and recover from disasters
KebeleName
Prevention
Coping
Recovery
Overall_Effectiveness
KALIBO LAKA
GEZESO
DENBILE OSA
DESHKELE
Partially effective, because
they tried to aware how to
prevent disaster in their
knowledge.
Agriculture office is
effective, in soil and water
conservation and a
forestation works, but they
are not effective in response.
Partially effective, because
their effort is not sufficient
to cope disaster.
Partially effective, especially
agriculture office tried to
prevent disaster and health
extension tried to create
awareness.
Partially effective, but the
response of all institutions
are not enough to cope
from disaster.
Partially effective, because
there is response like
vaccination and medical
treatment, but in response
they are not effective.
Partially effective, response
like vaccination is not
enough to cope the impact.
Partially effective, in use of
family planning, and
medical treatment.
Partially effective,
because they teach how
to recover from disaster.
Partially effective
Lack of modern irrigation,
lack of clean water, lack of
road construction and lack
of health service.
Lack of fund for the
response of drought.
Not effective, the
response is not sufficient
for recovery from
disaster.
Partially effective, but
the response is not
enough for recovery.
Lack of awareness how to
plant and produce crop,
Management problem in
school learning and teaching
process, keeping of health
problem.
Limited number of health
experts and lack of funding
312
Page 5 of 7

Wereda Disaster
Risk Profile
National Disaster Risk Management
Commission (NDRMC)
Data_Collected_Date
March 2017
Friday, July 21, 2017
Region S.N.N.P
Zone GAMO GOFA
Wereda BONKE
Selected Indicator
Community Perception of DRM System and Actors - Perception of the community on the effectiveness of DRM
system in helping them to prevent, cope and recover from disasters
KebeleName
KALO GAGULA
GERASE ZALA
KALO GAGULA
DEMBILE OTORA
KOSHALE
Prevention
Partially effective,
agriculture office tried to
prevent disaster, health
extension also tried to aware
about health issues and also
police office did better.
Partially effective, in
agriculture office, they tried
to prevent disaster and also
in health extension there was
awareness creation about
health issues.
Effective, in extension of
agricultural technology,
health extension and
education of children.
Partially effective, they tried
to prevent disaster in
extension services.
Partially effective, health
extension tried to aware to
keep sanitation and hygiene,
Agricultural office tried to
aware how to use
agricultural technology.
Coping
Partially effective, in use of
family planning, and
children vaccination.
Partially effective, in family
planning, vaccination of
children, Use of improved
seed.
Not effective, because
there is no response and
relief work to cope.
Partially effective, in
vaccination of children
Partially effective, because
it helped them to cope
their food gap.
313
Recovery
Partially effective, but,
the response is not
enough for recovery from
disaster.
Overall_Effectiveness
A gap in relief response,
limited number of experts in
agriculture office, and
health office.
Partially effective, but
the response is not
enough for recovery from
disaster.
Limited number of health
experts, Lack of fund
Not effective, because
the response is not
enough to recovery from
disaster.
Partially effective, bit
the response is not
enough.
Partially effective,
because there was
vaccination of livestock
and medical treatment
services, and also there
was a relief support.
Lack of fund to use
improved agricultural
inputs, and pesticides.
Limited number of health
experts and lack of road
access.
Lack of awareness,
Temporary response trend,
Limited practice of
technology extension.
Page 6 of 7

Wereda Disaster
Risk Profile
National Disaster Risk Management
Commission (NDRMC)
Data_Collected_Date
March 2017
Friday, July 21, 2017
Region S.N.N.P
Zone GAMO GOFA
Wereda BONKE
Selected Indicator
Community Perception of DRM System and Actors - Perception of the community on the effectiveness of DRM
system in helping them to prevent, cope and recover from disasters
KebeleName
Prevention
Coping
Recovery
Overall_Effectiveness
GOBO BAKE
DIMELE FUSE
Partially effective, all
sectors tried to create
awareness about sanitation,
use of technology and in
other issues.
Partially effective,
agricultural office tried to
extent technologies, health
extension tried to decrease
disease and there was peace
and security keeping.
Partially effective, in all
sectors activity.
Partially effective, It is not
fully effective to cope in
response.
There is a support of
vaccination of livestock
and medical treatment
of children.
Partially effective, their
activities are not enough
for recovery from
disaster, due to lack of
awareness.
Topography, Climate
change, Limited number of
health experts, Lack of
fund.
Lack of awareness creation,
irrigation and relief
responses.
314
Page 7 of 7
Data_Collected_Date
Region S.N.N.P
March 2017
Zone GAMO GOFA
Wereda BONKE
Friday, July 21, 2017
Selected Indicator
Major Public Interventions Desired - Percentage of households by type of
intervention desired
Major public interventions desired by the community
Degree of Importance for the community
1st
Access to markets
0.78
Access to roads
4.39
Agricultural inputs (fertilizer, improved seeds, etc.)
7.24
Better job
20.93
Cash transfers/social assistance
7.49
Enhance access to schools / School feeding for children
0.26
Food-for-work activities
3.88
Medical assistance / access to health facilities
0.26
Micro-credit programmes
0.26
Other
0.52
Rental subsidies
1.55
School fees for children
1.03
Subsidized food
0.26
Subsidized health care
3.62
Supplementary feeding for women and young children
0.78
315
Page 1 of 2

Data_Collected_Date
Region S.N.N.P
March 2017
Zone GAMO GOFA
Wereda BONKE
Friday, July 21, 2017
Selected Indicator
Major Public Interventions Desired - Percentage of households by type of
intervention desired
Major public interventions desired by the community
Degree of Importance for the community
Food aid
1st
43.93
316
Page 2 of 2
WDRP Indicators
Other Community Characteristics
317
Wereda Disaster
Risk Profile
Data_Collected_Date
March 2017
Region S.N.N.P
Zone GAMO GOFA
Selected Indicator
Capacity: Community Based Organizations in the Wereda
Name_Of_Organization
Est._Year
Formal/Informal
Kebele Name ALGUDA
Youth association
2006
Formal
Edir
1981
Informal
Ekub
Kebele Name CHOSHA
Women association
1981
2005
Informal
Formal
farmer association
1988
Formal
Ekub
Kebele Name
Edir
DEMBILE OTORA
1984
1990
Informal
Informal
Ekub
2000
Informal
Farmer association
Kebele Name DENBILE OSA
Ekub
2001
1968
Formal
Informal
Edir
Kebele Name
DESHKELE
1984
Informal
National Disaster Risk Management
Commission (NDRMC)
Friday, July 21, 2017
Wereda BONKE
Type of Members
Youth
All
All
Farmers
Farmers
Farmers
All
All
Farmers
All
All
Activity
For saving and credit
For social interaction
For saving and social activities
To generate income in co-operation
To generate income
To save money
For social interaction
For saving and social activities
For saving and income generation
For credit and saving
For social interaction
318
Page 1 of 8
Wereda Disaster
Risk Profile
Data_Collected_Date
March 2017
National Disaster Risk Management
Commission (NDRMC)
Friday, July 21, 2017
Region S.N.N.P
Zone GAMO GOFA
Selected Indicator
Capacity: Community Based Organizations in the Wereda
Name_Of_Organization
Est._Year
Formal/Informal
Wereda BONKE
Type of Members
Activity
Youth association
Women association
Ekub
Edir
Kebele Name
Edir
DIMELE FUSE
Ekub
Women association
Youth association
Kebele Name DURIBE
Ekub
Edir
Youth
Kebele Name FADELE
Farmer association
Edir
2008
2008
1991
2000
1980
1975
2008
1988
1972
2006
2007
1990
Formal
Formal
Informal
Informal
Youth
Women
All
All
Informal
Informal
Formal
Formal
All
All
Women
Youth group
Informal
Informal
Formal
All
All
Youth
Formal
Informal
Farmers
All
319
For saving and job opportunity
For saving
For saving money
For saving and social interaction
For social interaction
For saving
For saving
For labor work and for saving
To help each other
For social interaction
For income generation
To generate income
For social interaction
Page 2 of 8
Wereda Disaster
Risk Profile
Data_Collected_Date
March 2017
Region S.N.N.P
Zone GAMO GOFA
Selected Indicator
Capacity: Community Based Organizations in the Wereda
Name_Of_Organization
Est._Year
Formal/Informal
National Disaster Risk Management
Commission (NDRMC)
Friday, July 21, 2017
Wereda BONKE
Type of Members
Activity
Ekub
Kebele Name
Edir
FISHITO
1987
2001
Ekub
Kebele Name
Edir
1995
GARIBANISA SOROGE
1982
Ekub
1970
Youth groups
Kebele Name GERASE ZALA
Farmers association
2005
2005
Edir
1988
Ekub
Kebele Name
Ekub
1980
GERIBANISA KARICHE
1970
Edir
Kebele Name
GERIBANISHA GALO
1967
Informal
Informal
Informal
Informal
Informal
Formal
Formal
Informal
Informal
Informal
Informal
All
To save money
Farmers
Farmers
For social interaction
For saving purpose
Youth, Elder, Women
Youth, Elder, Women
Youth
For social interaction
For Saving and credit
For Saving and credit
Farmers
Farmers
Farmers
To generate income
For social interaction
To save money
All
For saving
All
For social affairs
320
Page 3 of 8
Wereda Disaster
Risk Profile
Data_Collected_Date
March 2017
National Disaster Risk Management
Commission (NDRMC)
Friday, July 21, 2017
Region S.N.N.P
Zone GAMO GOFA
Selected Indicator
Capacity: Community Based Organizations in the Wereda
Name_Of_Organization
Est._Year
Formal/Informal
Wereda BONKE
Type of Members
Activity
Edir
Ekub
Youth co-operation
Kebele Name GEZESO
Youth association
Farmers association
Fruit sale association
Edir
Ekub
Kebele Name
Edir
GOBO BAKE
Ekub
Kebele Name
Ekub
GORATE
Edir
Youth Association
1996
2001
2005
2005
2007
2005
1997
1997
1993
1983
1985
1985
2006
Informal
Informal
Formal
Farmers
Farmers
Youth
Formal
Formal
Formal
Informal
Informal
Youth
All farmers
Farmers
All
All
Informal
Informal
Farmers
Farmers
Informal
Informal
Formal
All
All
Youth
321
For social interction
Credit and saving
Credit and saving
For income generation
For saving and credit
For income generation
To help each other
For saving
For social interaction
For saving purpose
For saving and credit
For social affairs
For income generation
Page 4 of 8
Wereda Disaster
Risk Profile
Data_Collected_Date
March 2017
National Disaster Risk Management
Commission (NDRMC)
Friday, July 21, 2017
Region S.N.N.P
Zone GAMO GOFA
Selected Indicator
Capacity: Community Based Organizations in the Wereda
Name_Of_Organization
Est._Year
Formal/Informal
Wereda BONKE
Type of Members
Activity
Kebele Name KACHA KASHISO
Youth association
Edir
Ekub
Kebele Name KALIBO LAKA
Youth association
Ekub
Edir
Kebele Name
Edir
KALO GAGULA
Ekub
Youth group
Youth group
Edir
Ekub
Kebele Name
KAMELE BARIE ORO
2006
1983
1983
2006
1970
1988
1980
1975
2006
2005
1993
2006
Formal
Informal
All
Informal
All
Formal
Informal
Informal
Youth
All
All
Informal
Informal
Formal
Formal
Informal
Informal
All
All
Youth
Youth
All
All
322
For income generation
For social interaction
For income generation
For income generation
For social interaction and for saving
For social interaction
For social interaction
For selling and for social activities
For saving
For credit and saving
For social interaction
For saving
Page 5 of 8
Wereda Disaster
Risk Profile
Data_Collected_Date
March 2017
National Disaster Risk Management
Commission (NDRMC)
Friday, July 21, 2017
Region S.N.N.P
Zone GAMO GOFA
Selected Indicator
Capacity: Community Based Organizations in the Wereda
Name_Of_Organization
Est._Year
Formal/Informal
Wereda BONKE
Type of Members
Activity
Farmers association
Youth association
Edir
Ekub
Kebele Name
Edir
KETELE
Ekub
Youth groups
Kebele Name KOLE KANCHAME
Youth association
Edir
Ekub
Kebele Name
Ekub
KOLE ZALE
Edir
farmer association
1999
2005
1995
1990
1995
1965
2006
2006
1980
1976
1998
1985
2007
Formal
Formal
Informal
Informal
Farmers
Youth
All
All
Informal
Informal
Formal
All
All
Youth
Formal
Informal
Informal
Youth
All
All
Informal
Informal
Formal
Farmers
Farmers
Farmers
323
For income generation
For income generation
For social interaction
For income generation
For social affairs
For saving and social affairs
For saving
For income generation
For social interaction
For saving and credit
For saving money
For social interaction
For income generation
Page 6 of 8
Wereda Disaster
Risk Profile
Data_Collected_Date
March 2017
National Disaster Risk Management
Commission (NDRMC)
Friday, July 21, 2017
Region S.N.N.P
Zone GAMO GOFA
Selected Indicator
Capacity: Community Based Organizations in the Wereda
Name_Of_Organization
Est._Year
Formal/Informal
Wereda BONKE
Type of Members
Activity
Kebele Name
Edir
Ekub
Kebele Name
KOSHALE
KOYRA MUKULA
Ekub
Edir
Youth association
Kebele Name YELA
Ekub
Edir
Farmetr Association
Kebele Name ZAZIE
Youth association
Ekub
Edir
1989 1976
2004
1962
1990
2006
2000
1985
2004
2006
1995
1987
Informal
Informal
Informal
Informal
Informal
---------
Informal
Informal
Formal
Formal
Informal
Informal
Farmers
Farmers
All
All
All
Youth
Farmers
Farmers
Farmers
Youth
Farmers
Farmers
For social interaction
For saving and credit
For credit and saving
For Saving
For Social interaction
For saving
To save money
For social interaction
To generate income and to save money
For saving and credit
To help each other
For social interaction
324
Page 7 of 8
Wereda Disaster
Risk Profile
Data_Collected_Date
March 2017
Region S.N.N.P
Zone GAMO GOFA
Selected Indicator
Capacity: Community Based Organizations in the Wereda
Name_Of_Organization
Est._Year
Formal/Informal
Kebele Name
Ekub
ZEGA
1991
Informal
Edir
1996
Informal
Women
2006
Formal
Youth
2006
Formal
National Disaster Risk Management
Commission (NDRMC)
Friday, July 21, 2017
Wereda BONKE
Type of Members
Farmers
Farmers
Farmers
Farmers
Activity
For saving purpose
For social interaction
For saving and credit purpose
For saving and for increasing of income
325
Page 8 of 8
Data_Collected_Date
Region
Zone
Wereda
Friday, July 21, 2017
Selected Indicator
Supporting Agencies against Disasters - Percentage of households by supporting
institutions to handle or recover from disaster damages
Supporting Agencies Against Disasters
Response_Percentage
326
Page 1 of 1
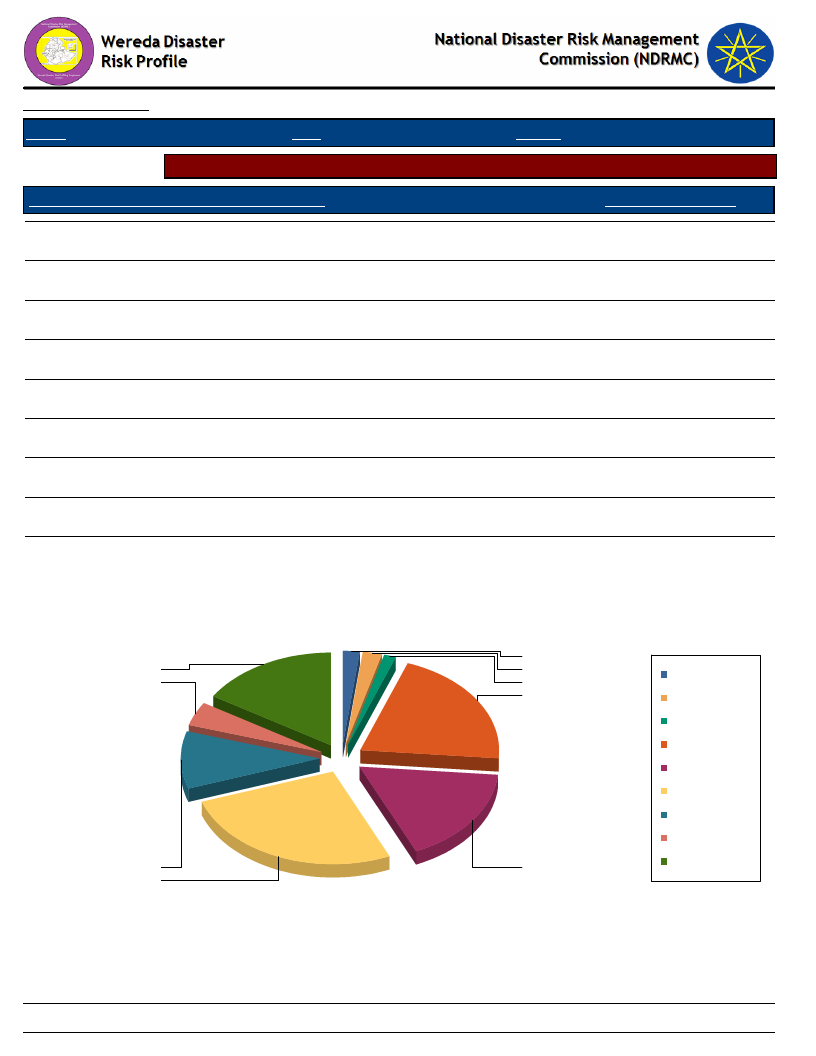
Data_Collected_Date
Region S.N.N.P
March 2017
Zone GAMO GOFA
Wereda BONKE
Friday, July 21, 2017
Selected Indicator
Types of support received by households during disasters
Type of Support Provided By Supporting Agencies
Response_Percentage
Emergency aid (food, water, shelter, etc.)
26.45
Capital for re-construction of house and property
20.97
New house
4.19
Access to loan for re-construction
2.26
Access to capital or loan for adaptation/protection measures
1.94
Assets such as livestock replenishment
1.29
Other
16.13
DK
16.77
NA
10.00
Type of Support Provided By Supporting Agencies
2
16
2
Access to capital or loan
for adaptation/protection
4
1
measures
21
Access to loan for
re-construction
Assets such as livestock
replenishment
Capital for
re-construction of house
and property
DK
Emergency aid (food,
water, shelter, etc.)
NA
New house
Other
10
17
26
327
Page 1 of 1
Wereda Disaster
Risk Profile
Data_Collected_Date
March 2017
National Disaster Risk Management
Commission (NDRMC)
Friday, July 21, 2017
Region S.N.N.P
Zone GAMO GOFA
Wereda BONKE
Selected Indicator
Government Actors in the Field of Disaster Risk Management - Government actors and their activities in the field
of Disaster Risk Managements
Government Institution
Wereda Administration Office
Activity
Vaccination
Description
Activity
Soil and water conservation
Description
Activity
Awareness creation
Description
Activity
Description
Early warning works
Government Institution
Wereda Agriculture Office
Activity
Awareness creation works
Description
Activity
Relief response
Description
Activity
Description
Activity
Description
Fodder supply
Construction of water
328
Page 1 of 2
Wereda Disaster
Risk Profile
Data_Collected_Date
March 2017
National Disaster Risk Management
Commission (NDRMC)
Friday, July 21, 2017
Region S.N.N.P
Zone GAMO GOFA
Wereda BONKE
Selected Indicator
Government Actors in the Field of Disaster Risk Management - Government actors and their activities in the field
of Disaster Risk Managements
Government Institution
Wereda Education Office
Activity
Report to concerned bodies like health and agriculture offices
Description
Activity
Awareness creation works
Description
Activity
Description
Activity
Description
Supply of drug, vaccination and food
Awareness creation on health care
329
Page 2 of 2
Data_Collected_Date
March 2017
Region S.N.N.P
Zone GAMO GOFA
Wereda BONKE
Selected
Indicator
Non-Government Actors in the Field of Disaster Risk Management - Non-government
actors and their activities in the field of Disaster Risk Management
Non Governmental Actors
in the Wereda
Activities
WASH
Constructing of water
Water sanitation and hygiene works
Hope 2020
Clean water construction
Friday, July 21, 2017
330
Page 1 of 1
Wereda Disaster Risk
Profile
Data_Collected_Date
March 2017
National Disaster Risk Management
Commission (NDRMC)
July 21, 2017
Region S.N.N.P
Selected Indicator:
Zone
GAMO GOFA
Interventions: Community Suggestions to Development Actors
Wereda BONKE
Kebele Name
Type Of Disaster 1
Early Warning Indicator
ALGUDA
Drought
By seeing sun
Type Of Disaster 3
Early Warning Indicator
Preparedness Measure
Store food for future time
Preparedness Measure
Type Of Disaster 2
Early Warning Indicator
Type Of Disaster 4
Early Warning Indicator
Preparedness Measure
Preparedness Measure
Kebele Name
Type Of Disaster 1
Early Warning Indicator
Preparedness Measure
Type Of Disaster 2
Early Warning Indicator
Preparedness Measure
YELA
Type Of Disaster 3
Early Warning Indicator
Preparedness Measure
Type Of Disaster 4
Early Warning Indicator
Preparedness Measure
331
Page 1 of 15

Region S.N.N.P
Selected Indicator:
Zone
GAMO GOFA
Interventions: Community Suggestions to Development Actors
Wereda BONKE
Kebele Name
Type Of Disaster 1
Early Warning Indicator
CHOSHA
Drought
Wind direction in left side
Type Of Disaster 3
Early Warning Indicator
Preparedness Measure
Store food for future use
Preparedness Measure
Type Of Disaster 2
Early Warning Indicator
Type Of Disaster 4
Early Warning Indicator
Preparedness Measure
Preparedness Measure
Kebele Name
Type Of Disaster 1
Early Warning Indicator
Preparedness Measure
Type Of Disaster 2
Early Warning Indicator
Preparedness Measure
DENBILE OSA
Drought
By seen of moon, Wind direction
Store food, produce short cycle crop
Livestock disease
By seen moon
Vaccination
Type Of Disaster 3
Early Warning Indicator
Preparedness Measure
Type Of Disaster 4
Early Warning Indicator
Preparedness Measure
332
Page 2 of 15

Region S.N.N.P
Selected Indicator:
Zone
GAMO GOFA
Interventions: Community Suggestions to Development Actors
Wereda BONKE
Kebele Name
Type Of Disaster 1
Early Warning Indicator
DEMBILE OTORA
Drought
Moon direction
Type Of Disaster 3
Early Warning Indicator
Preparedness Measure
Store food, Plant drought resistant crops
Preparedness Measure
Type Of Disaster 2
Early Warning Indicator
Type Of Disaster 4
Early Warning Indicator
Preparedness Measure
Preparedness Measure
Kebele Name
Type Of Disaster 1
Early Warning Indicator
Preparedness Measure
Type Of Disaster 2
Early Warning Indicator
Preparedness Measure
DESHKELE
Drought
Wind direction in left and raising of stars
direction
Saving of food and planting of drought resistant
crops
Type Of Disaster 3
Early Warning Indicator
Preparedness Measure
Type Of Disaster 4
Early Warning Indicator
Preparedness Measure
333
Page 3 of 15

Region S.N.N.P
Selected Indicator:
Zone
GAMO GOFA
Interventions: Community Suggestions to Development Actors
Wereda BONKE
Kebele Name
Type Of Disaster 1
Early Warning Indicator
DURIBE
Drought
Sunset and sunrise
Type Of Disaster 3
Early Warning Indicator
Preparedness Measure
Store food crops
Preparedness Measure
Type Of Disaster 2
Early Warning Indicator
Type Of Disaster 4
Early Warning Indicator
Preparedness Measure
Preparedness Measure
Kebele Name
Type Of Disaster 1
Early Warning Indicator
Preparedness Measure
Type Of Disaster 2
Early Warning Indicator
Preparedness Measure
FADELE
Drought
Wind direction
Plat drought resistance crops
Type Of Disaster 3
Early Warning Indicator
Preparedness Measure
Type Of Disaster 4
Early Warning Indicator
Preparedness Measure
334
Page 4 of 15

Region S.N.N.P
Selected Indicator:
Zone
GAMO GOFA
Interventions: Community Suggestions to Development Actors
Wereda BONKE
Kebele Name
Type Of Disaster 1
Early Warning Indicator
FISHITO
Drought
By seeing the moon
Type Of Disaster 3
Early Warning Indicator
Preparedness Measure
Type Of Disaster 2
Early Warning Indicator
Preparedness Measure
Change the time of sowing, Saving of food for
future time.
Livestock disease
By seeing stars
Destocking, and Give a great care for livestock s
Preparedness Measure
Type Of Disaster 4
Early Warning Indicator
Preparedness Measure
Kebele Name
Type Of Disaster 1
Early Warning Indicator
Preparedness Measure
Type Of Disaster 2
Early Warning Indicator
Preparedness Measure
GARIBANISA SOROGE
Drought
Rise of sun
Store food and save money for next use.
Type Of Disaster 3
Early Warning Indicator
Preparedness Measure
Type Of Disaster 4
Early Warning Indicator
Preparedness Measure
335
Page 5 of 15

Region S.N.N.P
Selected Indicator:
Zone
GAMO GOFA
Interventions: Community Suggestions to Development Actors
Wereda BONKE
Kebele Name
Type Of Disaster 1
Early Warning Indicator
GERASE ZALA
Drought
Sun direction
Type Of Disaster 3
Early Warning Indicator
Preparedness Measure
Planting of short cycle crops
Preparedness Measure
Type Of Disaster 2
Early Warning Indicator
Type Of Disaster 4
Early Warning Indicator
Preparedness Measure
Preparedness Measure
Kebele Name
Type Of Disaster 1
Early Warning Indicator
Preparedness Measure
Type Of Disaster 2
Early Warning Indicator
Preparedness Measure
GERIBANISA KARICHE
Drought
Star rise at the left side
Store human feed and save the resource for the
future use.
Type Of Disaster 3
Early Warning Indicator
Preparedness Measure
Type Of Disaster 4
Early Warning Indicator
Preparedness Measure
336
Page 6 of 15

Region S.N.N.P
Selected Indicator:
Zone
GAMO GOFA
Interventions: Community Suggestions to Development Actors
Wereda BONKE
Kebele Name
Type Of Disaster 1
Early Warning Indicator
GERIBANISHA GALO
Drought
In the rise of star
Type Of Disaster 3
Early Warning Indicator
Preparedness Measure
Announce to local leaders
Preparedness Measure
Type Of Disaster 2
Early Warning Indicator
Preparedness Measure
Livestock diseases
In rainbow
Praying with elders
Type Of Disaster 4
Early Warning Indicator
Preparedness Measure
Kebele Name
Type Of Disaster 1
Early Warning Indicator
Preparedness Measure
Type Of Disaster 2
Early Warning Indicator
Preparedness Measure
GEZESO
Drought
Seeing of Bambo tree, and Cloud
Saving of crops, Collect forage
Type Of Disaster 3
Early Warning Indicator
Preparedness Measure
Type Of Disaster 4
Early Warning Indicator
Preparedness Measure
337
Page 7 of 15

Region S.N.N.P
Selected Indicator:
Zone
GAMO GOFA
Interventions: Community Suggestions to Development Actors
Wereda BONKE
Kebele Name
Type Of Disaster 1
Early Warning Indicator
GOBO BAKE
Drought
By seeing shadow of mountain
Type Of Disaster 3
Early Warning Indicator
Preparedness Measure
Planting of short cycle crops
Preparedness Measure
Type Of Disaster 2
Early Warning Indicator
Type Of Disaster 4
Early Warning Indicator
Preparedness Measure
Preparedness Measure
Kebele Name
Type Of Disaster 1
Early Warning Indicator
Preparedness Measure
Type Of Disaster 2
Early Warning Indicator
Preparedness Measure
GORATE
Drought
The rise of sun
Destocking, Save and store food crops
Type Of Disaster 3
Early Warning Indicator
Preparedness Measure
Type Of Disaster 4
Early Warning Indicator
Preparedness Measure
338
Page 8 of 15

Region S.N.N.P
Selected Indicator:
Zone
GAMO GOFA
Interventions: Community Suggestions to Development Actors
Wereda BONKE
Kebele Name
Type Of Disaster 1
Early Warning Indicator
Preparedness Measure
KALIBO LAKA
Drought
Wind direction
Saving of food and animal pasture
Type Of Disaster 3
Early Warning Indicator
Preparedness Measure
Land slide
Wind direction
Cut off drain
Type Of Disaster 2
Early Warning Indicator
Preparedness Measure
Crop disease
Rotation of moon
Use of pesticides
Type Of Disaster 4
Early Warning Indicator
Preparedness Measure
Kebele Name
Type Of Disaster 1
Early Warning Indicator
Preparedness Measure
Type Of Disaster 2
Early Warning Indicator
Preparedness Measure
KALO GAGULA
Drought
Rising of moon
Saving of food
Heavy rain
Rising of moon
Saving of food, Soil and water conservation
Type Of Disaster 3
Early Warning Indicator
Preparedness Measure
Type Of Disaster 4
Early Warning Indicator
Preparedness Measure
339
Page 9 of 15

Region S.N.N.P
Selected Indicator:
Zone
GAMO GOFA
Interventions: Community Suggestions to Development Actors
Wereda BONKE
Kebele Name
Type Of Disaster 1
Early Warning Indicator
KAMELE BARIE ORO
Drought
Sunset and sunrise
Type Of Disaster 3
Early Warning Indicator
Preparedness Measure
Saving of food
Preparedness Measure
Type Of Disaster 2
Early Warning Indicator
Type Of Disaster 4
Early Warning Indicator
Preparedness Measure
Preparedness Measure
Kebele Name
Type Of Disaster 1
Early Warning Indicator
Preparedness Measure
Type Of Disaster 2
Early Warning Indicator
Preparedness Measure
DIMELE FUSE
Livestock disease
Wind direction
Vaccination, Use of traditional medicine
Drought
By the moon
Saving of food for future use
Type Of Disaster 3
Early Warning Indicator
Preparedness Measure
Type Of Disaster 4
Early Warning Indicator
Preparedness Measure
340
Page 10 of 15

Region S.N.N.P
Selected Indicator:
Zone
GAMO GOFA
Interventions: Community Suggestions to Development Actors
Wereda BONKE
Kebele Name
Type Of Disaster 1
Early Warning Indicator
KACHA KASHISO
Drought
Wind direction in left
Type Of Disaster 3
Early Warning Indicator
Preparedness Measure
Planting of short cycle crops
Preparedness Measure
Type Of Disaster 2
Early Warning Indicator
Type Of Disaster 4
Early Warning Indicator
Preparedness Measure
Preparedness Measure
Kebele Name
Type Of Disaster 1
Early Warning Indicator
Preparedness Measure
Type Of Disaster 2
Early Warning Indicator
Preparedness Measure
KETELE
Drought
Wind direction
To store food crops
Shortage of rain
Direction of sun
Contact cultural leader
Type Of Disaster 3
Early Warning Indicator
Preparedness Measure
Type Of Disaster 4
Early Warning Indicator
Preparedness Measure
341
Page 11 of 15

Region S.N.N.P
Selected Indicator:
Zone
GAMO GOFA
Interventions: Community Suggestions to Development Actors
Wereda BONKE
Kebele Name
Type Of Disaster 1
Early Warning Indicator
KOLE KANCHAME
Drought, Shortage of rain
Rising of sun and Wind direction
Type Of Disaster 3
Early Warning Indicator
Preparedness Measure
Planting drought resistant crops
Preparedness Measure
Type Of Disaster 2
Early Warning Indicator
Type Of Disaster 4
Early Warning Indicator
Preparedness Measure
Preparedness Measure
Kebele Name
Type Of Disaster 1
Early Warning Indicator
Preparedness Measure
Type Of Disaster 2
Early Warning Indicator
Preparedness Measure
KOLE ZALE
Animal disease
In traditional way
Vaccination
Drought
By wind direction
Sow root crops
Type Of Disaster 3
Early Warning Indicator
Preparedness Measure
Type Of Disaster 4
Early Warning Indicator
Preparedness Measure
342
Page 12 of 15

Region S.N.N.P
Selected Indicator:
Zone
GAMO GOFA
Interventions: Community Suggestions to Development Actors
Wereda BONKE
Kebele Name
Type Of Disaster 1
Early Warning Indicator
KOSHALE
Drought
In sunrise and moon
Type Of Disaster 3
Early Warning Indicator
Preparedness Measure
Type Of Disaster 2
Early Warning Indicator
Preparedness Measure
Exchange livestock with food, Migrate their
livestock into better place
Livestock and Human disease
Shooting of star
Contact local leader to pray
Preparedness Measure
Type Of Disaster 4
Early Warning Indicator
Preparedness Measure
Kebele Name
Type Of Disaster 1
Early Warning Indicator
Preparedness Measure
Type Of Disaster 2
Early Warning Indicator
Preparedness Measure
KOYRA MUKULA
Drought
Rise of moon
Destocking to buy food crops
Crop disease
Sunset and Sunrise
Use of pesticides
Type Of Disaster 3
Early Warning Indicator
Preparedness Measure
Type Of Disaster 4
Early Warning Indicator
Preparedness Measure
343
Page 13 of 15
Region S.N.N.P
Selected Indicator:
Zone
GAMO GOFA
Interventions: Community Suggestions to Development Actors
Wereda BONKE
Kebele Name
Type Of Disaster 1
Early Warning Indicator
KALO GAGULA
Drought
Rise of sun
Type Of Disaster 3
Early Warning Indicator
Preparedness Measure
Store food for future use.
Preparedness Measure
Type Of Disaster 2
Early Warning Indicator
Type Of Disaster 4
Early Warning Indicator
Preparedness Measure
Preparedness Measure
Kebele Name
Type Of Disaster 1
Early Warning Indicator
Preparedness Measure
Type Of Disaster 2
Early Warning Indicator
Preparedness Measure
ZEGA
Drought
Raising of stars
Planting of drought resistant crops
Type Of Disaster 3
Early Warning Indicator
Preparedness Measure
Type Of Disaster 4
Early Warning Indicator
Preparedness Measure
344
Page 14 of 15
Region S.N.N.P
Selected Indicator:
Zone
GAMO GOFA
Interventions: Community Suggestions to Development Actors
Wereda BONKE
Kebele Name
Type Of Disaster 1
Early Warning Indicator
ZAZIE
Drought
The rise of sun in left side
Type Of Disaster 3
Early Warning Indicator
Preparedness Measure
Saving the resource for future use in dry season.
Preparedness Measure
Type Of Disaster 2
Early Warning Indicator
Type Of Disaster 4
Early Warning Indicator
Preparedness Measure
Preparedness Measure
345
Page 15 of 15

Wereda Disaster Risk
Profile
Data_Collected_Date
Region S.N.N.P
March 2017
Zone
GAMO GOFA
National Disaster Risk Management
Commission (NDRMC)
Friday, July 21, 2017
Wereda BONKE
Selected Indicator
Wereda Strengths, weaknesses, opportunites and treats (SWOT) Analysis
Kebele Name
ZEGA
FADELE
Strength
- High social interaction
- High co-operative work
- Keep peace and security
- Participation in
government policy and
strategy
Weakness
- Lack of awareness
- Low social interaction
- Lack of awareness
- Low initiation
GERIBANISHA
GALO
- Good social interaction
- Lack of awareness and
Illiteracy
GERIBANISA
KARICHE
ZAZIE
- High social interaction
- High participation in
developmental works
- High social interaction
- Lack of awareness
- Illiteracy
- Lack of awareness
- Low initiation
Opportunity
- Irrigation dam construction
- Improved seed variety
- Construction of drinking
water pumps
- Construction of water
irrigation canals
- Access of improved varieties
of seeds
- Irrigation constructions
- Road constructions
- Improved seeds
- Pesticides
- Road construction
- Construction for drinking
water
- Rod construction
- construction for irrigation
- Irrigation constructions
- Clean water construction
Threat
- Shortage of water
- Lack of funding
- Lack of funding
- High price of improved
seed varieties
- Lack of fund to buy
animals feed
- Lack of funding
- Increased severity of
disaster
- High price to use
fertilizer
- Lack of fund for many
use
- Lack of funding
- High price to buy
improved seeds
346
Page 1 of 7
Wereda Disaster Risk
Profile
Data_Collected_Date
Region S.N.N.P
March 2017
Zone
GAMO GOFA
National Disaster Risk Management
Commission (NDRMC)
Friday, July 21, 2017
Wereda BONKE
Selected Indicator
Wereda Strengths, weaknesses, opportunites and treats (SWOT) Analysis
Kebele Name
GORATE
GARIBANISA
SOROGE
Strength
- High social interaction
- Keeping of peace and
security
- Community participation
in
development
activities
- High social interaction
Weakness
- Lack of awareness
- Limited participation in
meeting
- Lack of awareness
KOLE KANCHAME
KOLE ZALE
- High social interaction
- High community
participation
in
development works
- Respect of government
policy and
strategy
- High social interaction
- High participation in
development works
- Lack of awareness
- Lack of health extension
- Limited women
participation
- Lack of awareness
- Lack of initiation
Opportunity
- Irrigation constructions
- Clean water
- Improved livestock varieties
- Road construction
- Construction of irrigation
- Construction of road
- Construction of clean water
- Construction of health center
and clean water
- Electricity
- Irrigation construction
- Road construction
Threat
- Lack of funding
- High price to use
fertilizers
- High price to use
improved seeds
- High price to use
livestock s variety
- Lack of fund
- Low income to use
fertilizers and pesticides
- Low income to use
improved seeds
- Lack of funding
- Irrigation construction
- Clean water construction
- Road construction
- Electricity
- Lack of fund
- Lack of improved seed
variety
347
Page 2 of 7

Wereda Disaster Risk
Profile
Data_Collected_Date
Region S.N.N.P
March 2017
Zone
GAMO GOFA
National Disaster Risk Management
Commission (NDRMC)
Friday, July 21, 2017
Wereda BONKE
Selected Indicator
Wereda Strengths, weaknesses, opportunites and treats (SWOT) Analysis
Kebele Name
YELA
Strength
- High social interaction
- Strong co-operative work
Weakness
- Lack of awareness
KOYRA MUKULA
KETELE
FISHITO
DURIBE
- High social interaction
- Community participation
in development works
- High respecting of
government policies
- High social interaction
- Construction of
institutions together
- Participation of the
community
in development works
- Keeping of peace and
security
- High social interaction
- High social interaction
- Community participation
in development works
- Lack of awareness
- Low initiation
- Lack of awareness
- Lack of awareness
- Lack of awareness
- Less initiation
Opportunity
- Road construction
- Electricity supply
- Modern irrigation system
- Clean water supply
- Road construction
- Health center
- Irrigation construction
- Construction of irrigation
- Road construction
- Health center construction
Threat
- Lack of fund
- Lack of funding
- Lack of sufficient water
- Lack of market linkage
- Lack of funding
- Irrigation dam construction
- Road construction
- Irrigation construction
- Clean water construction
- Road construction
- Lack of funding
- Lack of funding
- High price of
agricultural inputs
348
Page 3 of 7

Wereda Disaster Risk
Profile
Data_Collected_Date
Region S.N.N.P
March 2017
Zone
GAMO GOFA
National Disaster Risk Management
Commission (NDRMC)
Friday, July 21, 2017
Wereda BONKE
Selected Indicator
Wereda Strengths, weaknesses, opportunites and treats (SWOT) Analysis
Kebele Name
ALGUDA
KACHA KASHISO
CHOSHA
KAMELE BARIE
ORO
Strength
- High social interaction
- Community participation
in development
works and government
policies
- High social interaction
- Participation in
development works
- Respecting of
government
policies and strategies
- High social interaction
- High co-operation works
- Use of technology
- High social interaction
- Participation in
development works
Weakness
- Lack of awareness
- Lack of awareness
- Lack of initiation
- Lack of awareness
- Lack of awareness in the
use of
technology and in family
planning
Opportunity
- Irrigation construction
- Clean water construction
- Veterinary health center
constructions
- Road construction
- Irrigation construction
- Electricity
- Road construction
- Drinking water dam
construction
- Irrigation construction
- Road construction
- Clean water construction
- Modern irrigation system
- Supply of health care drugs
Threat
- Lack of fund
- Lack of fund
- Lack of fund for many
use
- Lack of fund to use
improved inputs
349
Page 4 of 7

Wereda Disaster Risk
Profile
Data_Collected_Date
Region S.N.N.P
March 2017
Zone
GAMO GOFA
National Disaster Risk Management
Commission (NDRMC)
Friday, July 21, 2017
Wereda BONKE
Selected Indicator
Wereda Strengths, weaknesses, opportunites and treats (SWOT) Analysis
Kebele Name
KALIBO LAKA
GEZESO
DENBILE OSA
DESHKELE
Strength
- High social interaction
- Use of modern
technologies
- Respecting of
government
policies and strategies
- Community participation
in development works
- High social interaction
- High social interaction
- High social interaction
Weakness
Opportunity
- Modern irrigation system
- Clean water supply
- Road construction
- Electricity
- Lack of awareness
for agricultural inputs
- Social problem (Drinking)
- Traditional Practices (bad)
- Lack of awareness
- Limited community
participation
in development works
- Lack of awareness
- Use of technology
- Road construction
- Clean water supply
- Construction of irrigation
- Construction of veterinary
health center
- Irrigation construction
- Electricity supply
- Clean water construction
- Access of improved seeds
and livestock varieties
Threat
- Lack of funding
- High price of
agricultural inputs
- Lack of funding
- Lack of drought resistant
varieties
- Lack of funding
350
Page 5 of 7

Wereda Disaster Risk
Profile
Data_Collected_Date
Region S.N.N.P
March 2017
Zone
GAMO GOFA
National Disaster Risk Management
Commission (NDRMC)
Friday, July 21, 2017
Wereda BONKE
Selected Indicator
Wereda Strengths, weaknesses, opportunites and treats (SWOT) Analysis
Kebele Name
KALO GAGULA
GERASE ZALA
KALO GAGULA
Strength
- High social interaction
- Use of technologies
- Respecting of
government policies
- High social interaction
- Good respecting of
government policies
- High social interaction
DEMBILE OTORA
- High social interaction
- Use of technology
KOSHALE
GOBO BAKE
- Good social interaction
- Use of indigenous
knowledge
- Good interest
in government policy and
strategies
- High social interaction
Weakness
- Lack of awareness
- Lack of awareness
- Lack of awareness
- Lack of awareness
- Lack of awareness
in the use of technologies,
and health care
- Lack of awareness
- Dependency
Opportunity
- Construction of clean water
- Construction of irrigation
- Construction of health
center
- Construction of Electricity
- Construct clean water
- Construct irrigation system
- Road access
- Water irrigation,
Reforestation
- Road access
- Clean water construction
- Soil and water conservation
- Construct clean water
- Construct irrigation
- Electricity supply
- Irrigation construction
- Health center construction
- Clean water construction
- Diversification of
improved livestock forages
- Construction of health center
- Construction of road
Threat
- Lack of funding
- Lack of funding
- Lack of funding for many
use
- Lack of funding
- Lack of funding
- Lack of funding for
construction
351
Page 6 of 7

Wereda Disaster Risk
Profile
Data_Collected_Date
Region S.N.N.P
March 2017
Zone
GAMO GOFA
National Disaster Risk Management
Commission (NDRMC)
Friday, July 21, 2017
Wereda BONKE
Selected Indicator
Wereda Strengths, weaknesses, opportunites and treats (SWOT) Analysis
Kebele Name
DIMELE FUSE
Strength
- High social interaction
- Keeping of peace and
security
- Community participation
in any government policies
to implement
Weakness
- Lack of awareness
Opportunity
- Irrigation construction
- Clean water construction
- Reforestation
- Livestock fodder
development
Threat
- Lack of funding
352
Page 7 of 7