


NATIONAL
DISASTER RISK MANAGEMENT COMMISSION
(NDRMC)
WOREDA DISASTER RISK PROFILE (WDRP)
REGION: S.N.N.P
ZONE: SOUTH OMO
WEREDA: HAMER
December, 2020
Addis Ababa

About the National Disaster Risk Management Commission (NDRMC)
The National Disaster Risk Management Commission (NDRMC) was reestablished in
December 2015 and recognized by an act of Council of Ministers (Regulation No.
363/2015) as an autonomous Federal Government office mandated to conduct
appropriate activities for the comprehensive implementation and realization of the
objectives of the National Disaster Risk Management Policy and Strategy and to
coordinate, monitor and provide appropriate support with respect to activities
carried out by the lead sector institutions.
Address: Kirkos Sub-city Behind Dembel City Center, Addis Ababa, Ethiopia.
P.O.Box: 5686
Tele: 0115524259/4272
Website: www.dppc.gov.et
© 2020 National Disaster Risk Management Commission. All rights reserved
Printed in Addis Ababa, Ethiopia.
Citation- This Document May be Cited as Follows:
National Disaster Risk Management Commission (2020), Hamer Woreda Disaster Risk
Profile, Addis Ababa, Ethiopia.
PREFACE
Ethiopia is well aware of the impact that disasters can have on the
development goals that we are rigorously pursuing through our
Growth and Transformation Plan II. With this recognition we started
a paradigm shift a few years ago, largely triggered by the revised
National Policy and Strategy on Disaster Risk Management.
To make the DRM programme implementation in the country well-informed, a
comprehensive information management system is required. We have been undertaking
a comprehensive risk assessment exercise under which Disaster Risk Profiles are being
prepared for each district and at sub-district levels in the country.
This Wereda Disaster Risk Profile establishes an extensive database on disaster risk
elements that will help decision makers at all levels to be better informed at community
and Wereda level about the characteristics of potential hazards, their potential
exposure, vulnerabilities of communities, capacities and that can also be an input for
Wereda Disaster Risk Reduction Plans and area specific early warning tools.
Wereda Disaster Risk Profiles developed are publically available here for the use of all
development partners and government sectors at all levels. Also, other data sources of
NDRMC, such as Desinventar, Livelihood Baseline and the Early Warning information will
be integrated and harmonized with this Information Management System.
Finally, we need to acknowledge the support of partners who have funded this
programme and we also look for the support of donors and all development partners in
order to achieve the ambitious indicators of this risk information and providing every
district with the disaster risk profile and their respective risk-informed plans.
H.E. Ato Mitiku Kassa
Commissioner
National Disaster Risk Management Commission (NDRMC)
The Federal Democratic Republic of Ethiopia (FDRE)

PREFACE
Woreda Disaster Risk Profiling (WDRP) is a government owned
programme undertaken by the National Disaster Risk
Management Commission (NDRMC) in collaboration with regional
DRM offices and development partners to provide baseline
information for disaster risk management practices and
activities in the country. The programme is designed by taking
into account the experiences gained from the implementation of pervious strategies
and actions like the Hygo Framework for Action (2000-2015) and the Sendai Framework
for Disaster Risk Reduction (2015-2030).
WDRP is composed of diversified indicators including hazard related issues, crop and
livestock production, landholding and environmental issues, human and livestock health
issues, education and social issues at wereda and kebele level. It provides basic and
detailed indicators with both quantitative and qualitative information which obtained
from both primary and secondary data sources.
Moreover, two pages summary of profiles is also prepared to help users easily
understand WDRP results for each wereda without going into detail for all indicators.
In addition to this booklet, developed profiles are uploaded on WDRP website
(http://profile.ndrmc.gov.et) to be viewed by all users; we encourage all DRM actors
at all levels to use this profile as baseline information for all DRM initiatives.
This WDRP booklet was produced through exemplary collaboration of all concerned
bodies and I would like to give my deepest gratitude to all who directly or indirectly
contribute for the success of the programme particularly for data enumerators and
supervisors, data encoders and profile development teams, consultants and advisors,
partner ministries and all DRM stakeholders.
Abraham Abebe
Director
Disaster Risk Reduction and Rehabilitation Directorate (DRRRD)
National Disaster Risk Management Commission (NDRMC)
Contents
No. Indicator Name
Page
General Information
I
Preface
II
Wereda Location in Ethiopian Map
III
Methodology
IV
Summary Profile
Hazard Related Characteristics
1
1
Biological Hazards of the Wereda
2
2
Geological Hazards of the Wereda
3
3
Hydro Metrological Hazards of the Wereda
4
4
Socio Economic Hazards of the Wereda
5
5
Technological Hazards of the Wereda
6
6
Disaster Characteristics By Kebele
7
7
Hazards: Conflict as an Issue
38
8
Hazard Situation During Last Disaster - Characteristics of most recent disaster that
affected the community
40
9
Frequency of Disaster Occurrence
47
10
Household Exposure to Hazards
48
11
Months of Occurrence of Frequent Disasters
49
12
Conflicts: Perception of households on conflict issues - Is conflict an issue in this
community?
50
13
Conflicts: Perception of households on conflict issues - Who do you turn to in case
of a conflict?
51
14
Losses from Disasters - Losses from all disasters (household response in %)
52
15
Losses from Disasters - Main Losses by Type of Disasters (household response in %) 53
No. Indicator Name
Page
16
Losses from Disasters - Secondary Losses by Type of Disasters (household response
in %)
56
17
Seasonal Calendar for Hazards, Activities and Income Level By Kebele
59
Infrastructure Access Characteristics
18
Physical Vulnerability: Access to Roads & Urban Centres - Households access to
road and urban centre
78
19
Physical Vulnerability: Access to Electricity - Households’ access and utilization of
electricity
79
20
Physical Vulnerability: Type of Dwelling Units - Households’ type of dwelling houses 80
Socio Demographic Characteristics
Economic Vulnerability: Level of Migration - Migration level and its characteristics
21
by Kebele
82
22
Economic Vulnerability: Household Migration - Household migration and reason for
migration
85
23
Economic Vulnerability: Household Migration - Disasters as a triggering factor for
migration (households response in %)
86
24
Demography: Population Structure
87
25
Demography: Population Trends and Ethnic Groups
88
26
Social Vulnerability: Household Demographic Characteristics - Demographic
89
characteristics of households
27
Social Vulnerability: Level of Educational Attainment - Education status of
household members
90
28
Social Vulnerability: Gender Parity - Gender parity in education level (7+ years)
and household heading
91
Environmental Characteristics
Environmental Situation: Environmental Problems - Major environmental problems
29
by Kebele
93
30
Environmental Situation: Deforestation - Observed changes over levels of
deforestation by the community and its problems
94
Environmental Situation: Natural Resources Availability - Natural resources
31
available and changes observed by the community
98
No. Indicator Name
Page
32
Environmental Situation: Rainfall & Temperature - Observed changes on rainfall
and temperature by the community over the last decade
107
33
Environmental Situation: Reasons for Environmental Changes
112
34
Environmental Situation: Soil Erosion - Observed changes on levels of soil erosion
by the community
113
Livelihood, Occupation and Source of food
35
Economic Vulnerability: Major Occupational Categories - Major categories of
occupation and percent of population engaged in the occupation by Kebele
116
36
Economic Vulnerability: Livelihoods - Households important sources of
livelihood (response in %)
118
Economic Vulnerability: Occupational Categories - Percent of population above 15
37
years age by occupation categories
119
38
Economic Vulnerability: Sources of Food - Households source for different food
items (response in %)
120
Crop Production
39
Hazards: Change in Crop Damages - Proportion of total crop damage (percentage
123
response by households)
40
Hazards: Change in Crop Damages - Major reasons for crop damage (percentage
response by households)
124
41
Hazards: Change in Crop Damages - Proportion of Damage for Major Crops
125
(percentage response by households)
42
Hazards: Change in Crop Damages - Reasons for Damage of Major Crops
(percentage response by households)
126
43
Agricultural Situation: Change in Crops Grown - Five major crops grown by
proportion of total cultivated land
130
44
Economic Vulnerability: Status of Agriculture - Methods of tillage, Irrigation and
other agricultural input utilization by households
133
45
Economic Vulnerability: Crops Grown - Number of crops grown by households
134
46
Economic Vulnerability: Crops Grown - Types of crops grown by households
135
47
Economic Vulnerability: Crops Grown - Proportion of households by amount of yield
of major crops (last year)
136
48
Economic Vulnerability: Crops Grown - Proportion of households by amount of yield
of major crops (Five years ago)
137
49
Economic Vulnerability: Land Ownership and Quality - Landownership of households 138

No. Indicator Name
Page
50
Economic Vulnerability: Land Ownership and Quality - Farmers’ perception on the
quality of their agricultural land
139
51
Environmental Situation: Land-Use other than crop production - Types of land use
other than crop production across Kebeles
140
Livestock Production
52
Agricultural Situation: Status of Livestock Disease - Change In Livestock Disease
Status By Kebele
143
53
Livestock Prevalent of Diseases & Veterinary Facility - Livestock Diseases
Prevalence
146
54
Livestock Prevalent of Diseases & Veterinary Facility - Evaluation of Access to
Veterinary Services and Livestock Drugs
147
55
Agricultural Situation: Livestock Diversity - Type of livestock and their economic
importance in the community
148
56
Economic Vulnerability: Livestock Ownership and Changes - Percentage of
households by number and type of livestock owned
152
57
Economic Vulnerability: Livestock Ownership and Changes - Households’ perception
on changes in livestock number in the last five years (response in %)
154
58
Economic Vulnerability: Livestock Ownership and Changes - Households
perception on changes in livestock number in the last five years (response in %)
155
59
Agriculture (Livestock): Pasture Availability - Households’ perception on access and
quality of pasture
157
60
Agriculture (Livestock): Pasture Availability - Households’ perception on
158
problematic months for pasture availability
61
Agriculture (Livestock): Water Availability - Households’ response on water
availability for livestock
159
62
Agriculture (Livestock): Water Availability - Households’ perception on problematic
months of water availability for livestock
160
63
Agriculture (Livestock): Water Availability - Sources of water for livestock
161
(households response in %)
Access to Markets and Credit
64
Economic Vulnerability: Proportion of Produce Sold and Market - Proportion of
crops and livestock sold from total production and markets
163
65
Economic Vulnerability: Kebele Access to Markets - Access to market by Kebele
165
No. Indicator Name
Page
66
Economic Vulnerability: Formal & Informal Transfers - Percentage of households
reporting received formal transfers
166
67
Economic Vulnerability: Formal & Informal Transfers - Percentage of households
reporting received Informal transfers
169
68
Capacity: Access to Credit Facilities - Households access to credit facilities
172
69
Capacity: Access to Credit Facilities - Percentage of households by major reasons
of borrowing money
173
70
Capacity: Access to Credit Facilities - Percentage of households by major sources
of credit
174
71
Capacity: Access to Credit Facilities - Percent of households with ability to raise
500 birr in one week
175
Health and Sanitation Characteristics
72
Household Access to Health Facilities - Where do patients go for health care?
177
73
Hazards: Health problems and changes over the last decade
178
74
Household Health Status - Households’ health condition and major health problems 181
75
Household Access to Sanitation - Percentage of households with access to different
kind of toilet facilities
183
76
Household Access to Drinking Water - Sources of drinking water for households
(response in %)
184
77
Household Access to Drinking Water - Households’ methods of treating drinking
185
water
Household Access to Drinking Water - Number of times households fetch water in a
78
week
186
79
Household Access to Drinking Water - Time taken per day to fetch water for
households
187
Coping Mechanisms and Preparedness Measures
80
Capacity: Community Preparedness against Sudden Onset Disasters
189
81
Capacity: Community Preparedness against Increase in Disaster Intensity
194
82
Capacity: Community Preparedness against Disasters
202
83
Hazard: Coping and recovering during last Disaster
211
84
Capacity: Type Community Participation
227
No. Indicator Name
Page
85
Capacity: Recovery from Losses from Disasters - Percentage of Households who
have managed to recover from losses of disasters
229
86
Capacity: Recovery from Losses from Disasters - Percentage of households
recovered from past disasters by type of Disasters
230
87
Capacity: Recovery from Losses from Disasters - Proportion of households
recovered by type of Losses
231
Capacity: Coping Options if More Resources Available - What coping strategy could
88
be adopted if more resource were available?
232
89
Capacity: Coping Strategies Adopted by Households - Percentage of households by
major type of coping strategies adopted (at least once)
233
Capacity: Coping Strategies Adopted by Households - Main coping strategies
90
adopted by households for respective disasters
235
91
Capacity: Coping Strategies Adopted by Households - Secondary coping strategies 241
adopted by households for respective disasters
Capacity: Coping Strategies Adopted by Households - Main coping strategies
92
adopted by households to recover from respective losses
245
93
Capacity: Coping Strategies Adopted by Households - Percentage of households
by frequency of main coping strategies adopted
250
94
Capacity: Alternative Livelihood Sources - Alternative livelihood sources suggested
by the community
252
Community Perception and Suggestions
95
Agricultural Situation: Access to Extension - Perception of the community on
Access to Agricultural extension Services
260
96
Agricultural Situation: Access to Inputs - Perception of the community on access
to improved agricultural inputs
263
97
Agricultural Situation: Water for irrigation - Access to water for irrigation in the
community
265
98
Agricultural Situation: Water Availability for Livestock - Water availability for
livestock in the community
267
99
Agricultural Situation: Soil Fertility - Perception of the community on soil fertility
and its change over time
270
100
Economic Vulnerability: Change in Agricultural Situation - Households perception
on changes of crop type, size of cultivated area and crop yields
272
101
Environmental Situation: General Land Quality - Perceptions of the community
on changes in the general quality of land over a decade
274

No. Indicator Name
Page
102
Environmental Situation: Changes in Landscape - Changes observed by the
community on landscape and the problems due to the changes
276
Interventions: Community Perception on Mediums to Influence DRM Actors -
103
Community perception on the effectiveness of institutional channels to use to
278
influence DRM actors
Interventions: Community Perception on their Knowledge used in DRM Process -
104
Perception of the community on how their knowledge influences the priorities and 286
measures of DRM actors
105
Interventions: Suggestions to improve preparedness - Interventions suggested by
the community to development actors to improve preparedness in the area
288
106
Interventions: Suggestions to DRM Actors in the Area - Community suggested
measures to DRM actors in the area for effective DRM actions
294
107
Economic Vulnerability: Community Suggestions to Improve Economic Situation -
Community suggested measures to improve the economic situation of the area
304
108
Community Awareness of Disaster Risk Management System and Actors
309
Community Perception of DRM System and Actors - Perception of the community on
109
the effectiveness of DRM system in helping them to prevent, cope and recover
317
from disasters
110
Major Public Interventions Desired - Percentage of households by type of
intervention desired
326
Others
111
Capacity: Community Based Organizations
328
112
Supporting Agencies against Disasters - Percentage of households by supporting
330
institutions to handle or recover from disaster damages
113
Types of support received by households during disasters
331
114
Government Actors in the Field of Disaster Risk Management - Government actors
and their activities in the field of Disaster Risk Managements
332
115
Non-Government Actors in the Field of Disaster Risk Management - Non-government
actors and their activities in the field of Disaster Risk Management
336
116
Interventions: Community Suggestions to Development Actors
337
117
Wereda SWOT Analysis
338
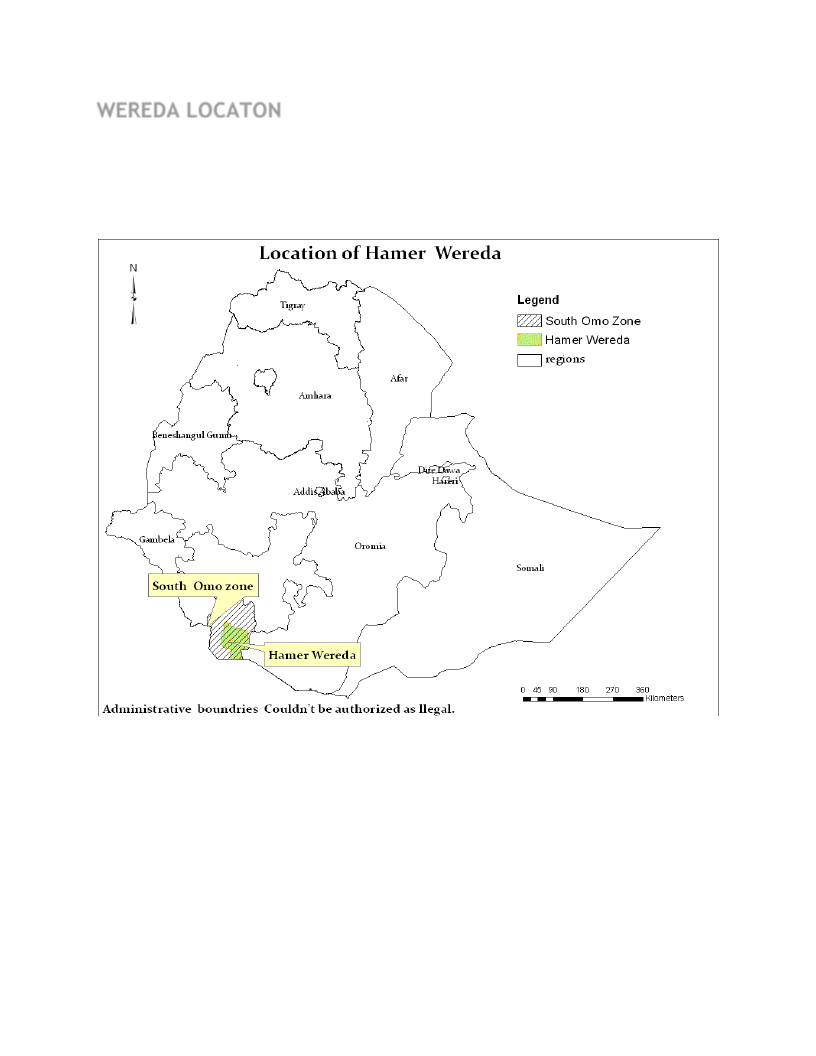
WEREDA LOCATON

METHODOLOGY
WDRP Content :
• Comprehensive information on disaster risk components
(Hazards, Vulnerability and Capacity)
• Multi-sectoral and multi-hazard information.
Research Approach:
• Mixed Approach
• Both quantitative and qualitative information
Data Sources:
• Primary Data:
Household Questionnaires: statistically significant number
(around 400 households).
Focus Groups Discussions: One per kebele
Key Informant Interviews: with major woreda level government
and non-government DRM actors
Problem Tree Analyses : to see the cause and effect of disasters
• Secondary Data:
collected relevant to WDRP indicators:
LIU, SERA Project, Risk baseline, other ministries…
Sampling Technique:
• Multistage cluster sampling
• Both Probability and Non-probability sampling
Methods of Analysis:
• Descriptive Statistics
• Textual Analysis
• Cispro and SPSS
• Automate WDRP software
WEREDA
SUMMARY DISASTER RISK PROFILE
INFORMATION
Wereda Disaster Risk Profiling Programme: SNNP
Disaster Risk Profile: Hamer Wereda
SUMMARY OF WEREDA PROFILE LIVELIHOOD ZONE SUMMARY
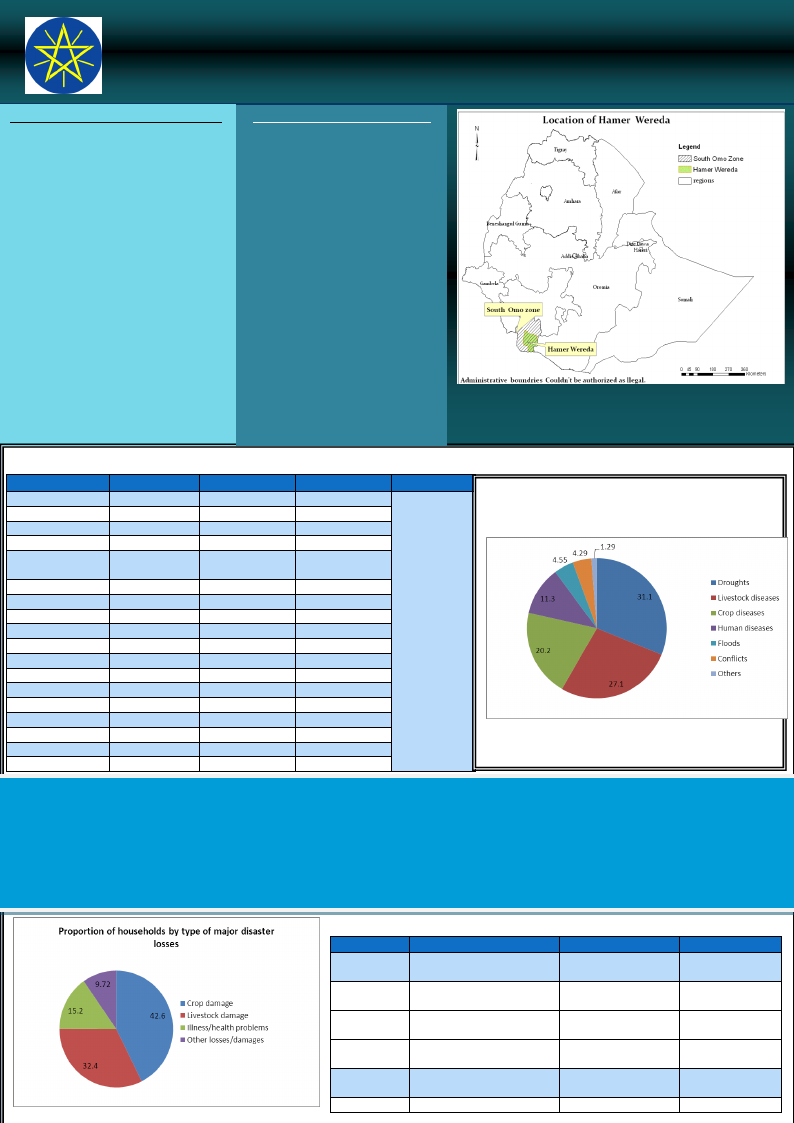
Drought is the major disaster risk in Hamer Southern Agro-Pastoral Livelihood
Wereda followed by livestock diseases and
Zone (SAP) LZ
crop pests/diseases, together affecting the Crop and livestock production is the
livelihood of more than 85% of the main livelihood activity. The crops
population. Human diseases (mainly water grown are sorghum, maize, and some
borne diseases), floods (due to overflow of teff for sale. But there is still a main
rivers) and conflicts over land, pasture and dependence upon livestock and their
water with different ethnic groups are also products.
among the hazards in the area.
Deforestation, soil erosion and range land South Omo Pastoral Livelihood
degradation are the major environmental
Zone (SOP) LZ
problems in the area.
This is a semi-arid rangeland zone in
the basin of the Omo River. The main
For Hamer Wereda, enhancing utilization of livestock species reared in this
irrigation and improved agricultural inputs in livelihood zones include goats, cattle
crop production, controlling deforestation and sheep. Although the economy is
and improving natural resource conservation based on livestock, there is some
are the major interventions required in the cultivation of sorghum and maize on
area. Improving access to markets and the valley bottom, using both rainfall
veterinary services and resolving conflicts and irrigation.
are also required in the area.
MAJOR DISASTERS REPORTED IN WEREDA
Kebele
Hedbak
Shanko
Dega keja ala
Kara korcho
Shanko
Miresha kuluma
Minogelty
Minogelty
Erbore gonderoba
Murale
Kolakeja
Erbore
lula
Eriya umbule
Miresha bitagelefa
Gedbak
Assile
Wongabayeno
Disaster 1
Drought, hunger
Drought, hunger
Drought
Drought
Pasture and food
grain shortage
Drought
Livestock disease
Drought
Drought
flood
Drought
flooding
Drought
Drought
Drought, hunger
Drought
Drought
Drought
Disaster 2
Livestock disease
Livestock disease
Livestock disease
Conflict
Livestock disease
Conflict
Drought
Livestock disease
Conflict
Crop pest
Livestock disease
Drought
Livestock disease
Livestock disease
Livestock disease
Livestock disease
Livestock disease
Livestock disease
Disaster 3
Crop pest
Human diseases
Human disease
Shoats disease
Human diseases
Livestock disease
Conflict
Conflict
Livestock disease
Livestock disease
Conflict
Livestock disease
Crop pest
Global warming
Human diseases
Crop pest
Conflict
LIU Info
Chronic
Hazards:
Proportion of households by major disasters
suffered in the last five years
SAP LZ:
Drought;
livestock
diseases and
malaria
SOP LZ:
Drought;
livestock
diseases;
malaria and
market shocks
SHORT NARRATIVE ON MAJOR DISASTERS: drought, livestock diseases and crop pests are the three major disaster risks reported in Hamer Wereda,
among which, drought is the most problematic hazard resulting in crop damage and hunger in the area. It also affects livestock production by limiting water
and pasture availability in the area. On the other hand, disaster effects from flooding such as high soil erosion, loss of assets, crop damage and migration are
reported increasing. Livestock diseases (such as trypanasomiasis, CCPP and faculiasis) are also potential hazards to livestock rearing, which is the main
livelihood activity in the area. Availability of poor quality livestock drugs and invasion of noxious plants and weeds on grazing areas in the community are
reported additional problems worsening the situation in livestock production. Moreover, conflicts over grazing areas and water sources are very common in
Hamer Wereda particularly between different clans and ethnic groups. In this area, conflict has become the main reason for household migration and change
of residence and also in loss of life and assets. Taking revenges and looting to replace looted animals makes the conflict even worse in the area.
Disasters
Drought
Livestock
diseases
Crop Diseases
Human
disease
Floods
Conflicts
EFFECT OF DISASTERS
Loss 1
Physical damage on household
members and property
Livestock damage
Loss 2
Crop damage
Illness in livestock
Crop damage
Health problems
Migration
Migration
Loss of access to social
services
Loss of access to social
services
Loss of access to social
services
Loss of life and asset
Loss 3
Livestock damage
Loss of income and
saving
Loss of income and
food
Death of household
members
Damage to crops
and pasture
Loss of saving
Wereda Disaster Risk Profiling Programme: SNNPR
Disaster Risk Profile: Hamer Wereda
HOUSEHOLD AND COMMUNITY
VVUULLNNEERRAABBIILLIITTYY
In this Wereda, 4/5th of the households did not recover from the
disasters they faced indicating weak resilience of the community.
Livestock rearing is the main livelihood activity followed by crop
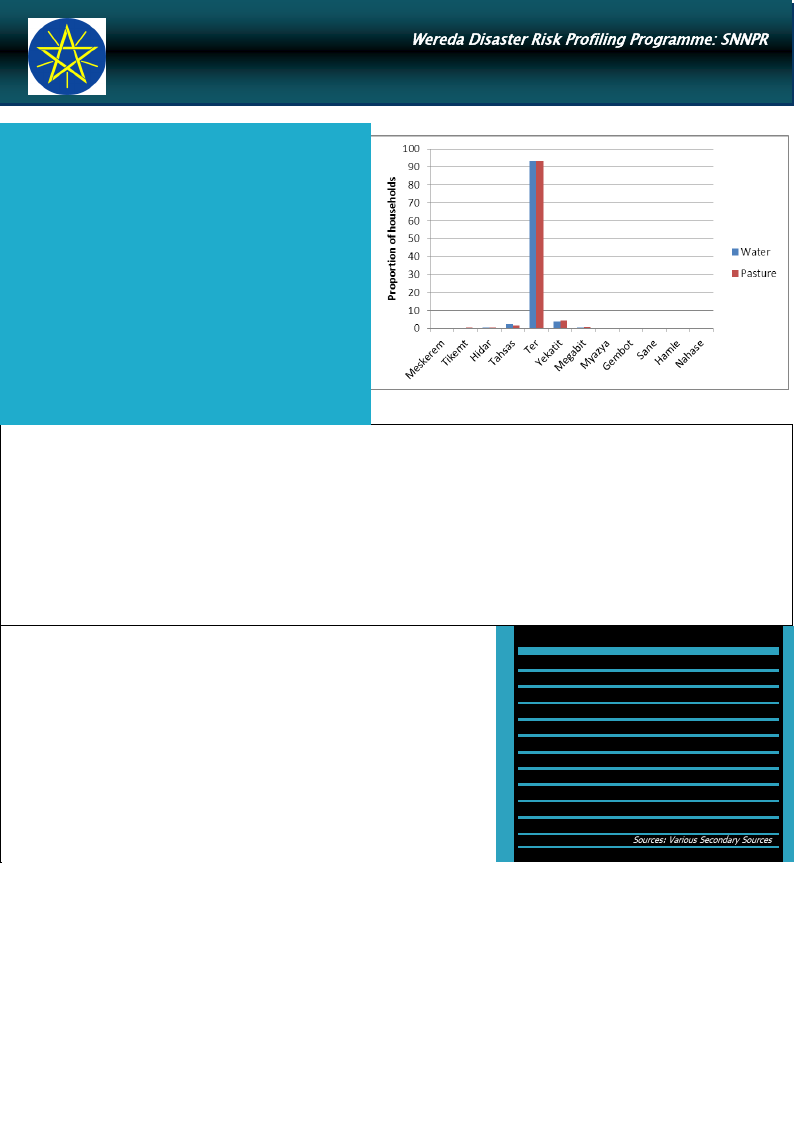
production and bee keeping. January (Tir) is the most problematic
month in terms of water and pasture availability for livestock. During
the same period, water availability for human consumption is also very
scarce.
The exposure of the community to hazards is reported increasing
because of deforestation, degradation of other natural resources and
conflict with Dasenech. Households’ dependence on traditional,
subsistent and rain fed agriculture including heavy dependence on
single enterprise (livestock), focus on few non-cash crops (sorghum
and maize), poor adoption rate of improved technologies (such as
seeds, fertilizer, pesticides), poor utilization of irrigation facilities and
improved agronomic practices are generally the major factors
enhancing households’ vulnerability towards major disasters in the
Wereda. During the time of survey, 62% and 89% of the households
reported receiving food aid and agricultural inputs.
Most Problematic Months for Pasture & Water Availability for Livestock
Accessibility:
Road: about 71% of the households reported to have no access to road. On average, it took households 70 minutes to reach the nearest paved road
Electricity: all kebeles do not have access to electricity
Agricultural inputs: 97% and 92% of the households did not use fertilizer and pesticide respectively. On the other hand, 54% of the households have
used improved seed varieties, and 87% of the households reported receiving agricultural extension service.
Urban centre: household access to urban centre is very poor. It took households almost five hours to reach the nearest urban centre.
Water: river stream is the main source of water, from which 58% of the households obtain water for households’ consumption. On average, it took
households about 49 minutes to fetch water.
Access to sanitation: of the total households surveyed, 92% of them reported that they have no toilet facility.
Veterinary facilities: Majority of households (more than 78% of them) reported to have poor access to veterinary services and livestock drugs
Access to market: Access to market is very poor, and the communities indicated that grain traders bring crops (mainly sorghum) to their area and
exchange 50 kg sorghum with one goat (which is estimated to be Birr 400).
Level of Awareness and Institutional Development
The general literacy level of the Wereda is very low, where, of the total population above 7
years of age, only 4.8% of them are literate out of which 92% did not complete first grade level.
With regard to gender parity in education, the number of male to female students is almost
equal below first grade level indicating women’s equality and even better participation in
education with men at the beginning. However, as the education level attained gets higher, the
number of males by far dominates the corresponding number of females. This implies the
majority of females discontinue their education even before completing first grade and many of
the remaining females dropout as the level gets higher.
On the other hand, awareness of the community on disaster risk management system and
actors seem to very poor. There are various cooperatives and associations engaged in different
activities including helping members during disasters. These include purchasing cooperatives,
women associations, youth groups and farmers’ multipurpose cooperatives. Presence of NGOs
like GTLI (Global Team for Local Initiatives) and Farm Africa is additional capacity in the area.
InfoBits:
Population
Sex ratio
Urban Population
Mean Altitude
Mean Slope
: 59160 (2007)
: 992 F/1000 M
: 3210 (2007)
: 787.153 m
:2.91%
Measles caseload
PLWHA on ART
Under-five children eligible
for supplementary feeding
: 3 (2004-2009)
:
:
Sources: Various Secondary Sources
Community Capacity to Cope
Collection of wild food, selling more livestock and reducing the number of meals eaten per a day are the major coping mechanisms used by households
in the Wereda. Poaching and park encroachments are also among the coping strategies used by households.
In time when more resources are available, households opted for storage of more foods and other necessities (by 86% households) and adaptation of
economic activities to hazards season (by 12% households) as the major coping mechanisms to disaster effects
Households’ access to credit from formal credit institutions is almost negligible. Only 1.1% of the households interviewed in Hamer Wereda reported
obtained credit from relatives, friends and neighbours and all of them used it for consumption purposes
Good traditional cooperation and participation is available in the community to help each other in time of disaster
There is possibility of livelihood diversification in terms of growing food and cash crops by using irrigation. Average land holding in the area is high
(which is 3.74 hectares) but average land actually cultivated is very low (which is 0.77 hectare) indicating availability of more land for crop cultivation.
Of the total surveyed households, 89% of them have received formal transfers in the form of seeds and tools which shows good intervention that can
enhance their capacity to cope with disasters in the future
Better income can be obtained from tourists visiting the area and invested towards building the capacity of the community towards preventing
disasters.
Major crops grown in the area are sorghum, maize and pulses, while types of livestock reared by households include cattle, goat, sheep and donkey.
WDRP Indicators
Hazard Related Characteristics
1
Wereda
Disaster Risk
Data_Collected_Date
September 2010
Disaster Risk Management
and Food Security Sector (DRMFSS)
Tuesday, September 30, 2014
Region S.N.N.P
Selected Indicator
Zone
SOUTH OMO
Biological Hazards of the Wereda
Wereda
HAMER
Hazard_Name
Hazard_Sub_Type
Crop pest
Cause_Of_Hazard
Crop pest
Late sowing due to shortage of rain
Hazard_Sub_Type
• Malaria,
• Chronic fever
• Diarrhea
• Meningit
Hazard_Sub_Type
• Tryponosomiasis,
• CCPP,
• Ticks,
• Foot and Mouth
• Mangitis
• CBPP
Human diseases
Lack of health services in the PA ,
Lack of mosquito net,
Lack of sanitation and dependent on
livestock produce for consumption
Livestock disease
Lack of vaccination and treatment,
Regular mobility due to feed and water
shortage
Unrestricted livestock movement for
grazing and water point, Mingling of
Hamer goats which have come for
grazing due to shortage of pasture at
hammer area,
Lack of veterinary facilities,
Effects_Of_Hazard
Food shortage,
Hunger,
Additional expenditure for food grain by
selling livestock
Death,
Loss of body condition,
Discomfort
Death of livestock,
Reduce of livestock produce,
Food shortage,
Low livestock price
Page 1 of 1
2

Wereda
Disaster Risk
Data_Collected_Date
September 2010
Disaster Risk Management
and Food Security Sector (DRMFSS)
Tuesday, September 30, 2014
Region S.N.N.P
Selected Indicator
Zone
SOUTH OMO
Geological Hazards of the Wereda
Wereda
HAMER
Hazard_Name
Hazard_Sub_Type
No geological hazard
Cause_Of_Hazard
Geological Hazards
Effects_Of_Hazard
Page 1 of 1
3
Wereda
Disaster Risk
Data_Collected_Date
September 2010
Disaster Risk Management
and Food Security Sector (DRMFSS)
Tuesday, September 30, 2014
Region S.N.N.P
Selected Indicator
Zone
SOUTH OMO
Hydro Metrological Hazards of the Wereda
Wereda
HAMER
Hazard_Name
Hazard_Sub_Type
Drought
Cause_Of_Hazard
Hydro-Meteorological Hazards
Deforestation,
Rainfall shortage
Flood
global warming (increasing
temperature)
High rain fall at high land areas,
Overflow of Omo and Woito Rivers
Living and farming alongside rivers
Deforestation and
Reduced rain fall
Effects_Of_Hazard
Hunger ,
Shortage of water and pasture
Long distance mobility in search of food
grain
Crop damage,
Damage of household properties,
Displacement,
Water lodging of pasture land
Increased sun stroke,
Loss of pasture, water, bushes, shrubs,
and large trees,
Reduced honey production ,
Reduced livestock produce
Page 1 of 1
4

Wereda
Disaster Risk
Data_Collected_Date
September 2010
Disaster Risk Management
and Food Security Sector (DRMFSS)
Tuesday, September 30, 2014
Region S.N.N.P
Selected Indicator
Zone
SOUTH OMO
Socio Economic Hazards of the Wereda
Wereda
HAMER
Hazard_Name
Hazard_Sub_Type
Conflict
Cause_Of_Hazard
Social Hazards
Competition over pasture and water
sources,
Looting of livestock,
Taking revenge
Conflict with Dasenech Wereda, Borena
and with different ethnic groups with in
Effects_Of_Hazard
Loss of livestock,
Loss of life,
Instability
Loss of grazing land
Page 1 of 1
5
Wereda
Disaster Risk
Data_Collected_Date
September 2010
Disaster Risk Management
and Food Security Sector (DRMFSS)
Tuesday, September 30, 2014
Region S.N.N.P
Selected Indicator
Zone
SOUTH OMO
Technological Hazards of the Wereda
Wereda
HAMER
Hazard_Name
Hazard_Sub_Type
No technological hazard
Cause_Of_Hazard
Technological Hazards
Effects_Of_Hazard
Page 1 of 1
6
Wereda Disaster
Risk Profile
Data_Collected_Date
September 2010
Region S.N.N.P
Zone SOUTH OMO
Selected Indictor: Disaster Characteristics By Kebele
Kebele Name
Disaster_Type
Common Period
Year Occured
ASELE
Droughts
December
February,
March, May,
June, July,
August
1967;1977;1
985;1987;19
84;1986;200
0;2001
Disaster Risk Management
and Food Security Sector (DRMFSS)
Tuesday, September 30, 2014
Wereda HAMER
Worst_Year
Trends of
Effects
1986
Increased
Root Causes
shortage of
rain
Effects
Vulnerability
Hunger,
sell of
more
livestock,
death of
livestock,
and
reduce of
livestock
produce,
loss of
body
condition
Unfavourabl
e location
for rain fed
agriculture,
lack of
awareness to
use livestock
resources
Coping
Strategy
Selling
shoats to
purchase
grain,
exchanging
grain for
shoats, use
of wild
fruits,
leaves and
roots,
taking loan
from rich,
begging
from rich
relatives
7
Page 1 of 31

Wereda Disaster
Risk Profile
Data_Collected_Date
September 2010
Region S.N.N.P
Zone SOUTH OMO
Selected Indictor: Disaster Characteristics By Kebele
Kebele Name
Disaster_Type
Common Period
Year Occured
ASELE
Livestock
diseases
February, Jan,
April , march,
June
1984;1987;1
992;2001;20
00
Conflicts
February,
January,
august
1984;1997;2
000
Disaster Risk Management
and Food Security Sector (DRMFSS)
Tuesday, September 30, 2014
Wereda HAMER
Worst_Year
1984 for
CCPP, 2000
for sheep
Trends of
Effects
Increased
1984
Decreased
Root Causes Effects
Vulnerability
Continuous
movement in
search of
grazing, lack
of routine
animal
health
service
Reduce of
livestock,
death of
livestock,
livestock
price fall,
hunger
due to
fall of
livestock
market
Lack of
awareness
on disease
prevention
and control
methods,
unrestricted
livestock
movement
for search of
grazing
Comptetion
over grazing
land, looting
of livestock,
killing for a
revenge
livestock
rustling,
loss of
life,
instability
and
shortage
of grazing
Regular
mobility in
search of
grazing and
water points
due to
pasture
shortage,
cultural
influence
Coping
Strategy
Changing
grazing and
water
points, split
herds in to
different
grazing
points,
keeping a
number of
livestock to
reduce risk
Regular
scouting of
borders,
shifting of
grazing
points
during
conflict,
strong
cooperation
of all PA
community
to confront
rival ethnic
groups
8
Page 2 of 31
Wereda Disaster
Risk Profile
Data_Collected_Date
September 2010
Region S.N.N.P
Zone SOUTH OMO
Selected Indictor: Disaster Characteristics By Kebele
Kebele Name
Disaster_Type
Common Period
Year Occured
ASELE
Crop Pest
June
1998;2002
Disaster Risk Management
and Food Security Sector (DRMFSS)
Tuesday, September 30, 2014
Wereda HAMER
Worst_Year
Trends of
Effects
2002
Increased
Root Causes Effects
Vulnerability
Late sowing
due to delay
of belg rain
Reduce of
crop
produce
and total
loss of
yield
especially
in 2002
increasing
hunger
seasons,
sell of
more
shots
Low
awareness to
use
pesticides
Coping
Strategy
9
Page 3 of 31

Wereda Disaster
Risk Profile
Data_Collected_Date
September 2010
Region S.N.N.P
Zone SOUTH OMO
Selected Indictor: Disaster Characteristics By Kebele
Kebele Name
Disaster_Type
Common Period
Year Occured
ERBORE
Floods
May, October
1999;2002
Droughts
January, fib,
Dec, June, July
1998;2000;2
001
Disaster Risk Management
and Food Security Sector (DRMFSS)
Tuesday, September 30, 2014
Wereda HAMER
Worst_Year
2002
Trends of
Effects
Increased
Root Causes Effects
Vulnerability
Settlement
near river
side,
increasing
deforestation
Damage
of
seedlings
crops,
damage
on grass
land
Dependency
on flood
threatened
agriculture,
settlement
beside the
river
2001
Increased
Low rain fall
at high land
areas
Displacem
ent,
damage
of crop
seedling,
shortage
of water,
shortage
of grazing
Dependency
on flood
threatened
agriculture
Coping
Strategy
Use of
indicators
and
evacuating
livestock
(cultural
indicators)
i.e.,
unusual
sound of
crocodiles
and
movement
to unusual
places
Sell of
shoats
during food
shortage
seasons,
use of wild
fruits,
fishing in
Woito river
10
Page 4 of 31

Wereda Disaster
Risk Profile
Data_Collected_Date
September 2010
Region S.N.N.P
Zone SOUTH OMO
Selected Indictor: Disaster Characteristics By Kebele
Kebele Name
Disaster_Type
Common Period
Year Occured
ERBORE
Livestock
diseases
January,
February,
December,
April
1967 for
RP;1984 for
CCPP;2000
Crop Pest
September,
October
1999;2002
Disaster Risk Management
and Food Security Sector (DRMFSS)
Tuesday, September 30, 2014
Wereda HAMER
Worst_Year
1967 for
rinder pest,
1984 for
CCPP
Trends of
Effects
Increased
Root Causes Effects
Vulnerability
Unrestricted
movement
and lack of
frequent
vaccination
Death of
livestock,
familiarit
y of
prices,
hunger
due to
livestock
loss
Low
awareness
on disease
control and
prevention,
regular
mobility in
search of
grazing
1999
Increased
Un timely
sowing
Damage
of crop
(sorghum)
, reduced
crop
produce
Dependency
on flood
retreat
agriculture
Coping
Strategy
Split herds,
keeping a
number of
livestock to
reduce risk,
frequent
shifting of
grazing and
water
points
Smoking
farms
11
Page 5 of 31

Wereda Disaster
Risk Profile
Data_Collected_Date
September 2010
Region S.N.N.P
Zone SOUTH OMO
Selected Indictor: Disaster Characteristics By Kebele
Kebele Name
Disaster_Type
Common Period
Year Occured
ERIYA
Droughts
February,
march, may,
June,
September,
October
1977;1986;1
991;1998;20
00;2001
Disaster Risk Management
and Food Security Sector (DRMFSS)
Tuesday, September 30, 2014
Wereda HAMER
Worst_Year
1998
Trends of
Effects
Increased
Root Causes
Shortage of
rain
Effects
Vulnerability
Reduce of
livestock
produce,
crop
damage
every
year, long
distance
mobility
in search
of
grazing,
hunger
and
livestock
sale
unfavourable
location for
rain fed
agriculture
Coping
Strategy
Use of wild
fruits and
leaves for
food,
migration
and using
national
parks and
restricted
areas for
grazing,
selling
livestock to
purchase
grains
12
Page 6 of 31

Wereda Disaster
Risk Profile
Data_Collected_Date
September 2010
Region S.N.N.P
Zone SOUTH OMO
Selected Indictor: Disaster Characteristics By Kebele
Kebele Name
Disaster_Type
Common Period
Year Occured
ERIYA
Livestock
diseases
Jan, February,
march, April,
may, June,
October
1967 RP,
1984 CCPP,
2000 sheep
disease 1993
anthrax
Disaster Risk Management
and Food Security Sector (DRMFSS)
Tuesday, September 30, 2014
Wereda HAMER
Worst_Year
1967
RP,1984
ccpp, 2000
sheep
disease
1993
anthrax
Trends of
Effects
Increased
Root Causes Effects
Vulnerability
Regular
mobility in
search of
grazing, lack
of awareness
for
prevention
and control
method
Death of
livestock,
livestock
price fall,
hunger
and loss
of asset
Regular
mobility for
search of
grazing and
watering
points
Coping
Strategy
Tending a
number of
livestock to
reduce
death risk,
split
herding to
reduce
disasters,
restrict
movement
to disease
source
areas
13
Page 7 of 31

Wereda Disaster
Risk Profile
Data_Collected_Date
September 2010
Region S.N.N.P
Zone SOUTH OMO
Selected Indictor: Disaster Characteristics By Kebele
Kebele Name
Disaster_Type
Common Period
Year Occured
ERIYA
Droughts
all months
become hot
1999;2000
and on
wards
GEDBAK
Droughts
January,
February,
March, June,
July, August,
September
1984;1996;2
000;1977
Disaster Risk Management
and Food Security Sector (DRMFSS)
Tuesday, September 30, 2014
Wereda HAMER
Worst_Year
On wards
1999
Trends of
Effects
Increased
1986;1977
Increased
Root Causes Effects
Vulnerability
Deforestation
and reduced
rain fall
Shortage of
rain at belg
season
Drought,
lack of
pasture
and
browsing
bushes,
shrubs,
and large
trees,
reduced
honey
productio
n,
reduced
livestock
produce
Hunger,
long
distance
mobility
for search
of food
grain
Unfavourabl
e location
and keeping
many
livestock
which has
been
becoming
the main
cause of
range land
shortage and
land
degradation
and
deforestatio
n
Dependency
on rain fed
agriculture,
unfavourable
location
sustainable
for farming
Coping
Strategy
Rotational
grazing for
pasture
problems,
driving
livestock
down to
Omo river
Use of wild
fruits and
leaves, sell
of shoats,
food grain
borrowing
from
vicinity
parent
relatives
14
Page 8 of 31

Wereda Disaster
Risk Profile
Data_Collected_Date
September 2010
Region S.N.N.P
Zone SOUTH OMO
Selected Indictor: Disaster Characteristics By Kebele
Kebele Name
Disaster_Type
Common Period
Year Occured
GEDBAK
Livestock
diseases
January,
February,
March, April
1967;1984-c
cpp;2000
Crop Pest
May, June
1998;1985;1
995
Disaster Risk Management
and Food Security Sector (DRMFSS)
Tuesday, September 30, 2014
Wereda HAMER
Worst_Year
Trends of
Effects
1984
Increased
2002
Increased
Root Causes Effects
Vulnerability
Lack of
vaccination
and
treatment,
regular
mobility due
to feed
shortage
Death of
livestock,
reduce of
livestock
produce,
food
shortage,
fail of
livestock
price
low
awareness
for livestock
management
, lack of
animal
health
service in
the PA
Late sowing
due to
shortage of
rain
Food
shortage,
hunger,
additional
expenditu
re for
food grain
Low
awareness to
use
pesticides
Coping
Strategy
Purchasing
drugs from
shop
keepers
(illegal),
purchasing
drugs from
veterinary
drug
venders
which are
located 42
to 56 km
from the PA
Smoking
crop farm
15
Page 9 of 31

Wereda Disaster
Risk Profile
Data_Collected_Date
September 2010
Region S.N.N.P
Zone SOUTH OMO
Selected Indictor: Disaster Characteristics By Kebele
Kebele Name
Disaster_Type
Common Period
Year Occured
KOLA KEJA
Droughts
January,
February,
March
1997;1995;2
000
Livestock
diseases
February,
April, May
1999;2000;1
984;1996
Disaster Risk Management
and Food Security Sector (DRMFSS)
Tuesday, September 30, 2014
Wereda HAMER
Worst_Year
1999
Trends of
Effects
Increased
1984 for
goats 2000
for sheep
Decreased
Root Causes Effects
Vulnerability
Rain shortage
,depletion of
grazing land
Increase
livestock
movement
for grazing,
lack of
veterinary
services, lack
of awareness
for
veterinary
services
Death of
cattle,
reduce of
livestock
produce,
hunger
(crop
failure),c
onflict for
grazing
competiti
on
Death of
cattle,
goats,
sheep
reduce of
livestock
produce
Livestock
produce
livelihood,
dependency
Lack of
awareness
for
vaccination,
increased
mobility in
search of
pasture and
water for
livestock
Coping
Strategy
Taking
livestock to
distant
areas for
grazing
Split herds
to reduce
diseases
distribution
and loss by
diseases,
change of
grazing
points
during
disease out
breaks
16
Page 10 of 31

Wereda Disaster
Risk Profile
Data_Collected_Date
September 2010
Region S.N.N.P
Zone SOUTH OMO
Selected Indictor: Disaster Characteristics By Kebele
Kebele Name
Disaster_Type
Common Period
Year Occured
KOLA KEJA
Conflicts
January,
February
1999;1993;2
000
MINOGELTI
Livestock
diseases
October,
November,
march
1984;2000
Disaster Risk Management
and Food Security Sector (DRMFSS)
Tuesday, September 30, 2014
Wereda HAMER
Worst_Year
1993
Trends of
Effects
Decreased
1984 for
CCPP, 2000
for sheep
Decreased
Root Causes Effects
Vulnerability
Completion
for grazing,
livestock
rustling for
livestock
acquisition
Increased
mobility for
search of
grazing to
boarder
areas
(Kenya)
Loss of
life, loss
of grazing
land, loss
of
livestock
by looters
Death of
shoats,
loss of
asset,
hunger,
food grain
shortage
and price
fall of
shoats
Regular
mobility in
search of
pasture to
boarder
areas due to
pasture land
deterioratio
n, lack of
awareness
on fodder
conservation
for prolongs
dry seasons
Lack of
awareness
on disease
prevention,
livestock
dependency
and
increased
mobility for
grazing
Coping
Strategy
Change of
grazing
areas when
conflict
arises,
replace
losses by
looting i.e.,
Livestock
looting by
looting
Restrict
movement,
isolation of
watering
and grazing
points, split
herds,
change of
grazing
points
17
Page 11 of 31

Wereda Disaster
Risk Profile
Data_Collected_Date
September 2010
Region S.N.N.P
Zone SOUTH OMO
Selected Indictor: Disaster Characteristics By Kebele
Kebele Name
Disaster_Type
Common Period
Year Occured
MINOGELTI
Droughts
December,
January
,February
1967;1977;1
998;2001
MRSHA
Droughts
December,
January,
February,
September
1997;1987;2
001
Disaster Risk Management
and Food Security Sector (DRMFSS)
Tuesday, September 30, 2014
Wereda HAMER
Worst_Year
1967 for
elders, and
1998 for
this adult
hood
Trends of
Effects
Increased
1977
Increased
Root Causes Effects
Vulnerability
Deteriorating
of rain fall
Prolonged
dry season,
shortage of
rainfall
hunger,
loss of
livestock,
loss of
asset,
livestock
feed and
water
shortage,
looting(liv
estock)
Hunger,
livestock
death,
reduce of
livestock
produce,
livestock
feed and
water
shortage,
crop
failure
Settlement
at unsuitable
areas for
rain fed
agriculture,
lack of
awareness
about
livestock
market
Dependency
rain fed
agriculture
and livestock
production ,
lack of
awareness
for livestock
market
Coping
Strategy
Use of
livestock
blood meal,
wild fruits
and leaves,
goat-grain
exchange
Livestock
sale
(shoats) for
grain,
begging
from well
off, wild
fruits and
leaves,
looting of
livestock
from their
relatives
18
Page 12 of 31

Wereda Disaster
Risk Profile
Data_Collected_Date
September 2010
Region S.N.N.P
Zone SOUTH OMO
Selected Indictor: Disaster Characteristics By Kebele
Kebele Name
Disaster_Type
Common Period
Year Occured
MRSHA
Livestock
diseases
April, Jan,
February
1976 (rinder
pest),1992;1
984 for
ccpp,2000
for sheep
Human diseases
May and
June=malaria
1,997
Disaster Risk Management
and Food Security Sector (DRMFSS)
Tuesday, September 30, 2014
Wereda HAMER
Worst_Year
1984
Trends of
Effects
Decreased
1997
Decreased
Root Causes Effects
Vulnerability
Increased
mobility for
search of
grazing due
to drought
They do not
know the
causes but
some said
high
environment
al temp
Death of
enormous
cattle
(rinder
pest
1976),ant
hrax=1992
,
perishing
of
goats=ccp
p (1984)
Some
deaths
and more
patients
Continuous
mobility for
searching of
grazing and
lack of
awareness
for fodder
conservation
during good
season
Coping
Strategy
Change of
grazing and
water
points, herd
split
Restrict
movement
of people
to disease
outbreak
areas and
water
points
19
Page 13 of 31
Wereda Disaster
Risk Profile
Data_Collected_Date
September 2010
Region S.N.N.P
Zone SOUTH OMO
Selected Indictor: Disaster Characteristics By Kebele
Kebele Name
Disaster_Type
Common Period
Year Occured
MRSHA
Crop Pest
May, June
1983;2002
SHANKO
Livestock
diseases
January,
February,
December
1986;1977;1
998;1997;20
00
Disaster Risk Management
and Food Security Sector (DRMFSS)
Tuesday, September 30, 2014
Wereda HAMER
Worst_Year
1983
Trends of
Effects
Increased
1977
Increased
Root Causes Effects
Vulnerability
Late sowing
due to delay
of belg rain
Drought
Damage
of crop at
fruit
stage,
hunger,
more
livestock
sale for
grain
Death of
livestock
reduces
of
livestock
produce,
hunger,
sell of
more
shoats,
and
reduce of
income
Unfavourabl
e location
for rain fed
agriculture,
lack of
awareness to
utilize
livestock
resource and
natural
resource
Coping
Strategy
Selling of
livestock
for grain,
use of wild
fruits and
leaves,
driving
livestock to
distant
grazing
areas
20
Page 14 of 31

Wereda Disaster
Risk Profile
Data_Collected_Date
September 2010
Region S.N.N.P
Zone SOUTH OMO
Selected Indictor: Disaster Characteristics By Kebele
Kebele Name
Disaster_Type
Common Period
Year Occured
SHANKO
Livestock
diseases
June, march,
February,
January,
December
1967;1984;2
000
Human diseases
April, march
for diarrea,for
gip every
month
no answer
Disaster Risk Management
and Food Security Sector (DRMFSS)
Tuesday, September 30, 2014
Wereda HAMER
Worst_Year
1984
Trends of
Effects
Increased
no answer
Increased
Root Causes Effects
Vulnerability
Increasing
mobility for
grazing and
feed
shortage
Death of
livestock,
reduce of
livestock
price,
hunger,
fall of
price
Low
awareness
for disease
control and
prevention
Lack of
sanitation
and
dependence
on livestock
produce
Loss of
body
condition,
discomfor
t
Usual
consumption
of livestock
produce, use
of any water
sources
Coping
Strategy
No coping
except
restrict
movement
for grazing
and
watering to
disease
source
areas, bring
livestock
for
treatment
and
vaccination
No coping
21
Page 15 of 31

Wereda Disaster
Risk Profile
Data_Collected_Date
September 2010
Region S.N.N.P
Zone SOUTH OMO
Selected Indictor: Disaster Characteristics By Kebele
Kebele Name
Disaster_Type
Common Period
Year Occured
DEGA KEJA
Droughts
January,
February,
March, May,
June, July,
December
1977;1986;1
998;1999;20
01
Livestock
diseases
January, May,
June, April
February
1967;1984;1
986;1992;20
00
Disaster Risk Management
and Food Security Sector (DRMFSS)
Tuesday, September 30, 2014
Wereda HAMER
Worst_Year
1977
Trends of
Effects
Increased
1984
Increased
Root Causes
Shortage of
rain fall
Lack of
animal
health
services in
the PA,
regular
mobility for
search of
grazing
Effects
Vulnerability
Hunger;
reduce of
livestock
produce,
sell of
more
shoats,
and too
distant
mobility
for
grazing
Death of
livestock,
livestock
price fall,
hunger
due to
price fall
Livestock
produce
dependency
and
unfavourable
location for
rain fed
agriculture
Low
awareness
on livestock
disease
prevention
and control,
unrestricted
movement
for grazing
and water
points
Coping
Strategy
Selling of
livestock
for food
grain,
driving
livestock
for search
of grazing
Split
herding and
keeping a
number of
livestock,
regular
shifting of
grazing and
watering
points
22
Page 16 of 31

Wereda Disaster
Risk Profile
Data_Collected_Date
September 2010
Region S.N.N.P
Zone SOUTH OMO
Selected Indictor: Disaster Characteristics By Kebele
Kebele Name
Disaster_Type
Common Period
Year Occured
DEGA KEJA
Human diseases
May, June,
July, February
1977_1988m
alaria,1995
meningits
QUARO
Droughts
January,
February, July,
august, June,
September,
October
1997;1967;1
999;2001
Disaster Risk Management
and Food Security Sector (DRMFSS)
Tuesday, September 30, 2014
Wereda HAMER
Worst_Year
1995 for
meningsts
and 1981
for malaria
Trends of
Effects
Increased
2002;1999
Increased
Root Causes Effects
Vulnerability
Lack of
health
services in
the PA, lack
of mosquito
net
Shortage of
rain fall, un
timely
flooding for
flood retreat
agriculture
Death,
loss of
body
condition,
discomfor
t
Livestock
and water
shortage,
hunger,
loss of
livestock
for sell of
crop
Lack of
mosquito net
and health
services for
malaria,
dependency
on livestock
produce for
hip
Coping
Strategy
No coping
for human
disease
For
livestock
feed
shortage,
migrating
with
livestock to
pasture
areas,
selling of
shoats and
purchase
grain
23
Page 17 of 31

Wereda Disaster
Risk Profile
Data_Collected_Date
September 2010
Region S.N.N.P
Zone SOUTH OMO
Selected Indictor: Disaster Characteristics By Kebele
Kebele Name
Disaster_Type
Common Period
Year Occured
QUARO
Floods
may, October
1999;2002
Disaster Risk Management
and Food Security Sector (DRMFSS)
Tuesday, September 30, 2014
Wereda HAMER
Worst_Year
1999 EC
Trends of
Effects
Increased
Root Causes Effects
Vulnerability
high rain fall
at high land
areas,
irrigation
from
extension
(deforestatio
n)
Crop
damage,
damage
of house
propertie
s,
displacem
ent,
logging of
pasture
land
Settlement
beside the
river for
suitability of
flood retreat
agriculture
Coping
Strategy
Leave the
area for a
month
(shift
settlement)
after the
incidence
of flooding,
shift
livestock to
flood free
areas
24
Page 18 of 31

Wereda Disaster
Risk Profile
Data_Collected_Date
September 2010
Region S.N.N.P
Zone SOUTH OMO
Selected Indictor: Disaster Characteristics By Kebele
Kebele Name
Disaster_Type
Common Period
Year Occured
QUARO
Conflicts
January,
February,
march
1984;1995;1
999;2000
Livestock
diseases
January,
February,
April, October
1968;1984;2
002
Disaster Risk Management
and Food Security Sector (DRMFSS)
Tuesday, September 30, 2014
Wereda HAMER
Worst_Year
1984
Trends of
Effects
Increased
1984
(CCPP)
Increased
25
Root Causes Effects
Vulnerability
Competition
of grazing
with Borena
pastoralists
increased
mobility for
ccpp and
tryponomiasi
s
Loss of
human
life,
looting of
livestock,
livestock
feed and
water
shortage,
increased
mobility
and
conflict
with the
other
rival
ethnics
Reduce of
livestock
produce,
death of
livestock,
hunger
Dependency
on livestock
resource and
mobility for
grazing
High
mobility for
search of
grazing and
watering
points, low
awareness
for disease
control and
prevention
methods
Coping
Strategy
Changing
grazing
areas,
looting to
replace
looted
livestock
Frequent
change of
grazing and
water
points;
restrict
movement
to source of
infection
areas
Page 19 of 31
Wereda Disaster
Risk Profile
Data_Collected_Date
September 2010
Region S.N.N.P
Zone SOUTH OMO
Selected Indictor: Disaster Characteristics By Kebele
Kebele Name
Disaster_Type
Common Period
Year Occured
GEDBAK
Droughts
February,
march, may,
1967;1977;1
986;1997;20
00;2001
LALA
Livestock
diseases
January to
March; and
December to
October
1967 rinder,
1984 ccpp,
2000 and
1993
anthrax
Crop Pest
May, June
2002
Disaster Risk Management
and Food Security Sector (DRMFSS)
Tuesday, September 30, 2014
Wereda HAMER
Worst_Year
Trends of
Effects
1977
Increased
1967
rinder,
1984 ccpp,
2000 sheep
disease
Increased
2002
Increased
Root Causes Effects
Vulnerability
shortage of
rain at belg
season
Feed
shortage and
regular
mobility for
search of
grazing due
to disease
source areas
Rain shortage
and un
timely
sowing (late
sowing)
Hunger,
loss of
asset, loss
of body
condition,
sells of
shoats or
total loss
Death of
livestock,
livestock
price fall,
food grain
shortage
and
hunger,
loss of
asset
Food
grain
shortage
Dependency
on crop
production,
unfavourable
location/sett
lement, lack
of shoats for
more
community
members
Livestock
livelihood
dependency,
shortage of
feed and
regular
mobility for
search of
livestock
feed and
water
Low
awareness to
use
pesticides
Coping
Strategy
Selling
shoats,
begging of
food grain
from
relatives or
friends (
Frequent
change of
grazing
areas, split
herds to
reduce risk
No any type
of coping
mechanism
for crop
pests
26
Page 20 of 31

Wereda Disaster
Risk Profile
Data_Collected_Date
September 2010
Region S.N.N.P
Zone SOUTH OMO
Selected Indictor: Disaster Characteristics By Kebele
Kebele Name
Disaster_Type
Common Period
Year Occured
SHESHA GOYKE
Droughts
December,
January
,February,
October
1977;1987;1
998;1990;20
00;2001
Livestock
diseases
December,
January
,February,
April for tick
1984;2000
Disaster Risk Management
and Food Security Sector (DRMFSS)
Tuesday, September 30, 2014
Wereda HAMER
Worst_Year
Trends of
Effects
2001
Increased
1984 for
ccpp 2000 f
Increased
Root Causes Effects
Vulnerability
shortage of
rain
mobility for
search of
grazing/to
disease
source
areas(unkno
wn areas)
Hunger,
conflict,
sell of
more
livestock,
mobility
of search
of
livestock
feed and
water
Death of
livestock,
hunger,
price fall
of shoats
Settlement
of unsuitable
area for
agriculture,
livestock
livelihood
dependency
Low
awareness
for
prevention
and control
of diseases
Coping
Strategy
Goat-grain
exchange,
mobility for
search of
grazing,
rearing of
many
livestock to
replace
loss, split
herding
Swift
change of
outbreak
areas, split
herding
27
Page 21 of 31

Wereda Disaster
Risk Profile
Data_Collected_Date
September 2010
Region S.N.N.P
Zone SOUTH OMO
Selected Indictor: Disaster Characteristics By Kebele
Kebele Name
Disaster_Type
Common Period
Year Occured
BESSA MEJAN
Droughts
January,
February,
March,
December,
September
1997;1999;2
001;1992;19
95
Conflicts
January,
February,
August,
September
1997;1999;1
985;1987;20
01;(all
Disaster Risk Management
and Food Security Sector (DRMFSS)
Tuesday, September 30, 2014
Wereda HAMER
Worst_Year
2001
Trends of
Effects
Increased
1987
Increased
Root Causes Effects
Vulnerability
Shortage of
rain
Competition
for grazing,
livestock
looting
Hunger,
livestock
feed
shortage,
death of
livestock,
conflict,
and loss
of
livestock
Loss of
livestock,
death of
communit
y
members,
grazing
and water
point
shortage
Livestock
livelihood
dependency,
rival ethnic
boarder
settlement
Livestock
resource
dependency
and grazing
and watering
shortage as
a result of
drought
Coping
Strategy
Exchange
grain for
livestock
produce,
selling of
livestock
for grain
purchase
Changing of
grazing
points when
conflict
arises,
livestock
rustling to
replace loss
by looting
28
Page 22 of 31

Wereda Disaster
Risk Profile
Data_Collected_Date
September 2010
Region S.N.N.P
Zone SOUTH OMO
Selected Indictor: Disaster Characteristics By Kebele
Kebele Name
Disaster_Type
Common Period
Year Occured
BESSA MEJAN
Livestock
diseases
April, May
August,
January,
February
1998;1984;2
001;2000
SHANKO 2
Droughts
December,
January,
February
1977;1984;1
998;2000
Disaster Risk Management
and Food Security Sector (DRMFSS)
Tuesday, September 30, 2014
Wereda HAMER
Worst_Year
1984 for
ccpp, 2000
Trends of
Effects
Increased
Root Causes
Mobility to
source of
disease for
search of
grazing
Effects
Vulnerability
Death of
goats and
sheep
Regular
mobility and
lack of
awareness
on disease
prevention
1984
Increased
The death of
livestock due
to shortage
of rain
Hunger,
livestock
death
Dependency
on rain fed
agriculture
Coping
Strategy
Herd
splitting at
different
grazing
points to
reduce loss,
change of
grazing and
watering
points
during
outbreak
Selling of
high
number of
livestock to
purchase
crop foods,
growing
drought
tolerant
fruits and
vegetables
29
Page 23 of 31

Wereda Disaster
Risk Profile
Data_Collected_Date
September 2010
Region S.N.N.P
Zone SOUTH OMO
Selected Indictor: Disaster Characteristics By Kebele
Kebele Name
Disaster_Type
Common Period
Year Occured
SHANKO 2
Livestock
diseases
January ,
February, April
1984;1996;1
999
WENBAYNO
Human diseases
Malaria every
year, tetanus
some times
1995;1996;1
999
Droughts
January,
February,
march
1995
Disaster Risk Management
and Food Security Sector (DRMFSS)
Tuesday, September 30, 2014
Wereda HAMER
Worst_Year
1984; 2001
Trends of
Effects
Increased
1996
Increased
1999
Increased
Root Causes Effects
Vulnerability
Unrestricted
livestock
movement
for grazing
and water
point
Headache
Recurrent
drought or
prolonged
dry, range
land
degradation
Death of
livestock,
reduce of
livestock
productio
n
Death of
human
beings
loss of
livestock
,conflict
and
movemen
t to
distant
areas
Lack of
awareness
and shortage
of drugs
Lack of
awareness of
awareness
drinking of
water
Lack of
awareness
how to
utilize
livestock
asset
Coping
Strategy
Keeping of
high
number of
livestock to
reduce risk
No coping
for human
disease
Poaching,
use of wild
fruits and
leaves,
exchanging
grain with
shoats,
selling
livestock to
purchase
grain
30
Page 24 of 31

Wereda Disaster
Risk Profile
Data_Collected_Date
September 2010
Region S.N.N.P
Zone SOUTH OMO
Selected Indictor: Disaster Characteristics By Kebele
Kebele Name
Disaster_Type
Common Period
Year Occured
WENBAYNO
Livestock
diseases
January,
February
1995
HEDBAK
Droughts
January,
February,
March, June,
July, August,
September
1984;1996;2
000;1977
Disaster Risk Management
and Food Security Sector (DRMFSS)
Tuesday, September 30, 2014
Wereda HAMER
Worst_Year
1999
Trends of
Effects
Increased
1986;1977
Increased
Root Causes Effects
Vulnerability
Range land
encroachmen
t, over
grazing,
livestock
increment,
pasture land
degradation
Shortage of
rain at belg
season
Loss of
livestock
produce
and
productio
n,
encroach
ment of
national
parks and
conflict
Hunger,
long
distance
mobility
for search
of food
grain
Lack of
awareness to
conserve
fodder,
dependency
on livestock
livelihood
only
Dependency
on rain fed
agriculture,
unfavourable
location
sustainable
for farming
Coping
Strategy
Driving
livestock to
distant
areas
where grass
and water
are
available
(even in
park areas)
Use of wild
fruits and
leaves, sell
of shoats,
food grain
borrowing
from
vicinity
parent
relatives
31
Page 25 of 31

Wereda Disaster
Risk Profile
Data_Collected_Date
September 2010
Region S.N.N.P
Zone SOUTH OMO
Selected Indictor: Disaster Characteristics By Kebele
Kebele Name
Disaster_Type
Common Period
Year Occured
HEDBAK
Livestock
diseases
January,
February,
March, April
1967;1984-c
cpp;2000
Crop Pest
May, June
1998;1985;1
995
ADAMIE
Droughts
August
1999;2001
Disaster Risk Management
and Food Security Sector (DRMFSS)
Tuesday, September 30, 2014
Wereda HAMER
Worst_Year
1984
Trends of
Effects
Increased
2002
Increased
1999
Decreased
Root Causes Effects
Vulnerability
Lack of
vaccination
and
treatment,
regular
mobility due
to feed
shortage
Death of
livestock,
reduce of
livestock
produce,
food
shortage,
fail of
livestock
price
Ticks
increased
Late sowing
due to
shortage of
rain
Shortage of
rain falls at
high land
areas for
brim over of
Omo river
Food
shortage,
hunger,
additional
expenditu
re for
food grain
Damage
of crop,
hunger
Low
awareness to
use
pesticides
Dependency
on recession
agriculture
Coping
Strategy
Purchasing
drugs from
shop
keepers
(illegal),
purchasing
drugs from
veterinary
drug
venders
which are
located 42
to 56 km
from the PA
Smoking
crop farm
Fishing,
purchasing
food grain
from money
collected
from tourist
32
Page 26 of 31

Wereda Disaster
Risk Profile
Data_Collected_Date
September 2010
Region S.N.N.P
Zone SOUTH OMO
Selected Indictor: Disaster Characteristics By Kebele
Kebele Name
Disaster_Type
Common Period
Year Occured
ADAMIE
Conflicts
October,
November,
December
1997;1998;2
000
Livestock
diseases
January, April
February
1992;1998;2
000;2001
Disaster Risk Management
and Food Security Sector (DRMFSS)
Tuesday, September 30, 2014
Wereda HAMER
Worst_Year
Trends of
Effects
1997
Increased
2000
Increased
Root Causes Effects
Vulnerability
Competition
for recession
(flood reside)
crop farming,
avenge
killing
Mingling of
hammer
goats w/ch
have come
for grazing
due to
shortage of
pasture at
hammer area
Loss of
life, loss
of crop
productio
n due to
farming
small
farm land
loss of
livestock
(goats
and
sheep)
Farmers
along Omo
River
Coping
Strategy
Farm their
own land
taking
precautions
, farming at
night
33
Page 27 of 31

Wereda Disaster
Risk Profile
Data_Collected_Date
September 2010
Region S.N.N.P
Zone SOUTH OMO
Selected Indictor: Disaster Characteristics By Kebele
Kebele Name
Disaster_Type
Common Period
Year Occured
MURALE
Floods
may
,November
1999;2002
Crop Pest
October
1999;2001
Disaster Risk Management
and Food Security Sector (DRMFSS)
Tuesday, September 30, 2014
Wereda HAMER
Worst_Year
1999
Trends of
Effects
Increased
2001
Increased
Root Causes Effects
Vulnerability
High rain fall
at high land
areas,
farming
alongside
Woito river,
deforestation
Un timely
sowing,
(delay on
sowing due
to untimely
flooding)
Displacem
ent,
damage
of crop,
damage
of house
utensils,
logging of
grazing
places,
malaria
Crop
damage;
reduce of
crop
produce,
hunger,
sell of
shoats for
crop
Living and
farming
alongside
rivers
Dependency
of flood
recession
agriculture
Coping
Strategy
Shift
temporary
settlement
areas in the
same pa,
shifting
livestock to
flood risk
free areas
Re-sowing
after the
flood
retreats,
sell shoats
to purchase
crops
34
Page 28 of 31

Wereda Disaster
Risk Profile
Data_Collected_Date
September 2010
Region S.N.N.P
Zone SOUTH OMO
Selected Indictor: Disaster Characteristics By Kebele
Kebele Name
Disaster_Type
Common Period
Year Occured
MURALE
Livestock
diseases
January,
February,
September,
October,
December
1995;1997;1
998;1999;19
84;2000
Disaster Risk Management
and Food Security Sector (DRMFSS)
Tuesday, September 30, 2014
Wereda HAMER
Worst_Year
1984
Trends of
Effects
Increased
Root Causes Effects
Vulnerability
Frequent
mobility for
search of
grazing,
grazing place
beside Woito
river, grazing
at swampy
area
Death of
livestock,
increased
expenditu
re for
drugs,
loss asset,
hunger,
livestock
price fall
Unavailabilit
y of
alternate
grazing
areas
Coping
Strategy
There is no
any coping
mechanism
for
livestock
disease
incidences
except
taking the
sick to
animal
health
services
35
Page 29 of 31

Wereda Disaster
Risk Profile
Data_Collected_Date
September 2010
Region S.N.N.P
Zone SOUTH OMO
Selected Indictor: Disaster Characteristics By Kebele
Kebele Name
Disaster_Type
Common Period
Year Occured
MURALE
Conflicts
January,
February,
1984;1995
Disaster Risk Management
and Food Security Sector (DRMFSS)
Tuesday, September 30, 2014
Wereda HAMER
Worst_Year
1984
Trends of
Effects
Decreased
Root Causes Effects
Vulnerability
Killing in
revenge,
competition
for grazing,
for livestock
acquisition
Death
from
family
members,
livestock
raid
(looting),
instability
Sharing
grazing
areas with
rival ethnic
groups,
increased
mobility for
grazing and
dependency
on livestock
production
36
Coping
Strategy
Frequent
shifting of
grazing
places
when
conflict
arises,
resolve
conflict by
discussion,
foot print
reading to
reduce
attacks
from rival
ethnic ie
Scouting
boarders
and foot
print
reading(ide
ntify foot
prints of
rival
ethnics to
prevent
livestock
and human
Page 30 of 31

Wereda Disaster
Risk Profile
Disaster Risk Management
and Food Security Sector (DRMFSS)
Data_Collected_Date
September 2010
Tuesday, September 30, 2014
Region S.N.N.P
Zone SOUTH OMO
Wereda HAMER
Selected Indictor: Disaster Characteristics By Kebele
Kebele Name
Disaster_Type
Common Period
Year Occured Worst_Year
Trends of
Effects
Root Causes
Effects
IMPORTANT: The years and months mentoned in this report are according to Ethiopian Calendar (EC).
Vulnerability
Coping
Strategy
life loss)
37
Page 31 of 31
Wereda Disaster
Risk Profile
Data_Collected_Date
September 2010
Region S.N.N.P
Zone SOUTH OMO
Selected Indictor: Hazards: Conflict as an Issue
KebeleName
HEDBAK
Description_Of_Conflict
There is conflict over farm land and grazing land
resource
SHANKO
DEGA KEJA
SHANKO 2
BESSA MEJAN
MINOGELTI
QUARO
KOLA KEJA
ERBORE
There is no any conflict over land resources
owing to available vast vacant land resource
There is no conflict for land resource among the
community but there is conflict over farm land
between Gnangatom and Kara community
There is no any conflict among this community
over land other resources
There is no conflict among the community over
land and other resources
There is no conflict among the community over
land and other resources
There is no any type of conflict over cultivating
or grazing lands
There is no any type of conflict over farm land or
grazing land resource in the area
There is conflict over farm land resources due to
shortage of fertile crop land
LALA
For the time being there is no as such prominent
conflict over farm and grazing land resources but
we are afraid of future due to increasing
population and farm extension
Disaster Risk Management
and Food Security Sector
Tuesday, September 30, 2014
Wereda HAMER
Change_In_Last_Decade
There is great change on the level
of conflict owing to farm land
problems
No change at all
The conflict is on and off and
difficult to forecast about the
situation
No change
No change
No change happens yet
Main_Causes_Of_Conflict
No change since this year
There is great change before 15_20
year’s conflict for farm land was
not usual but now it becomes usual
There is slight change; minor
conflicts are rising for farm land
extension
38
Page 1 of 2

Wereda Disaster
Risk Profile
Data_Collected_Date
September 2010
Region S.N.N.P
Zone SOUTH OMO
Selected Indictor: Hazards: Conflict as an Issue
KebeleName
ERIYA
Description_Of_Conflict
Conflict is not usual among this community over
land and other resources
MRSHA
GEDBAK
WENBAYNO
ADAMIE
MURALE
ASELE
Conflict over farm land resources have started
b/n these five years owing to farm and grazing
land shortage
There is no conflict among the PA community and
vicinity PA over farm land and grazing land
competition except conflict for grazing with
Borena ethnics
There is no conflict for land resource among the
community but there is conflict over farm land
between Gnangatom and Kara community
There is no any type of conflict over cultivating
or grazing lands
There is no conflict among the pa community and
vicinity pa for farm land and grazing land
competition except conflict for grazing with
Borena ethnics
Disaster Risk Management
and Food Security Sector
Tuesday, September 30, 2014
Wereda HAMER
Change_In_Last_Decade
Increasing theft which is unusual is
the only change among the
community (theft of honey from
bush bee hives)
There was no any type of conflict
over land resources before 10 to 15
years
There is no significant change
Main_Causes_Of_Conflict
The conflict is on and off and
difficult to forecast about the
situation
There is no significant change
39
Page 2 of 2

Wereda Disaster
Risk Profile
Disaster Risk Management
and Food Security Sector (DRMFSS)
Data_Collected_Date
September 2010
Tuesday, September 30, 2014
Region S.N.N.P
Zone
SOUTH OMO
Wereda
HAMER
Selected Indicator: Hazard Situation During Last Disaster - Characteristics of most recent disasters that affected the community
KebeleName
Types of Disasters
Hazard_Description
Effect_Of_Disaster
Most_Severly_Affected
Reason
HEDBAK
SHANKO
Hunger is the usual
disaster affecting the
community
It has affected all the community
throughout the year until the second
harvest season
Hunger, livestock feed
and water shortage,
livestock production
decrease
Through the year except some
months b/c of rain fall shortage
Hunger, loss of body
condition, sale of
shoats to purchase
grains and long
distance mobility to
beg or borrow food
grains from relatives
or the same clan
Food shortage for
human being,
livestock death,
selling high number of
livestock, hunger,
body loss of human
being malnutrition,
mobility with their
livestock
The poor and elders who
do not have relatives
were the most affected
group
All the groups of the
community
Lack of resource
and lack of strength
to find food grain
either by borrowing
or begging
Because during
drought, the price
of food crops
increases and
livestock product
decreases, and high
dependency on
livestock
production
40
Page 1 of 7

Wereda Disaster
Risk Profile
Disaster Risk Management
and Food Security Sector (DRMFSS)
Data_Collected_Date
September 2010
Tuesday, September 30, 2014
Region S.N.N.P
Zone
SOUTH OMO
Wereda
HAMER
Selected Indicator: Hazard Situation During Last Disaster - Characteristics of most recent disasters that affected the community
KebeleName
DEGA KEJA
SHANKO 2
Types of Disasters
Food grain shortage,
livestock feed and
water shortage and
livestock disease
Hazard_Description
Food shortage has been occurred in
all communities regardless of income
level for the last seven years except
2002 CCPP and un specific sheep
disease outbreak have affected on
shoat owners for a year( one year)
Drought(food crop,
livestock feed and
water shortage)
All shako kebele community have
been affected through the year
except 6 months that were covered
(supported) by relief food
Effect_Of_Disaster
Loss of shoats, sale of
more shoats for grain,
hunger and loss of
body condition, lack
of resistance,
livestock feed and
water shortage
,dispute among
government officials
owing to poaching and
park encroachment
(Mago park for
grazing)
Hunger, sell of more
shoats to feed
households and poor
relatives, too distant
areas mobility for
search of grazing and
watering points
reduce of income
from honey sell, milk
and products sell
Most_Severly_Affected
The poor who are not
included in PSNP
The poor who are not
include in PSNP and
haven’t wealthy
relatives been affected
severely
Reason
Lack of shoats for
sell to purchase
food grain (for
hunger),availability
of small stock,
Lack of livestock
for sale or lack of
shoats for sale
and/or grain
exchange
41
Page 2 of 7

Wereda Disaster
Risk Profile
Disaster Risk Management
and Food Security Sector (DRMFSS)
Data_Collected_Date
September 2010
Tuesday, September 30, 2014
Region S.N.N.P
Zone
SOUTH OMO
Wereda
HAMER
Selected Indicator: Hazard Situation During Last Disaster - Characteristics of most recent disasters that affected the community
KebeleName
BESSA MEJAN
MINOGELTI
SHESHA GOYKE
Types of Disasters
Hunger, livestock feed
and water shortage
Hazard_Description
All pa community have been affecting
for more than 10 years by the effect
of drought
Unspecific sheep
disease that introduced
from Kenya and CCPP
Food shortage,
livestock feed and
water shortage and
newly introduced
sheep disease
All shoat owners in the pa are equally
affected all flock for some
pastoralized perished out and remain
without sheep CCPP has the
prevalence of 20 years by on and off
outbreak killing goats the new sheep
disease has also 2 years duration still
with high incidence as though the
incidence of CCPP is reducing
All community were affected by food
shortage and all sheep and livestock
owners were affected by feed and
water shortage and newly introduced
disease almost all year round except
for some months that we got relief
food and support for PSNP for food s
Effect_Of_Disaster
Hunger, more sell of
main livelihood
(livestock for
grain),reduce of
livestock produce and
productivity ,conflict
with rival ethnics
(Dasenech and
Gnangatom)
Reduce number of
shoats which are the
main sources of food
grain, lack of
confidence to resist
drought
Hunger, sell of more
shoats, death of
almost all sheep
population in the pa,
increase mobility for
feed and water,
conflict for
competition for
grazing
Most_Severly_Affected
All were affected by the
effects of prolonged
drought without
exception on level of
living standard
Shoat owners having
small number were the
most affected
The poor were affected
severely except PSNP
beneficiaries whom have
got support for 8 months
in PSNP
Reason
Livestock main stay
dependency and
lack of alternatives
to support livestock
produce to mitigate
hunger, lack of
awareness on
livestock resource
utilization
Keeping small
number of shoats
owing to depletion
of these resources
as a result of
recurrent sells and
exchange for grain
to alleviate hunger
Lack of livestock to
exchange for grain
and or sell for grain
purchase
42
Page 3 of 7

Wereda Disaster
Risk Profile
Disaster Risk Management
and Food Security Sector (DRMFSS)
Data_Collected_Date
September 2010
Tuesday, September 30, 2014
Region S.N.N.P
Zone
SOUTH OMO
Wereda
HAMER
Selected Indicator: Hazard Situation During Last Disaster - Characteristics of most recent disasters that affected the community
KebeleName
Types of Disasters
Hazard_Description
Effect_Of_Disaster
Most_Severly_Affected
Reason
QUARO
KOLA KEJA
ERBORE
Flooding
Drought(livestock feed
shortage and hunger)
44 household heads having 223
families were displaced for 2 months
and more than 450 household heads
crop land was damaged
All pa livestock’s were affected by
prolonged dry seasons for the last
seven years and more except 2002 all
communities were failed short of
livestock produce and food, however
there was food support from the
government
Flooding
All kuyle settlement (44 household
villages) was flooded for 25 days
Displacement for
30_45 days, damage
of crops, logging of
pasture land
Loss of livestock to
purchase food grain
(sell of many
livestock), hunger,
loss of body condition,
reduce of income,
reduce of livestock
produce and livestock
Lack of grazing points,
lack of water for
human, damage of
byre ,restrict usual
mobility
All communities that
settle near Woitor river
were affected without
exception in age and
level of living
Since all the community
livelihood is based on
livestock production, the
effect of drought is for
all, however the poor
are supported by PSNP
All community members
were affected equally
without exception
Settlement beside
the river to utilize
flood reside
agriculture
Livestock produce
and production
dependency and
lack of awareness
on livestock asset
saving during good
seasons were the
main reasons for
these people being
affected in mass
without exception
43
Page 4 of 7
Wereda Disaster
Risk Profile
Disaster Risk Management
and Food Security Sector (DRMFSS)
Data_Collected_Date
September 2010
Tuesday, September 30, 2014
Region S.N.N.P
Zone
SOUTH OMO
Wereda
HAMER
Selected Indicator: Hazard Situation During Last Disaster - Characteristics of most recent disasters that affected the community
KebeleName
LALA
ERIYA
Types of Disasters
Hunger and livestock
diseases (anthrax,
CCPP, and unspecific
sheep disease still
affecting several sheep
of each herder)
Hazard_Description
Hunger has been affecting all
community for the last seven years
there was also several anthrax
outbreak in 1993 which affected
many livestock including herders at
grazing areas during dry seasons it
has been affected for 3 months
Recurrent drought is
regular disaster of this
community
Food shortage was affecting all the
community in the pa for the last
seven years particularly penniless
who are not included in PSNP
livestock feed and water shortage
has also affected all herds equally for
the last 10 years
Effect_Of_Disaster
Hunger, loss of body
condition ,increased
vulnerability for
malaria attack or
infection ,loss of
livestock selling for
grain, long distance
mobility for search
food grain and
livestock feed conflict
with park scouts owing
to poaching to reduce
hunger, death of more
than 200 cattle
Hunger, sell of more
livestock resource to
mitigate hunger, long
distance mobility for
grazing and conflict in
park areas and buffer
zones
Most_Severly_Affected
The poor herders having
small number of
livestock and elders who
dont have relatives were
severely affected
Aged group, children and
penniless were the most
affected
Reason
Lack of livestock
resource and any
other resource for
grain purchase
herders having
small number of
livestock were also
affected by disease
that has killed 3/4
of his own
It was easy for
young to find food
resources rather
than elders as
hunting and other
activities the
well-being was also
purchasing grain
selling their
livestock resources
44
Page 5 of 7

Wereda Disaster
Risk Profile
Disaster Risk Management
and Food Security Sector (DRMFSS)
Data_Collected_Date
September 2010
Tuesday, September 30, 2014
Region S.N.N.P
Zone
SOUTH OMO
Wereda
HAMER
Selected Indicator: Hazard Situation During Last Disaster - Characteristics of most recent disasters that affected the community
KebeleName
MRSHA
Types of Disasters
Hunger, livestock feed
and water shortage,
livestock death
(drought)
Hazard_Description
It has affected all the community
regardless of the level of living
standard
GEDBAK
Food grain shortage
was the disaster of this
community
It has been affected all the
community for one year until crop
harvested
Effect_Of_Disaster
Hunger, loss of
livestock asset
(reduce), sell of a
number of shoats to
purchase grain
competition for
grazing with rival
ethnic groups and
flare up of conflict
Hunger, long distance
mobility for search of
food grain,
debilitation, sell of
shoats and total loss,
taking loan beyond
capacity
Most_Severly_Affected
The penniless and
medium class in wealth
were affected most
The poor who are not
included in PSNP and
elders
Reason
The poor didnt have
access for grain
owing to absence of
livestock and the
medium wealthy
class livestock were
affected more
Lack of surplus
asset and lack of
well-being relative
or neighbours that
have surplus
resources
45
Page 6 of 7

Wereda Disaster
Risk Profile
Disaster Risk Management
and Food Security Sector (DRMFSS)
Data_Collected_Date
September 2010
Tuesday, September 30, 2014
Region S.N.N.P
Zone
SOUTH OMO
Wereda
HAMER
Selected Indicator: Hazard Situation During Last Disaster - Characteristics of most recent disasters that affected the community
KebeleName
ASELE
WENBAYNO
Types of Disasters
Recurrent drought and
livestock disease are
the main constraints of
this community and
also food grain and
livestock feed shortage
and diseases of
livestock
Hazard_Description
We have been affected by food grain
and livestock feed shortage and
livestock diseases for the last 10
years due to shortage and erratic
distribution of belg rain fall
Drought (hunger,
livestock feed and
water shortage)
Shortage of food, livestock feed and
water shortage are our usual
problems for the last 10 years due to
erratic and scant rain fall
Effect_Of_Disaster
Loss of livestock by
selling more for food
grain and death by
feed shortage and
disease attacks ,loss
of body condition and
lack of resistance for
diseases long distance
a
Most_Severly_Affected
The poor who are not
included in PSNP and
elders
Hunger, sale of
numerous livestock to
meet family food
requirement and
reduce income due to
less productivity of
livestock
The poor who are not
included in PSNP and
elders
Reason
Lack of livestock
resource for grain
exchange and lack
of relative who
could support
them, lack of
strength to travel
too distance areas
either for search of
wild fruits or
begging food grain
from having
Lack of extra assets
and being low
economic class in
the community
46
Page 7 of 7
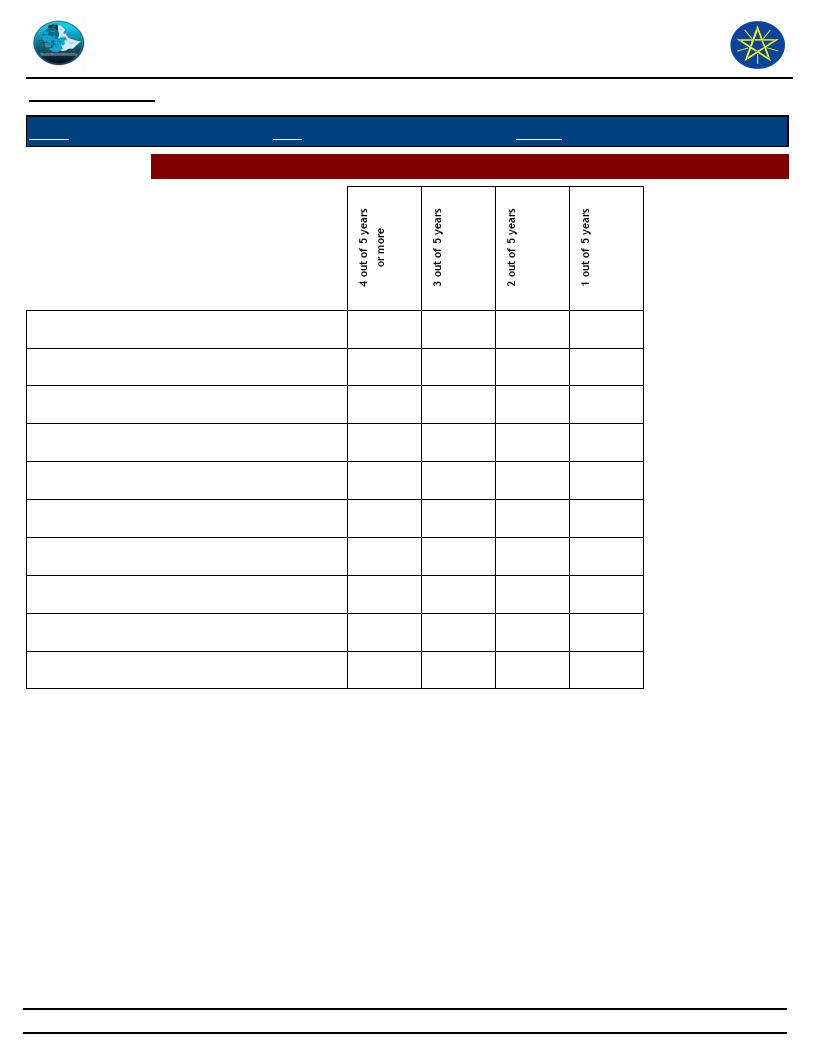
Wereda Disaster
Risk Profile
Data_Collected_Date
September 2010
Disaster Risk Management
and Food Security Sector (DRMFSS)
Tuesday, September 30, 2014
Region S.N.N.P
Zone SOUTH OMO
Selected Indictor: Frequency of Disaster Occurrence
Wereda HAMER
Conflicts
Crop diseases
Droughts
Economic / Price shock
Floods
Heavy Rain
Human diseases
Landslides
Livestock diseases
Storms / Cyclone/hail storm
45.00
10.00
57.00
92.00
1.00
57.00
9.00
12.00
50.00
29.00
46.00
23.00
26.00
14.00
19.00
50.00
36.00
18.00
16.00
14.00
8.00
63.00
41.00
50.00
36.00
50.00
8.00
28.00
7.00
9.00
14.00
31.00
16.00
47
Page 1 of 1
Wereda Disaster
Risk Profile
Data_Collected_Date
September 2010
Disaster Risk Management
and Food Security Sector (DRMFSS)
Tuesday, September 30, 2014
Region
S.N.N.P
Zone
SOUTH OMO
Selected Indictor:
Household Exposure to Hazards
Wereda
HAMER
Disaster Type
Droughts
Floods
Landslides
General_Exposure
29.00
4.26
0.05
Last_Five_Years_Exposure
31.10
4.55
0.16
Crop diseases
Livestock diseases
Human diseases
Storms / Cyclone/hail storm
Heat waves/ High temp
Conflicts
Economic / Price shock
19.30
26.70
14.10
0.24
0.33
5.50
0.53
20.20
27.10
11.30
0.10
0.36
4.29
0.67
Forest Fires
0.05
48
Page 1 of 1
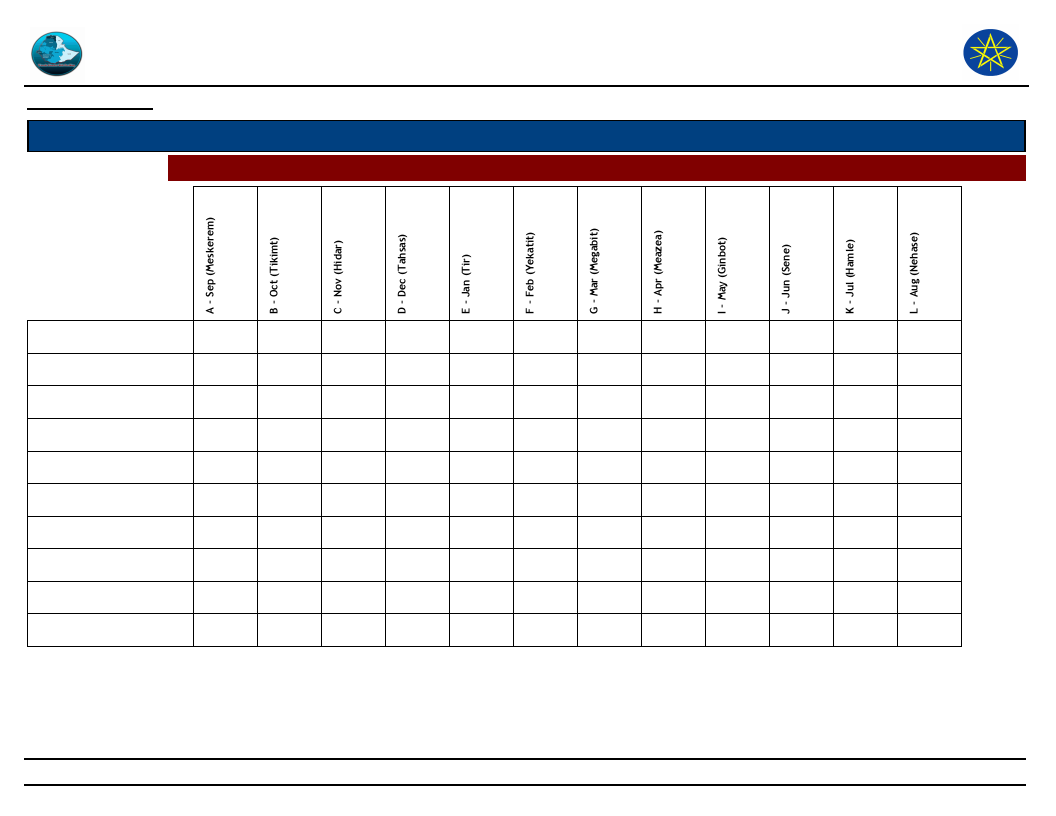
Wereda Disaster
Risk Profile
Data_Collected_Date
September 2010
Region S.N.N.P
Selected Indictor:
Zone SOUTH OMO
Months of Occurrence of Frequent Disasters
Disaster Risk Management
and Food Security Sector
Tuesday, September 30, 2014
Wereda HAMER
Conflicts
Crop diseases
Droughts
Economic / Price shock
Floods
Heavy Rain
Human diseases
Landslides
Livestock diseases
Storms / Cyclone/hail sto
9.76
26.00
7.30
4.88
2.40
3.70
1.20
9.76
15.90
7.30
12.20
1.81
1.00
1.30
15.30
36.00
36.00
0.80
1.80
0.26
2.85
1.30
1.55
37.90
38.00
16.00
1.17
1.30
0.20
0.20
1.17
1.00
1.20
1.84
12.50
13.00
63.00
13.00
1.10
1.10
3.41
22.00
4.50
1.14
12.50
55.00
14.30
43.00
29.00
14.00
4.27
6.60
6.60
12.80
23.00
29.00
5.20
3.30
1.90
2.37
3.30
1.90
33.30
33.00
33.30
6.13
21.00
27.00
11.50
18.00
7.90
2.10
1.10
0.38
2.11
1.10
1.15
50.00
50.00
49
Page 1 of 1
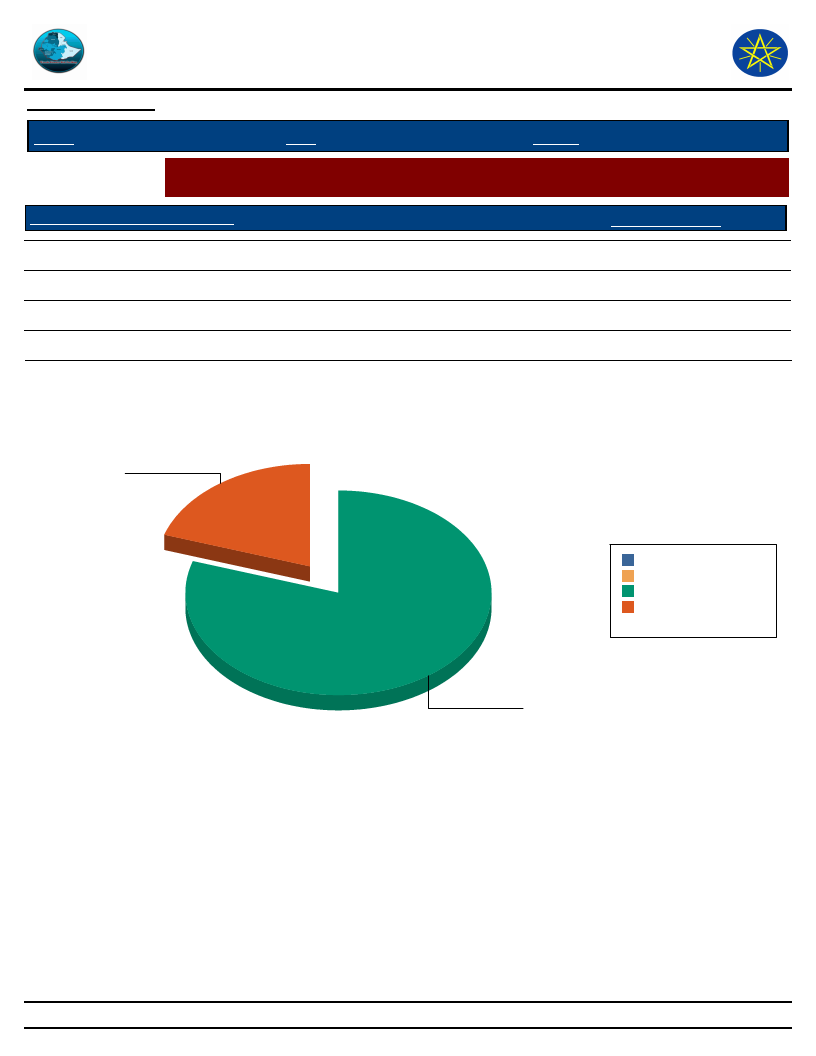
Wereda Disaster
Risk Profile
Disaster Risk Management
and Food Security Sector (DRMFSS)
Data_Collected_Date September 2010
Region S.N.N.P
Zone SOUTH OMO
Tuesday, September 30, 2014
Wereda HAMER
Selected Indictor:
Conflicts: Perception of households on conflict issues - Is conflict an issue in this
community?
Is Conflict an Issue in Community?
Response_Percent
Yes
19.90
No
80.10
DK
0.00
NA
0.00
Is Conflict an Issue in Community?
Yes
19.9
DK
0 0.0%
NA
0 0.0%
No 80.1 80.1%
Yes 19.9 19.9%
Total: 100 100.0%
No
80.1
50
Page 1 of 1

Wereda Disaster
Risk Profile
Data_Collected_Date
September 2010
Disaster Risk Management
and Food Security Sector (DRMFSS)
Tuesday, September 30, 2014
Region S.N.N.P
Zone SOUTH OMO
Wereda HAMER
Selected Indictor:
Conflicts: Perception of households on conflict issues - Who To Turn To in case of
Conflict?
Who To Turn During Conflict?
Response_Percentage
Family members
0.78
Elders
91.20
Amakaris
0.26
Wereda administration
4.92
Police
2.59
Regional representatives
0.26
Other
0.78
Who To Turn During Conflict?
Wereda administration
5
Regional
representatives
0
Police
3
Other
1
Family members
1
Amakaris
0
Elders
91
Amakaris
Elders
0 0.3%
91 90.5%
Family members
Other
1 0.8%
1 0.8%
Police
Regional representatives
Wereda administration
3 2.6%
0 0.3%
5 4.9%
Total:
101 100.0%
51
Page 1 of 1

Wereda Disaster
Risk Profile
Data_Collected_Date
September 2010
Disaster Risk Management
and Food Security Sector (DRMFSS)
Tuesday, September 30, 2014
Region S.N.N.P
Selected Indictor:
Type of Loss
Zone SOUTH OMO
Wereda HAMER
Losses from Disasters - Losses from all disasters (household response in %)
Main_Loss_Percent
Secondary_Loss_Percent
Physical damages on houses and property
Crop damage
Livestock damage
Death of household members
Illness/health problems
Loss of access to social services, including school
Loss of income
Loss of savings
Livestock were stolen
Lost access to grazing land
Had to flee/change residence area
1.05
42.60
32.40
1.26
15.20
0.58
0.63
0.63
1.16
1.84
1.10
1.08
3.65
10.60
0.80
2.63
3.08
42.40
7.59
0.51
19.70
0.91
52
Page 1 of 1
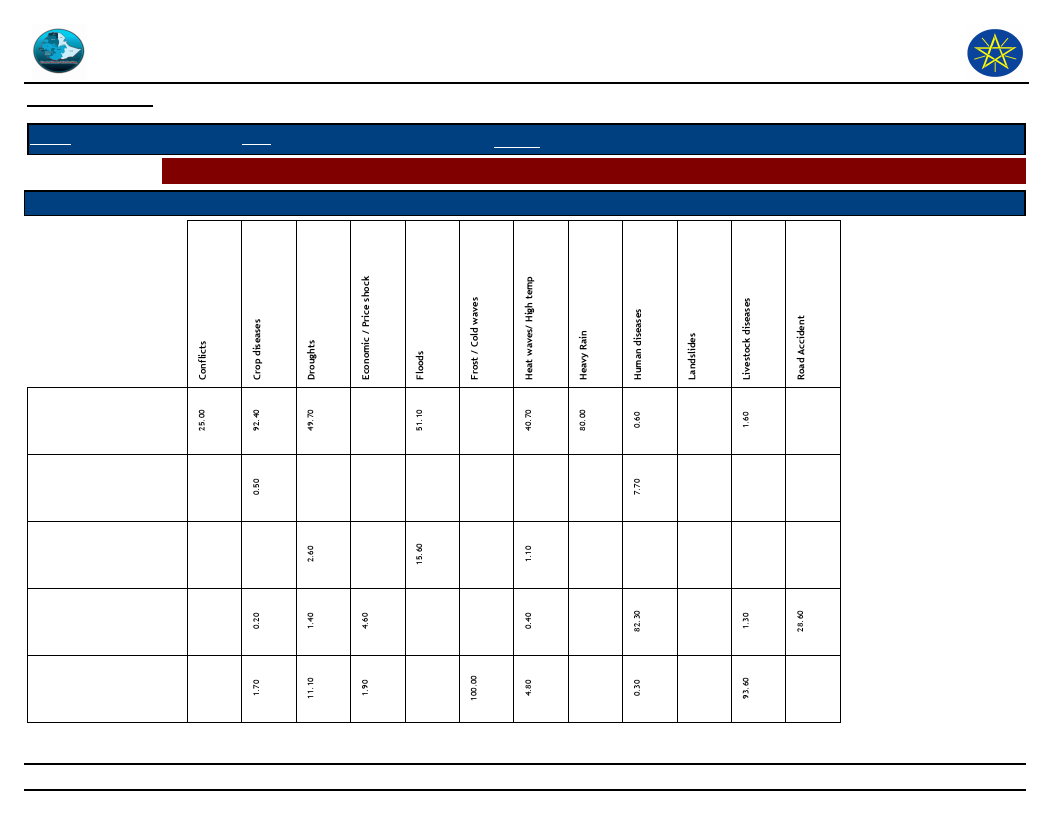
Wereda Disaster
Risk Profile
Data_Collected_Date
September 2010
Disaster Risk Management
and Food Security Sector (DRMFSS)
Tuesday, September 30, 2014
Region S.N.N.P
Selected Indictor:
Type of Loss
Zone SOUTH OMO
Wereda HAMER
Losses from Disasters - Main Losses by Type of Disasters (household response in %)
Type of Disasters which mainly caused Listed Losses
Crop damage
Death of household
members
Had to flee/change
residence area
Illness/health problems
Livestock damage
53
Page 1 of 3

Wereda Disaster
Risk Profile
Data_Collected_Date
September 2010
Disaster Risk Management
and Food Security Sector (DRMFSS)
Tuesday, September 30, 2014
Region S.N.N.P
Selected Indictor:
Type of Loss
Zone SOUTH OMO
Wereda HAMER
Losses from Disasters - Main Losses by Type of Disasters (household response in %)
Type of Disasters which mainly caused Listed Losses
Loss of access to social
services, including
school
Loss of income
Loss of savings
Lost access to grazing
land
Lost access to water
source
54
Page 2 of 3

Wereda Disaster
Risk Profile
Data_Collected_Date
September 2010
Disaster Risk Management
and Food Security Sector (DRMFSS)
Tuesday, September 30, 2014
Region S.N.N.P
Selected Indictor:
Type of Loss
Zone SOUTH OMO
Wereda HAMER
Losses from Disasters - Main Losses by Type of Disasters (household response in %)
Type of Disasters which mainly caused Listed Losses
Other losses/damages
Physical damages on
houses and property
55
Page 3 of 3

Wereda Disaster
Risk Profile
Data_Collected_Date
September 2010
Disaster Risk Management
and Food Security Sector (DRMFSS)
Tuesday, September 30, 2014
Region S.N.N.P
Zone SOUTH OMO
Wereda HAMER
Selected Indictor: Losses from Disasters - Secondary Losses by Type of Disasters (household response in %)
Type of Loss
Type of Disasters which caused Listed Secondary Losses
Crop damage
Death of household
members
Had to flee/change
residence area
Illness/health problems
Livestock damage
25.00
92.40
49.70
51.10
0.50
2.60
15.60
0.20
1.40
4.60
1.70
11.10
1.90
40.70
80.00
0.60
7.70
1.10
0.40
82.30
100.00
4.80
0.30
56
1.60
1.30
28.60
93.60
Page 1 of 3
Wereda Disaster
Risk Profile
Data_Collected_Date
September 2010
Disaster Risk Management
and Food Security Sector (DRMFSS)
Tuesday, September 30, 2014
Region S.N.N.P
Zone SOUTH OMO
Wereda HAMER
Selected Indictor: Losses from Disasters - Secondary Losses by Type of Disasters (household response in %)
Type of Loss
Type of Disasters which caused Listed Secondary Losses
Loss of access to social
services, including school
Loss of income
Loss of savings
Lost access to grazing land
Lost access to water source
25.00
0.20
0.60
49.10
1.00
10.70
16.70
5.70
1.90
5.50
2.40
2.20
57
0.70
5.50
0.40
20.00
0.30
0.40
0.30
27.50
17.60
0.30
0.20
57.10
1.80
1.30
0.40
Page 2 of 3
Wereda Disaster
Risk Profile
Data_Collected_Date
September 2010
Disaster Risk Management
and Food Security Sector (DRMFSS)
Tuesday, September 30, 2014
Region S.N.N.P
Zone SOUTH OMO
Wereda HAMER
Selected Indictor: Losses from Disasters - Secondary Losses by Type of Disasters (household response in %)
Type of Loss
Type of Disasters which caused Listed Secondary Losses
Other losses/damages
25.00
0.50
0.20
9.30
Physical damages on houses
25.00
3.60
10.10
16.70
31.10
100.00
6.60
and property
2.60
100.00
14.30
58
Page 3 of 3

Wereda Disaster
Risk Profile
Data_Collected_Date
September 2010
Disaster Risk Management and
Food Security Sector (DRMFSS)
Tuesday, September 30, 2014
Region S.N.N.P
Zone SOUTH OMO
Wereda HAMER
Selected Indictor: Seasonal Calendar for Hazards, Activities and Income Level By Kebele
Month of Hazard
Kebele
ADAMIE
Major_Problems /Disasters
Hazard Severity
Rank
Agricultural_Activities
Income
Level Rank
E - Jan (Tir)
F - Feb (Yekatit)
G - Mar (Megabit)
H - Apr (Meazea)
Livestock feed shortage, but no water shortage all year
round
Livestock feed shortage and livestock pressure from
Hamer
Livestock feed shortage and livestock pressure from
Hamer
Tick infestation, CCPP and goats’ foot rot
Fishing
1st
Fishing
2nd
Land preparation and sowing when there is belg rain
5th
Sowing and weeding(but not usual)
6th
I - May (Ginbot)
Malaria infestation
Pest guarding (but not usual)
3rd
J - Jun (Sene)
More livestock mobility to kara areas(hammer ethnic
Harvesting(not usual)
9th
livestock)
K - Jul (Hamle)
More livestock mobility to kara areas(hammer ethnic
Fish harvesting
8th
livestock)
L - Aug (Nehase)
More livestock mobility to kara areas(hammer ethnic
2
Fish harvesting when Omo river filled
7th
livestock)
A - Sep (Meskerem)
Malaria ,food grain shortage, treat of conflict
3
Land preparation
10th
B - Oct (Tikimt)
Food grain shortage, treat of conflict during land
1
Crop sowing and weeding
11th
preparation
C - Nov (Hidar)
Food grain shortage, treat of conflict during land
Pest guarding (wild life)
12th
preparation, crop pest (wild lifes)
D - Dec (Tahsas)
Crop pest (wild life crop attach=monkey and baboon)
Crop harvesting
4th
NOTE: Hazard Severity Rank helps prioritize the more severe hazards that have occurred in the months of disaster occurrence, 3 being the worst and 1
the least severe hazards.
59
Page 1 of 19

Wereda Disaster
Risk Profile
Data_Collected_Date
September 2010
Region S.N.N.P
Zone
SOUTH OMO
Disaster Risk Management and
Food Security Sector (DRMFSS)
Tuesday, September 30, 2014
Wereda HAMER
Selected Indictor: Seasonal Calendar for Hazards, Activities and Income Level By Kebele
Month of Hazard
Kebele
ASELE
Major_Problems /Disasters
Hazard Severity
Rank
Agricultural_Activities
E - Jan (Tir)
Livestock feed ,water and food grain shortage, conflict
3
for grazing, tryponosomiasis
F - Feb (Yekatit)
Livestock feed ,water and food grain shortage, food
1
grain price rise,tryponosomiasis
G - Mar (Megabit)
Tick infestation, mangemites infection, GIP, food grain
shortage
H - Apr (Meazea)
Foot rot, CCPP flare up
Mobility for search of grazing
Mobility for search of grazing
Land preparation and sowing
Weeding, peak milk and butter yield
Income
Level Rank
11th
12th
5th
1st
I - May (Ginbot)
CCPP infection, food grain shortage
Pest guarding if there is good rain fall
2nd
J - Jun (Sene)
Crop pest(only for good wet season)
Crop harvest if there is good belg rain
3rd
K - Jul (Hamle)
L - Aug (Nehase)
A - Sep (Meskerem)
B - Oct (Tikimt)
High food grain shortage and price rise when crop
harvest failed
Livestock feed and water shortage, food grain shortage
and price rise.
Livestock feed and water shortage, food grain
shortage.
Tick infestation when short rain falls.
Mobility for search of grazing
7th
Mobility for search of grazing
8th
Honey crop harvest and mobility for grazing
9th
Mobility for search of grazing
4th
C - Nov (Hidar)
Livestock feed and water shortage, food grain
shortage.
Mobility for search of grazing
6th
D - Dec (Tahsas)
Livestock feed and water shortage, food grain
2
Mobility for search of grazing
10th
shortage, and tryponosomiasis.
NOTE: Hazard Severity Rank helps prioritize the more severe hazards that have occurred in the months of disaster occurrence, 3 being the worst and 1
the least severe hazards.
60
Page 2 of 19

Wereda Disaster
Risk Profile
Data_Collected_Date
September 2010
Disaster Risk Management and
Food Security Sector (DRMFSS)
Tuesday, September 30, 2014
Region S.N.N.P
Zone SOUTH OMO
Wereda HAMER
Selected Indictor: Seasonal Calendar for Hazards, Activities and Income Level By Kebele
Month of Hazard
Major_Problems /Disasters
Kebele
BESSA MEJAN
Hazard Severity
Rank
Agricultural_Activities
Income
Level Rank
E - Jan (Tir)
Hunger ,livestock produce and feed shortage ,crop
3
Land preparation ,movement for search of grazing
11th
price rise
F - Feb (Yekatit)
Hunger ,livestock produce and feed shortage ,crop
2
Land preparation ,movement for search of grazing
12th
price rise
G - Mar (Megabit)
Food shortage, livestock food shortage and death of
Crop sowing
3rd
livestock
H - Apr (Meazea)
Flare up of tick infestation, flare up of CCPP, food
shortage gip
Weeding, peak milk and butter yield harvest
1st
I - May (Ginbot)
Crop pest
Peak milk and butter harvest
2nd
J - Jun (Sene)
Crop pest
Crop harvest
4th
K - Jul (Hamle)
Livestock feed shortage
Mobility for grazing
6th
L - Aug (Nehase)
Livestock feed shortage
Mobility for grazing
7th
A - Sep (Meskerem)
Livestock feed shortage
Mobility for grazing
8th
B - Oct (Tikimt)
Tick infestation, gip
Milk and butter harvest
5th
C - Nov (Hidar)
Tick and gip
Mobility for grazing
9th
D - Dec (Tahsas)
Livestock feed shortage, livestock produce shortage
1
Mobility for grazing to distant areas
10th
NOTE: Hazard Severity Rank helps prioritize the more severe hazards that have occurred in the months of disaster occurrence, 3 being the worst and 1
the least severe hazards.
61
Page 3 of 19

Wereda Disaster
Risk Profile
Data_Collected_Date
September 2010
Disaster Risk Management and
Food Security Sector (DRMFSS)
Tuesday, September 30, 2014
Region S.N.N.P
Zone SOUTH OMO
Wereda HAMER
Selected Indictor: Seasonal Calendar for Hazards, Activities and Income Level By Kebele
Month of Hazard
Major_Problems /Disasters
Kebele
DEGA KEJA
Hazard Severity
Rank
Agricultural_Activities
Income
Level Rank
E - Jan (Tir)
Food grain price rise, reduce of livestock produce,
3
Land preparation (rare), finding grazing points.
11th
livestock price fall, livestock feed and water shortage.
F - Feb (Yekatit)
Food grain price rise, reduce of livestock produce,
2
Land preparation (rare), finding grazing points.
12th
livestock price fall, livestock feed and water shortage.
G - Mar (Megabit)
Tick infestation, hip, food price rise.
Land preparation and crop sowing (more than 80%)
6th
H - Apr (Meazea)
Foot rot, food price rises, trypanosomiasis
Weeding ,peak milk and butter yield
1st
I - May (Ginbot)
Malaria, biting flies increase, ccpp increase, crop pest.
Pest grounding milk and butter yield
5th
J - Jun (Sene)
Crop pest during harvest seasons, ticks infestation.
Honey crop harvest, crop harvest (in good season)
2nd
K - Jul (Hamle)
Livestock feed shortage, ccpp, food grain shortage
Mobility for grazing.
7th
when harvest failed.
L - Aug (Nehase)
Livestock feed and water shortage, food shortage.
Mobility for grazing.
8th
A - Sep (Meskerem)
Food shortage, food grain price rise.
Mobility for grazing.
9th
B - Oct (Tikimt)
Tick infestation and hip, food shortage.
Milk and butter yield
3rd
C - Nov (Hidar)
Food grain shortage.
Honey crop harvesting.
4th
D - Dec (Tahsas)
Livestock feed and water shortage, food shortage.
1
Mobility for search of grazing /herders/
10th
NOTE: Hazard Severity Rank helps prioritize the more severe hazards that have occurred in the months of disaster occurrence, 3 being the worst and 1
the least severe hazards.
62
Page 4 of 19

Wereda Disaster
Risk Profile
Data_Collected_Date
September 2010
Disaster Risk Management and
Food Security Sector (DRMFSS)
Tuesday, September 30, 2014
Region S.N.N.P
Zone SOUTH OMO
Wereda HAMER
Selected Indictor: Seasonal Calendar for Hazards, Activities and Income Level By Kebele
Month of Hazard
Kebele
ERBORE
Major_Problems /Disasters
Hazard Severity
Rank
Agricultural_Activities
Income
Level Rank
E - Jan (Tir)
Water and grazing shortage for livestock
2
Mobility of livestock feed searching
8th
F - Feb (Yekatit)
Water and grazing shortage for livestock
3
Mobility of livestock feed searching
9th
G - Mar (Megabit)
Livestock feed shortage,
Mobility of livestock feed searching
5th
H - Apr (Meazea)
Tick infestation
Peak milk and butter yield harvest
6th
I - May (Ginbot)
Flooding, food shortage(for some households)
1
Peak milk and butter yield harvest
7th
J - Jun (Sene)
Food shortage(for some households)
Land preparation
10th
K - Jul (Hamle)
Food shortage for all households in the community
Land preparation
11th
L - Aug (Nehase)
Food shortage for all households in the community
Sowing, weeding, fish harvesting
12th
A - Sep (Meskerem)
Food shortage for all households in the community
Fish harvesting, pest guarding
4th
B - Oct (Tikimt)
Food shortage for all households in the community
Harvesting ,peak milk yield
1st
C - Nov (Hidar)
Tick infestation, gip infection for livestock
Milk and butter yield harvest
2nd
D - Dec (Tahsas)
Gip infection for livestock
Milk and butter yield harvest
3rd
NOTE: Hazard Severity Rank helps prioritize the more severe hazards that have occurred in the months of disaster occurrence, 3 being the worst and 1
the least severe hazards.
63
Page 5 of 19

Wereda Disaster
Risk Profile
Data_Collected_Date
September 2010
Disaster Risk Management and
Food Security Sector (DRMFSS)
Tuesday, September 30, 2014
Region S.N.N.P
Zone SOUTH OMO
Wereda HAMER
Selected Indictor: Seasonal Calendar for Hazards, Activities and Income Level By Kebele
Month of Hazard
Kebele
ERIYA
Major_Problems /Disasters
Hazard Severity
Rank
Agricultural_Activities
Income
Level Rank
E - Jan (Tir)
F - Feb (Yekatit)
G - Mar (Megabit)
Livestock feed and water shortage, reduce of livestock
produce, tryponsom
Livestock feed and water shortage, reduce of livestock
produce, tryponsom
Livestock feed shortage, gip, tryponsom
Mobility for search of grazing and watering.
5th
Mobility for search of grazing and watering.
6th
Mobility for search of grazing and watering.
7th
H - Apr (Meazea)
Foot rot, gip
Peak milk and butter yield
2nd
I - May (Ginbot)
Flooding, livestock feed shortage, malaria
Flooding of Woito river which utilized forage.
4th
J - Jun (Sene)
Food grain shortage
Land preparation, fish harvesting.
8th
K - Jul (Hamle)
Food grain shortage
1
Sowing and land preparation ,fish harvesting
9th
L - Aug (Nehase)
Food grain shortage
2
Pest guarding and weeding ,fish harvesting
10th
A - Sep (Meskerem)
Food grain shortage, crop pest
3
Pest guarding ,fish harvesting
11th
B - Oct (Tikimt)
Crop pest, flooding threat
Crop harvesting
12th
C - Nov (Hidar)
Flooding threat
Threshing
1st
D - Dec (Tahsas)
Livestock feed and water shortage.
Mobility for search of grazing and watering.
3rd
NOTE: Hazard Severity Rank helps prioritize the more severe hazards that have occurred in the months of disaster occurrence, 3 being the worst and 1
the least severe hazards.
64
Page 6 of 19

Wereda Disaster
Risk Profile
Data_Collected_Date
September 2010
Disaster Risk Management and
Food Security Sector (DRMFSS)
Tuesday, September 30, 2014
Region S.N.N.P
Zone SOUTH OMO
Wereda HAMER
Selected Indictor: Seasonal Calendar for Hazards, Activities and Income Level By Kebele
Month of Hazard
Kebele
GEDBAK
Major_Problems /Disasters
Hazard Severity
Rank
Agricultural_Activities
Income
Level Rank
E - Jan (Tir)
Livestock feed shortage, food grain shortage, reduce of
3
Land preparation
11th
livestock produce
F - Feb (Yekatit)
Livestock feed shortage, food grain shortage, reduce of
1
Land preparation and sowing
12th
livestock produce
G - Mar (Megabit)
Tick infestation, gip infection, food grain shortage
Sowing and weeding
9th
H - Apr (Meazea)
Food grain shortage, foot rot of shoats
Weeding
8th
I - May (Ginbot)
Crop pest
Pest guarding
4th
J - Jun (Sene)
Crop pest
Harvesting
1st
K - Jul (Hamle)
Livestock feed shortage
Threshing
2nd
L - Aug (Nehase)
Livestock feed shortage
No agricultural activity
3rd
A - Sep (Meskerem)
Livestock feed shortage
5th
B - Oct (Tikimt)
Tick infestation
Tilling and sowing when short rain fall
6th
C - Nov (Hidar)
Livestock feed shortage
Pest guarding when short rain fall at good amount(rare)
7th
D - Dec (Tahsas)
Livestock feed shortage
2
No agricultural activity
10th
NOTE: Hazard Severity Rank helps prioritize the more severe hazards that have occurred in the months of disaster occurrence, 3 being the worst and 1
the least severe hazards.
65
Page 7 of 19

Wereda Disaster
Risk Profile
Data_Collected_Date
September 2010
Disaster Risk Management and
Food Security Sector (DRMFSS)
Tuesday, September 30, 2014
Region S.N.N.P
Zone SOUTH OMO
Wereda HAMER
Selected Indictor: Seasonal Calendar for Hazards, Activities and Income Level By Kebele
Month of Hazard
Kebele
HEDBAK
Major_Problems /Disasters
Hazard Severity
Rank
Agricultural_Activities
Income
Level Rank
E - Jan (Tir)
Feed shortage and leech infestation ,anthrax flare up
3
Land preparation
11th
F - Feb (Yekatit)
Livestock feed shortage ,food grain shortage, leech
2
Land preparation and sowing
12th
infestation
G - Mar (Megabit)
Increased tick and mange mites infection
Sowing and weeding
8th
,tryponosomiasis, GIP
H - Apr (Meazea)
Foot rot, CCPP flare up,tryponosomiasis
Weeding
2nd
I - May (Ginbot)
Crop pest, increase tick infestation
Pest guard
4th
J - Jun (Sene)
Crop pest
Pest guarding and harvesting
1st
K - Jul (Hamle)
Crop flare up
Threshing
3rd
L - Aug (Nehase)
Threshing
5th
A - Sep (Meskerem)
Livestock feed shortage
Livestock herding
6th
B - Oct (Tikimt)
Tick infestation, GIP
Tilling when short rain fall
7th
C - Nov (Hidar)
Leech infestation
Livestock herding
9th
D - Dec (Tahsas)
Livestock feed shortage and leech infestation
1
Livestock herding
10th
NOTE: Hazard Severity Rank helps prioritize the more severe hazards that have occurred in the months of disaster occurrence, 3 being the worst and 1
the least severe hazards.
66
Page 8 of 19

Wereda Disaster
Risk Profile
Data_Collected_Date
September 2010
Disaster Risk Management and
Food Security Sector (DRMFSS)
Tuesday, September 30, 2014
Region S.N.N.P
Zone SOUTH OMO
Wereda HAMER
Selected Indictor: Seasonal Calendar for Hazards, Activities and Income Level By Kebele
Month of Hazard
Major_Problems /Disasters
Kebele
KOLA KEJA
Hazard Severity
Rank
Agricultural_Activities
Income
Level Rank
E - Jan (Tir)
F - Feb (Yekatit)
G - Mar (Megabit)
Hunger, livestock produce and livestock feed shortage,
loss of livestock
Livestock disease, hunger, livestock feed shortage,
conflict
Livestock disease, hunger, loss of livestock
Land preparation, virtually no livestock produce
11th
Land preparation
12th
Crop sowing
10th
H - Apr (Meazea)
Livestock disease, particularly ticks and mangities
Weeding ,peak milk yield, butter harvest
1st
I - May (Ginbot)
Crop pest, crop failure due to rain fall deterioration
Peak milk yield and butter harvesting
2nd
J - Jun (Sene)
Crop pest
Crop harvesting(it is very rare)
3rd
K - Jul (Hamle)
Hunger when crop harvest fail, livestock feed shortage
Milk yield and butter harvest start to decline
7th
L - Aug (Nehase)
Hunger when rain fall stop in the beginning of may
Less milk yield
8th
A - Sep (Meskerem)
Livestock produce shortage, feed shortage
Less milk yield
6th
B - Oct (Tikimt)
Flare up of ticks and mangities ,intestinal parasites
If short rain season starts (there is milk yield)
5th
C - Nov (Hidar)
Ticks and mangities
Peak milk yield and butter harvesting
4th
D - Dec (Tahsas)
Reduce of livestock produce, hunger, livestock feed
shortage
Less milk yield and butter harvest
9th
NOTE: Hazard Severity Rank helps prioritize the more severe hazards that have occurred in the months of disaster occurrence, 3 being the worst and 1
the least severe hazards.
67
Page 9 of 19

Wereda Disaster
Risk Profile
Data_Collected_Date
September 2010
Disaster Risk Management and
Food Security Sector (DRMFSS)
Tuesday, September 30, 2014
Region S.N.N.P
Zone SOUTH OMO
Wereda HAMER
Selected Indictor: Seasonal Calendar for Hazards, Activities and Income Level By Kebele
Month of Hazard
Kebele
LALA
Major_Problems /Disasters
Hazard Severity
Rank
Agricultural_Activities
Income
Level Rank
E - Jan (Tir)
Livestock feed shortage, food grain shortage, livestock
3
Land preparation, mobility for grazing.
11th
price fall, tryponomiasis
F - Feb (Yekatit)
Tryponomiasis, anthrax at grazing areas, food grain
1
Land preparation and sowing
12th
shortage, food price rise
G - Mar (Megabit)
Tick infestation, gip, rain shortage for seedlings
Sowing and weeding
6th
H - Apr (Meazea)
I - May (Ginbot)
Foot rot, tick infestation, tryponosomiasis, food grain
shortage
Food grain shortage, malaria, pest, ccpp
Weeding ,peak milk and butter yield
2nd
Pest guarding ,milk and butter yield
4th
J - Jun (Sene)
Crop pest, ccpp, tick infestation
Crop harvest, honey crop harvest
1st
K - Jul (Hamle)
Livestock feed shortage, food grain shortage,(when
Mobility for grazing
3rd
there is no harvest)
L - Aug (Nehase)
Livestock feed shortage, food grain shortage,(when
Mobility for grazing
7th
there is no harvest)
A - Sep (Meskerem)
Livestock feed and water shortage, food grain shortage
Mobility for grazing
5th
B - Oct (Tikimt)
Tick infestation, gip
Honey crop harvest, milk and butter yield.
8th
C - Nov (Hidar)
CCPP, tick infestation
9th
D - Dec (Tahsas)
Livestock feed and water shortage, food grain shortage
2
Mobility for search of grazing
10th
NOTE: Hazard Severity Rank helps prioritize the more severe hazards that have occurred in the months of disaster occurrence, 3 being the worst and 1
the least severe hazards.
68
Page 10 of 19

Wereda Disaster
Risk Profile
Data_Collected_Date
September 2010
Region S.N.N.P
Zone
SOUTH OMO
Disaster Risk Management and
Food Security Sector (DRMFSS)
Tuesday, September 30, 2014
Wereda HAMER
Selected Indictor: Seasonal Calendar for Hazards, Activities and Income Level By Kebele
Month of Hazard
Major_Problems /Disasters
Kebele
MINOGELTI
Hazard Severity
Rank
Agricultural_Activities
E - Jan (Tir)
Crop price rise, livestock price fall, feed and water
2
shortage.
F - Feb (Yekatit)
Crop price rise, livestock price fall, feed and water
3
shortage.
G - Mar (Megabit)
Livestock disease(ticks,mangemites,CCPP)price fall of
shoats, conflict
H - Apr (Meazea)
Flare up of conflict, livestock resulting, tick infestation
Driving livestock to grazing areas
Driving livestock to grazing areas
Crop sowing
Crop sowing, peak milk yield
Income
Level Rank
11th
12th
5th
4th
I - May (Ginbot)
Food shortage, grain price rise
Driving livestock to grazing areas
6th
J - Jun (Sene)
K - Jul (Hamle)
L - Aug (Nehase)
A - Sep (Meskerem)
Food shortage, grain price rise
Food shortage and livestock feed and water shortage.
Food shortage and livestock feed shortage.
Food shortage and livestock feed and water shortage.
Driving livestock to grazing areas(it is harvest time
7th
before 15 years)
Driving livestock to grazing areas(it is harvest time
8th
before 15 years)
Driving livestock to grazing areas(it is harvest time
9th
before 15 years)
Honey crop harvest
1st
B - Oct (Tikimt)
Food shortage, CCPP, and CBPP flare up.
Mobility to grazing areas
2nd
C - Nov (Hidar)
Tick infestation, mangmites flare up, conflict, CCPP
Milk yield harvest
3rd
flare up.
D - Dec (Tahsas)
Livestock feed and water shortage, hunger, food price
1
Mobility to dry season grazing
10th
rise.
NOTE: Hazard Severity Rank helps prioritize the more severe hazards that have occurred in the months of disaster occurrence, 3 being the worst and 1
the least severe hazards.
69
Page 11 of 19

Wereda Disaster
Risk Profile
Data_Collected_Date
September 2010
Disaster Risk Management and
Food Security Sector (DRMFSS)
Tuesday, September 30, 2014
Region S.N.N.P
Zone SOUTH OMO
Wereda HAMER
Selected Indictor: Seasonal Calendar for Hazards, Activities and Income Level By Kebele
Month of Hazard
Kebele
MRSHA
Major_Problems /Disasters
Hazard Severity
Rank
Agricultural_Activities
Income
Level Rank
E - Jan (Tir)
Hunger, livestock feed and water shortage, conflict,
2
Trekking livestock for feed and water
11th
death of livestock.
F - Feb (Yekatit)
Crop price rise, livestock price fall, feed and water
3
Trekking livestock for feed and water
12th
shortage, hunger.
G - Mar (Megabit)
Crop price rise, livestock price fall, tick infestation,
Land preparation
10th
gip infection.
H - Apr (Meazea)
Crop price rise, CCPP flare up, tick infestation,
1st
tryponosomiasis.
I - May (Ginbot)
Crop pest, malaria infection.
2nd
J - Jun (Sene)
Feed shortage, conflict (threat).
3rd
K - Jul (Hamle)
Feed shortage, threat of conflict.
8th
L - Aug (Nehase)
Feed shortage, threat of conflict.
7th
A - Sep (Meskerem)
Feed shortage, threat of conflict.
4th
B - Oct (Tikimt)
Tick infestation, gip infection
5th
C - Nov (Hidar)
Gip infection, CCPP
6th
D - Dec (Tahsas)
Conflict, feed shortage ,livestock produce reduction,
1
9th
hunger
NOTE: Hazard Severity Rank helps prioritize the more severe hazards that have occurred in the months of disaster occurrence, 3 being the worst and 1
the least severe hazards.
70
Page 12 of 19

Wereda Disaster
Risk Profile
Data_Collected_Date
September 2010
Disaster Risk Management and
Food Security Sector (DRMFSS)
Tuesday, September 30, 2014
Region S.N.N.P
Zone SOUTH OMO
Wereda HAMER
Selected Indictor: Seasonal Calendar for Hazards, Activities and Income Level By Kebele
Month of Hazard
Kebele
MURALE
Major_Problems /Disasters
Hazard Severity
Rank
Agricultural_Activities
Income
Level Rank
E - Jan (Tir)
Livestock disease, livestock feed and water shortage,
1
Mobility for grazing and watering
11th
conflict
F - Feb (Yekatit)
Tryponsomiasis, livestock feed shortage and conflict
Mobility for grazing and watering
12th
G - Mar (Megabit)
Livestock feed shortage
No agricultural activity
6th
H - Apr (Meazea)
Tick and mangemites infection, foot rot (shoats)
Peak milk and butter harvest
4th
I - May (Ginbot)
Flooding
Peak milk and butter harvest
5th
J - Jun (Sene)
Malaria, food shortage (food grain)
Land preparation(if flooded)
7th
K - Jul (Hamle)
Food shortage(grain)
Land preparation(if flooded)
8th
L - Aug (Nehase)
Food shortage(food grain)
2
Crop sowing, weeding
9th
A - Sep (Meskerem)
Food shortage(food grain)
3
Crop sowing, weeding
10th
B - Oct (Tikimt)
Food shortage(food grain),crop pest
Pest guarding
1st
C - Nov (Hidar)
Flooding ,CCPP, fasciolosis(gip)
Pest guarding and harvesting
2nd
D - Dec (Tahsas)
Fasciolosis, water shortage owing to dry of Woito river
Pest guarding and harvesting
3rd
NOTE: Hazard Severity Rank helps prioritize the more severe hazards that have occurred in the months of disaster occurrence, 3 being the worst and 1
the least severe hazards.
71
Page 13 of 19

Wereda Disaster
Risk Profile
Data_Collected_Date
September 2010
Disaster Risk Management and
Food Security Sector (DRMFSS)
Tuesday, September 30, 2014
Region S.N.N.P
Zone SOUTH OMO
Wereda HAMER
Selected Indictor: Seasonal Calendar for Hazards, Activities and Income Level By Kebele
Month of Hazard
Kebele
QUARO
Major_Problems /Disasters
Hazard Severity
Rank
Agricultural_Activities
Income
Level Rank
E - Jan (Tir)
F - Feb (Yekatit)
Water and grazing shortage for livestock
Water and grazing shortage for livestock
2
Mobility of livestock feed searching
3
Mobility of livestock feed searching
Approved
Data
9th
G - Mar (Megabit)
Livestock feed shortage,
Mobility of livestock feed searching
5th
H - Apr (Meazea)
Tick infestation
Peak milk and butter yield harvest
6th
I - May (Ginbot)
Flooding, food shortage(for some households)
1
Peak milk and butter yield harvest
7th
J - Jun (Sene)
Food shortage(for some households)
Land preparation
10th
K - Jul (Hamle)
Food shortage for all households in the community
Land preparation
11th
L - Aug (Nehase)
Food shortage for all households in the community
Sowing, weeding, fish harvesting
12th
A - Sep (Meskerem)
Food shortage for all households in the community
Fish harvesting, pest guarding
4th
B - Oct (Tikimt)
Food shortage for all households in the community
Harvesting ,peak milk yield
1st
C - Nov (Hidar)
Tick infestation, gip infection for livestock
Milk and butter yield harvest
2nd
D - Dec (Tahsas)
Gip infection for livestock
Milk and butter yield harvest
3rd
NOTE: Hazard Severity Rank helps prioritize the more severe hazards that have occurred in the months of disaster occurrence, 3 being the worst and 1
the least severe hazards.
72
Page 14 of 19

Wereda Disaster
Risk Profile
Data_Collected_Date
September 2010
Disaster Risk Management and
Food Security Sector (DRMFSS)
Tuesday, September 30, 2014
Region S.N.N.P
Zone SOUTH OMO
Wereda HAMER
Selected Indictor: Seasonal Calendar for Hazards, Activities and Income Level By Kebele
Month of Hazard
Kebele
SHANKO
Major_Problems /Disasters
Hazard Severity
Rank
Agricultural_Activities
Income
Level Rank
E - Jan (Tir)
Feed water for livestock crop price rise, decrease
1
Mobility to dry season to grazing areas
11th
livestock production
F - Feb (Yekatit)
Livestock feed and water ,shortage food crop price rise
3
Land preparation and sowing
12th
,decrease livestock production
G - Mar (Megabit)
Tick and infection, high death of livestock
Land preparation and sowing
7th
H - Apr (Meazea)
Infection of tick and tryponosomy
Weeding, good milk and butter yield
1st
I - May (Ginbot)
Crop pest feed root for livestock and mangentites
Weeding for last saving
2nd
J - Jun (Sene)
Crop pest
Pest grounding and harvesting honey
3rd
K - Jul (Hamle)
Block death tryponosomy
No agricultural activities
5th
L - Aug (Nehase)
Common cold for human and tick infection for livestock
No agricultural activities in some year land preparation
8th
A - Sep (Meskerem)
Feed and water shortage in same yrs
Mobility to dry season to grazing areas
9th
B - Oct (Tikimt)
Tryponosomy, tick infection and ccpp
Good livestock production
6th
C - Nov (Hidar)
Tick infection
Honey harvesting
4th
D - Dec (Tahsas)
Feed and water shortage in same years, shortage of
2
Mobility to dry season
10th
livestock production
NOTE: Hazard Severity Rank helps prioritize the more severe hazards that have occurred in the months of disaster occurrence, 3 being the worst and 1
the least severe hazards.
73
Page 15 of 19

Wereda Disaster
Risk Profile
Data_Collected_Date
September 2010
Disaster Risk Management and
Food Security Sector (DRMFSS)
Tuesday, September 30, 2014
Region S.N.N.P
Zone SOUTH OMO
Wereda HAMER
Selected Indictor: Seasonal Calendar for Hazards, Activities and Income Level By Kebele
Month of Hazard
Major_Problems /Disasters
Kebele
SHANKO 2
Hazard Severity
Rank
Agricultural_Activities
Income
Level Rank
E - Jan (Tir)
Livestock feed and water shortage, food shortage,
3
Land preparation, mobility for grazing
11th
livestock produce reduce
F - Feb (Yekatit)
Drinking water shortage, food and feed shortage,
2
Land preparation and sowing
12th
livestock produce reduce
G - Mar (Megabit)
Tick infestation, mangemites , CCPP flare up, gip
Sowing and weeding
4th
H - Apr (Meazea)
Foot rot, mangemites infestation
Peak milk and weeding
2nd
I - May (Ginbot)
Crop pest, foot rot (goats and sheep) malaria infection
Pest guarding
7th
J - Jun (Sene)
Crop pest, food shortage when these are no harvest
Harvesting crop and honey
1st
K - Jul (Hamle)
Livestock feed and water shortage, crop price rise if
Mobility for grazing
6th
there is no harvest
L - Aug (Nehase)
Livestock feed and water shortage, crop price rise if
Mobility for grazing
8th
there is no harvest
A - Sep (Meskerem)
Livestock feed and water shortage, crop price rise if
Honey crop harvest
3rd
there is no harvest
B - Oct (Tikimt)
Tick infestation, CCPP, mangemites infestation, gip
Milk and butter yield(harvest)
5th
C - Nov (Hidar)
Food shortage, tick infestation
Mobility for grazing
9th
D - Dec (Tahsas)
Livestock feed and water shortage, food shortage crop
1
Mobility for grazing and watering
10th
price rise
NOTE: Hazard Severity Rank helps prioritize the more severe hazards that have occurred in the months of disaster occurrence, 3 being the worst and 1
the least severe hazards.
74
Page 16 of 19
Wereda Disaster
Risk Profile
Data_Collected_Date
September 2010
Disaster Risk Management and
Food Security Sector (DRMFSS)
Tuesday, September 30, 2014
Region S.N.N.P
Zone SOUTH OMO
Wereda HAMER
Selected Indictor: Seasonal Calendar for Hazards, Activities and Income Level By Kebele
Month of Hazard
Major_Problems /Disasters
Kebele
SHESHA GOYKE
Hazard Severity
Rank
Agricultural_Activities
Income
Level Rank
E - Jan (Tir)
Crop price rise, conflict threats, livestock feed and
2
Mobility for pasture
11th
water shortage.
F - Feb (Yekatit)
Crop price rise, conflict threats, livestock price fall,
3
Mobility for pasture
12th
feed shortage.
G - Mar (Megabit)
Food grain shortage ,food grain price rise
Land preparation
10th
H - Apr (Meazea)
I - May (Ginbot)
Tick infestation, CCPP flare up, food grain shortage,
gip
Malaria, food grain price rise.
Sowing expecting harvest, but no yield
2nd
Good milk yield and good price offer for livestock
3rd
J - Jun (Sene)
Malaria, food grain shortage.
6th
K - Jul (Hamle)
Food grain shortage, livestock feed shortage.
Mobility for grazing
7th
L - Aug (Nehase)
Food grain shortage
Mobility for grazing
8th
A - Sep (Meskerem)
Food grain price rise, livestock feed shortage.
Mobility for grazing
5th
B - Oct (Tikimt)
Livestock feed shortage,
Mobility for search of pasture
4th
C - Nov (Hidar)
Tick infestation after 2 to 3 days rains, food shortage.
Honey crop harvest ,good milk yield
1st
D - Dec (Tahsas)
Conflict threat, food shortage, livestock feed shortage,
1
Mobility for search of pasture
9th
livestock disease
NOTE: Hazard Severity Rank helps prioritize the more severe hazards that have occurred in the months of disaster occurrence, 3 being the worst and 1
the least severe hazards.
75
Page 17 of 19

Wereda Disaster
Risk Profile
Data_Collected_Date
September 2010
Disaster Risk Management and
Food Security Sector (DRMFSS)
Tuesday, September 30, 2014
Region S.N.N.P
Zone SOUTH OMO
Wereda HAMER
Selected Indictor: Seasonal Calendar for Hazards, Activities and Income Level By Kebele
Month of Hazard
Major_Problems /Disasters
Kebele
WENBAYNO
Hazard Severity
Rank
Agricultural_Activities
Income
Level Rank
E - Jan (Tir)
Crop price raise, livestock feed shortage, reduce of
2
livestock produce
F - Feb (Yekatit)
Crop price raise, livestock produce shortage, livestock
1
feed and water shortage
G - Mar (Megabit)
Crop price rise
H - Apr (Meazea)
I - May (Ginbot)
Livestock disease flare up (ticks and tick born
disease),crop price rise
There is no a such much problems if grain harvest well
J - Jun (Sene)
If there is belg rain no problems ,but not hunger
K - Jul (Hamle)
Hunger, livestock feed shortage
L - Aug (Nehase)
Livestock feed shortage ,hunger
A - Sep (Meskerem)
Livestock feed shortage ,hunger
B - Oct (Tikimt)
Food shortage
C - Nov (Hidar)
Ticks and mangemites infestation
D - Dec (Tahsas)
Livestock feed and water shortage, crop price rises
3
NOTE: Hazard Severity Rank helps prioritize the more severe hazards that have occurred in the months of disaster occurrence, 3 being the worst and 1
the least severe hazards.
76
Page 18 of 19
WDRP Indicators
Infrastructure Access Characteristics
77
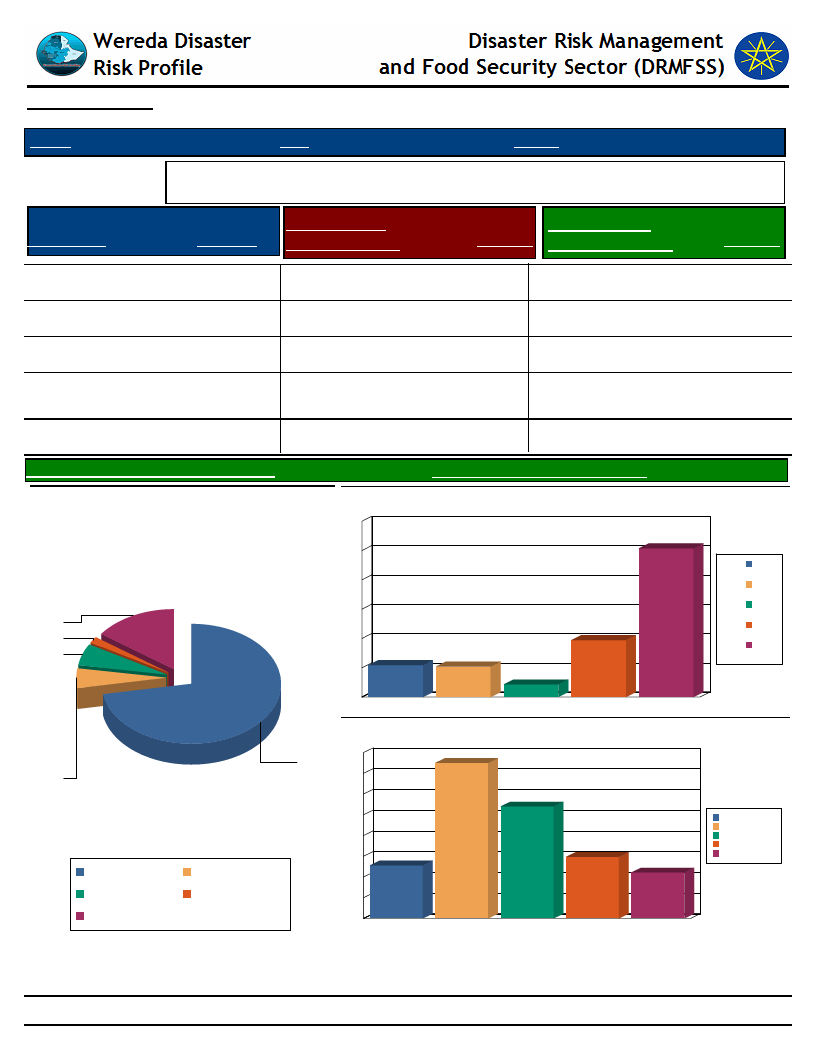
Data_Collected_Date
September 2010
Tuesday, September 30, 2014
Region S.N.N.P
Selected Indicator
Type of Road
Yes, paved
Zone SOUTH OMO
Wereda HAMER
Physical Vulnerability: Access to Roads & Urban Centres - Households access to
road and urban centre
Response
Time to Nearest
Paved Road (Mins.)
Time To Nearest
Response Urban Center (Mins.)
14.93 Less than 30 min
50.70 Less than 1 hr
Yes, partly paved road
1.77 30 – 60 min
19.40 1 - 2 hrs
Yes, gravel road
5.62 1 – 2 hrs
10.90 2 - 4 hrs
Yes, dirt road (difficult
for car)
No, no road
5.30 2 – 3 hrs
71.91 3 – 4 hrs
10.40 4 - 6 hrs
4.28 More than 6 hrs
Response
11.86
10.21
29.98
21.58
8.85
Avg Time To Nearest Urban Center(Mins.)
Type of Road
15
2
6
72
5
No, no road
Yes, gravel road
Yes, paved
Yes, dirt road (difficult
for car)
Yes, partly paved road
297.40 Avg_Time_To_Nearest_Paved_Road
69.29
Time to reach the nearest paved road from the HH
60
51
50
40
30
20
11
10
0
1 – 2 hrs
10
2 – 3 hrs
4
3 – 4 hrs
1 – 2 hrs
2 – 3 hrs
3 – 4 hrs
19
30 – 60 min
Less than 30 min
30 – 60 min
Less than 30 min
Time to reach nearest urban center from the HH
32
30
28
24
20
16
12
10
8
22
12
9
1 - 2 hrs
2 - 4 hrs
4 - 6 hrs
Less than 1 hr
More than 6 hrs
4
0
1 - 2 hrs
2 - 4 hrs
4 - 6 hrs
Less than 1 hr
More than 6 hrs
78
Page 1 of 1
Data_Collected_Date
September 2010
Tuesday, September 30, 2014
Region S.N.N.P
Selected Indicator
Zone SOUTH OMO
Wereda HAMER
Physical Vulnerability: Access to Electricity - Households access and utilization of
electricity
Household_Located_In_Electricity
0.00
Household_Connected_To Electricity
0.00
79
Page 1 of 1
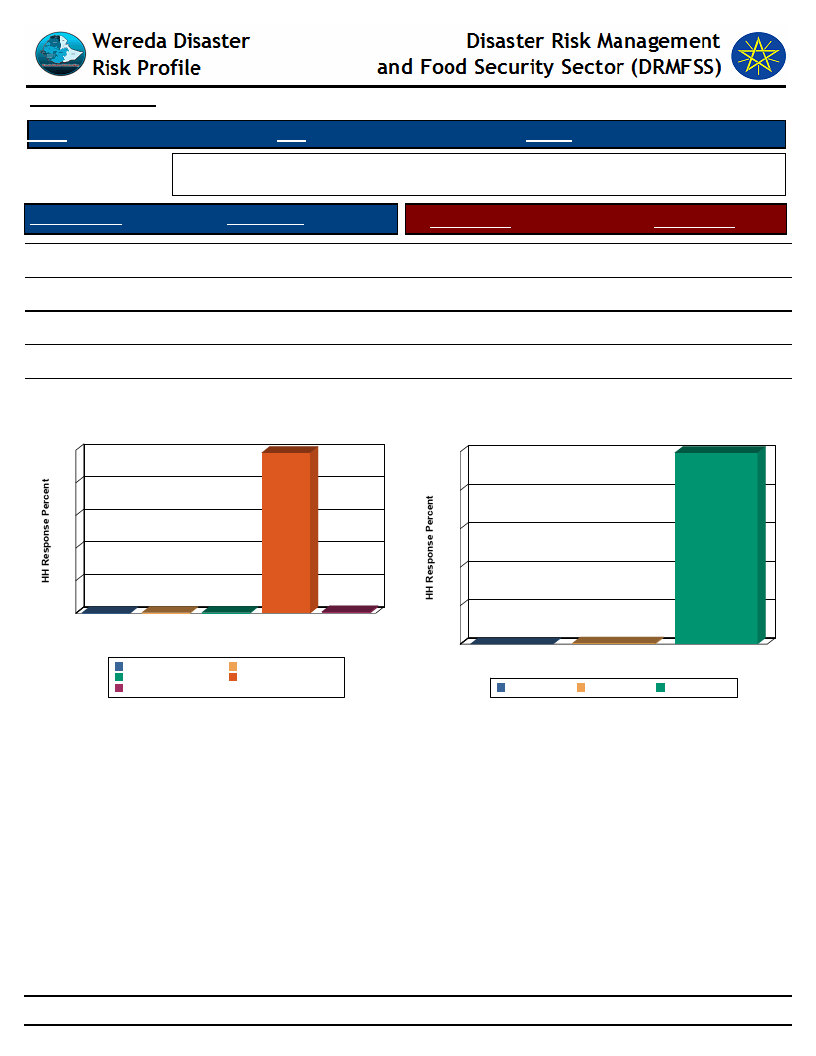
Data_Collected_Date
September 2010
Tuesday, September 30, 2014
Region S.N.N.P
Selected Indicator
Floor Structure
Zone SOUTH OMO
Wereda HAMER
Physical Vulnerability: Type of Dwelling Units - Households type of dwelling
houses
HH Response
Type of Floor
HH Response
Tin House
0.80
Concrete
0.50
Other losses/damages
98.40
Non-Concrete
99.50
Mobile Home
0.32
0.00
Brick/stone house
0.32
0.00
0.16
0.00
Floor Structure
100
98
80
60
40
20
0
0
0
1
0
Mobile Home
Tin House
Brick/stone house
Other losses/damages
Floor Structure
Mobile Home
Tin House
Brick/stone house
Other losses/damages
Type of Floor
100
100
80
60
40
20
0
0
1
Concrete
Type of Floor
Concrete
Non-Concrete
Non-Concrete
80
Page 1 of 1
WDRP Indicators
Socio Demographic Characteristics
81

Wereda Disaster
Risk Profile
Data_Collected_Date
September 2010
Disaster Risk Management and Food
Security Sector (DRMFSS)
Tuesday, September 30, 2014
Region S.N.N.P
Selected Indicator
Kebele Name
MRSHA
ERBORE
KOLA KEJA
Zone SOUTH OMO
Wereda HAMER
Economic Vulnerability: Level of Migration - Migration level and its characteristics by Kebele
Approx_No. Age_Group
Sex
Migration_Period
Migration Trend
Migration_Reason
All age groups
All age groups
All age groups
both
both
male
october and
november
october and
november
october and
november
Increased
Increased
Decreased
There is usual
seasonal mobility in
search of grazing and
water for livestock.
The younger groups
move with livestock
to rival ethnic
border areas
(Dasenech and
Gnangatom
weredas). Mobility in
search of grazing is
increasing from time
to time due to
depletion of pasture
land
Destination
Usual mobility for grazing
is to Mago national park,
Benatsemay wereda and
nearby areas to Gnangatom
and Dasenech weredas
82
Page 1 of 3
Wereda Disaster
Risk Profile
Data_Collected_Date
September 2010
Disaster Risk Management and Food
Security Sector (DRMFSS)
Tuesday, September 30, 2014
Region S.N.N.P
Selected Indicator
Kebele Name
QUARO
Zone SOUTH OMO
Wereda HAMER
Economic Vulnerability: Level of Migration - Migration level and its characteristics by Kebele
Approx_No.
223
Age_Group
All age groups
Sex
Both
Migration_Period
october and
november
Migration Trend
Decreased
Migration_Reason
There is usual
seasonal mobility in
search of grazing and
water for livestock.
The younger groups
move with livestock
to rival ethnic
border areas
(Dasenech and
Gnangatom
weredas). Mobility in
search of grazing is
increasing from time
to time due to
depletion of pasture
land
Destination
Usual mobility for grazing
is to Mago national park,
Benatsemay wereda and
nearby areas to Gnangatom
and Dasenech weredas
83
Page 2 of 3

Wereda Disaster
Risk Profile
Data_Collected_Date
September 2010
Disaster Risk Management and Food
Security Sector (DRMFSS)
Tuesday, September 30, 2014
Region S.N.N.P
Selected Indicator
Kebele Name
BESSA MEJAN
HEDBAK
GEDBAK
MINOGELTI
Zone SOUTH OMO
Wereda HAMER
Economic Vulnerability: Level of Migration - Migration level and its characteristics by Kebele
Approx_No.
Age_Group
All age groups
Sex
male
There is no
migration
history
There is no
migration
No migration
history
Migration_Period
october and
november
Migration Trend
Decreased
Decreased
Migration_Reason
There is usual
seasonal mobility in
search of grazing and
water for livestock.
The younger groups
move with livestock
to rival ethnic
border areas
(Dasenech and
Gnangatom
weredas). Mobility in
search of grazing is
increasing from time
to time due to
depletion of pasture
land
----
----
Destination
Usual mobility for grazing
is to Mago national park,
Benatsemay wereda and
nearby areas to Gnangatom
and Dasenech weredas
84
Page 3 of 3
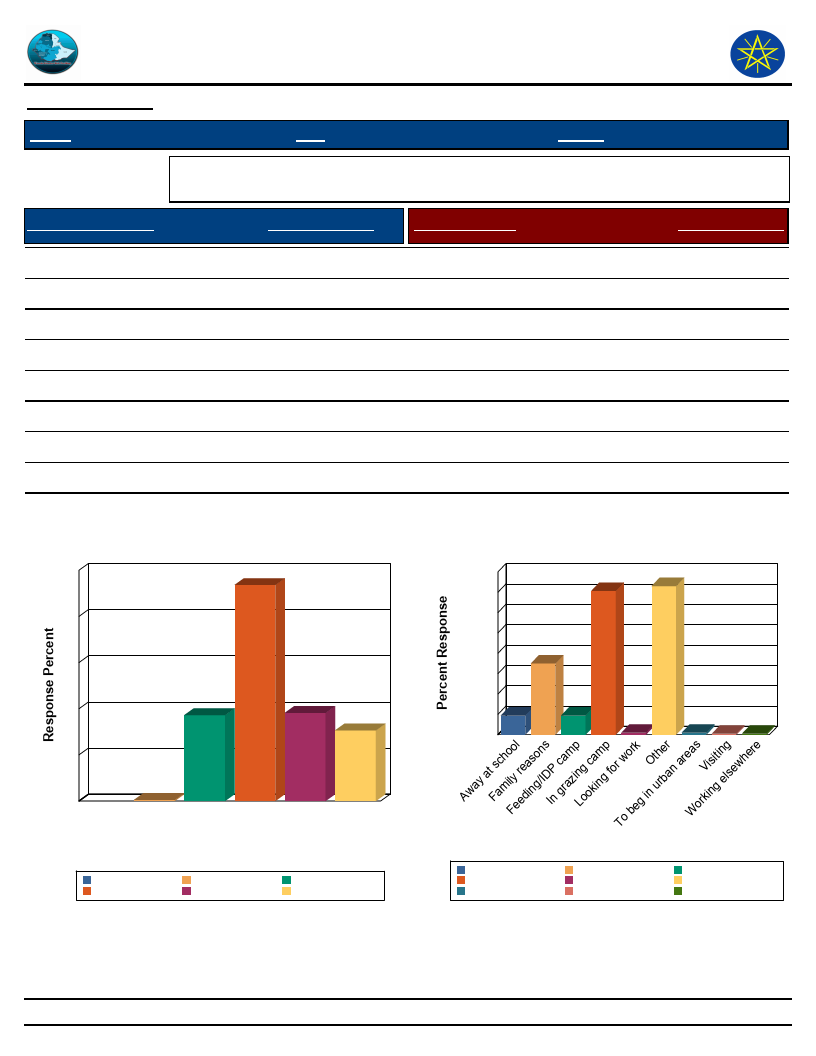
Wereda Disaster
Risk Profile
Data_Collected_Date
September 2010
Region S.N.N.P
Zone
Disaster Risk Management
and Food Security Sector (DRMFSS)
Tuesday, September 30, 2014
SOUTH OMO
Wereda HAMER
Selected Indicator
Economic Vulnerability: Household Migration - Household migration and reason
for migration
Duration of Migration
Response Percent
Migration Reason
Response Percent
Two weeks – month
A month – 3 months
3 – 6 months
> 6 months
Less than 2 weeks
15.30
46.80
18.60
0.24
19.10
Family reasons
Looking for work
Working elsewhere
In grazing camp
Visiting
Feeding/IDP camp
Away at school
To beg in urban areas
Other
17.50
0.49
0.25
35.30
0.25
4.69
4.69
0.49
36.50
Duration of Migration
50
47
40
30
20
19
19
15
10
0
0
> 6 3 – 6 A month Less Two
months months – 3 than 2 weeks –
months weeks month
Duration of Migration
A month – 3 months
> 6 months
Less than 2 weeks
3 – 6 months
Two weeks – month
Migration Reason
40
35
37
35
30
25
20
18
15
10
5
5
5
0
000
0
Away at school
In grazing camp
To beg in urban areas
Migration Reason
Family reasons
Looking for work
Visiting
Feeding/IDP camp
Other
Working elsewhere
85
Page 1 of 1
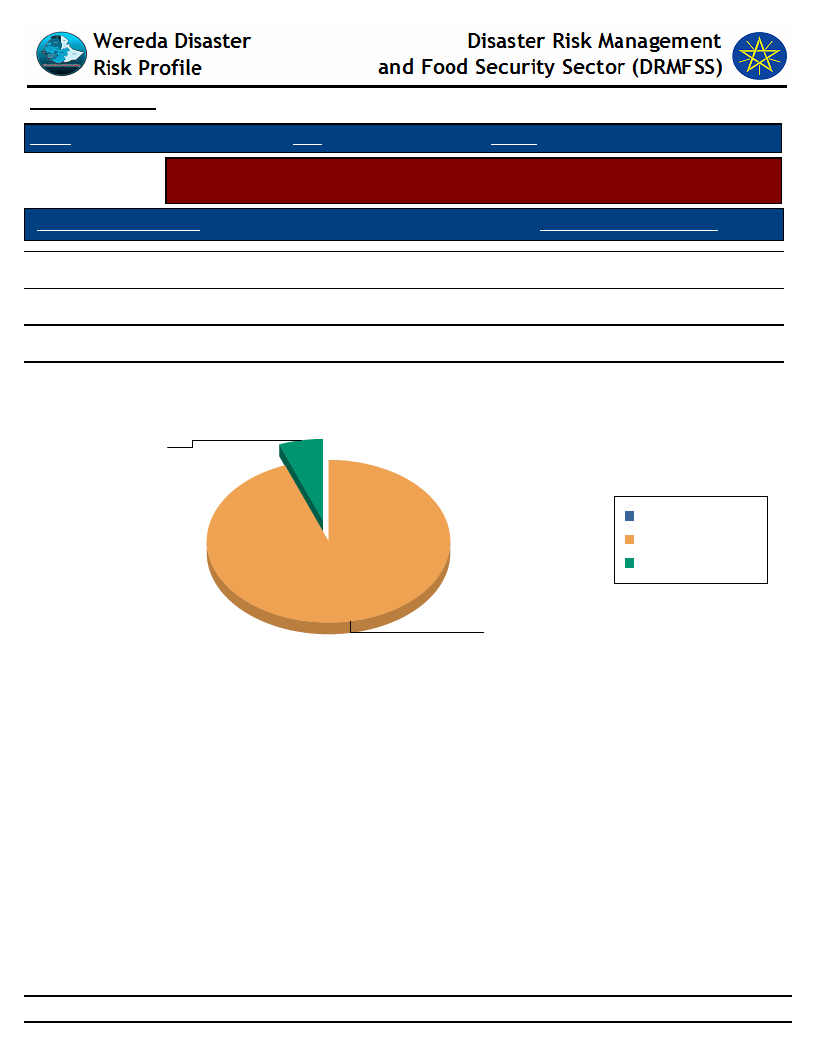
Data_Collected_Date September 2010
Tuesday, September 30, 2014
Region S.N.N.P
Zone SOUTH OMO
Wereda HAMER
Selected Indicator
Economic Vulnerability: Household Migration - Disasters as a triggering factor for
migration (households response in %)
Is Migration Due to Hazard?
HH Response - Due To Hazard
No
Yes
Migration partly because of such impacts
94.30
5.70
0.00
Is Migration Due to Hazard?
Yes
5.7
Migration partly because
of such impacts
No
Yes
No
94.3
86
Page 1 of 1
Data_Collected_Date
September 2010
Tuesday, September 30, 2014
Region S.N.N.P
Zone SOUTH OMO
Wereda HAMER
Selected Indictor: Demography: Population Structure
KEY:
Male
Female
Children
(0-12 yrs)
Older (Above
55 yrs)
Working
(25-55 yrs)
Youth (12-25
yrs)
ASELE
25%
4%
36%
34%
30%
7%
35%
28%
ERBORE
25%
7%
30%
38%
35%
6%
29%
30%
ERIYA
30%
5%
30%
35%
38%
6%
26%
30%
GEDBAK
25%
7%
32%
36%
36%
6%
24%
34%
KOLA KEJA
30%
5%
30%
35%
32%
4%
36%
28%
LALA
25%
4%
40%
31%
38%
6%
26%
30%
MRSHA
30%
10%
27%
33%
38%
11%
19%
32%
87
Page 1 of 1

Data_Collected_Date
Region S.N.N.P
September 2010
Zone
SOUTH OMO
Wereda
Selected Indicator
Demography: Population Trends and Ethnic Groups
Kebele Name
Population Change Trend
Population Change Reasons
Tuesday, September 30, 2014
HAMER
Ethnic_Groups
HEDBAK
SHANKO
BESSA MEJAN
MINOGELTI
SHESHA GOYKE
QUARO
ERBORE
KOLA KEJA
ERBORE
LALA
ERIYA
MRSHA
GEDBAK
ASELE
Increased
Increased
Increased
Increased
Increased
Increased
Increased
Increased
Increased
Increased
Increased
Increased
Increased
Increased
More children
B/c of high birth
More children birth
More birth of children
More birth of children
Birth of more children
Birth of more children
More children
Birth of more children
Birth of more children
Birth of more children
Birth of more children
Birth of more children
Birth of more children
Bena Tsemay
Hamer
Hamer
Hamer
Hamer
Hamer
Hamer
Hamer
Hamer
Hamer
Hamer
Hamer
Bena Tsemay and
Hamer
Hamer
88
Page 1 of 1

Data_Collected_Date
September 2010
Tuesday, September 30, 2014
Region S.N.N.P
Zone
SOUTH OMO
Wereda HAMER
Selected Indicator
Social Vulnerability: Household Demographic Characteristics - Demographic
characteristics of households
Demographic Indicator
Indicator_Value Comments
Average household size
6
Sex ratio
943 Number of females per 1000 males
Child sex ratio (under 14 yrs)
909 Number of females per 1000 males
Adult sex ratio (18 & Above yrs)
1,010 Number of females per 1000 males
Dependency ratio ([(0-14)+(64+)] / (15-64)
yrs)
1
Number of dependants per one economically
active person in the family
89
Page 1 of 1
Wereda Disaster
Risk Profile
Disaster Risk Management and Food
Security Sector (DRMFSS)
Data_Collected_Date
September 2010
Tuesday, September 30, 2014
Region S.N.N.P
Zone
SOUTH OMO
Wereda HAMER
Selected Indicator
Social Vulnerability: Level of Educational Attainment - Education status of household members
General Awareness
Percentage Educational Level
Percentage
Read and understand text - Easily
1.50
From Proportion of population (7+) - Less than 1st grade
92.40
Read and understand text - with difficulty
2.50
From Proportion of population (7+) - Primary (1-6)
6.27
Can write letters - easily
1.40
From Proportion of population (7+) - Secondary (7-12)
0.76
Can write letters - with difficulty
1.30
From Proportion of population (7+) - Technical
0.04
From Proportion of population (15+) - Primary (1-6)
4.31
From Proportion of population (15+) - Secondary (7-12)
0.92
General Literacy Rate
Proportion of literate population (7+) to total 7+
population
Percentage
4.80
From Proportion of population (15+) - Pursuing or
completed University
From Proportion of population (7+) - Pursuing or
completed University
From Proportion of population (15+) - Less than 1st
grade
Adult Literacy Rate
Proportion of literate population (15+) to total 15+
population
0.05
0.04
94.20
Percentage
3.80
90
Page 1 of 1
Data_Collected_Date
September 2010
Tuesday, September 30, 2014
Region S.N.N.P
Selected Indicator
Zone SOUTH OMO
Wereda HAMER
Social Vulnerability: Gender Parity - Gender parity in education level (7+ years)
and household heading
Educational Level
Less than 1st grade completed
Male_Percent
49.70
Female_Percent
50.29
01-12 Grade completed
87.90
12.14
01-12 Grade completed
76.20
11.76
Technical / vocational certificate or diploma
100.00
23.81
Pursuing University degree
100.00
0.00
University degree or higher
40.00
0.00
Male Head of HH
68.40
Female Head of HH
31.60
91
Page 1 of 1
WDRP Indicators
Environmental Characteristics
92

Data_Collected_Date
September 2010
Tuesday, September 30, 2014
Region S.N.N.P
Zone SOUTH OMO
Wereda HAMER
Selected Indicator
Environmental Situation: Environmental Problems - Major environmental
problems by Kebele
KebeleName
Problem_1
Problem_2
Problem_3
Problem4
HEDBAK
Deforestation
Soil erosion
Pests
SHANKO
Deforestation
Soil erosion
Pests
DEGA KEJA
Deforestation
Pests
Soil erosion
SHANKO 2
Deforestation
Soil erosion
Pests
BESSA MEJAN
MINOGELTI
Range land
degradation
Deforestation
Deforestation
Erosion
Pasture
encroachment
SHESHA GOYKE
Deforestation
QUARO
KOLA KEJA
ERBORE
Deforestation
Range land
encroachment
Deforestation
Formation of gullies
by recurrent
flooding
Soil erosion
Deforestation
Pests
Flooding
LALA
Deforestation
Soil erosion
Pests
ERIYA
Deforestation
Soil erosion
MRSHA
GEDBAK
Pasture land
degradation(depletio
n)
Deforestation
Soil erosion
Soil erosion
Deforestation
Pests
Increasing
temperature
ASELE
Deforestation
Pests
WENBAYNO
Deforestation
Soil erosion
Pests
93
Page 1 of 1

Data_Collected_Date
September 2010
Tuesday, September 30, 2014
Region S.N.N.P
Selected Indicator
KebeleName
Zone SOUTH OMO
Wereda HAMER
Environmental Situation: Deforestation - Observed changes over levels of
deforestation by the community and its problems
Changes_Observed
Problems_Due_To_Changes
HEDBAK
SHANKO
DEGA KEJA
ADAMIE
SHANKO 2
BESSA MEJAN
At current condition
there is no any type
of forest tree at the
mountains and hills
except bushes and
shrubs at some place
High level of
deforestation
2/4 of the PA forest
has been cut down
for settlement and
farm extension
purpose
The level of forest is
decreasing from time
to time owing cut
down for farm
extension and natural
damages
The PA was full of
forest with diversity
of local tree species,
but now more than
3/4 cleared off for
farm purpose and
shifting cultivation
Many large trees are
diminishing due to
increase of cutting
for house
construction at towns
Thick forest areas are
diminished and are
replaced by bushes
and shrubs
Increase environmental temperature, reduce of soil
fertility, and reduce of rain fall
Great valley, loss of soil fertility
Increase environmental temperature, increase run off,
depletion of water resource, depletion of grazing resource
Increase environmental temperature, increase damage of
farm land, formation of unsuitable land scape for water
fetching and livestock watering
Increasing soil erosion, decreasing soil fertility, reduces
honey production, reduce of feed and water shortages
Decrease production of honey, absconding of bee colony
94
Page 1 of 4

Data_Collected_Date
September 2010
Tuesday, September 30, 2014
Region S.N.N.P
Selected Indicator
KebeleName
Zone SOUTH OMO
Wereda HAMER
Environmental Situation: Deforestation - Observed changes over levels of
deforestation by the community and its problems
Changes_Observed
Problems_Due_To_Changes
MINOGELTI
SHESHA GOYKE
QUARO
MURALE
KOLA KEJA
ERBORE
Many forest trees
have damaged and
bushes and shrubs
have been replacing
them
The level of
deforestation is
decreasing from time
to time b/c of village
establishment by new
house hold heads
The level of
deforestation is
increasing very
rapidly particularly
beside Woito river
owing to farm
extension (irrigation
farm) both in PA and
other areas
At current condition
there is no any type
of forest even beside
Woito river All places
have become bare
land
However there is
encroachment of
bushes and shrubs the
level of forest trees
decreasing by 75%
There is high level of
deforestation beside
Woito river for farm
extension
Reduce of forest harvest (incense and sum), increase
environmental temperature, reducing of honey production
Increasing environmental temp and wind, shortage of bee
hive hanging trees, decrease of honey production,
absconding due to lack of shade for bee hives
Exposure to un expected flooding, crop land damage, crop
damage, increased environmental temp
Flooding of villages, farm places (un timely flooding),
increasing environmental temperature
Increment of environmental temperature and change of
environment
Unexpected flooding of settlements and damage of farm and
grazing land, loss of moisture for flood retreat agriculture,
damage of large trees, increasing environmental
temperature
95
Page 2 of 4

Data_Collected_Date
September 2010
Tuesday, September 30, 2014
Region S.N.N.P
Selected Indicator
KebeleName
Zone SOUTH OMO
Wereda HAMER
Environmental Situation: Deforestation - Observed changes over levels of
deforestation by the community and its problems
Changes_Observed
Problems_Due_To_Changes
LALA
ERIYA
MRSHA
GEDBAK
There is only 1/4 of
the previously
available dense forest
Virtually all forest
places cleared off for
crop land and
settlement
Before 10 to 15 2/4
of the PA was
covered by dense
forest and it had
been rich in honey
production grazing
and watering points
for the PA herders
and vicinity PAs, but
now it has cleared for
different purposes
There are no large
trees at all which
have been used for
shade for community
and livestock instead
the land is infested
with noxious plants
and bushes It has
reduced by 3/4
Almost 98% of the PA
has become bare and
rocky land due to
continuous
deforestation for
farm extension and
settlement
Formation of up and down land scape, damage of pastures
and crop land, reduces of crop and livestock produce,
reduce of honey produce and increasing absconding
Shortage of pasture land ,feed shortage, increase
environmental temperature, increase soil erosion,
decreased honey production and livestock produce,
increased livestock diseases due to lack of resistance
Exposure to high environmental temperature, high and
untimely continuous wind
Depletion of streams ,shortage of water at peak dry
seasons, increasing leech attack, increasing soil erosion,
reduced soil fertility, reduced pasture land and shortage
96
Page 3 of 4

Data_Collected_Date
September 2010
Tuesday, September 30, 2014
Region S.N.N.P
Selected Indicator
KebeleName
ASELE
Zone SOUTH OMO
Wereda HAMER
Environmental Situation: Deforestation - Observed changes over levels of
deforestation by the community and its problems
Changes_Observed
Problems_Due_To_Changes
All large trees
diminished and only
small bushes and
shrubs are available
at unsuitable areas
for farm extension
and settlement
Increasing environmental temperature, reduced livestock
produce, increasing soil erosion, damage of pasture and
crop land
97
Page 4 of 4

Wereda Disaster
Risk Profile
Data_Collected_Date
September 2010
Disaster Risk Management
and Food Security Sector (DRMFSS)
Tuesday, September 30, 2014
Region S.N.N.P
Zone SOUTH OMO
Wereda
HAMER
Selected Indicator
KebeleName
Environmental Situation: Natural Resources Availability - Natural resources available and changes observed by
the community
SHANKO
Resources_1
Observed_Change_1
Land for grazing
Decreased
Resources_3
Observed_Change_3
Water
Decreased
Problems_Changes_1
Resources_2
Increase number of livestock and human
population
Forest bee keeping
Problems_Changes_3
Resources_4
Shortage of rain fall
Observed_Change_2
Decreased
Observed_Change_4
Problems_Changes_2
Decrease b/c of rain fall and deforestation
Problems_Changes_4
KebeleName
Resources_1
DEGA KEJA
Grazing land
Observed_Change_1
Almost 75% of the PA grazing land depleted
Problems_Changes_1
Resources_2
"Shortage livestock feed and long distance
mobility for
Observed_Change_2
Problems_Changes_2
Resources_3
Observed_Change_3
Problems_Changes_3
Resources_4
Observed_Change_4
Problems_Changes_4
98
Page 1 of 9

Wereda Disaster
Risk Profile
Data_Collected_Date
September 2010
Disaster Risk Management
and Food Security Sector (DRMFSS)
Tuesday, September 30, 2014
Region S.N.N.P
Zone SOUTH OMO
Wereda
HAMER
Selected Indicator
KebeleName
Environmental Situation: Natural Resources Availability - Natural resources available and changes observed by
the community
SHANKO 2
Resources_1
Observed_Change_1
Problems_Changes_1
Resources_2
Forest
At current condition it can be said no
forest
"Increasing soil erosion and reduced soil
fertility reduce
Resources_3
Observed_Change_3
Problems_Changes_3
Resources_4
Observed_Change_2
Observed_Change_4
Problems_Changes_2
Problems_Changes_4
KebeleName
ERBORE
Resources_1
Forest
Observed_Change_1
Problems_Changes_1
"Forest which was found beside Woito river
is
Resources_2
Observed_Change_2
Problems_Changes_2
Resources_3
Observed_Change_3
Problems_Changes_3
Resources_4
Observed_Change_4
Problems_Changes_4
99
Page 2 of 9
Wereda Disaster
Risk Profile
Data_Collected_Date
September 2010
Disaster Risk Management
and Food Security Sector (DRMFSS)
Tuesday, September 30, 2014
Region S.N.N.P
Zone SOUTH OMO
Wereda
HAMER
Selected Indicator
KebeleName
Environmental Situation: Natural Resources Availability - Natural resources available and changes observed by
the community
QUARO
Resources_1
Observed_Change_1
Land
There is no shortage of land
Resources_3
Observed_Change_3
Problems_Changes_1
Resources_2
"There is no shortage of land except
depletion of pasture for
Problems_Changes_3
Resources_4
Observed_Change_2
Observed_Change_4
Problems_Changes_2
Problems_Changes_4
KebeleName
Resources_1
LALA
Forest
Observed_Change_1
Problems_Changes_1
Resources_2
The pa was full of dense forest but now
clear off
"Increased soil erosion, depletion of water
resources, increased
Observed_Change_2
Problems_Changes_2
Resources_3
Observed_Change_3
Problems_Changes_3
Resources_4
Observed_Change_4
Problems_Changes_4
100
Page 3 of 9

Wereda Disaster
Risk Profile
Data_Collected_Date
September 2010
Disaster Risk Management
and Food Security Sector (DRMFSS)
Tuesday, September 30, 2014
Region S.N.N.P
Zone SOUTH OMO
Wereda
HAMER
Selected Indicator
Environmental Situation: Natural Resources Availability - Natural resources available and changes observed by
the community
KebeleName
HEDBAK
Resources_1
Observed_Change_1
Problems_Changes_1
Resources_2
Observed_Change_2
There were dense bushes and shrubs on
mountains, but all are deforested for
settlement purposes therefore there is no
fRoeredsutcaenddvosuluitmabeleoflastnrdearemsso,uarcnd
decreasing browses for shoats and soil
fertility and increasing temperature
Resources_3
Observed_Change_3
Problems_Changes_3
Resources_4
Observed_Change_4
Problems_Changes_2
Problems_Changes_4
KebeleName
ADAMIE
Resources_1
Water
Observed_Change_1
Problems_Changes_1
There is high water resource and still no
change on the resource
Resources_2
Observed_Change_2
Problems_Changes_2
Land
There is vast and fertile cultivable land
Encroachment by bushes, shrubs and
hammer livestock due to shortage of pasture
at hammer areas
Resources_3
Observed_Change_3
Problems_Changes_3
Resources_4
Observed_Change_4
Problems_Changes_4
Fish
There is plenty of fish resource which is still
untouched
No problem
101
Page 4 of 9
Wereda Disaster
Risk Profile
Data_Collected_Date
September 2010
Disaster Risk Management
and Food Security Sector (DRMFSS)
Tuesday, September 30, 2014
Region S.N.N.P
Zone SOUTH OMO
Wereda
HAMER
Selected Indicator
Environmental Situation: Natural Resources Availability - Natural resources available and changes observed by
the community
KebeleName
BESSA MEJAN
Resources_1
Grazing land
Resources_3
Water
Observed_Change_1
Problems_Changes_1
Resources_2
The grazing land is depleting owing to
encroachment
Shortage of pasture, conflict, reduces of
livestock produce, loss of livestock asset
Forest and wild life
Observed_Change_3
Problems_Changes_3
Resources_4
Subsurface water sources is depleting in
temp sandy rivers
Water shortage for livestock and human
beings, mobility for search of water and
prove to conflict
Observed_Change_2
Large trees are falling which were used for
Problems_Changes_2
bee hive hung
Absconding of bee colony, low production of
honey, low income
KebeleName
MINOGELTI
Observed_Change_4
Problems_Changes_4
Resources_1
Browsing and grazing land
Resources_3
Observed_Change_1
Problems_Changes_1
Resources_2
The grazing and pasture land is degrading
due recurrent drought and over grazing
Shortage of livestock feed and water,
mobility for search of grazing, reduce of
Folirveesstthoackrvpersotduce and productivity
Observed_Change_3
Problems_Changes_3
Resources_4
Observed_Change_2
Observed_Change_4
Problems_Changes_2
Increased conflict due to increased
movement for grazing and watering points,
introducing of new diseases
Problems_Changes_4
102
Page 5 of 9

Wereda Disaster
Risk Profile
Data_Collected_Date
September 2010
Disaster Risk Management
and Food Security Sector (DRMFSS)
Tuesday, September 30, 2014
Region S.N.N.P
Zone SOUTH OMO
Wereda
HAMER
Selected Indicator
Environmental Situation: Natural Resources Availability - Natural resources available and changes observed by
the community
KebeleName
SHESHA GOYKE
Resources_1
Forest product(incense and gum)
Resources_3
Observed_Change_1
It is diminishing very rapidly
Observed_Change_3
Problems_Changes_1
Resources_2
Observed_Change_2
Lack of income(incense and gum
income),reduce of honey production,
absconding of bee colony
Problems_Changes_3
Resources_4
Observed_Change_4
Problems_Changes_2
Problems_Changes_4
KebeleName
MURALE
Resources_1
Water
Observed_Change_1
Problems_Changes_1
Resources_2
The water source is diminishing during dry
seasons
Lack of water for livestock and wild life,
too distant travel for search of water
Forest
Observed_Change_2
Problems_Changes_2
May forest places are cleared of for farm
purposes
Flooding and damage of crops
Resources_3
Observed_Change_3
Problems_Changes_3
Resources_4
Observed_Change_4
Problems_Changes_4
103
Page 6 of 9

Wereda Disaster
Risk Profile
Data_Collected_Date
September 2010
Disaster Risk Management
and Food Security Sector (DRMFSS)
Tuesday, September 30, 2014
Region S.N.N.P
Zone SOUTH OMO
Wereda
HAMER
Selected Indicator
Environmental Situation: Natural Resources Availability - Natural resources available and changes observed by
the community
KebeleName
KOLA KEJA
Resources_1
Grazing land
Resources_3
Observed_Change_1
Problems_Changes_1
Resources_2
Observed_Change_2
Problems_Changes_2
It is deteriorating due to toxic plant
encroachment
Increased mobility for search of grazing
and water reduction in livestock
Inpcreondsuecatinodngaunmd tprreoeduce
It becomes diminishing due to poor
management and indiscriminate cutting
Observed_Change_3
Problems_Changes_3
Resources_4
Observed_Change_4
Problems_Changes_4
KebeleName
ERIYA
Resources_1
Grazing land
Observed_Change_1
Problems_Changes_1
Resources_2
The area was full of pasture but now it is
degraded
Shortage of pasture land, reduce of
livestock production
Forest
Observed_Change_2
Problems_Changes_2
There was dense forest in the pa, but now it
is totally cleared
Decrease environmental temperature,
depletion of water resources
Resources_3
Observed_Change_3
Problems_Changes_3
Resources_4
Observed_Change_4
Problems_Changes_4
Cultivable land
There was fertile soil for agriculture before,
but now it is losing its fertility
Frequent shift of grazing land and narrow of
pasture land, loss soil fertility
104
Page 7 of 9

Wereda Disaster
Risk Profile
Data_Collected_Date
September 2010
Disaster Risk Management
and Food Security Sector (DRMFSS)
Tuesday, September 30, 2014
Region S.N.N.P
Zone SOUTH OMO
Wereda
HAMER
Selected Indicator
Environmental Situation: Natural Resources Availability - Natural resources available and changes observed by
the community
KebeleName
MRSHA
Resources_1
Grazing land
Resources_3
Observed_Change_1
It becomes diminishing from year to year
Observed_Change_3
Problems_Changes_1
Resources_2
Observed_Change_2
Increased mobility for search of livestock
feed and water, loss of livestock produce
Foarnedstincome
No forest at all in pa
Problems_Changes_3
Resources_4
Observed_Change_4
Problems_Changes_2
Change of environmental temp
Problems_Changes_4
KebeleName
GEDBAK
Resources_1
Stream water
Observed_Change_1
Problems_Changes_1
Resources_2
Observed_Change_2
Problems_Changes_2
There were many spring water points ,but
currently depleting
Shortage of drinking water at peak dry
seasons, increased leech attack for
Folirveessttock ,depletion of spring water points
There was dense forest before 15 years ,but
now there is no any type of forest tree in
Increasing soil erosion, increase wind
the pa
pressure, reduce of crop produce, shortage
of rain, shortage of trees for shade, shortage
of honey produce and absconding
Resources_3
Observed_Change_3
Problems_Changes_3
Resources_4
Observed_Change_4
Problems_Changes_4
105
Page 8 of 9
Wereda Disaster
Risk Profile
Data_Collected_Date
September 2010
Disaster Risk Management
and Food Security Sector (DRMFSS)
Tuesday, September 30, 2014
Region S.N.N.P
Zone SOUTH OMO
Wereda
HAMER
Selected Indicator
KebeleName
Environmental Situation: Natural Resources Availability - Natural resources available and changes observed by
the community
ASELE
Resources_1
Grazing and browsing land
Resources_3
Observed_Change_1
Problems_Changes_1
Resources_2
The grazing and browsing land getting poor
owing to over grazing and encroachment of
Long distance mobility for search of
noxious plants
grazing
Forest
Observed_Change_3
Problems_Changes_3
Resources_4
Observed_Change_2
Problems_Changes_2
There is no forest tree at current condition,
but before there was dense forest in the pa
Reduce of soil fertility, increased
environmental temp, reduced honey
production, absconding, and reduced pasture
quality
Observed_Change_4
Problems_Changes_4
106
Page 9 of 9

Wereda Disaster
Risk Profile
Data_Collected_Date
September 2010
Disaster Risk Management
and Food Security Sector (DRMFSS)
Tuesday, September 30, 2014
Region S.N.N.P
Selected Indicator
Zone SOUTH OMO
Wereda HAMER
Environmental Situation: Rainfall & Temperature - Observed changes on rainfall and temperature by the
community over the last decade
Rainfall
Temperature
Kebele Name
HEDBAK
SHANKO
DEGA KEJA
SHANKO 2
Changes Observed Problems
Low
Crop damage, hunger, low income
Low
The rain fall
condition has
been decreasing
in the last 10
years
The rain fall
condition is
deteriorating from
year to year
before 10 years
the main rain
(belg rain)was for
2 and 1/2 months
but now it does
not stay more
than 20 days
Shortage of livestock pasture
Shortage of pasture and water
points, damage of crops and hunger,
damage of forest
Damage of crop at flowering stage,
depletion of sub surface water,
shortage of feed and water, increase
crop pest infestation
Changes Observed
Problems
High
High
Depletion of water sources, damage on
bushes and shrubs
Damage of water points
Increasing from
year to year
Dryness of watering sources and damage
on plants
It is increasing
every year
High environmental temperature, dry of
pasture and browses with on a short
period of time after rain
107
Page 1 of 5

Wereda Disaster
Risk Profile
Data_Collected_Date
September 2010
Disaster Risk Management
and Food Security Sector (DRMFSS)
Tuesday, September 30, 2014
Region S.N.N.P
Selected Indicator
Zone SOUTH OMO
Wereda HAMER
Environmental Situation: Rainfall & Temperature - Observed changes on rainfall and temperature by the
community over the last decade
Rainfall
Temperature
Kebele Name
BESSA MEJAN
MINOGELTI
SHESHA GOYKE
Changes Observed Problems
The rain fall
condition is
deteriorating from
year to year
before 10 years
the main rain
(belg rain)was for
2 and 1/2 months
but now it does
not stay more
than 20 days
Shortage of pasture, shortage of
water in temporary sandy rivers crop
damage, loss of asset, in ability to
save asset (livestock resource), and
loss of honey production
"It could be said
there is no rain in
the pa for the last
5 to 6 years, but
this 2002 etc
there was better
rain fall as
At this time it can
be say ,there is no
rain throughout
the year
Selling goats to purchase grain and
resource diminishing from time to
time, degradation of range land,
depletion of water sources
Changes Observed
Problems
It is increasing
every year as well
also
"Increased sun burn, dry of pasture within
a short period of time, depletion
Increasing from
year to year
High environmental temperature,
depletion /or diminishing of water
resources
108
Page 2 of 5
Wereda Disaster
Risk Profile
Data_Collected_Date
September 2010
Disaster Risk Management
and Food Security Sector (DRMFSS)
Tuesday, September 30, 2014
Region S.N.N.P
Selected Indicator
Zone SOUTH OMO
Wereda HAMER
Environmental Situation: Rainfall & Temperature - Observed changes on rainfall and temperature by the
community over the last decade
Rainfall
Temperature
Kebele Name
QUARO
KOLA KEJA
ERBORE
Changes Observed Problems
The level of rain
fall is reducing
from time to time
due to unknown
cases
Shortage of livestock feed
It can be said, the
level of rain fall
changed by
(decreased)
threefold of the
previous level of
rain fall
"Sale of a number of livestock for
grain,
The rain fall
condition is
affected too much
within this ten
years
"Reduce of livestock produce; reduce
of
Changes Observed
Problems
Increasing from
year to year
"High sun burn, dryness of grasses and
browses in short period of time after
109
Page 3 of 5

Wereda Disaster
Risk Profile
Data_Collected_Date
September 2010
Disaster Risk Management
and Food Security Sector (DRMFSS)
Tuesday, September 30, 2014
Region S.N.N.P
Selected Indicator
Zone SOUTH OMO
Wereda HAMER
Environmental Situation: Rainfall & Temperature - Observed changes on rainfall and temperature by the
community over the last decade
Rainfall
Temperature
Kebele Name
LALA
ERIYA
MRSHA
Changes Observed Problems
"It can be said no
rain when
compared with
the previous
condition before
15 to 20 years it
was raining for 60
to 65
The rain fall
condition is
becoming erratic
and its
distribution
become un even
in the same PA
"The belg rain used to start
mid-February
"The level of rain
fall is reducing
from time to time
its distribution is
also uneven there
is also high
seasonal
Changes Observed
Problems
110
Page 4 of 5
Wereda Disaster
Risk Profile
Data_Collected_Date
September 2010
Disaster Risk Management
and Food Security Sector (DRMFSS)
Tuesday, September 30, 2014
Region S.N.N.P
Selected Indicator
Zone SOUTH OMO
Wereda HAMER
Environmental Situation: Rainfall & Temperature - Observed changes on rainfall and temperature by the
community over the last decade
Rainfall
Temperature
Kebele Name
GEDBAK
Changes Observed Problems
The rain fall
condition has
become erratic
and deteriorating
year to year
"Damage of crop at seedling stage,
shortage
Changes Observed
Problems
111
Page 5 of 5
Data_Collected_Date
September 2010
Tuesday, September 30, 2014
Region S.N.N.P
Zone SOUTH OMO
Wereda HAMER
Selected Indicator
KebeleName
Environmental Situation: Reasons for Environmental Changes
Reason_For_Environmental_Changes
GEDBAK
SHANKO
SHANKO 2
MRSHA
MINOGELTI
ERBORE
KOLA KEJA
QUARO
ERIYA
Increased population and its consequences (increasing settlement, farm
expansion, deforestation far from expansion)
Deforestation, increasing the number of livestock population, increasing
the number of human population b/c of high birth
Deforestation, farm expansion owing to increasing population and
settlement Pasture and browsing plants degradation by over grazing
Deforestation, over grazing of pasture land, settlement increment is the
main causes of environmental change in the area
Deforestation, increased population(increased settlement),recurrent
drought and over grazing, farm practice without yield is also another cause
Irrigation farm expansion in low and high lands beside Omo river is the
main case for environmental changes other area
Deforestation, pastoral land degradation, expansion of farm land without
yield, over grazing due to increasing livestock number, increased
settlement due to increasing population
Irrigation farm expansion and its consequences (deforestation and over
utilization of woito river)
Deforestation, over grazing
ASELE
Deforestation, increasing human and livestock population
HEDBAK
ADAMIE
Increased population and its consequences (increasing settlement, farm
extension, deforestation far from extension)
Over grazing of the area by hammer ethnic livestock’s
MURALE
Deforestation
MRSHA
change of rain fall scanty rain shower and untimely raining, deforestation
and soil degradation
112
Page 1 of 1

Data_Collected_Date
September 2010
Tuesday, September 30, 2014
Region S.N.N.P
Zone SOUTH OMO
Wereda HAMER
Selected Indicator
KebeleName
Environmental Situation: Soil Erosion - Observed changes on levels of soil erosion
by the community
Changes_Observed
Problems_Observed
HEDBAK
High
Reduce of crop produce, farm land and pasture land
SHANKO
DEGA KEJA
SHANKO 2
BESSA MEJAN
MINOGELTI
SHESHA GOYKE
QUARO
KOLA KEJA
High during rainy
season
The level of soil
erosion is increasing
from season to season
The level of soil
erosion is increasing
many farm and
pasture places are
exposed for soil
erosion
The level of erosion is
increasing from time
to time due to
deforestation
"There is such
anticipated soil
erosion change due to
deterioration of rain
fall and
High
The land scape is
plain, which is not
exposed to soil
erosion
High
Loss of soil fertility
"Damage of farm places, damage grazing places, loss of
fertile soil at farm places,
Damage of farm places, damage of pasture land,
deforestation for farm shifting
Damage of crop and grazing lands
There are eroded places on grazing points different from
the previous yrs
Many grazing places become unsuitable for grazing and
pasture land
113
Page 1 of 2

Data_Collected_Date
September 2010
Tuesday, September 30, 2014
Region S.N.N.P
Zone SOUTH OMO
Wereda HAMER
Selected Indicator
KebeleName
ERBORE
LALA
ERIYA
MRSHA
GEDBAK
ASELE
Environmental Situation: Soil Erosion - Observed changes on levels of soil erosion
by the community
Changes_Observed
Problems_Observed
"There is no as such
anticipated level of
erosion owing to plain
land, all places on
The land scape is
plain, which is not
exposed to soil
erosion
"Reduce of soil fertility; reduce of crop production,
formation of gullies and gorges
High
"Damage of farm and pasture land, frequent farm land
shifting and bush clearing
At least 1/4 of the PA
land is eroding, there
is high run off at the
time rain shower
Many pasture lands become gullies and caused feed
shortage
There is high soil
erosion
Reduce crop produce, formation of gullies and gorges at
farm places
The level of erosion is
increasing from time
to time
Reduced fertility of land, formation of gullies and gorges
114
Page 2 of 2
WDRP Indicators
Livelihood, Occupation and Source
of Food Characteristics
115

Wereda Disaster
Risk Profile
Data_Collected_Date
September 2010
Disaster Risk Management and Food
Security Sector (DRMFSS)
Tuesday, September 30, 2014
Region S.N.N.P
Zone
SOUTH OMO
Wereda HAMER
Selected Indicator
Economic Vulnerability: Major Occupational Categories - Major categories of occupation and percent of population
engaged in the occupation by Kebele
Occupational Categories and Percent of Population engaged within these occupational categories
Percent (%) of Population
KebeleName
Occupation 1
Population Occupation 2
Population Occupation 3
Population Occupation 4
Population
HEDBAK
Crop production
Livestock production
Bee keeping
SHANKO
Livestock production
Crop production
Goats
DEGA KEJA
Livestock production
Crop production
Bee keeping
SHANKO 2
Livestock production
Crop production
Bee keeping
BESSA MEJAN
Livestock production
Bee keeping
Crop production
MINOGELTI
Livestock production
Bee keeping
SHESHA GOYKE
Livestock production
Bee keeping
ERBORE
Livestock production
Crop production
KOLA KEJA
Livestock production
Crop production
Bee keeping
QUARO
Livestock production
Crop production
LALA
Livestock production
Crop production
Bee keeping
ERIYA
Livestock production
Bee keeping
Crop production
116
Page 1 of 2
Wereda Disaster
Risk Profile
Data_Collected_Date
September 2010
Disaster Risk Management and Food
Security Sector (DRMFSS)
Tuesday, September 30, 2014
Region S.N.N.P
Zone
SOUTH OMO
Wereda HAMER
Selected Indicator
Economic Vulnerability: Major Occupational Categories - Major categories of occupation and percent of population
engaged in the occupation by Kebele
Occupational Categories and Percent of Population engaged within these occupational categories
Percent (%) of Population
KebeleName
Occupation 1
Population Occupation 2
Population Occupation 3
Population Occupation 4
Population
MRSHA
Livestock production
Bee keeping
Crop production
GEDBAK
Crop production.
Livestock production
Bee keeping
ASELE
Livestock production
Crop production
Bee keeping
117
Page 2 of 2
Data_Collected_Date
September 2010
Tuesday, September 30, 2014
Region S.N.N.P
Zone SOUTH OMO
Wereda HAMER
Selected Indicator
Economic Vulnerability: Livelihoods - Households important sources of
livelihood (response in %)
Type of Livelihood Activity
Order of Importnce
Begging activities
1st
2nd
3rd
3.57
1.17
0.48
Daily laborer
0.68
0.50
0.24
Making jewellery
0.68
0.84
0.72
Pottery
1.02
1.34
1.44
Rearing & selling animals (camels, cattle, sheep, goats)
72.80
15.40
3.12
Sale_Of_Natural_Products - Charcoal
1.02
1.01
1.44
Sale_Of_Natural_Products - Firewood
1.02
2.85
6.47
Selling Cereal food crops (sorghum, maize, wheat, barley)
2.72
1.51
2.40
Selling dairy products (milk, butter, ghee, cheese)
1.02
39.50
30.20
Selling eggs (from own chickens) Beekeeping (selling honey
bees-wax, or bee-hives)
Selling Other foods (sugar, flour, coffee, etc.)
2.21
13.30
26.50
7.87
42.00
8.39
118
Page 1 of 1

Data_Collected_Date
September 2010
Tuesday, September 30, 2014
Region S.N.N.P
Zone SOUTH OMO
Wereda HAMER
Selected Indicator
Economic Vulnerability: Occupational Categories - Percent of population
above 15 years age by occupation categories
Type of Livelihood Activity
Main Occupation
Secondary Occupation
Below school age children
Cultivator
Neither studying nor working nor seeking work
Retired/ Old
Salaried
Student
Unemployed & seeking work
Agricultural labourer
Craftsman
Home-maker (housewife)
Livestock rearing
Non-agricultural labour
Shopkeeper and Petty trade
1st Occupation
0.45
19.80
2.73
1.65
0.11
2.56
0.11
0.06
0.11
0.40
71.90
0.06
0.06
2nd Occupation
0.00
0.72
0.00
1.80
1.08
0.06
0.54
71.00
0.18
0.00
0.18
17.50
0.48
119
Page 1 of 1
Wereda Disaster
Risk Profile
Data_Collected_Date
September 2010
Disaster Risk Management
and Food Security Sector (DRMFSS)
Tuesday, September 30, 2014
Region S.N.N.P
Zone SOUTH OMO
Wereda HAMER
Economic Vulnerability: Sources of Food - Households source for different food items (response in %)
Selected Indictor:
Source of Food
Types of Food Item
Begging
Borrowed
0.40
Casual labor
1.30
1.20
4.20
Free meals/Food assistance
4.20
Gathering catching
73.80
Gifts from friends/neighbors
25.00
25.90
4.80
120
0.40
7.70
15.30
0.40
3.90
11.80
9.10
33.30
2.00
36.40
Page 1 of 2
Wereda Disaster
Risk Profile
Data_Collected_Date
September 2010
Disaster Risk Management
and Food Security Sector (DRMFSS)
Tuesday, September 30, 2014
Region S.N.N.P
Zone SOUTH OMO
Wereda HAMER
Economic Vulnerability: Sources of Food - Households source for different food items (response in %)
Selected Indictor:
Source of Food
Types of Food Item
Other
Own cultivation/production
Purchase from roadside
vendor/tuck shop
Purchase subsidized food
from Kebele shop
Purchases from main shop
75.00
71.40
19.00
66.70
4.20
0.40
1.20
33.30
79.20
4.20
4.20
48.20
26.70
0.20
0.60
25.50
54.50
60.00
50.00
21.60
20.00
50.00
2.00
20.00
121
Page 2 of 2
WDRP Indicators
Crop Production Characteristics
122
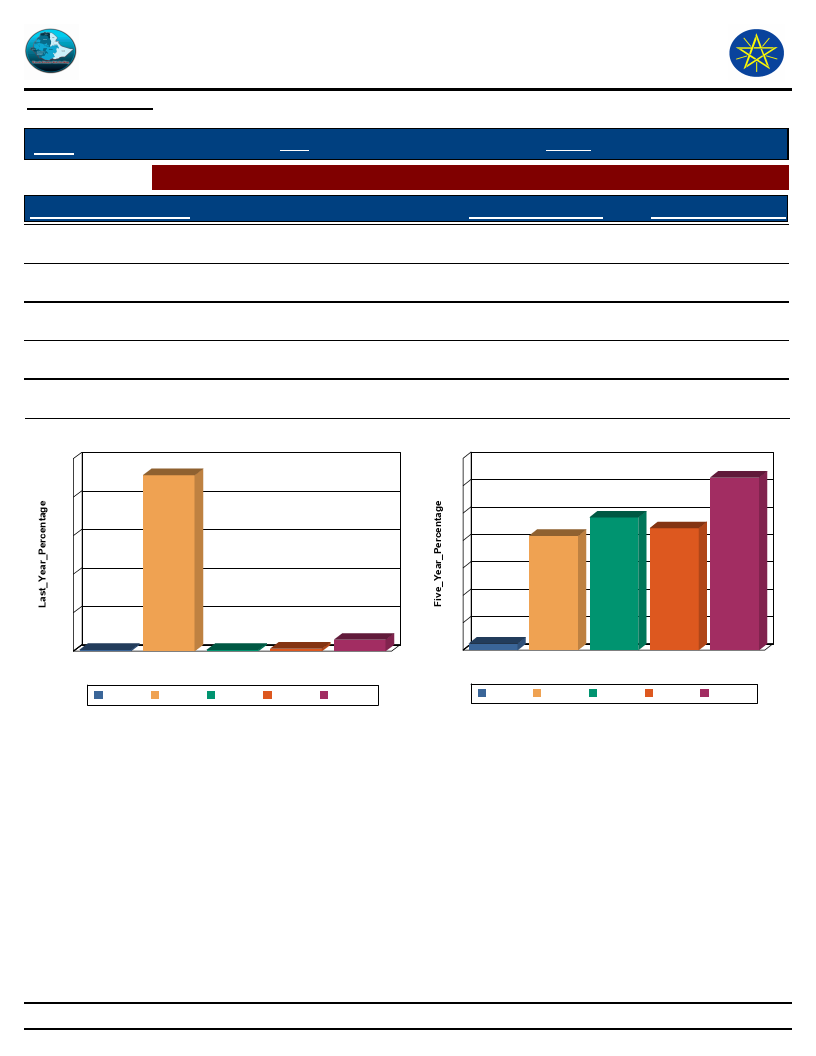
Wereda Disaster
Risk Profile
Data_Collected_Date
September 2010
Disaster Risk Management
and Food Security Sector (DRMFSS)
Tuesday, September 30, 2014
Region S.N.N.P
Zone SOUTH OMO
Wereda HAMER
Selected Indictor: Hazards: Change in Crop Damages - Proportion of Total Crop Damage
Extent of Crop Damage (%)
0
Last_Year_Percentage
0.66
Five_Year_Percentage
1.19
1 - 25
91.40
20.85
26 - 50
0.66
24.21
51 - 75
1.32
22.26
76 - 100
5.92
31.49
Extent of Crop Damage Last_Year
100
91
80
60
40
20
1
0
0
0
1
1
1 - 25
26 - 50
51 - 75
Extent of Crop Damage
1 - 25
26 - 50
51 - 75
6
76 - 100
76 - 100
Extent of Crop Damage Five Years Ago
35
31
30
25
24
22
21
20
15
10
5
1
0
0
0
1 - 25
26 - 50
51 - 75
Extent of Crop Damage
1 - 25
26 - 50
51 - 75
76 - 100
76 - 100
123
Page 1 of 1
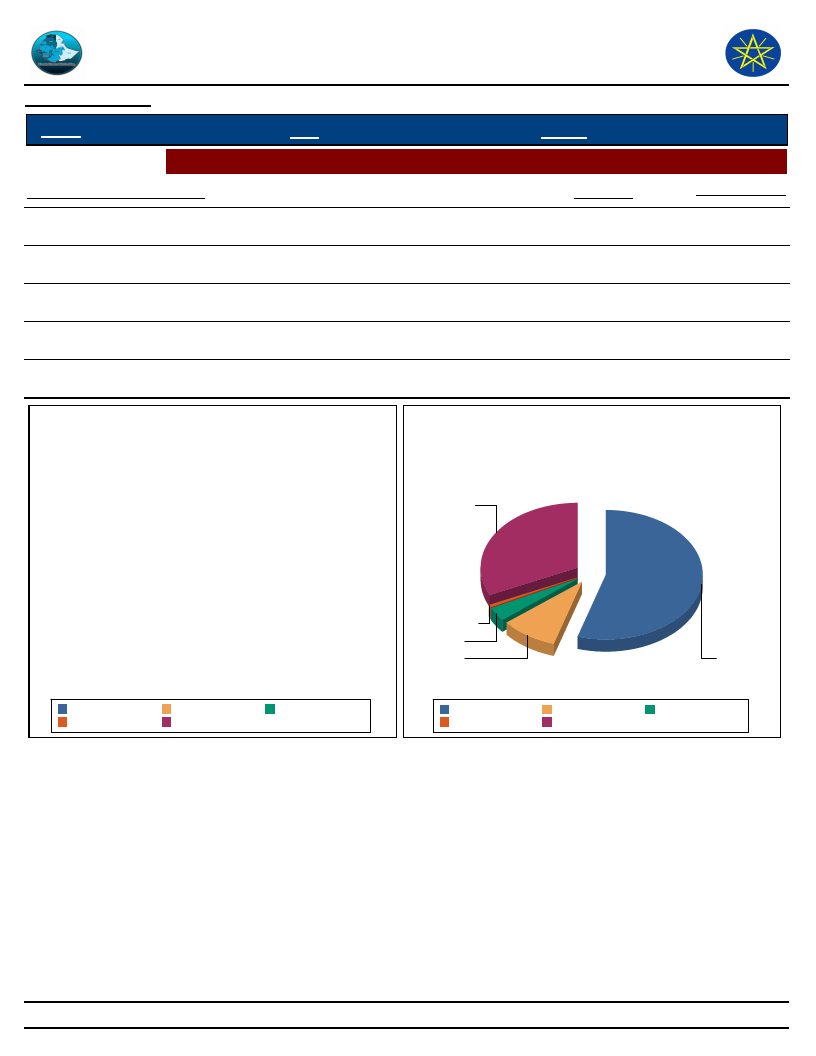
Wereda Disaster
Risk Profile
Data_Collected_Date
September 2010
Disaster Risk Management
and Food Security Sector (DRMFSS)
Tuesday, September 30, 2014
Region S.N.N.P
Zone SOUTH OMO
Wereda HAMER
Selected Indictor: Hazards: Change in Crop Damages - Major reasons for crop damage
Major Reason of Crop Damage
Last_Year
Five_Year_Ago
Pests / Termite
0.00
32.00
Drought
0.00
9.50
Flood
0.00
55.00
Frost/ Cold wave
0.00
3.40
Others (specify)
0.00
0.50
Major Reason of Crop Damage -
Last Year
Major Reason of Crop Damage -
Five Years Ago
Pests / Termite
Flood
Others (specify)
Drought
Pests / Termite
Frost/ Cold wave
Others (specify)
Frost/ Cold
wave
Drought
Flood
Flood
Others (specify)
Drought
Pests / Termite
Frost/ Cold wave
124
Page 1 of 1
Wereda Disaster
Risk Profile
Data_Collected_Date
September 2010
Disaster Risk Management
and Food Security Sector (DRMFSS)
Tuesday, September 30, 2014
Region S.N.N.P
Zone SOUTH OMO
Wereda HAMER
Selected Indictor:
Hazards: Change in Crop Damages - Proportion of Damage for Major Crops
(percentage response by households)
Last Year
Five Years Ago
0%
1-25%
26-50%
51-75%
76-100%
Barley
100.00
0.00
0.00
0.00
0.00
0.00
100.00
0.00
0.00
0.00
Beans
0.00
0.00
100.00
0.00
0.00
0.00
0.00
100.00
0.00
0.00
Lentils
100.00
0.00
0.00
0.00
0.00
0.00
0.00
100.00
0.00
0.00
Maize
27.90
1.04
9.00
19.80
59.58
25.10
3.00
22.70
0.20
31.30
Millet
25.00
0.00
50.00
0.00
25.00
0.00
50.00
0.00
0.00
50.00
Other pulses
0.00
0.00
0.00
100.00
0.00
0.00
0.00
100.00
0.00
0.00
Sesame
0.00
0.00
100.00
0.00
0.00
0.00
0.00
0.00
100.00
0.00
Sorghum
35.60
1.08
7.90
19.00
52.92
21.80
3.40
24.20
0.00
33.90
Sunflower
35.10
30.00
28.07
5.30
1.80
1.79
42.90
33.90
3.57
17.90
Teff
0.00
50.00
50.00
0.00
0.00
0.00
0.00
100.00
0.00
0.00
Wheat
0.00
0.00
100.00
0.00
0.00
0.00
0.00
0.00
66.70
33.30
125
Page 1 of 1
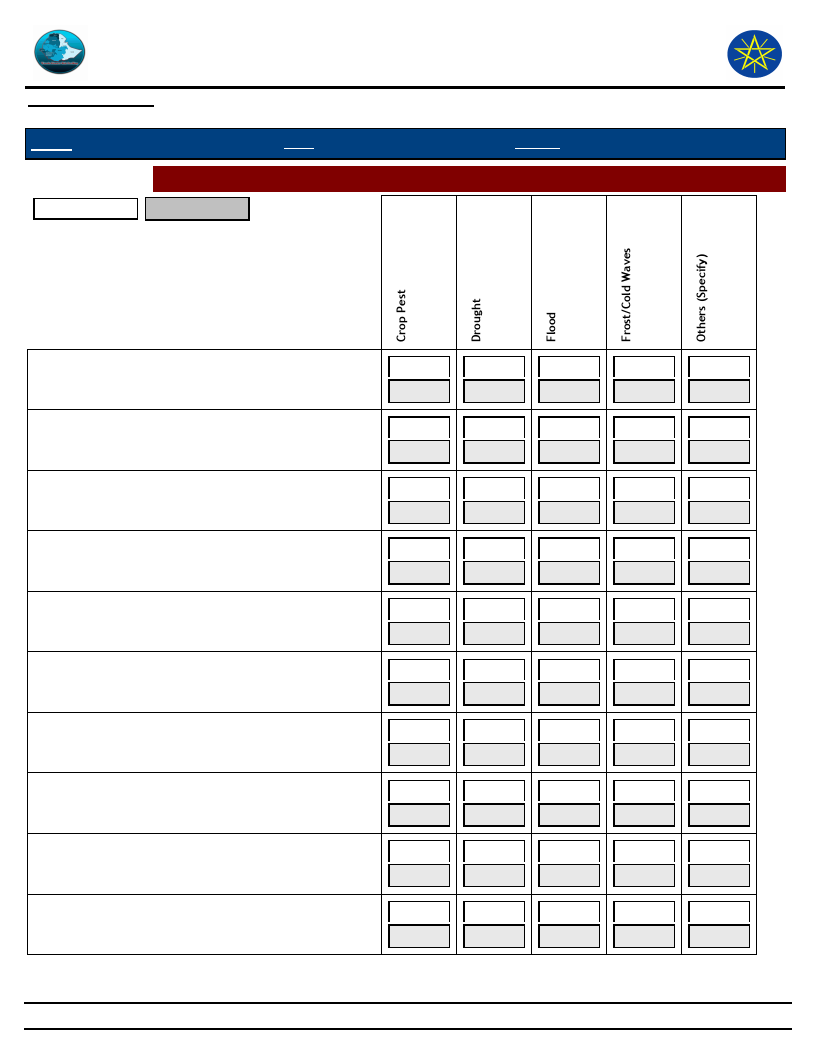
Wereda Disaster
Risk Profile
Data_Collected_Date
September 2010
Disaster Risk Management
and Food Security Sector (DRMFSS)
Tuesday, September 30, 2014
Region S.N.N.P
Zone SOUTH OMO
Wereda HAMER
Selected Indictor: Hazards: Change in Crop Damages - Reasons for Damage of Major Crops
Last Year
Five Years Ago
Barley
Beans
Lentils
Maize
Millet
Other cash crop
Other pulses
Sesame
Sorghum
Sunflower
100.00
0.00
0.00
0.00
100.00
0.00
59.58
25.10
25.00
50.00
0.00
0.00
0.00
0.00
0.00
100.00
3.40
24.20
28.07
33.90
0.00
0.00
0.00
0.00
0.00
100.00
0.20
31.30
25.00
0.00
25.00
0.00
100.00
0.00
0.00
0.00
0.00
0.00
1.80
17.90
0.00
0.00
100.00
100.00
0.00
0.00
0.00
0.00
0.00
50.00
0.00
0.00
0.00
0.00
0.00
0.00
35.60
1.08
0.00
0.00
0.00
0.00
0.00
0.00
0.00
0.00
27.90
1.04
50.00
0.00
75.00
100.00
0.00
0.00
0.00
0.00
7.90
19.00
35.10
1.79
0.00
0.00
0.00
0.00
0.00
0.00
9.00
19.80
0.00
0.00
0.00
0.00
0.00
0.00
100.00
0.00
52.92
21.80
30.00
42.90
126
Page 1 of 2
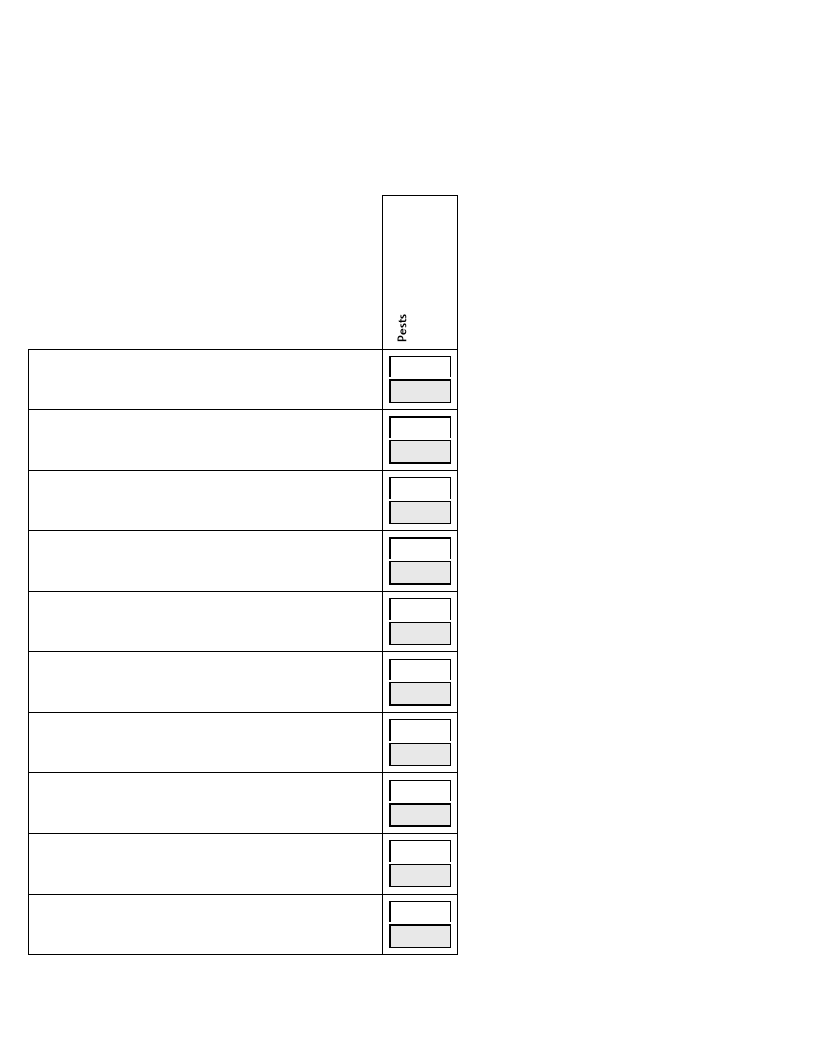
Barley
Beans
Lentils
Maize
Millet
Other cash crop
Other pulses
Sesame
Sorghum
Sunflower
0.00
100.00
0.00
0.00
0.00
0.00
3.00
22.70
0.00
0.00
0.00
0.00
0.00
100.00
0.00
0.00
0.00
33.90
5.30
3.57
127
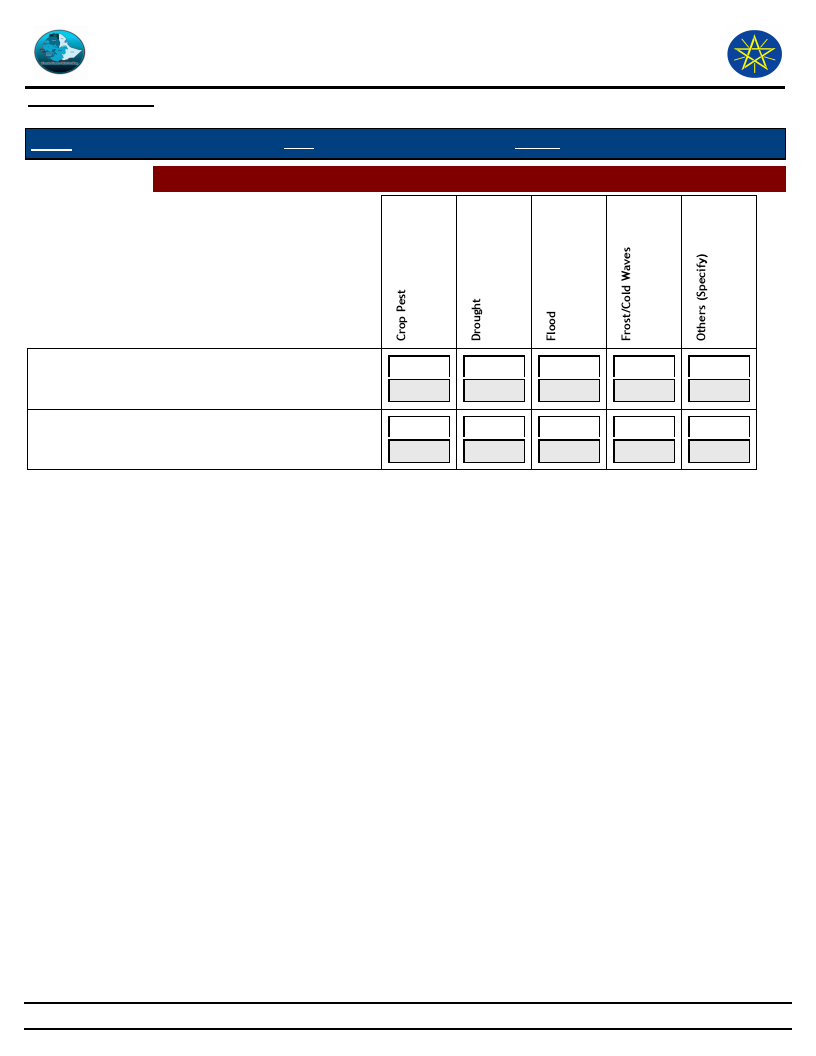
Wereda Disaster
Risk Profile
Data_Collected_Date
September 2010
Disaster Risk Management
and Food Security Sector (DRMFSS)
Tuesday, September 30, 2014
Region S.N.N.P
Zone SOUTH OMO
Wereda HAMER
Selected Indictor: Hazards: Change in Crop Damages - Reasons for Damage of Major Crops
Teff
Wheat
0.00
50.00
50.00
0.00
0.00
0.00
0.00
100.00
0.00
0.00
0.00
0.00
0.00
0.00
0.00
0.00
66.70
33.30
0.00
0.00
128
Page 2 of 2
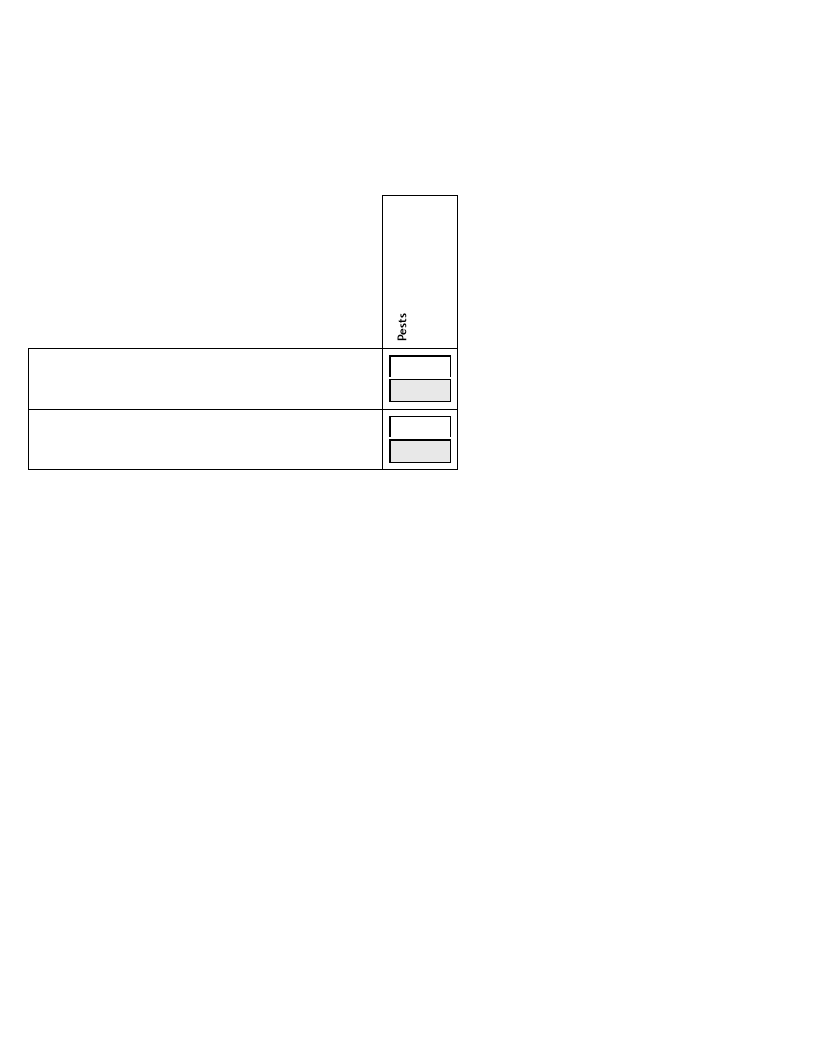
Teff
Wheat
0.00
0.00
100.00
0.00
129
Wereda Disaster
Risk Profile
Data_Collected_Date
September 2010
Disaster Risk Management and Food
Security Sector (DRMFSS)
Tuesday, September 30, 2014
Region
S.N.N.P
Zone
SOUTH OMO
Wereda
HAMER
Selected Indictor:
Agricultural Situation: Change in Crops Grown - Five major crops grown by proportion of total cultivated land
Kebele Name
HEDBAK
Major Crops
Sorghum
Maize
Main Season
Belg
Belg
Present
Cropped Area
Five_Years_Ago
40
50
50
35
Reason_For_Change
Maize farming is increasing due to increasing
pest attack for sorghum
Beans
Belg
6
5
Millet
Belg
4
5
DEGA KEJA
Sorghum
Belg
60
90
SHANKO
MRSHA
Sorghum
Sorghum
Belg
50
Belg
85
65
Maize cultivation is increasing due to
availability of seeds (improved seeds)
90
No reason given from respondents
MINOGELTI
ERBORE
LALA
Sorghum
Sorghum
Sorghum
Sorghum
Sorghum
C - Nov
95
(Hidar)
C - Nov
96
(Hidar)
H - Apr
60
(Meazea)
G - Mar
65
(Megabit)
B - Oct
55
(Tikimt)
100
However there is the practice of farming no
harvest for 15 consecutive years
100
No yield at all
70
Farm land is increasing even though there is no
increment of crop yield
30
Maize cultivation is reducing
50
We left some crops farming due to lack of rain
fall
130
Page 1 of 3
Wereda Disaster
Risk Profile
Data_Collected_Date
September 2010
Disaster Risk Management and Food
Security Sector (DRMFSS)
Tuesday, September 30, 2014
Region
S.N.N.P
Zone
SOUTH OMO
Wereda
HAMER
Selected Indictor:
Agricultural Situation: Change in Crops Grown - Five major crops grown by proportion of total cultivated land
Kebele Name
ERIYA
MRSHA
GEDBAK
ASELE
DEGA KEJA
SHESHA GOYKE
Major Crops
Sorghum
Sorghum
Sorghum
Sorghum
Maize
Sorghum
Main Season
B - Oct
(Tikimt)
C - Nov
(Hidar)
B - Oct
(Tikimt)
C - Nov
(Hidar)
Belg
Belg
Present
Cropped Area
Five_Years_Ago
60
70
75
60
40
60
85
65
38
8
96
100
Reason_For_Change
Sowing of maize is increasing due to
availability improved seed input
Maize cultivation is increasing due to increased
pest attacks of sorghum
However all the community households’
practice crop farming is very rare
Maize farming is increasing owing to resistance
for currently available crop pests
No yield at all
Maize
Belg
4
0
No yield at all
QUARO
Sorghum
Maize
Meher
60
Meher
35
70
Farm land is increasing even though there is no
increment of crop yield
28
Beans
Meher
5
2
GEDBAK
Sorghum
Maize
Belg
40
Belg
55
60
Maize cultivation is increasing due to increased
pest attacks of sorghum
35
131
Page 2 of 3
Wereda Disaster
Risk Profile
Data_Collected_Date
September 2010
Disaster Risk Management and Food
Security Sector (DRMFSS)
Tuesday, September 30, 2014
Region
S.N.N.P
Zone
SOUTH OMO
Wereda
HAMER
Selected Indictor:
Agricultural Situation: Change in Crops Grown - Five major crops grown by proportion of total cultivated land
Kebele Name
GEDBAK
Major Crops
Haricot Bean
Main Season
Belg
Present
Cropped Area
Five_Years_Ago
5
5
Reason_For_Change
132
Page 3 of 3
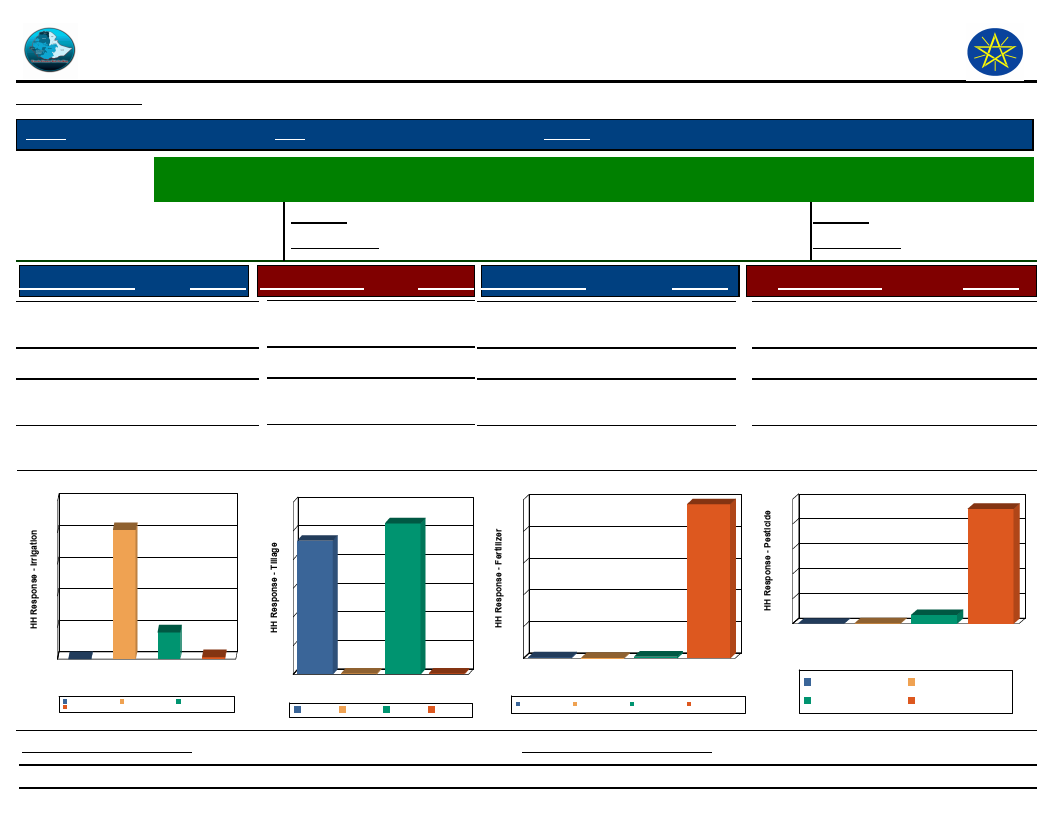
Wereda Disaster
Risk Profile
Data_Collected_Date
September 2010
Disaster Risk Management
and Food Security Sector (DRMFSS)
Tuesday, September 30, 2014
Region S.N.N.P
Zone SOUTH OMO
Wereda HAMER
Selected Indictor:
Economic Vulnerability: Status of Agriculture - Methods of tillage, Irrigation and other agricultural input utilization
by households
Percentage of
Last Year
0.77
Irrigated Area
Five Years Ago
0.81
Percentage of households
with irrigated area
Last Year
Five Years Ago
9.56
10.21
Source of Irrigation
River/Lake/Pond
Response Method of Tillage
1.32 Oxen
Response Type of Fertilizer
52.70 Chemical
Response
0.33
Birkas (tanks)
Other (specify)
0.00
17.00
No Irrigation
(Rain-fed)
Source of Irrigation
100
82
80
81.70
60
40
20
17
0
0
Birkas (tanks)
1
Other (specify)
No Irrigation (Rain-fed)
River/Lake/Pond
Source of Irrigation
Birkas (tanks)
River/Lake/Pond
No Irrigation (Rain-fed)
Other (specify)
Tractor
Manual
None
0.33
46.60
0.33
Natural/Animal manure
Both Chemical and
Natural
None
1.16
0.66
97.20
Method of Tillage
60
53
50
47
40
30
20
10
0
Manual
Manual
0
None
Oxen
Method of Tillage
None
Oxen
0
Tractor
Tractor
Type of Fertilizer
100
97
80
60
40
20
1
0
Both
Chemical and
Natural
0
1
Chemical Natural/Animal
manure
Type of Fertilizer
None
Both Chemical and
Natural
Chemical
Natural/Animal manure None
Type of Pesticide
Chemicals (insecticides,
fungicide, etc)
Natural methods
None
Response
0.32
7.02
92.20
0.00
Type of Pesticide
100
92
80
60
40
20
0
0
7
0
Chemicals
(insecticides,
fungicide, etc)
Natural
methods
Type of Pesticide
None
Natural methods
Chemicals (insecticides,
fungicide, etc)
None
Proportion_Improved_Seeds
53.90
Proportion_Agriculture_Service
133
86.80
Page 1 of 1
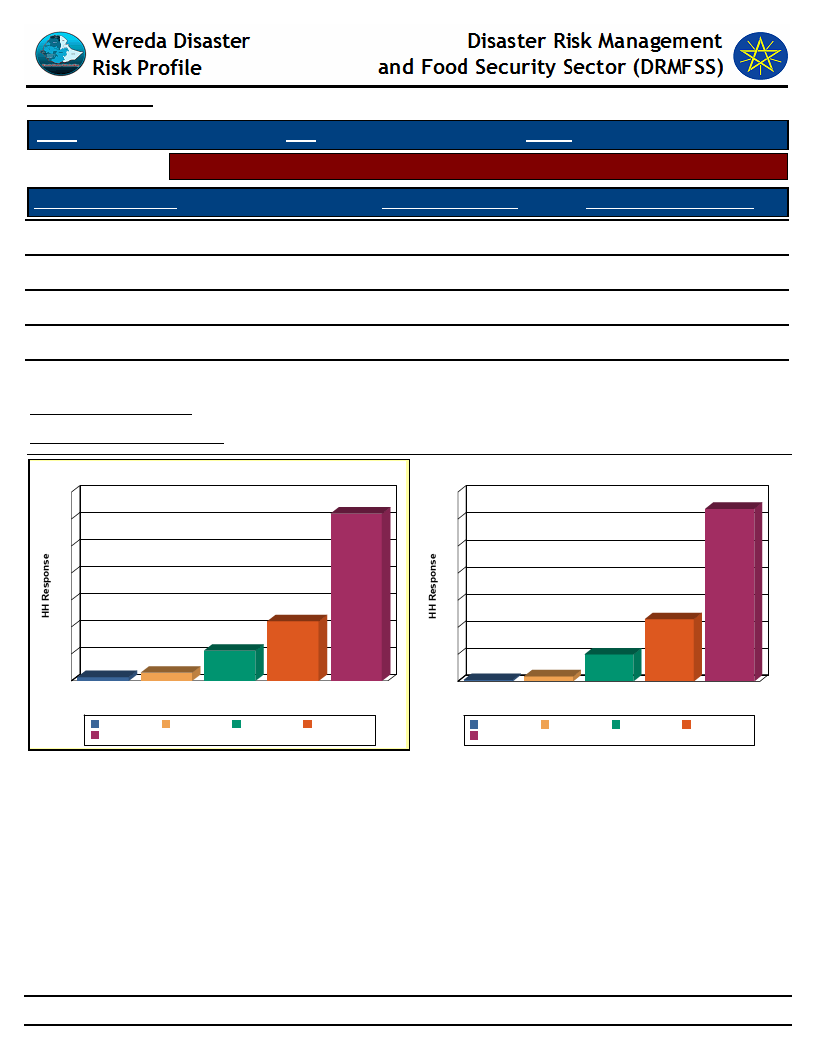
Data_Collected_Date
September 2010
Tuesday, September 30, 2014
Region S.N.N.P
Zone SOUTH OMO
Wereda HAMER
Selected Indicator
Economic Vulnerability: Crops Grown - Number of crops grown by households
Number of Crops Grown
One type
Crops Grown Last Year
11.20
Crops Grown Five Years Ago
9.91
Two types
62.00
63.80
Three types
22.10
23.00
Four types
3.01
1.85
Five types
1.41
0.49
Avg Crops Grown Last Year
Avg Crops Grown Five Years Ago
2.21
2.16
Number of Crops Grown Last Year
70
62
60
50
40
30
20
10
1
0
Five types
22
11
3
Four types One type Three types
Number of Crops Grown
Two types
Five types
Two types
Four types
One type
Three types
Number of Crops Grown five years ago
70
64
60
50
40
30
23
20
10
0
0
Five types
10
2
Four types One type Three types Two types
Number of Crops Grown
Five types
Two types
Four types
One type
Three types
134
Page 1 of 1
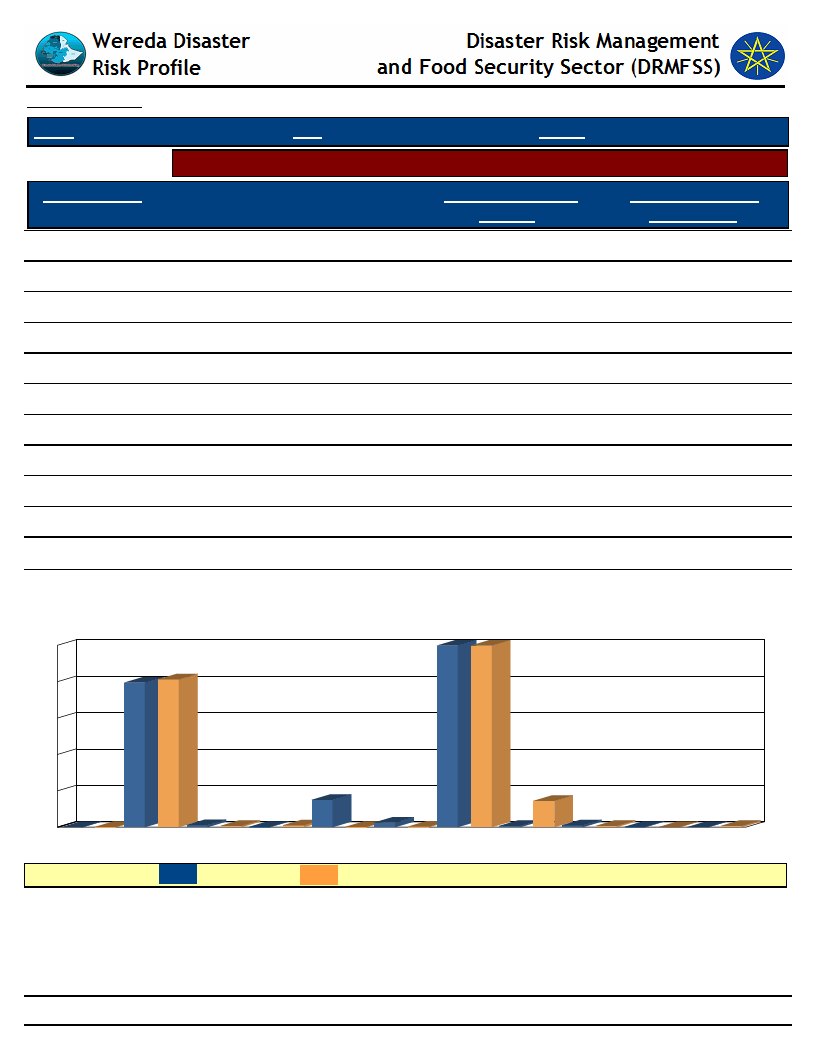
Data_Collected_Date
Region S.N.N.P
Selected Indicator
Major Crop Type
Teff
Barley
Wheat
Maize
Sorghum
Millet
Other pulses
Sunflower
Sesame
Vegetables
Other cash crop
September 2010
Zone SOUTH OMO
Tuesday, September 30, 2014
Wereda HAMER
Economic Vulnerability: Crops Grown - Types of crops grown by households
Type of Crops Grown
Last Year
0.51
Type of Crops Grown
Five Years Ago
0.35
0.00
0.09
0.00
0.35
39.70
40.60
49.90
49.90
0.59
0.35
7.49
0.09
0.34
7.22
1.26
0.17
0.08
0.00
0.08
0.52
Types of Crops Grown - Percent Responses of HHs for Last Year as compared to
Five Years Ago
50 50
50
40
41
40
30
20
10
0
0
0
Barley
LEGEND :
Maize
1
0
Millet
7
0
1
0
Other cash Other pulses
crop
1
0
Sesame
Sorghum
Last year
Five Years Ago
7
0
Sunflower
1
0
Teff
0
0
Vegetables
0
0
Wheat
135
Page 1 of 1
Wereda Disaster
Risk Profile
Disaster Risk Management
and Food Security Sector (DRMFSS)
Data_Collected_Date
Region S.N.N.P
September 2010
Zone
SOUTH OMO
Tuesday, September 30, 2014
Wereda HAMER
Selected Indictor:
Economic Vulnerability: Crops Grown - Proportion of households by amount of
yield of major crops (last year)
Maize
Millet
Other cash crop
Other pulses
Sesame
Sorghum
Sunflower
Teff
49.50
47.70
2.86
85.70
14.30
100.00
100.00
100.00
43.80
46.80
8.29
1.08
100.00
66.70
16.70
16.70
136
Page 1 of 1
Wereda Disaster
Risk Profile
Data_Collected_Date
September 2010
Region S.N.N.P
Zone
Disaster Risk Management
and Food Security Sector (DRMFSS)
SOUTH OMO
Tuesday, September 30, 2014
Wereda HAMER
Selected Indictor:
Economic Vulnerability: Crops Grown - Proportion of households by amount of
yield of major crops (Five Years Ago)
Types of Major Crops
Category of Yield used to be obtained five years ago
Maize
Millet
Other cash crop
Other pulses
Sesame
Sorghum
Sunflower
Teff
100.00
36.80
58.90
4.31
100.00
26.40
59.50
12.60
1.16
0.19
0.19
100.00
66.70
33.30
66.70
33.30
100.00
137
Page 1 of 1
Data_Collected_Date
September 2010
Tuesday, September 30, 2014
Region S.N.N.P
Zone SOUTH OMO
Wereda HAMER
Selected Indictor: Economic Vulnerability: Land Ownership and Quality - Landownership of households
Households owning land (%)
Average landholding (in Hectares)s
Households cultivating land in last 12 months (%)
Average quantity of land cultivated (in hectares)
97.10
3.74
97.10
0.77
Range Land Holding
Percent_Response
A - Less than 0.25 ha
33.0
B - 0.25 - 0.50 ha
43.0
C - 0.5 - 0.75 ha
9.0
D - 0.75 - 1 ha
8.0
E - 1 - 2 ha
2.0
F - More than 2 ha
6.0
IMPORTANT: ha = Hectar
Household Responses to Range Land Holding
32.7
6.0
2.1
7.8
8.5
Range Cultivated Land
A - Less than 0.25 ha
B - 0.25 - 0.50 ha
C - 0.5 - 0.75 ha
D - 0.75 - 1 ha
E - 1 - 2 ha
F - More than 2 ha
Percent_Respons
37.0
41.0
7.0
8.0
2.0
5.0
Household Responses to Range Cultivated Land
36.7
5.4
1.6
8.5
6.8
42.8
A - Less than 0.25 ha
B - 0.25 - 0.50 ha
C - 0.5 - 0.75 ha
D - 0.75 - 1 ha
E - 1 - 2 ha
F - More than 2 ha
32.7%
42.8%
8.5%
7.8%
2.1%
6.0%
Total:
100.0%
41.1
A - Less than 0.25 ha 36.7
B - 0.25 - 0.50 ha
41.1
C - 0.5 - 0.75 ha
6.8
D - 0.75 - 1 ha
8.5
E - 1 - 2 ha
1.6
F - More than 2 ha
5.4
Total:
100.0
138
Page 1 of 1
Data_Collected_Date
September 2010
Tuesday, September 30, 2014
Region S.N.N.P
Zone SOUTH OMO
Wereda HAMER
Selected Indictor:
Economic Vulnerability: Land Ownership and Quality - Farmers’ perception on the
quality of their agricultural land
Cropping_Intensity *
Households with enough land for farming
HHs with favourable location of farm
Response
Households with fertile soil
Yes
22.50
Highly fertile
49.80
Response
4.43
Partially
55.20
Fertile
54.80
No
22.30
Not fertile
40.70
* Cropping Intensity = (Gross Cropped Area / total land owned Area )x 100%
Household responses to the type of farm
location
Household responses tp the type of soil
fertility
22
23
41
55
No
Partially Yes
4
Fertile
55
Highly fertile Not fertile
139
Page 1 of 1
Wereda Disaster
Risk Profile
Data_Collected_Date
September 2010
Region S.N.N.P
Zone SOUTH OMO
Disaster Risk Management and Food
Security Sector (DRMFSS)
Tuesday, September 30, 2014
Wereda HAMER
Selected Indicator
Kebele Name
Environmental Situation: Land-Use other than crop production - Types of land use other than crop production
across Kebeles
Landuse_1
Comments_1
Landuse_2
Comments_2
Landuse_3
Comments_3
SHANKO
DEGA KEJA
Grazing land
Grazing and browsing
Honey
production(forest)
SHANKO 2
BESSA MEJAN
MINOGELTI
SHESHA GOYKE
QUARO
KOLA KEJA
ERBORE
Farm land and
cultivable land
Grazing land
Grazing land
20%
Honey production
Most part of the PA is
grazing (browsing
land)
1
Honey production
Honey production
15%
There is high
production of
honey
2
Grazing land(browse)
Cultivable land
Grazing land inclusive
of bush and shrubs
Cultivable fertile land
The most important
for shoats
Honey production
Highest importance if
the system changed
to irrigation
Grazing land
85% grazing and bush
and shrub lands
There is vast
cultivable land if
irrigation schemes
established
Crop land
Grazing land
There is wide
grazing land
however it is
devoid of grass
15%
Bushes and shrubs
45%
(for browsing)
Forest
harvest(incense
and gum)
Forest harvest
(incense and gum)
3
There is high
source of gum and
incense
140
Page 1 of 2

Wereda Disaster
Risk Profile
Data_Collected_Date
September 2010
Region S.N.N.P
Zone SOUTH OMO
Disaster Risk Management and Food
Security Sector (DRMFSS)
Tuesday, September 30, 2014
Wereda HAMER
Selected Indicator
Kebele Name
Environmental Situation: Land-Use other than crop production - Types of land use other than crop production
across Kebeles
Landuse_1
Comments_1
Landuse_2
Comments_2
Landuse_3
Comments_3
LALA
ERIYA
"The land is degraded
and lost its
Grazing land
Farm land
MRSHA
GEDBAK
ASELE
Grazing land including
browsing shrubs and
bushes
"There is no suitable
land for grazing almost
all areas
The majority of the
land in the PA boundary
is grazing, however it
has been degraded due
to over grazing
There is vast area of
vacant range land
which is suitable for
livestock production
however it is devoid
of pasture
70% of the land is
being used for grazing
and unsuitable for
crop farming 20%
cleared for crop
farming, but no yield
10 waste land
Honey flora
"There are various
141
Page 2 of 2
WDRP Indicators
Livestock Production Characteristics
142

Wereda Disaster
Risk Profile
Disaster Risk Management
and Food Security Sector (DRMFSS)
Data_Collected_Date
September 2010
Tuesday, September 30, 2014
Region S.N.N.P
Zone SOUTH OMO
Wereda HAMER
Selected Indictor:
Kebele Name
Agricultural Situation: Status of Livestock Disease - Change in Livestock Disease
Status
Current_Level
Change_Over_Last_Decade
Comment
GEDBAK
SHANKO
DEGA KEJA
SHANKO
MRSHA
MINOGELTI
"There is several
livestock disease and
this distribution is wider
when compared
Decreasing during the
last 10 years
Livestock disease like
tryponosomiasis,
anthrax, black leg,
cCBPP, and pasturelosis
prevalence is decreasing
whereas ticks
infestation,
mangemites, CCPP and
tick borne diseases are
increasing
The distribution of many
disease is decreasing as
anthrax, black leg,
pasteusellosis, CCPP,
but the distribution of
some increasing as ticks,
CCPP, mangemites and
new diseases are also
happening
Some disease that were
common in the area are
decreasing as
tryponosomiasis but new
diseases are introducing
The number of livestock
diseases increasing even
there is better health
access
Decreased because of supply of
drugs and vaccination by
government
The prevalence of
tryponosomiasis , CBPP and
black leg is decreasing whereas
new disease are introducing as
the recently introduced
devastating sheep disease
New fatal diseases are
introduced and killed many
sheep and goats
Tocontrol the quality of
drugs
143
Page 1 of 3

Wereda Disaster
Risk Profile
Disaster Risk Management
and Food Security Sector (DRMFSS)
Data_Collected_Date
September 2010
Tuesday, September 30, 2014
Region S.N.N.P
Zone SOUTH OMO
Wereda HAMER
Selected Indictor:
Kebele Name
MINOGELTI
ERBORE
KOLA KEJA
ERBORE
LALA
ERIYA
Agricultural Situation: Status of Livestock Disease - Change in Livestock Disease
Status
Current_Level
Change_Over_Last_Decade
Comment
The distribution of
disease is increasing
particularly external
parasites(ticks and
menges)
Common disease in the
area is decreasing
where as new disease
introducing
The type of livestock
diseases increasing
especially for shoats
Some disease
distribution is
decreasing as anthrax,
CBPP, black leg and
pastorolosis where as
some are increasing as
CCPP, ticks,
mangemites,
tryponosomiasis and
some unsepcific diseases
of sheep
The distribution of some
diseases is decreasing as
anthrax, CBPP, black
leg, but ticks, CCPP,
mangemites increasing
Some diseases are
reducing but the
distribution of some
increasing such as tick
and mangeites
New diseases are introduced eg
sheep disease, the distribution
of ticks also increasing owing to
less efficiency of drugs
Several diseases are decreasing
(the distribution ) but new fatal
diseases are introducing
eg-sheep disease outbreak in
2000
The incidence of some diseases
decreased, but some new
diseases introduced
There is great change on
distribution of anthrax ,black
leg, CBPP ie Decreasing but
CCPP, ticks and mangemites
distribution increasing
Anthrax, black leg,
pastorolosis, and CBPP are
reducing but tick infestation
increasing
Animal health services
should be established in
the PA
144
Page 2 of 3
Wereda Disaster
Risk Profile
Disaster Risk Management
and Food Security Sector (DRMFSS)
Data_Collected_Date
September 2010
Tuesday, September 30, 2014
Region S.N.N.P
Zone SOUTH OMO
Wereda HAMER
Selected Indictor:
Kebele Name
MRSHA
GEDBAK
ASELE
Agricultural Situation: Status of Livestock Disease - Change in Livestock Disease
Status
Current_Level
Change_Over_Last_Decade
Comment
There is reduction of
common diseases in the
area such as
Tryponosomiasis,
mangeites
Livestock disease
distribution is increasing
due to lack of frequent
animal health services
and lack of annual
vaccination programmes
there is no change on
distribution
Prevalence of new
animal disease is
increasing from time to
time due to increasing
movement for grazing
and lack of regular
animal health services
Although common livestock
disease is decreasing but new
diseases are being introduced
145
Page 3 of 3
Wereda Disaster
Risk Profile
Data_Collected_Date
September 2010
Disaster Risk Management
and Food Security Sector (DRMFSS)
Tuesday, September 30, 2014
Region S.N.N.P
Zone SOUTH OMO
Wereda HAMER
Selected Indictor: Livestock Diseases Prevalece
Type of livestock diseases affected households in the last five years (households reporting in %)
African horse disease
1st
2nd
3rd
0.17
0.17
Anthrax
0.66
3.70
Black leg
0.84
0.18
CBPP
3.03
16.10
Contagious Caprine Pleuropneumonia (CCPP)
22.60
47.40
4.53
Faculiasis
5.98
17.30
10.30
Internal and External Parasite
1.00
19.00
51.40
Liverfluke
0.66
6.22
7.97
Lumpy Skin Disease (LSD)
1.18
Newcastle disease (Chicken)
0.17
0.34
1.81
None
0.17
4.53
PPR
0.17
Sheep pox
0.17
Tick born diseases
0.17
1.09
Tick borne diseases
0.17
Trypanosomiasis
68.60
0.17
0.18
146
Page 1 of 1
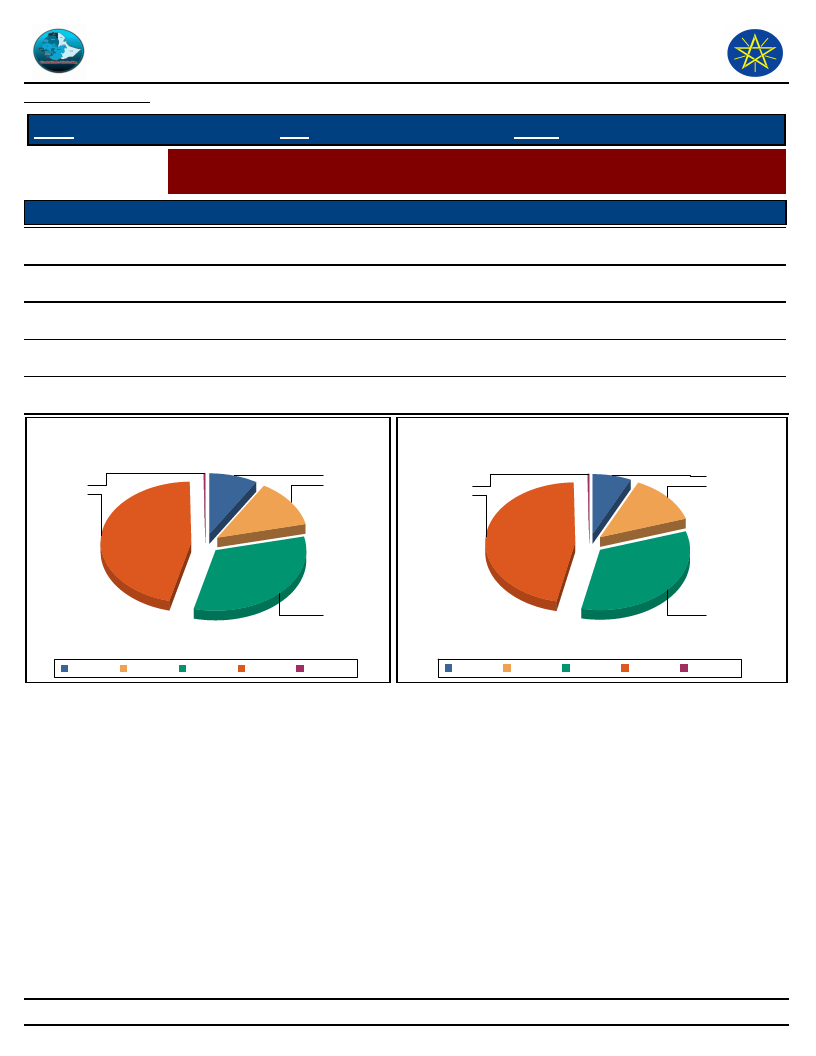
Wereda
Disaster Risk
Data_Collected_Date
September 2010
Disaster Risk Management
and Food Security Sector
Tuesday, September 30, 2014
Region S.N.N.P
Selected Indictor:
Level of Access
Excellent
Zone SOUTH OMO
Wereda HAMER
Evaluation of Access to Veternary Services and Livestock Drugs
Households’ evaluation on access to drugs and veterinary services
Veternary Service
0.33
Livestock_Drugs
0.17
Good
12.80
13.00
Adequate
8.65
6.99
Poor
32.40
33.30
Very poor
45.80
46.60
Level of Access to Veternary Services
9
0
13
46
Access Level of Livestock Drugs
7
0
13
47
32
Adequate
Good
Poor
Very poor Excellent
33
Adequate
Good
Poor
Very poor Excellent
147
Page 1 of 1

Data_Collected_Date
September 2010
Tuesday, September 30, 2014
Region S.N.N.P
Zone SOUTH OMO
Wereda HAMER
Selected Indictor:
KebeleName
GEDBAK
Agricultural Situation: Livestock Diversity - Type of livestock and their economic
importance in the community
Type of Livestock
Cattle: Mature Female
Avg_Num_Per_HH
2.00
Economic_Importance_Rank
1
Goats
6.00
2
Sheep
2.00
3
Donkeys
4
Bee keeping
5
SHANKO
Cattle: Female
4.00
Goats
9.00
Sheep
1.00
Bee keeping
2.00
Poultry
DEGA KEJA
Cattle: Female
5.00
2
Goats
25.00
1
Sheep
4.00
4
Bee keeping
2.00
3
Donkeys
5
Cattle: Mature Female
Goats
5.00
Sheep
2.00
SHANKO
Cattle: Mature Female
4.00
2
Goats
20.00
1
Sheep
3.00
4
Bee keeping
2.00
3
Donkeys
5
148
Page 1 of 4

Data_Collected_Date
September 2010
Tuesday, September 30, 2014
Region S.N.N.P
Zone SOUTH OMO
Wereda HAMER
Selected Indictor:
KebeleName
MRSHA
Agricultural Situation: Livestock Diversity - Type of livestock and their economic
importance in the community
Type of Livestock
Cattle: Mature Female
Avg_Num_Per_HH
12.00
Economic_Importance_Rank
2
Goats
25.00
1
Sheep
18.00
4
Bee keeping
8.00
3
Donkeys
3.00
5
MINOGELTI
Cattle: Mature Female
12.00
4
Goats
75.00
1
Sheep
15.00
3
Bee keeping
6.00
2
Donkeys
5
Cattle: Mature Female
10.00
4
Goats
60.00
1
Sheep
10.00
3
Bee keeping
3.00
2
Donkeys
1.00
5
ERBORE
Cattle: Mature Female
10.00
2
Goats
30.00
1
Sheep
4.00
3
Donkeys
KOLA KEJA
Cattle: Mature Female
2
Goats
1
Sheep
4
Donkeys
5
149
Page 2 of 4

Data_Collected_Date
September 2010
Tuesday, September 30, 2014
Region S.N.N.P
Zone SOUTH OMO
Wereda HAMER
Selected Indictor:
KebeleName
KOLA KEJA
Agricultural Situation: Livestock Diversity - Type of livestock and their economic
importance in the community
Type of Livestock
Bee keeping
Avg_Num_Per_HH
Economic_Importance_Rank
3
ERBORE
Cattle: Mature Female
6.00
2
Goats
30.00
1
Sheep
6.00
3
Donkeys
4
LALA
Cattle: Mature Female
6.00
2
Goats
45.00
1
Sheep
3.00
4
Bee keeping
4.00
3
Donkeys
1.00
5
ERIYA
Cattle: Mature Female
8.00
2
Goats
40.00
1
Sheep
6.00
4
Bee keeping
4.00
3
MRSHA
Cattle: Mature Female
10.00
2
Goats
30.00
1
Sheep
5.00
4
Donkeys
5
Bee keeping
7.00
3
GEDBAK
Cattle: Female
3.00
1
Goats
12.00
2
Sheep
4.00
3
Bee keeping
5
150
Page 3 of 4
Data_Collected_Date
September 2010
Tuesday, September 30, 2014
Region S.N.N.P
Zone SOUTH OMO
Wereda HAMER
Selected Indictor:
KebeleName
GEDBAK
Agricultural Situation: Livestock Diversity - Type of livestock and their economic
importance in the community
Type of Livestock
Donkeys
Avg_Num_Per_HH
Economic_Importance_Rank
4
151
Page 4 of 4
Wereda Disaster
Risk Profile
Data_Collected_Date
September 2010
Disaster Risk Management
and Food Security Sector (DRMFSS)
Tuesday, September 30, 2014
Region S.N.N.P
Zone SOUTH OMO
Wereda HAMER
Selected Indictor:
Economic Vulnerability: Livestock Ownership and Changes - Percentage of households by number and type of
livestock owned
A - 1 to 5
C - 11 to 50
D - 51 to 100
None
Bee keeping
10.30
76.70
6.90
Camels: Female
1.30
3.80
1.30
92.30
Camels: Male
2.60
94.80
Camels: Young Female
2.60
1.30
94.80
Camels: Young Male
3.90
94.80
Cattle: Female
0.80
52.50
45.80
0.30
Cattle: Male bulls
0.70
54.40
43.80
0.50
Cattle: Mature Female
23.70
38.30
13.70
0.50
Cattle: Mature Male
48.70
20.30
1.70
2.90
Cattle: under 1 year
1.00
43.90
55.10
Donkeys
10.80
5.40
73.00
8.10
Goats
1.30
9.70
72.50
14.40
152
Page 1 of 2
Wereda Disaster
Risk Profile
Data_Collected_Date
September 2010
Disaster Risk Management
and Food Security Sector (DRMFSS)
Tuesday, September 30, 2014
Region S.N.N.P
Zone SOUTH OMO
Wereda HAMER
Selected Indictor:
Economic Vulnerability: Livestock Ownership and Changes - Percentage of households by number and type of
livestock owned
A - 1 to 5
C - 11 to 50
D - 51 to 100
None
Horses
100.00
Mules
100.00
Poultry
16.30
6.10
71.40
2.00
Sheep
0.90
7.40
88.20
2.20
153
Page 2 of 2

Wereda Disaster
Risk Profile
Data_Collected_Date
September 2010
Disaster Risk Management
and Food Security Sector (DRMFSS)
Tuesday, September 30, 2014
Region S.N.N.P
Zone SOUTH OMO
Wereda HAMER
Selected Indicator
Economic Vulnerability: Livestock Ownership and Changes - Households
perception on changes in livestock number in the last five years (response in %)
Type of Livestock Owned
Changes Observed By Households
Camels: Female
Decreased
80.00
Increased
Remained the Same
20.00
Camels: Male
100.00
Camels: Young Female
100.00
Camels: Young Male
100.00
Cattle: Female
51.10
12.30
21.20
Cattle: Male bulls
46.80
26.70
26.50
Cattle: Mature Female
81.40
12.20
6.40
Cattle: Mature Male
80.00
12.30
7.70
Cattle: under 1 year
6.40
85.60
7.90
Donkeys
3.90
96.10
Goats
23.90
47.70
27.90
Poultry
13.20
59.50
26.10
Sheep
28.90
53.50
17.60
154
Page 1 of 3
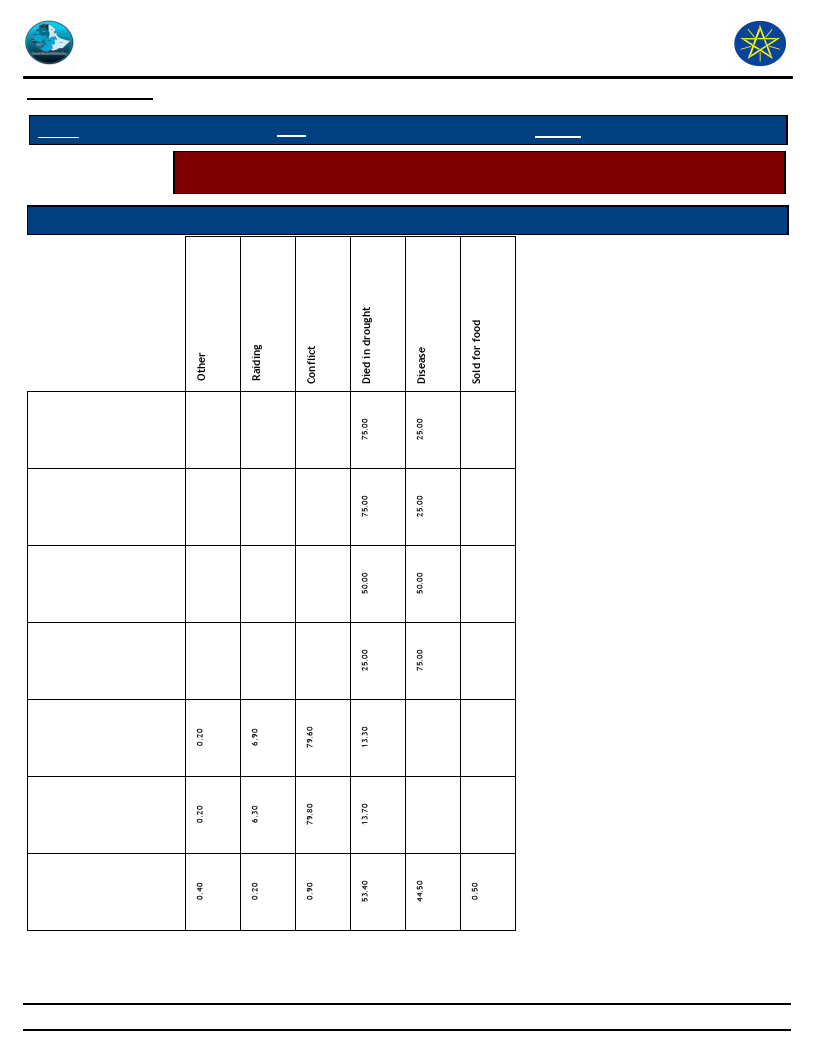
Wereda Disaster
Risk Profile
Data_Collected_Date
September 2010
Disaster Risk Management
and Food Security Sector (DRMFSS)
Tuesday, September 30, 2014
Region S.N.N.P
Zone SOUTH OMO
Wereda HAMER
Selected Indicator
Economic Vulnerability: Livestock Ownership and Changes - Households
perception on changes in livestock number in the last five years (response in %)
Type of Livestock Owned
Reason for Decrease in Livestock Number
Camels: Female
Camels: Male
Camels: Young
Female
Camels: Young
Male
Cattle: Female
Cattle: Male bulls
Cattle: Mature
Female
155
Page 2 of 3
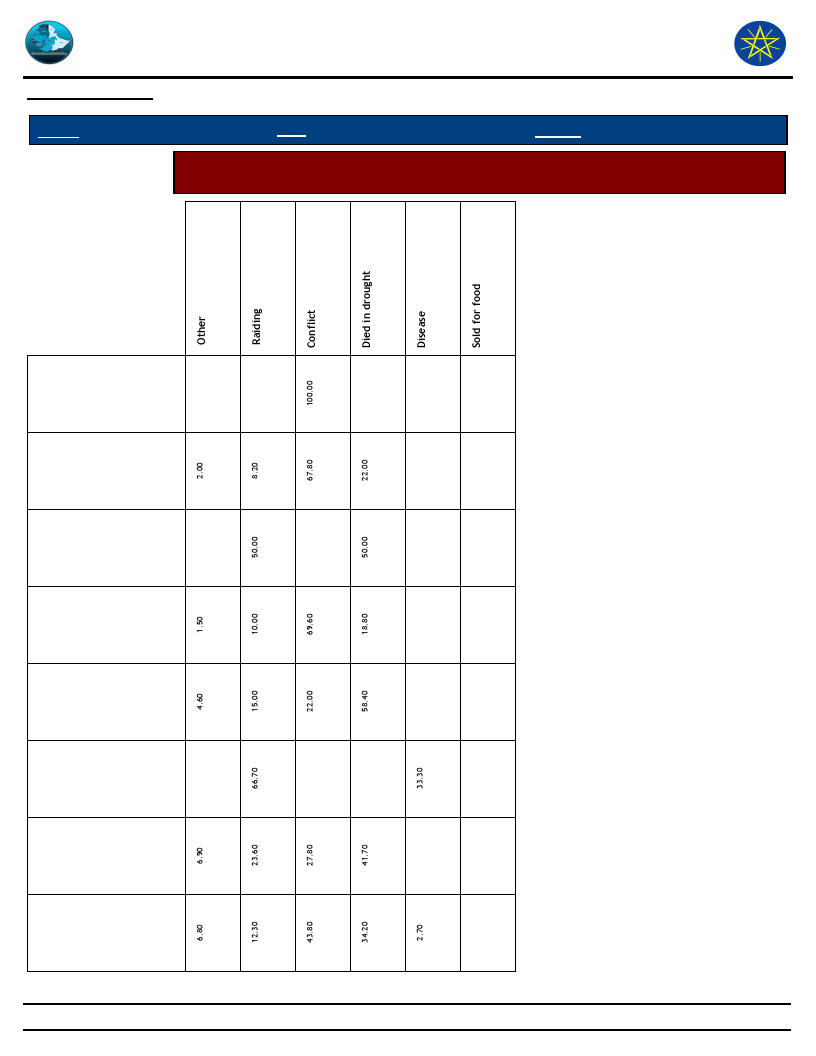
Wereda Disaster
Risk Profile
Data_Collected_Date
September 2010
Disaster Risk Management
and Food Security Sector (DRMFSS)
Tuesday, September 30, 2014
Region S.N.N.P
Zone SOUTH OMO
Wereda HAMER
Selected Indicator
Economic Vulnerability: Livestock Ownership and Changes - Households
perception on changes in livestock number in the last five years (response in %)
Cattle: Mature
Male
Cattle: under 1
year
Donkeys
Goats
Horses
Mules
Poultry
Sheep
156
Page 3 of 3
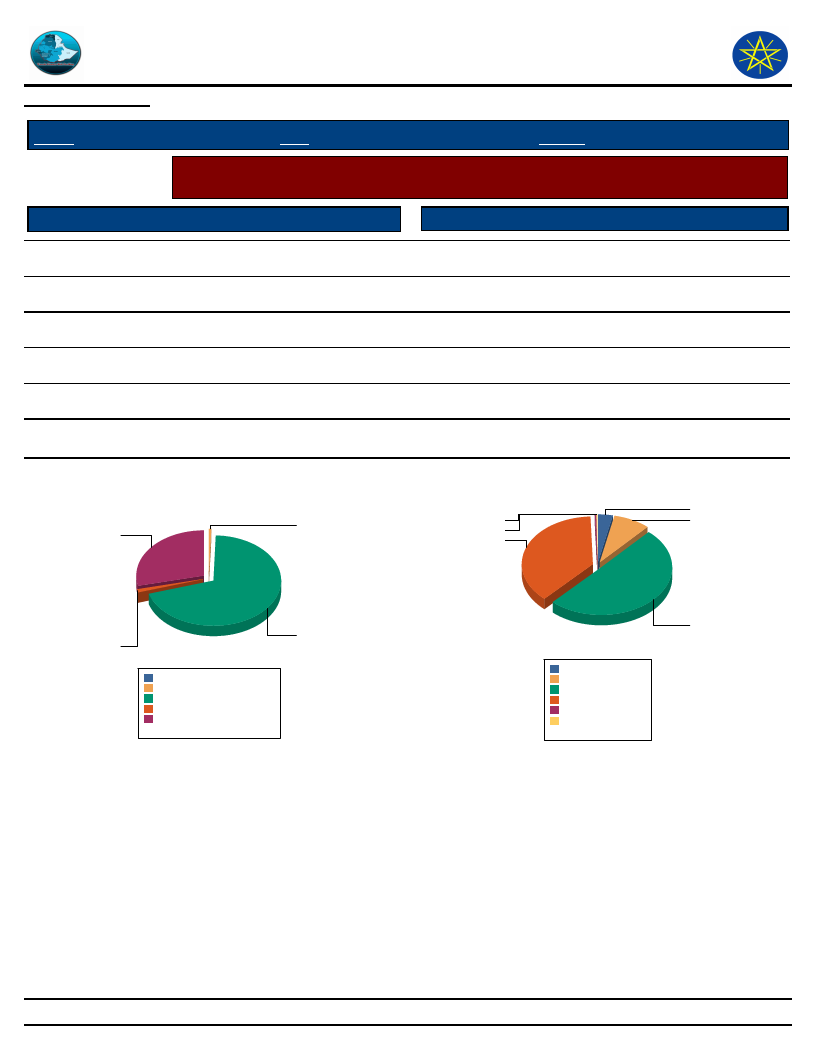
Wereda Disaster
Risk Profile
Data_Collected_Date
September 2010
Disaster Risk Management
and Food Security Sector (DRMFSS)
Tuesday, September 30, 2014
Region S.N.N.P
Selected Indicator
Access to Pasture
Zone SOUTH OMO
Wereda HAMER
Agriculture (Livestock): Pasture Availability - Households perception on access
and quality of pasture
Response Percent
Quality of Pasture
Response Percent
Regularly available
1.00
Excellent
0.34
Occasionally
69.70
Good
8.29
Seldom available
28.60
Adequate
3.38
Never available
0.67
Poor
50.30
0.00
Very poor
37.60
0.00
DK
0.17
Household responses to Access to Pasture for
Livestock
0.7
28.6
Household responses to Quality of Pasture
3.4
0.3
8.3
0.2
37.6
69.7
1
Never available
Occasionally
0.0%
0.7%
69.7%
Regularly available 1.0%
Seldom available 28.6%
Total:
100.0%
Adequate
Good
Poor
Very poor
DK
Excellent
3.4%
8.3%
50.3%
37.6%
0.2%
0.3%
Total:
100.0%
50.3
157
Page 1 of 1

Data_Collected_Date
September 2010
Tuesday, September 30, 2014
Region S.N.N.P
Zone SOUTH OMO
Wereda HAMER
Selected Indicator
Agriculture (Livestock): Pasture Availability - Households perception on
problematic months for pasture availability
Problematic Months
Order of Severity
A - Sep (Meskerem)
B - Oct (Tikimt)
C - Nov (Hidar)
D - Dec (Tahsas)
E - Jan (Tir)
F - Feb (Yekatit)
G - Mar (Megabit)
H - Apr (Meazea)
I - May (Ginbot)
J - Jun (Sene)
K - Jul (Hamle)
L - Aug (Nehase)
1st
93.00
4.50
0.70
2nd
4.52
93.10
2.01
3rd
2.01
1.85
72.70
0.67
0.17
0.17
0.20
0.20
1.80
0.34
22.50
158
Page 1 of 1
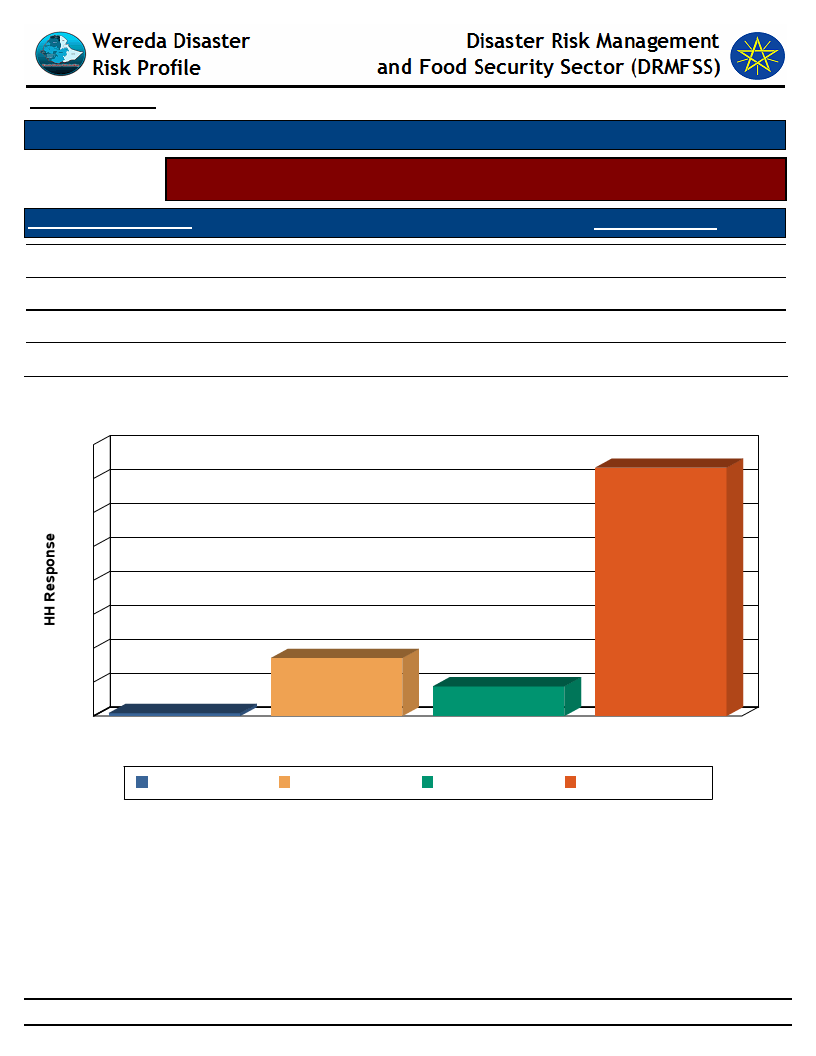
Data_Collected_Date
September 2010
Tuesday, September 30, 2014
Selected Indicator
Agriculture (Livestock): Water Availability - Households response on water
availability for livestock
Access to Water - Livestock
Household Response
Regularly available
Occasionally
Seldom available
Never available
8.77
17.10
73.20
0.88
Household Access to Water for Livestock
80
73
70
60
50
40
30
20
10
1
0
Never available
17
9
Occasionally
Regularly available
Access to Water - Livestock
Seldom available
Never available
Occasionally
Regularly available Seldom available
159
Page 1 of 1
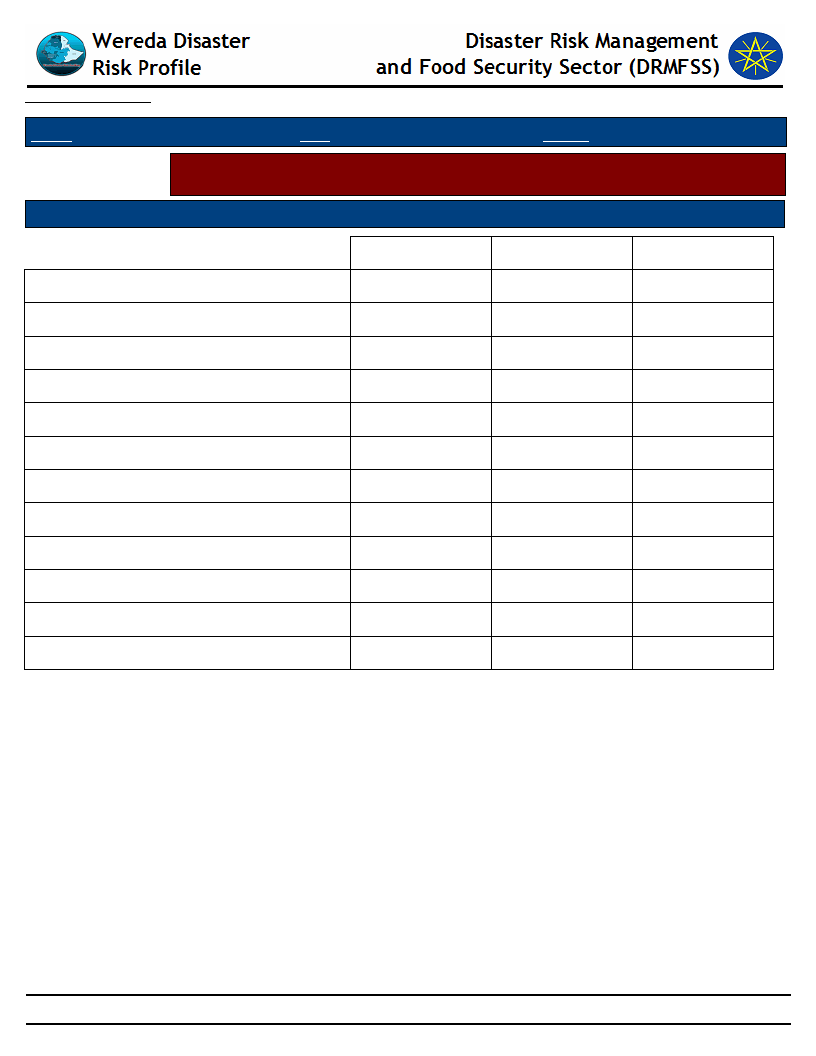
Data_Collected_Date
September 2010
Tuesday, September 30, 2014
Region S.N.N.P
Zone SOUTH OMO
Wereda HAMER
Selected Indicator
Agriculture (Livestock): Water Availability - Households perception on
problematic months for water availability for Livestock
Problematic Months
Order of Severity
A - Sep (Meskerem)
B - Oct (Tikimt)
C - Nov (Hidar)
D - Dec (Tahsas)
E - Jan (Tir)
F - Feb (Yekatit)
G - Mar (Megabit)
H - Apr (Meazea)
I - May (Ginbot)
J - Jun (Sene)
K - Jul (Hamle)
L - Aug (Nehase)
1st
93.00
3.85
0.52
0.35
2.27
2nd
4.90
93.50
1.22
0.17
0.17
3rd
1.05
2.45
66.30
0.52
0.17
0.17
29.40
160
Page 1 of 1
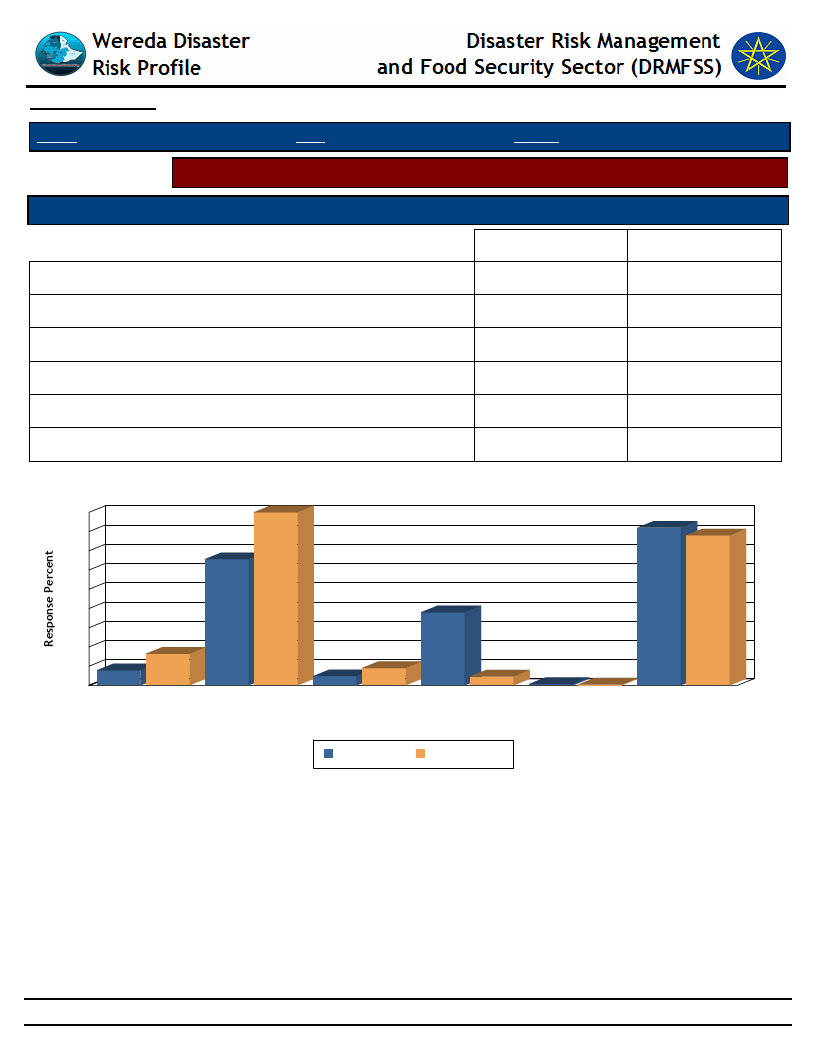
Data_Collected_Date
September 2010
Tuesday, September 30, 2014
Region S.N.N.P
Zone SOUTH OMO
Wereda HAMER
Selected Indicator
Sources of water for livestock (households response in %)
Type of Livestock Owned
Open well
Other
Piped water outside the house
Pond or lake (open access)
Rainwater harvesting
River, stream
Changes Observed By Households
Family reasons
3.91
32.80
2.38
19.00
0.34
41.00
Dry Season
8.20
45.00
4.50
2.30
0.20
39.00
Household Responses to Type of Water Source and Season for Livestock
45
45
40
41
39
35
33
30
25
20
19
15
10
8
5
4
0
Open well
Other
5
2
2
Piped water outside
the house
Pond or lake (open
access)
Type of Water Source & Season
0
0
Rainwater harvesting
River, stream
Family reasons
Dry Season
161
Page 1 of 1
WDRP Indicators
Access to Market and Credit
162
Wereda Disaster
Risk Profile
Disaster Risk Management
and Food Security Sector (DRMFSS)
Data_Collected_Date September 2010
Tuesday, September 30, 2014
Region S.N.N.P
Zone SOUTH OMO
Wereda HAMER
Selected Indictor:
KebeleName
SHANKO
Economic Vulnerability: Proportion of Produce Sold and Market - Proportion of crops and livestock sold from total
production and markets
Market_For_Crops
Market_For_Livestock_Produce
Percent
Livestock_Sold
Total_% Comments
Sold
40% Sell livestock sometimes
DEGA KEJA
SHANKO 2
BESSA MEJAN
MINOGELTI
SHESHA GOYKE
QUARO
ERBORE
MURALE
LALA
No sale of crop
produce
No sale of crop
produce
No sale of crop
produce
No sale of crop
produce
No sale of crop
produce
No sale of crop
produce
No sale of crop
produce
No sale of crop
produce
Dimeka
Turmi, Dimeka, Keyafer, Kako
Turmi and Dimeka
Turmi and bush market
particularly goat -grain
exchange
Turmi and at their villages (crop
traders bring crop and exchange
for goats
Erbore and Birale
Erbore
Erbore,Birale
Dimeka,Kako and Keyafer
4%
Sell livestock to purchase grains
5%
5%
Sell livestock (particularly goat) to
purchase grains
10% Sell livestock (particularly goat) to
purchase grains
10% to Sell livestock (particularly goat) to
15% purchase grains
2%
Sell livestock (particularly goat) to
purchase grains
2%
Sell livestock (particularly goat) to
purchase grains
2%
Sell livestock (particularly goat) to
purchase grains
3%
Sell livestock (particularly goat) to
purchase grains
163
Page 1 of 2
Wereda Disaster
Risk Profile
Disaster Risk Management
and Food Security Sector (DRMFSS)
Data_Collected_Date September 2010
Tuesday, September 30, 2014
Region S.N.N.P
Zone SOUTH OMO
Wereda HAMER
Selected Indictor:
KebeleName
ERIYA
MRSHA
GEDBAK
ASELE
Economic Vulnerability: Proportion of Produce Sold and Market - Proportion of crops and livestock sold from total
production and markets
Market_For_Crops
Market_For_Livestock_Produce
Percent
Livestock_Sold
Total_% Comments
Sold
No sale of crop
produce
Turmi, Dimeka, Keyafer,
Kako,jinka
5%
Sell livestock (particularly goat) to
purchase grains
No sale of crop
Turmi, Dimeka and bush
3%
produce
market(exchange of heifers for
bulls)
Dimeka, Keyafer
and at village
Dimeka, Kako and Keyafer
3%
Sell livestock (particularly goat) to
purchase grains
No sale of crop
produce
Turmi, Dimeka and bush
market(exchange of heifers for
bulls)
6%
Sell livestock (particularly goat) to
purchase grains
164
Page 2 of 2
Data_Collected_Date
September 2010
Tuesday, September 30, 2014
Region S.N.N.P
Zone SOUTH OMO
Wereda HAMER
Selected Indicator
Economic Vulnerability: Kebele Access to Markets - Access to market by Kebele
Kebele Name
ASELE
DEGA KEJA
ERBORE
ERIYA
GEDBAK
KOLA KEJA
LALA
MINOGELTI
MRSHA
SHANKO
HEDBAK
QUARO
SHESHA GOYKE
BESSA MEJAN
SHANKO 2
Market_Access_Comments
There is good access and linkages with livestock markets, price offer are also better than
before particularly this year. But pastoralists are not willing to sell
As current condition, access to and linkages with livestock market is better than before.
But the awareness of the community about livestock market is poor
"There is good and linkage to livestock market, but they are not willing to sell animals
during good price season.
There is good access and linkage with livestock markets as a result of improved road
condition and good price offers
There is no access and linkage with market. The market points (like Dimeka, Keyafer and
Kako) are 35 to 70 km far away from the kebele
At this time there is good price offer for livestock in local markets (at Dimka or Turmi),
but herders are not willing to sell unless hunger strikes them
There is good linkage and access to livestock market and there is good price offer for
livestock at Dimeka, Turmi, Keyafer, and Kako livestock markets
Livestock market points are very far from the PA (about 60 km), therefore, crop traders
bring crops (sorghum) to the area and exchange it with goat. For instance, on average,
price of goat is Birr 400 which is exchanged for 50 km of sorghum
Although the local community has good access to livestock market and good price offers
for their produce, they are not willing to sell unless they face problems
Poor access to market places particularly during rainy season
"There is no access to and linkage with markets. Dimeka and Keyafer markets are 56 to
60 kms far away
There is no livestock market access problem, but the only problem is lack of awareness
on selling of livestock at good price offer times
"This community has low access for livestock market due to too far distant from
marketing points i.e., 55 km.
"There is good access and linkage with markets and good price offer for cattle and goats,
but the price offer
There is good access and linkage with livestock market, and the price offer for livestock
has increased by three fold
165
Page 1 of 1
Data_Collected_Date
September 2010
Tuesday, September 30, 2014
Region S.N.N.P
Zone SOUTH OMO
Wereda HAMER
Selected Indicator
Economic Vulnerability: Formal & Informal Transfers - Percentage of households
reporting received formal transfers
Type of Formal Transfer
Food aid
HH Response Type of Informal Transfer
Formal
61.60 Remittances (from relative living elsewhere)
61.60
Food-for-Work project
2.20 Zakaat
2.20
Cash-for-Work project
0.20 Other cash gift
0.20
Faffa
0.50 Cash loan (no interest)
0.50
Free cash
0.30 Food or grain gift
0.30
Seeds
88.80 Grain loan (no interest)
88.80
Credit support
0.50 Seed gift
0.50
Livestock
Seed loan
Blood money – compensation
Sacrifice made to feed the poor
Cash or kind gift to married daughters when they visit
parents or relatives
Gift of livestock to newly-weds
Donation or loan of milking animals to a relative or
friend
Dowry given to bride’s parents
Donations of cash or animals to disaster stricken
people
166
HH Response
0.20
0.20
1.60
1.60
0.30
0.30
4.80
4.80
0.30
0.30
1.90
1.90
0.30
0.30
0.80
0.80
1.80
0.60
1.00
1.00
0.20
Page 1 of 3
Data_Collected_Date
September 2010
Tuesday, September 30, 2014
Region S.N.N.P
Zone SOUTH OMO
Wereda HAMER
Selected Indicator
Economic Vulnerability: Formal & Informal Transfers - Percentage of households
reporting received formal transfers
Type of Formal Transfer
HH Response
Formal
Type of Informal Transfer
Blood money – compensation
Free labour
Free use of oxen or plough
Free use of pack animals (camels or donkeys)
Restocking of poorer relatives
Distribution of meat to neighbours after a slaughter
takes place
Sacrifice made to feed the poor
Cash or kind gift to married daughters when they visit
parents or relatives
Gift of livestock to newly-weds
Donation or loan of milking animals to a relative or
friend
Dowry given to bride’s parents
Donations of cash or animals to disaster stricken
people
Free labour
Free use of oxen or plough
Free use of pack animals (camels or donkeys)
Restocking of poorer relatives
Distribution of meat to neighbours after a slaughter
takes place
HH Response
2.10
3.30
1.60
0.20
1.80
0.60
1.00
1.00
0.20
2.10
3.30
1.60
0.20
167
Page 2 of 3
Data_Collected_Date
September 2010
Tuesday, September 30, 2014
Region S.N.N.P
Zone SOUTH OMO
Wereda HAMER
Selected Indicator
Economic Vulnerability: Formal & Informal Transfers - Percentage of households
reporting received formal transfers
Type of Formal Transfer
HH Response Type of Informal Transfer
Formal
Type of Formal Transfer Received By Households
HH Response
0.2
0.5
0.5
61.6
0.0%
Cash-for-Work project
Credit support
Faffa
0.1%
0.3%
0.3%
Food aid
40.0%
Food-for-Work project
Free cash
Livestock
1.4%
0.2%
0.0%
Seeds
57.6%
Total:
100.0%
2.2
0.3
88.8
168
Page 3 of 3
Data_Collected_Date
September 2010
Tuesday, September 30, 2014
Region S.N.N.P
Zone SOUTH OMO
Wereda HAMER
Selected Indicator
Economic Vulnerability: Formal & Informal Transfers - Percentage of households
reporting received Informal transfers
Type of Formal Transfer
Food aid
HH Response Type of Informal Transfer
Formal
61.60 Remittances (from relative living elsewhere)
HH Response
0.20
61.60
0.20
Food-for-Work project
2.20 Zakaat
1.60
2.20
1.60
Cash-for-Work project
0.20 Other cash gift
0.30
0.20
0.30
Faffa
0.50 Cash loan (no interest)
4.80
0.50
4.80
Free cash
0.30 Food or grain gift
0.30
0.30
0.30
Seeds
88.80 Grain loan (no interest)
1.90
88.80
1.90
Credit support
0.50 Seed gift
0.30
0.50
0.30
Livestock
Seed loan
0.80
0.80
Blood money – compensation
Sacrifice made to feed the poor
1.80
Cash or kind gift to married daughters when they visit
0.60
parents or relatives
Gift of livestock to newly-weds
1.00
Donation or loan of milking animals to a relative or
1.00
friend
169
Page 1 of 3

Data_Collected_Date
September 2010
Tuesday, September 30, 2014
Region S.N.N.P
Zone SOUTH OMO
Wereda HAMER
Selected Indicator
Economic Vulnerability: Formal & Informal Transfers - Percentage of households
reporting received Informal transfers
Type of Formal Transfer
HH Response
Formal
Type of Informal Transfer
Dowry given to bride’s parents
HH Response
Donations of cash or animals to disaster stricken people
0.20
Blood money – compensation
Free labour
2.10
Free use of oxen or plough
3.30
Free use of pack animals (camels or donkeys)
1.60
Restocking of poorer relatives
0.20
Distribution of meat to neighbours after a slaughter
takes place
Sacrifice made to feed the poor
1.80
Cash or kind gift to married daughters when they visit
0.60
parents or relatives
Gift of livestock to newly-weds
1.00
Donation or loan of milking animals to a relative or
1.00
friend
Dowry given to bride’s parents
Donations of cash or animals to disaster stricken people
0.20
Free labour
2.10
Free use of oxen or plough
3.30
Free use of pack animals (camels or donkeys)
1.60
Restocking of poorer relatives
0.20
Distribution of meat to neighbours after a slaughter
takes place
170
Page 2 of 3
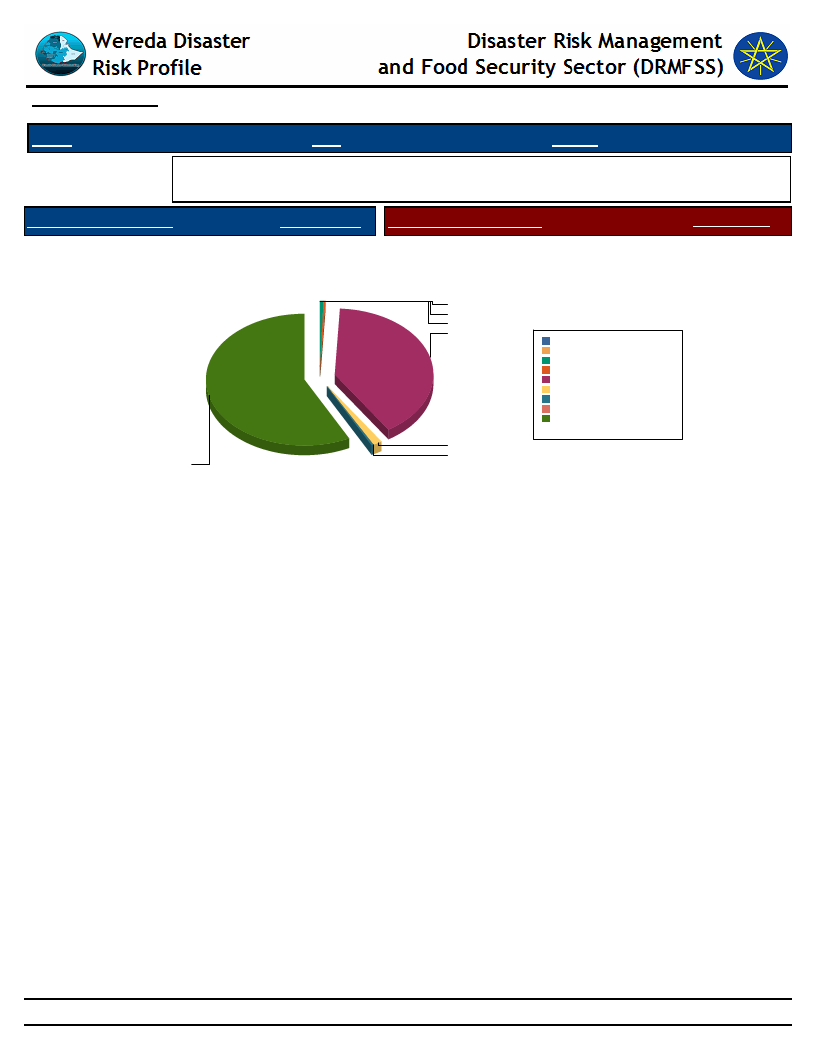
Data_Collected_Date
September 2010
Tuesday, September 30, 2014
Region S.N.N.P
Zone SOUTH OMO
Wereda HAMER
Selected Indicator
Economic Vulnerability: Formal & Informal Transfers - Percentage of households
reporting received Informal transfers
Type of Formal Transfer
HH Response Type of Informal Transfer
Formal
Type of Informal Transfer Received By Households
HH Response
0
1
1
62
0.0%
Cash-for-Work project 0.1%
Credit support
0.3%
Faffa
0.3%
Food aid
40.0%
Food-for-Work project 1.4%
Free cash
0.2%
Livestock
0.0%
Seeds
57.6%
Total:
100.0%
2
0
89
171
Page 3 of 3
Data_Collected_Date
September 2010
Tuesday, September 30, 2014
Region S.N.N.P
Selected Indicator
Zone SOUTH OMO
Wereda HAMER
Capacity: Access to Credit Facilities - Households access to credit facilities
Type of Access To Credit Facilities
Households with membership in any credit /micro finance society (%)
Households who borrowed any money in the last one year (%)
Households who tried to borrow 3-4
Households who managed to get credit 1-2
Households who managed to get credit 1-2
Indicator_Value
2.30
1.10
16.70
100.00
83.30
Average No. of HHs Tried to get Credit
Average No. HHs Managed to get Credit
0.82
0.45
172
Page 1 of 1
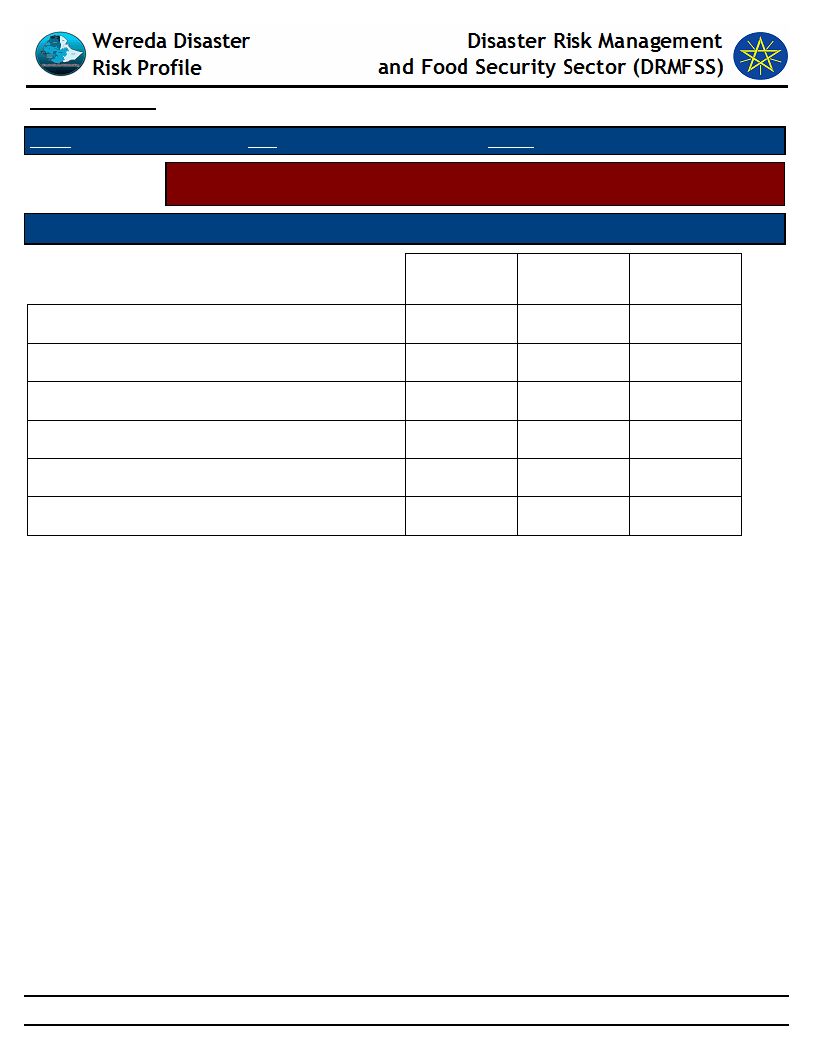
Data_Collected_Date
September 2010
Tuesday, September 30, 2014
Region S.N.N.P
Zone SOUTH OMO
Wereda HAMER
Selected Indicator
Capacity: Access to Credit Facilities - Percentage of households by major reasons
of borrowing money
Type of Borrowing Reason
Degree of Importance of the Borrowing Reasons - HH Respones
1st
2nd
3rd
Buy food
Buy or rent land
Others (specify)
Pay for education
Pay for health care
Pay for social event
20.00
100.00
20.00
100.00
173
Page 1 of 1
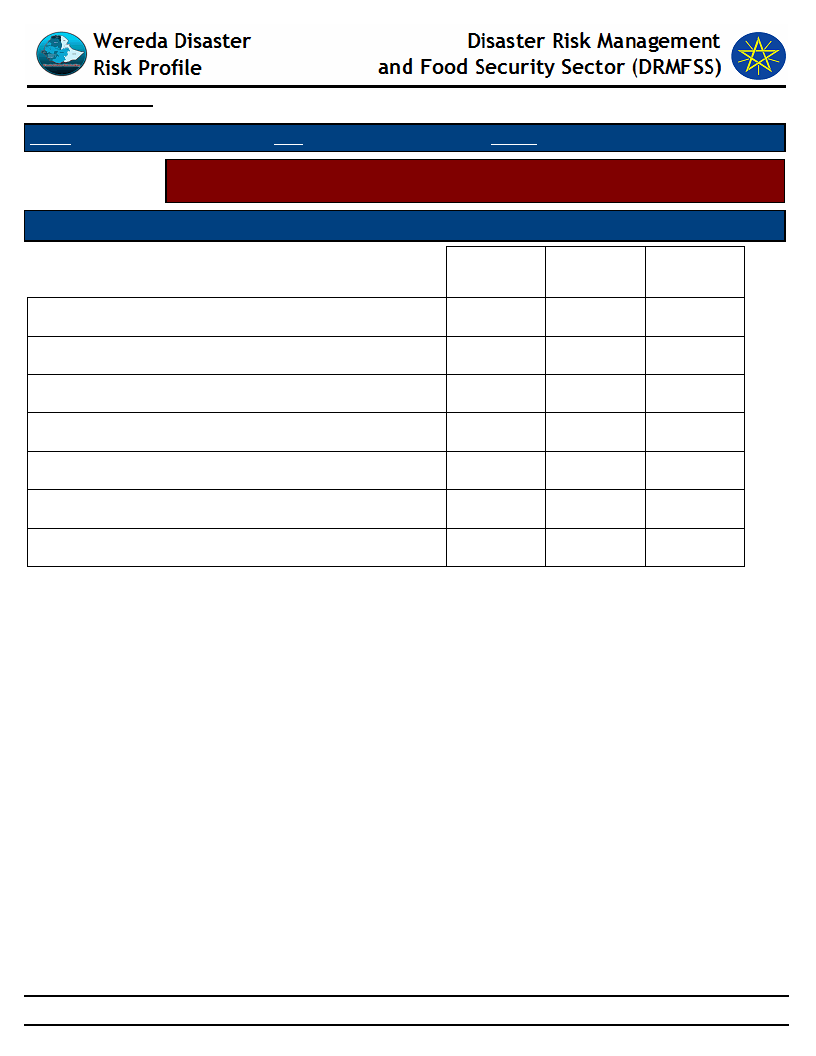
Data_Collected_Date
September 2010
Tuesday, September 30, 2014
Region S.N.N.P
Zone SOUTH OMO
Wereda HAMER
Selected Indicator
Capacity: Access to Credit Facilities - Percentage of households by major sources
of credit
Major Sources of Credit for Households
Degree of Importance of the Credit Source
1st
2nd
3rd
Bank/ formal lending institution
Friends/relatives
Help associations (Edir)
Informal savings group (Ekub)
Local shops / moneylenders
Neighbors
Others
40.00
20.00
40.00
174
Page 1 of 1
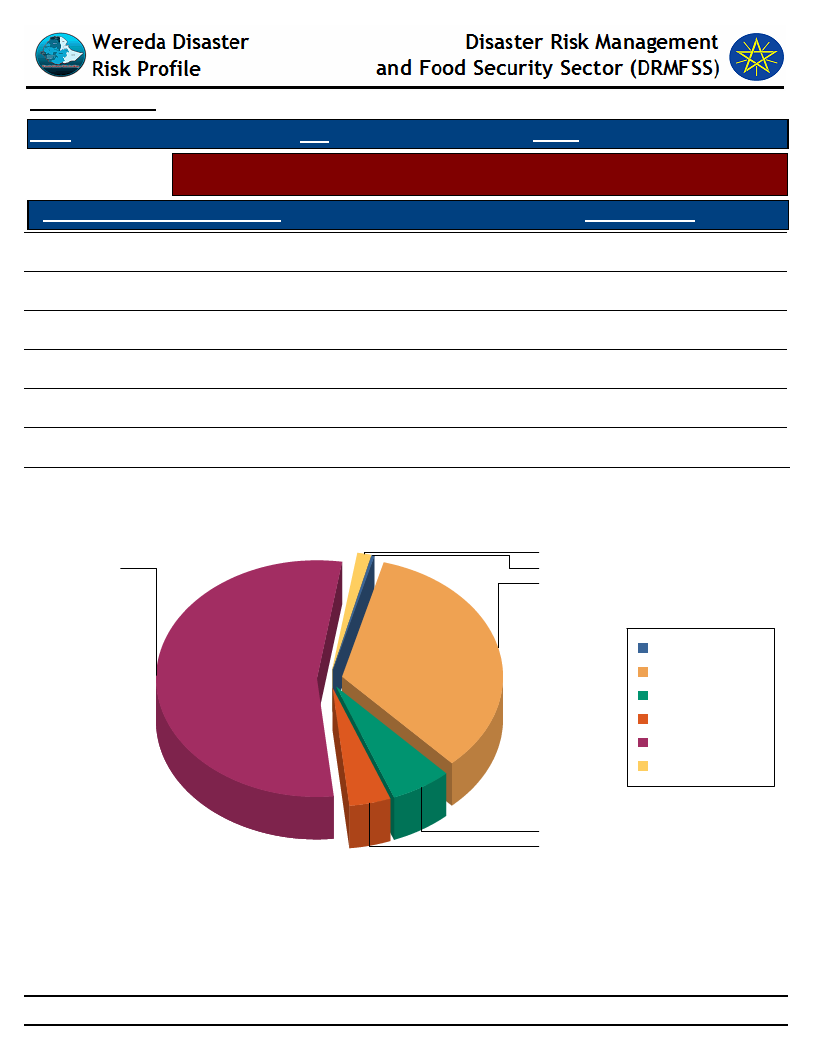
Data_Collected_Date
September 2010
Tuesday, September 30, 2014
Region S.N.N.P
Zone SOUTH OMO
Wereda HAMER
Selected Indicator
Capacity: Access to Credit Facilities - Percent of households with ability to raise
500 birr in one week
HH Ability To Raise 500 Br in One Week
Response_Percent
Yes, we would use our savings
54.10
Yes, by borrowing money
4.15
Yes, with some help from others
1.38
Perhaps, but I doubt it
6.22
No, it would be impossible
34.00
N/A
0.17
Households' Ability To Raise 500 Br in One Week
1
54
0
34
N/A
No, it would be
impossible
Perhaps, but I doubt it
Yes, by borrowing
money
Yes, we would use our
savings
Yes, with some help
from others
6
4
175
Page 1 of 1
WDRP Indicators
Health and Sanitation
Characteristics
176
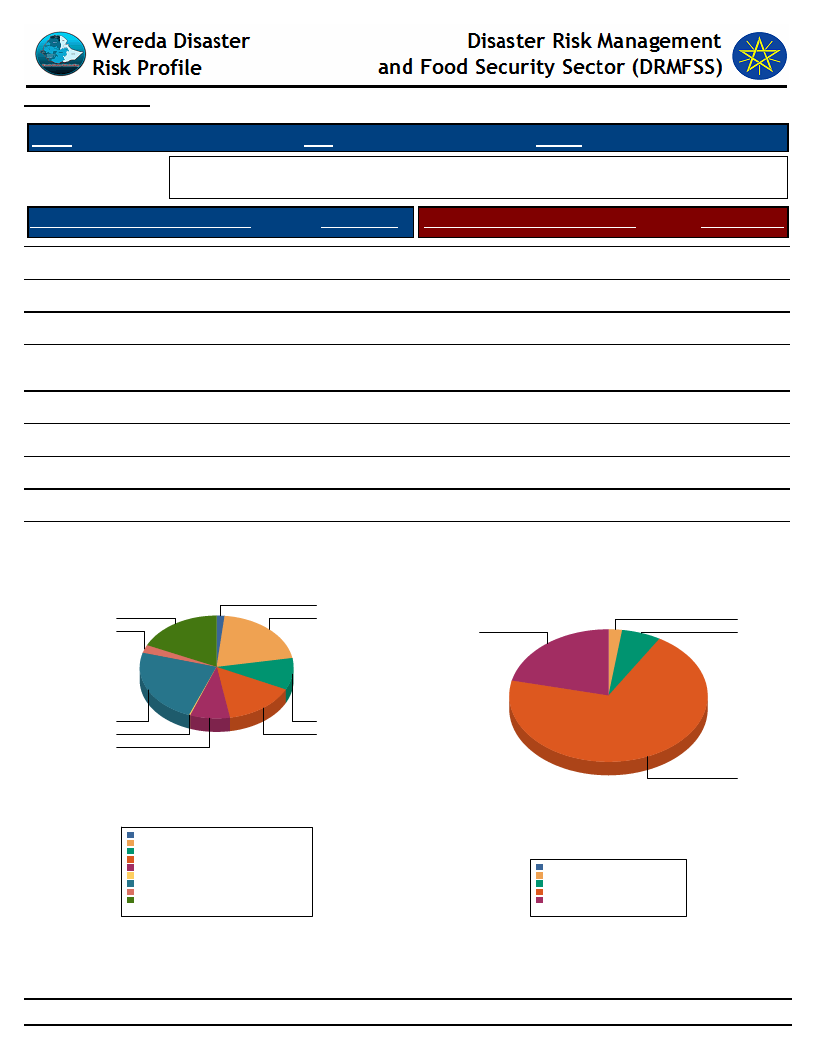
Data_Collected_Date
September 2010
Tuesday, September 30, 2014
Region S.N.N.P
Zone SOUTH OMO
Wereda HAMER
Selected Indicator
Household Access to Health Facilities - Where do patients go for health care?
Constraints to adequate healthcare
Where do Patients Go for Healthcare
HH Response Constraints to Adequate Health Car
HH Responses
Did not get Health Care
Community health worker
Central Hospital
District/Municipal hospital/health
centre/ clinic
Other public
Pharmacy
Other private
Traditional/spiritual healer
Other
9.88
20.70
1.55
15.10
No money for treatment costs
No money for travel
Don’t believe in health care
23.60
2.52
0.19
18.00
8.33
Not aware about any health facility
70.20
70.20
6.38
2.13
21.30
Where Do Patients go for Health care?
2
18
21
3
Constraints to Adequate Health Care
2
21
6
24
10
0
15
8
Central Hospital
Community health worker
Did not get Health Care
District/Municipal hospital/health centre/ clinic
Other
Other private
Other public
Pharmacy
Traditional/spiritual healer
1.6%
20.7%
9.9%
15.1%
8.3%
0.2%
23.6%
2.5%
18.0%
Total:
100.0%
70
Don’t believe in health care
No money for travel
No money for treatment costs
Not aware about any health facility
0.0%
2.1%
6.4%
70.2%
21.3%
Total:
100.0%
177
Page 1 of 1

Data_Collected_Date
September 2010
Tuesday, September 30, 2014
Region S.N.N.P
Selected Indicator
Zone SOUTH OMO
Wereda HAMER
Hazards: Health problems and changes over the last decade
Kebele Name
Health_Problems
Changes_In_Last_Decade
HEDBAK
Malaria, ascarias, taenias, common cold and bloody
diarria.
DEGA KEJA
Malaria infection is reducing rapidly since the supply of
mosquito net, but common cold, taeniasis, and ascarias
infections are increasing.
ADAMIE
SHANKO
After Omo river flood recession (flood retreat) (September
-December) conflict treat time.
Malaria infection is reducing where as taeniasis and
ascariasis is increasing.
BESSA MEJAN
The health situation is becoming bad when compared to
the last generation era owing to lack of resistance due to
depletion of livestock produce and crop produce.
Malaria is decreasing
whereas taenias, ascarias,
common cold and un
specific diaharia infections
increasing.
Before 10 years malaria
has been the main disease
in the area and has been
affected all the
community, but now it is
diminishing. Taeniasis,
ascarias and common cold
infections were rare
before, but now they
become common
infections in the area
particularly taeniasis has
become resistant for
drugs.
Malaria is rapidly
decreasing after supply of
mosquito net, but
taeniasis and ascarisis is
increasing.
in the past years we have
bad plenty of milk to used
food and blood meal also
,but know this produce is
becoming scarce
,therefore the main cause
for health compliation is
this scarcity.
178
Page 1 of 3
Data_Collected_Date
September 2010
Tuesday, September 30, 2014
Region S.N.N.P
Selected Indicator
Zone SOUTH OMO
Wereda HAMER
Hazards: Health problems and changes over the last decade
Kebele Name
MINOGELTI
SHESHA GOYKE
Health_Problems
unspecific diarrhea ,taeniasis ,malaria, common cold,
pneumonia
pneumonia, common cold, taeniasis , malaria, Diarrhea
QUARO
MURALE
On and off malaria, gip, common cold diarrhea.
Malaria was the main disease in the area, but now it is
decreasing, common cold, taeniasis and ascariasis are
common infections in the area.
ERBORE
LALA
Malaria is seasonal disease and it is decreasing from time
to time. Taeniasis and ascriasis are common disease of
this area. Its distribution is increasing from time to time.
The health situation of human popullation in the PA is
better than before for malaria, whereas the infection of
ascariasis and taeniasis increasing.
ERIYA
Human health condition is getting better especially
malaria, but the infection taeniasis and ascariasis is
increasing.
Changes_In_Last_Decade
Malaria infection is
reducing, but taeniasis is
increasing.
The level of infection is
reducing except taeniasis
which become increasing
from time to time and
become resistant for
drugs.
Malaria infection is
decreasing rapidly.
There was high level
malaria infection
especially after flooding
seasons, but now it has
declined after supply of
mosquito net, but the
infection of taeniasis and
ascariasis is increasing.
Malaria infection is
decreasing very rapidly
whereas gip infection is
increasing.
Malaria infection is
decreasing very rapidly
whereas gip infection is
increasing due to lack of
sanitation and increasing
consumption of livestock
produce.
179
Page 2 of 3
Data_Collected_Date
September 2010
Tuesday, September 30, 2014
Region S.N.N.P
Selected Indicator
Zone SOUTH OMO
Wereda HAMER
Hazards: Health problems and changes over the last decade
Kebele Name
MRSHA
Health_Problems
Malaria and unspecific diarrea are seasonal diseases.
GEDBAK
ASELE
malaria ,GIP, and unspecific diarrea are the main seasonal
diseases
Malaria, GIP and eye infections are common disease in the
community. There is high infection and taeniasis and
ascariasis infection as well.
Changes_In_Last_Decade
The level of malaria
infestation is decreasing
by for told as though some
unspecific health
complications increasing.
malaria infection is
reducing where as
taeniasis and ascariasis
infection is increasing
Eye infection is increasing
whereas malaria infection
is decreasing. Taeniasis
and ascariasis infection is
also increasing. The cause
of eye infection is the soil
that they smear /used for
hair decoration mixing
with butter.
180
Page 3 of 3
Wereda Disaster
Risk Profile
Data_Collected_Date
September 2010
Region S.N.N.P
Zone SOUTH OMO
Disaster Risk Management and Food
Security Sector (DRMFSS)
Tuesday, September 30, 2014
Wereda HAMER
Selected Indicator
Household Health Status - Households health condition and major health problems
Health Condition
HH Response Population Sickness
HH Response Children Sickness
HH Response
Good health
83.0
Malaria
32.0 Chronic fever
24.0
Ill for <3 months
16.0
Chronic fever
22.0 Malaria
26.0
Ill for more than three months
1.0
Diarrhea
19.0 Diarrhea
41.0
Mental illness
1.0
DK
2.0
Pneumonia/ lung problem
3.0 DK
2.0
Tuberculosis
2.0
Stomach pain
2.0
Hyper tension
1.0
Meningitis
1.0
Asthma
0.0
Headache
6.0 Headache
4.0
Back ache
5.0 Meningitis
1.0
Eye problems
4.0 Eye problems
2.0
181
Page 1 of 2
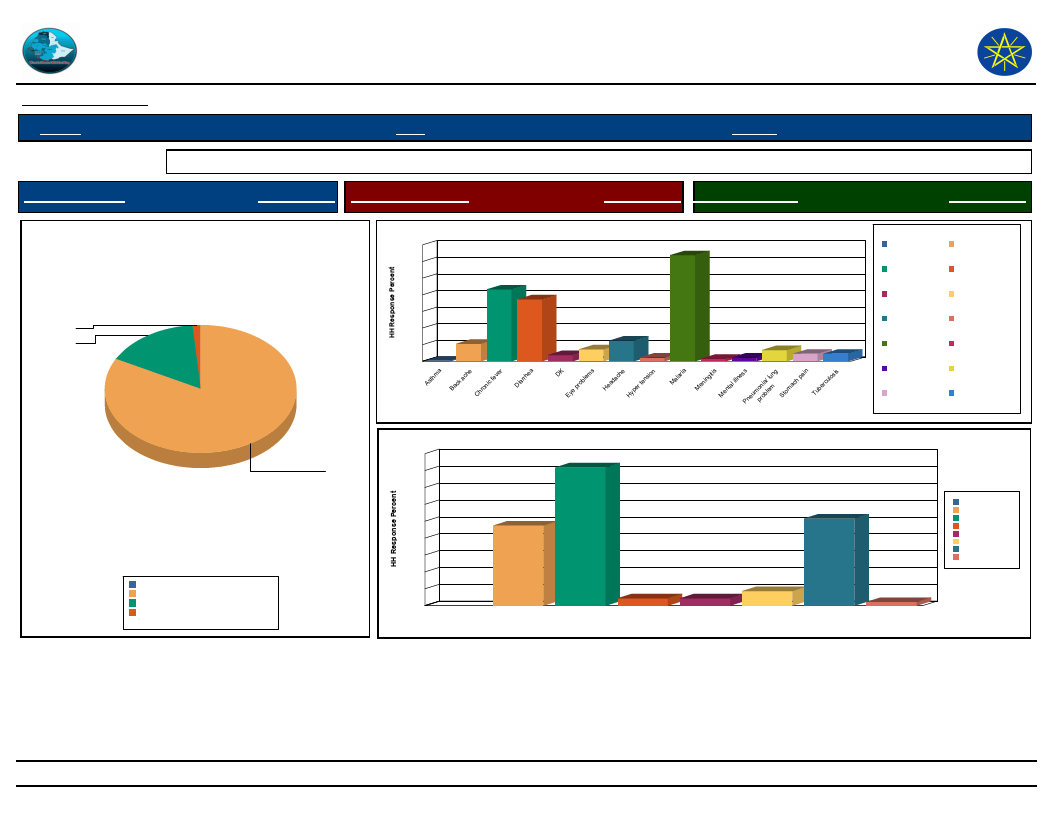
Wereda Disaster
Risk Profile
Data_Collected_Date
September 2010
Region S.N.N.P
Zone SOUTH OMO
Disaster Risk Management and Food
Security Sector (DRMFSS)
Tuesday, September 30, 2014
Wereda HAMER
Selected Indicator
Household Health Status - Households health condition and major health problems
Health Condition
HH Response Population Sickness
HH Response Children Sickness
HH Response
Health Condition of the Community
1.4
15.8
82.9
Good health
Ill for <3 months
Ill for more than three months
0.0%
82.9%
15.8%
1.4%
Total:
100.0%
35
30
25
22
20
15
10
5
5
0
0
a
Asthm
Back ache Chronic fever
19
Diarrhea
Population Sickness in the Community
32
6
4
2
1
3
2
2
1
1
DK
s
problem
Eye
Headache Hyper tension
alaria
M
Population Sickness
eningitis
M
ental
M
illnessPneumopnroiab/lelumng
pain
ach
Stom
Tuberculosis
Children Sickness in the Community
45
41
40
35
30
26
25
24
20
15
10
5
4
2
2
0
Chronic fever
Diarrhea
DK
Eye problems
Headache
Malaria
Children Sickness
Asthma
Chronic fever
DK
Headache
Malaria
Mental illness
Stomach pain
Back ache
Diarrhea
Eye problems
Hyper tension
Meningitis
Pneumonia/ lung
problem
Tuberculosis
1
Meningitis
Chronic fever
Diarrhea
DK
Eye problems
Headache
Malaria
Meningitis
182
Page 2 of 2
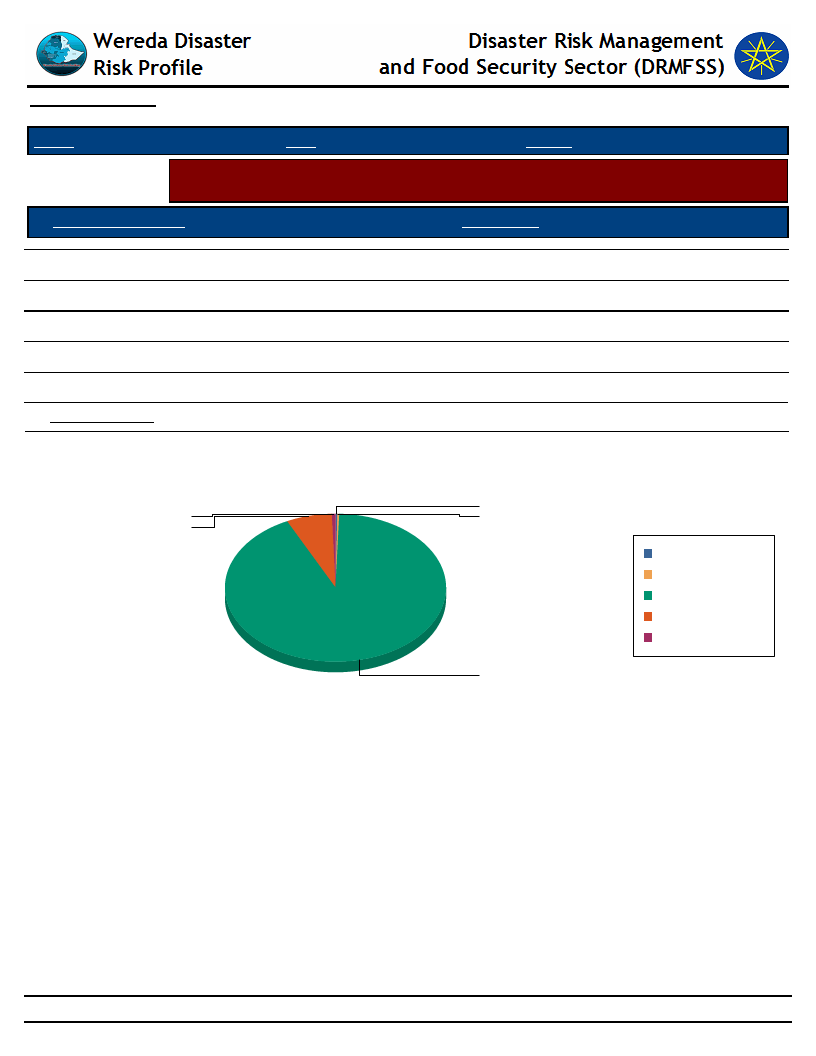
Data_Collected_Date
September 2010
Tuesday, September 30, 2014
Region S.N.N.P
Zone SOUTH OMO
Wereda HAMER
Selected Indicator
Household Access to Sanitation - Percentage of households with access to
different kind of toilet facilities
Type of Toilet Facility
HH Response
Modern water closet
Ventilated, build in latrine
Outdoors latrine/hole on plot
No facilities/Open Space
DK
HH Sharing Toilet
0.32
0.49
6.80
92.20
0.16
12.20
Household Responses to the type of toilet facilities in the community
0.2
0.5
0.3
6.8
DK
Modern water closet
No facilities/Open Space
Outdoors latrine/hole on
plot
Ventilated, build in latrine
92.2
183
Page 1 of 1
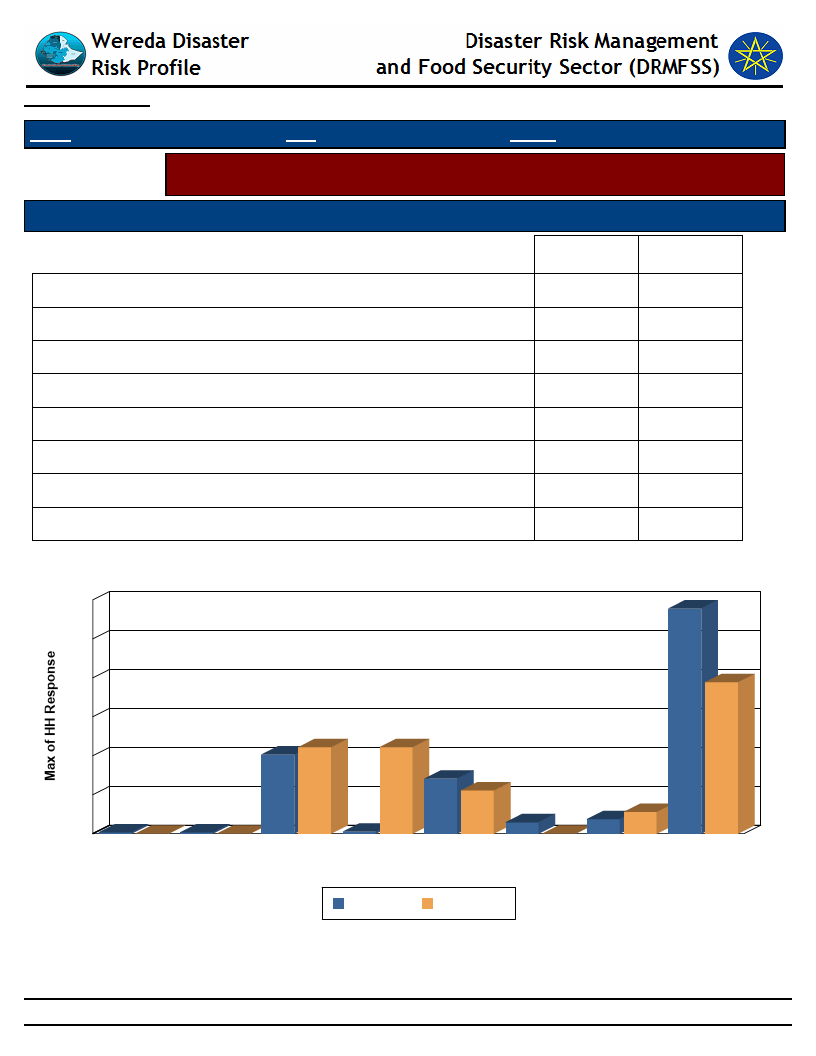
Data_Collected_Date
September 2010
Tuesday, September 30, 2014
Region S.N.N.P
Zone SOUTH OMO
Wereda HAMER
Selected Indicator
Household Access to Drinking Water - Sources of drinking water for households
(response in %)
Sources of drinking water for Households
Priority of the Water Source
Main
Secondary
Birka
Communal tap (Bono)
Covered well or borehole
Open well
Piped water outside the house
Pond or lake (fenced)
Pond or lake (open access)
River, stream
0.32
0.32
20.30
0.49
14.10
2.92
3.73
57.80
0.00
0.00
22.20
22.20
11.10
0.00
5.56
38.90
Source of Drinking Water & Type of Source
60
58
50
40
39
30
20
10
00
0
Birka
22
22
20
00
Communal
tap (Bono)
Covered well
or borehole
0
Open well
14
11
3
0
6
4
Piped water Pond or lake Pond or lake River, stream
outside the (fenced)
(open
house
access)
Main
Secondary
184
Page 1 of 1
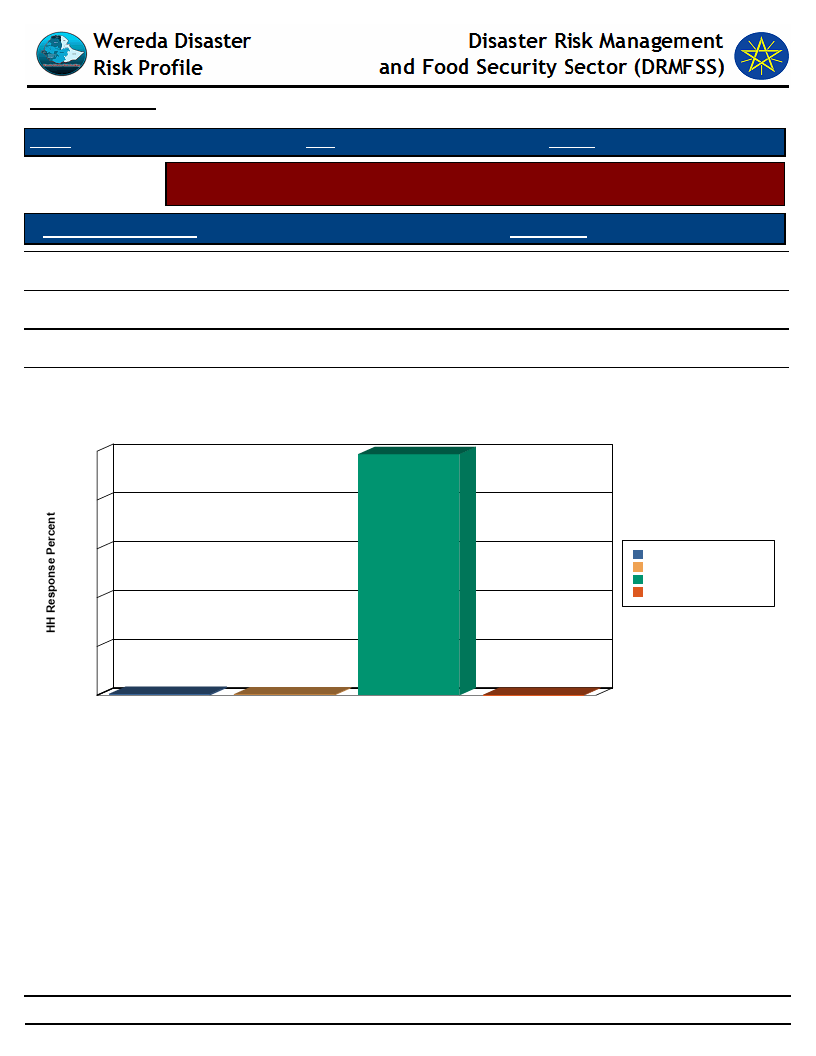
Data_Collected_Date
September 2010
Tuesday, September 30, 2014
Region S.N.N.P
Zone SOUTH OMO
Wereda HAMER
Selected Indicator
Household Access to Drinking Water - Households methods of treating drinking
water
Method of Treating Water
HH Response
Boil
0.50
Water Guard
0.17
Other Method (specify)
98.80
None
0.33
Method of Treating Water by Households
100
99
80
60
Boil
None
Other Method (specify)
Water Guard
40
20
1
0
Boil
0
None
Other Method (specify)
Water Treatment Method
0
Water Guard
185
Page 1 of 1
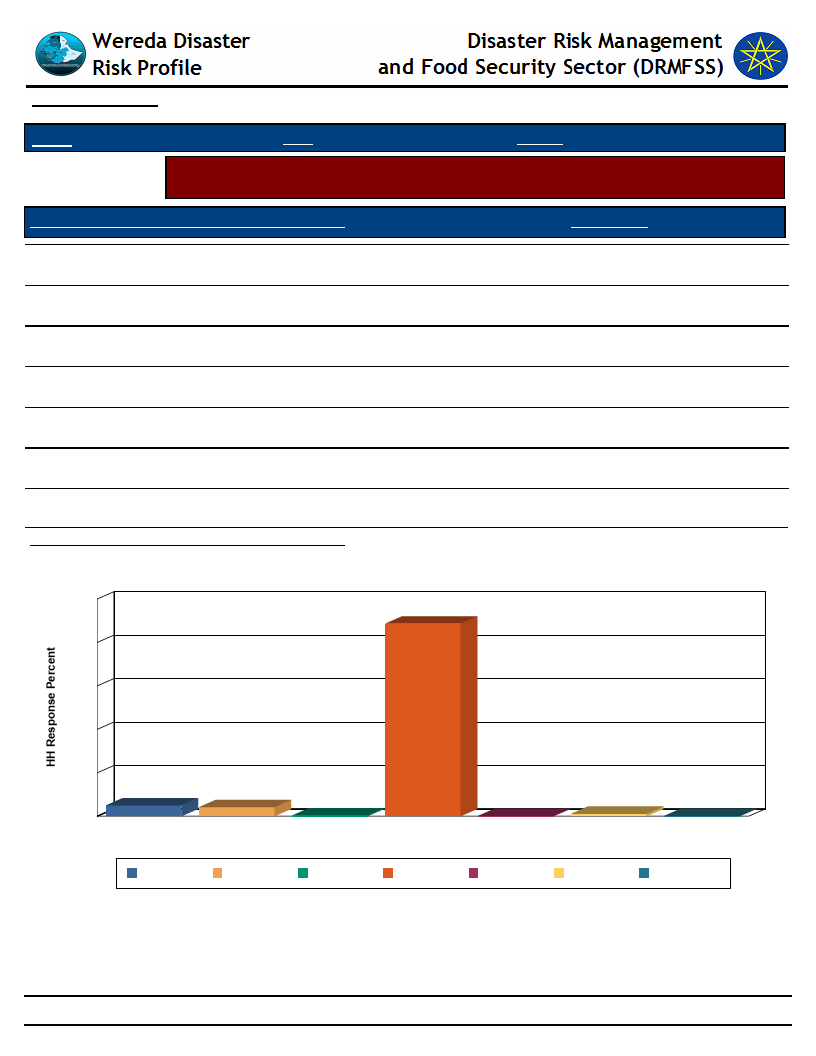
Data_Collected_Date
September 2010
Tuesday, September 30, 2014
Region S.N.N.P
Zone SOUTH OMO
Wereda HAMER
Selected Indicator
Household Access to Drinking Water - Number of times households fetch water in
a week
Number of Times Households Fetch Water in a Week
HH Response
Once
0.32
Twice
0.16
Three times
1.12
Four times
4.17
Five times
4.98
Six times
0.16
Seven times
Average Number of Times HH Fetch Water Per Week
Number of Times HH Fetch Water in a Week
100
89
80
88.60
6.68
60
40
20
5
0
Five times
4
Four times
0
0
Once
Seven times
Six times
Number of Times HH Fetch Water in a Week
1
Three times
0
Twice
Five times
Four times
Once
Seven times
Six times
Three times
Twice
186
Page 1 of 1
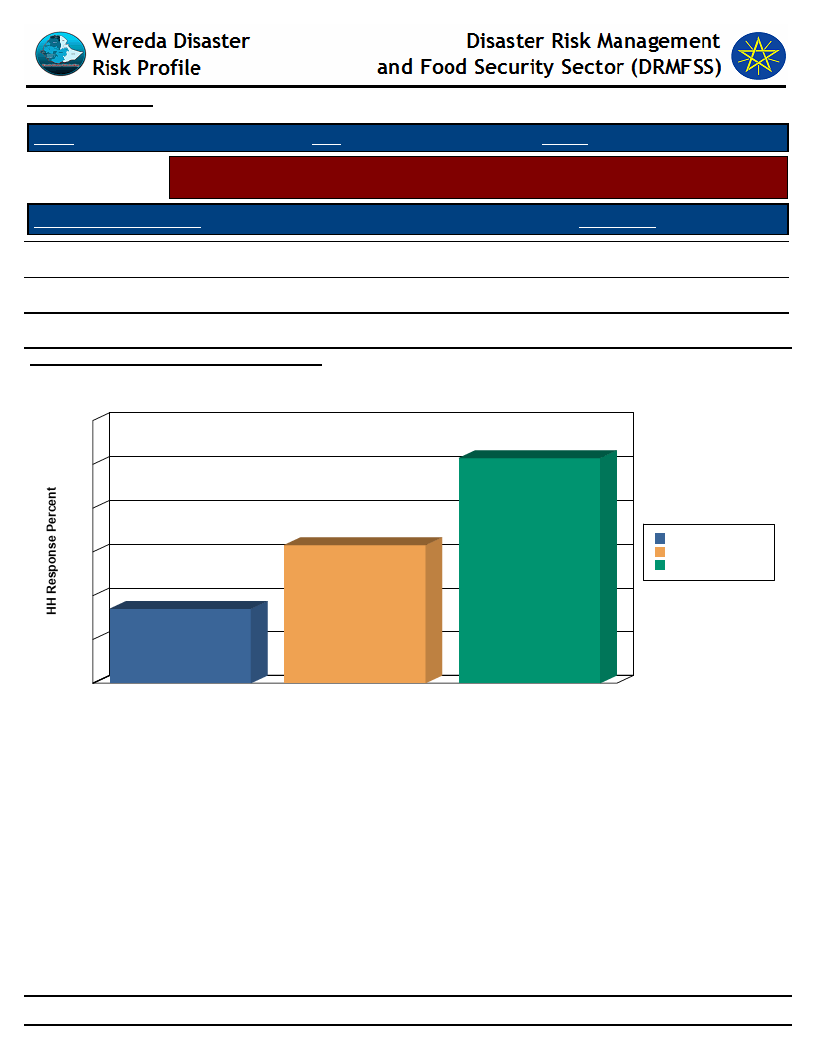
Data_Collected_Date
September 2010
Tuesday, September 30, 2014
Region S.N.N.P
Zone SOUTH OMO
Wereda HAMER
Selected Indicator
Household Access to Drinking Water - Time taken per day to fetch water for
households
Time Taken To Fetch Water
HH Response
Less than 30 min
51.44
30 min - 1 hr
31.57
1 hr and Above
Average Number of Times Taken To Fetch Water
16.99
48.74
Time Taken To Fetch Water for the HH
60
51
50
40
32
30
20
17
10
1 hr and Above
30 min - 1 hr
Less than 30 min
0
1 hr and Above
30 min - 1 hr
Less than 30 min
Time Taken To Fetch Water
187
Page 1 of 1
WDRP Indicators
Coping Mechanisms and
Preparedness
188

Wereda Disaster
Risk Profile
Data_Collected_Date
September 2010
Disaster Risk Management and Food
Security Sector (DRMFSS)
Tuesday, September 30, 2014
Region S.N.N.P
Selected Indicator
Zone SOUTH OMO
Wereda HAMER
Capacity: Community Preparedness against Sudden Onset Disasters
KebeleName
Precaution_1
Comment_1
Precaution_2
Comment_2
Precaution_3
Comment_3
HEDBAK
SHANKO
DEGA KEJA
SHANKO 2
If depend on the
disaster type .if it is
livestock and /or
human disease.
If depend on the type
of disaster if it is a
conflict at grazing
and water points
areas during
shortage.
If the coming disaster
is disease of livestock
and human, we
restrict movement to
disease source areas.
Restrict livestock
movement to disease
source areas.
It is our usual
measure we have
been taking since
the age of our young
hood and in the era
of our fathers.
This only and usual
measure they have
been taking.
This is the only usual
measure of our
community.
Livestock disease
are usually appeared
un expectedly, so
the only measure is
restrict movements
until vaccination
and treatments
rendered.
189
Page 1 of 5

Wereda Disaster
Risk Profile
Data_Collected_Date
September 2010
Disaster Risk Management and Food
Security Sector (DRMFSS)
Tuesday, September 30, 2014
Region S.N.N.P
Selected Indicator
Zone SOUTH OMO
Wereda HAMER
Capacity: Community Preparedness against Sudden Onset Disasters
KebeleName
Precaution_1
Comment_1
Precaution_2
Comment_2
Precaution_3
Comment_3
BESSA MEJAN
MINOGELTI
SHESHA GOYKE
Aware the herders to
evacuate all livestock
from boarder grazing
areas.
pass information to
all PA community
about the coming
disaster to take care
and prepare for
coming
disaster(conflict)
shift livestock to safe
grazing and watering
points (for conflict)
Conflict with
Dasenech is in
evitable for kuluma
and gelema
community.
Conflict is always
expected disaster
for this community,
so information
should be fast and
include all PA and
vicinity PA to save
hammer ethnic from
effects of Dasenech
and/or borena.
If we dont change
grazing points, the
magnitude and
duration of damage
will increase
livestock will be
taken at the time of
fighting.
190
Page 2 of 5
Wereda Disaster
Risk Profile
Data_Collected_Date
September 2010
Disaster Risk Management and Food
Security Sector (DRMFSS)
Tuesday, September 30, 2014
Region S.N.N.P
Selected Indicator
Zone SOUTH OMO
Wereda HAMER
Capacity: Community Preparedness against Sudden Onset Disasters
KebeleName
QUARO
ERBORE
LALA
Precaution_1
Regular follow up of
river volume to
evacuate from
village.
Shifting of livestock,
women, children and
elders to flood safe
crops.
For livestock disease
disasters we apply to
pastoral development
office to get animal
health services
before death occur.
Comment_1
These are the only
measures of the
community to lead
normal life without
leaving the birth
place.
To save loss of life
and damage of
properties.
Precaution_2
At current condition
this is the only
measure to save our
main stay.
Comment_2
Precaution_3
Comment_3
191
Page 3 of 5

Wereda Disaster
Risk Profile
Data_Collected_Date
September 2010
Disaster Risk Management and Food
Security Sector (DRMFSS)
Tuesday, September 30, 2014
Region S.N.N.P
Selected Indicator
Zone SOUTH OMO
Wereda HAMER
Capacity: Community Preparedness against Sudden Onset Disasters
KebeleName
ERIYA
MRSHA
GEDBAK
Precaution_1
If it is disease of
livestock we restrict
movement to disease
source areas and
appeal for animal
health office.
In this community
there is no expected
rapid onset disaster,
but if human or
livestock disease
appear, we swiftly
inform to the
government office.
Restrict movement to
disease source areas
for human and
livestock diseases
disasters.
Comment_1
B/c of livestock
diseases are usually
un expected and the
only measure is
restricts movement
of livestock to
disease areas and
applies to animal
health office to
reduce disasters.
at this time we have
no any measures to
be taken culturally
and /or knowledge
and skill to control
and prevent human
and livestock
disease out break
It is our usual
measure to reduce
disease incidences
of human and
livestock.
Precaution_2
Comment_2
Precaution_3
Comment_3
192
Page 4 of 5

Wereda Disaster
Risk Profile
Data_Collected_Date
September 2010
Disaster Risk Management and Food
Security Sector (DRMFSS)
Tuesday, September 30, 2014
Region S.N.N.P
Selected Indicator
Zone SOUTH OMO
Wereda HAMER
Capacity: Community Preparedness against Sudden Onset Disasters
KebeleName
ASELE
WENBAYNO
Precaution_1
Shifting of grazing
points and announce
for all the PA
community as there
is threat of conflict
with Borena. (Warn
the community to
take care and guard
their livestock
seriously).
If the coming disaster
is disease of livestock
and human, we
restrict movement of
livestock and humans
to disease outbreak
areas, but for other
disasters, no
measures to be
taken.
Comment_1
This is our usual
measure to save loss
of life and livestock
raiding by rival
ethnic groups
(Borena or Gabra).
Precaution_2
there is the only
option and capacity
of the community
until we apply to
govt.
Comment_2
Precaution_3
Comment_3
193
Page 5 of 5

Wereda Disaster
Risk Profile
Disaster Risk Management and Food
Security Sector (DRMFSS)
Data_Collected_Date
September 2010
Tuesday, September 30, 2014
Region S.N.N.P
Zone SOUTH OMO
Wereda HAMER
Selected Indicator
Capacity: Community Preparedness against Increase in Disaster Intensity
KebeleName
Precaution_1
Comment_1
Precaution_2
Comment_2
Precaution_3
Comment_3
HEDBAK
SHANKO
DEGA KEJA
SHANKO 2
We submit
application for
wereda
administration
office
Feed shortage for
livestock, human
being food
shortage
If disaster is
livestock disease
we drive livestock
to health services
for mass
vaccination or
treatment
Present appeal for
wereda PDO to get
more and routine
animal health
services
It is the only
measure to protect
community lives
Mobilization with
their livestock to
grazing and water
points, funding food
grain during feed
grain shortage
Driving livestock to
health centres is
the last measure of
our community
before many losses
occurred
livestock disease
disasters are
difficult to prevent
by community
coping mechanisms
without the support
of the government
Apply to wereda
administration
office to protect
the community from
loss
Human disease out
breaks is resolved
only by the
involvement of
wereda government
officials
Bring livestock for
mass vaccination
and treatment
services
Since livestock is the
main livelihood
source and they need
support from
government
194
Page 1 of 8

Wereda Disaster
Risk Profile
Disaster Risk Management and Food
Security Sector (DRMFSS)
Data_Collected_Date
September 2010
Tuesday, September 30, 2014
Region S.N.N.P
Zone SOUTH OMO
Wereda HAMER
Selected Indicator
Capacity: Community Preparedness against Increase in Disaster Intensity
KebeleName
Precaution_1
Comment_1
Precaution_2
Comment_2
Precaution_3
Comment_3
BESSA MEJAN
MINOGELTI
SHESHA GOYKE
purchasing of food
grain at low price
times and selling
of livestock at
good price offer
times (for hunger)
Request help from
neighbouring PAs
to push back the
coming enemy
But we used to face
the reverse one
Keeping numerous
livestock to resist
drought loss
It is usual asking
help from
neighbouring PA the
same ethnic groups
to resist of grazing
rival ethnic to save
PA community
Appeal for wereda
administrators to
resolve the raised
conflict
for conflict the
elders find
resolution methods
dialogue with
government
It is usual resolving
raised conflict
dialogue with elders
of both ethnics by
government
mediator when
there is frequent
attack and long
duration conflict
For livestock
diseases, bring
livestock to health
services for
vaccination and
treatment
Recurrent drought
has been killing our
livestock
If the conflict zones
become broaden (if
the conflict is among
borena, Dassenech
and gabra) the PA
elders appeal for
local governmnet to
settle the current
situation
we have found that
annual vaccination
and frequent
treatment services
save (reduce loss of
livestock during
disease outbreak and
long distance
trekking for grazing)
195
Page 2 of 8

Wereda Disaster
Risk Profile
Disaster Risk Management and Food
Security Sector (DRMFSS)
Data_Collected_Date
September 2010
Tuesday, September 30, 2014
Region S.N.N.P
Zone SOUTH OMO
Wereda HAMER
Selected Indicator
Capacity: Community Preparedness against Increase in Disaster Intensity
KebeleName
Precaution_1
Comment_1
Precaution_2
Comment_2
Precaution_3
Comment_3
ERBORE
No measures we
take except
evacuating during
flooding and
return to usual
settlement area
after flood retreat
we have been living
here resisting this
happening however
the effect and
magnitude of
flooding has been
increasing since
1999 etc there is no
other alternative
also rather than
using flood
recession
agriculture and
settlement of two
river side (Woito
river)
196
Page 3 of 8

Wereda Disaster
Risk Profile
Data_Collected_Date
September 2010
Disaster Risk Management and Food
Security Sector (DRMFSS)
Tuesday, September 30, 2014
Region S.N.N.P
Zone SOUTH OMO
Wereda HAMER
Selected Indicator
Capacity: Community Preparedness against Increase in Disaster Intensity
KebeleName
Precaution_1
Comment_1
Precaution_2
Comment_2
Precaution_3
Comment_3
KOLA KEJA
The PA elders
discuss about the
magnitude and
effect of disaster
by giving priority
for traditional
forecasters
Disease hazards
(both livestock and
human) are
becoming beyond
the capacity of the
community.
poaching and
encroaching parks
and buffer zones
the major coping
mechanisms used in
the area.
197
Page 4 of 8

Wereda Disaster
Risk Profile
Data_Collected_Date
September 2010
Disaster Risk Management and Food
Security Sector (DRMFSS)
Tuesday, September 30, 2014
Region S.N.N.P
Zone SOUTH OMO
Wereda HAMER
Selected Indicator
Capacity: Community Preparedness against Increase in Disaster Intensity
KebeleName
Precaution_1
Comment_1
Precaution_2
Comment_2
Precaution_3
Comment_3
QUARO
LALA
forward
application for
wereda
administration to
get support of fuel
for motorized
boat, and support
of other
requirements as
treatment of flood
water, support of
mosquito net,
support of
treatment for
water borne
diseases and
support of food aid
offer livestock to
health services for
mass vaccination
and treatment
if the flood disaster
increases, we
couldn’t recover
without the support
of the government
Mass vaccination
and mass treatment
activities have been
saved losses of
livestock from
death of certain
diseases as anthrax,
CCPP, CBPP, black
leg
Shifting of grazing
places when the
disease outbreak
occurred in dry
season grazing areas
Shifting is another
method for our
community to reduce
disease distribution
and death rate
198
Page 5 of 8

Wereda Disaster
Risk Profile
Disaster Risk Management and Food
Security Sector (DRMFSS)
Data_Collected_Date
September 2010
Tuesday, September 30, 2014
Region S.N.N.P
Zone SOUTH OMO
Wereda HAMER
Selected Indicator
Capacity: Community Preparedness against Increase in Disaster Intensity
KebeleName
Precaution_1
Comment_1
Precaution_2
Comment_2
Precaution_3
Comment_3
ERIYA
MRSHA
bring all livestock
to animal health
services for mass
vaccination and
treatment
Selling livestock at
their good body
condition and
purchasing grain at
the time of low
price
Vaccination services
are very important
for suddenly
occurred disease as
the previous
experiences
At this time
livestock market is
becoming attractive
due to getting more
awareness from
agricultural
extension workers
We have seen price
differences of
livestock at the
time of drought and
crop prices during
dry seasons as well
Frequent change of
grazing and
watering points
199
Page 6 of 8

Wereda Disaster
Risk Profile
Data_Collected_Date
September 2010
Disaster Risk Management and Food
Security Sector (DRMFSS)
Tuesday, September 30, 2014
Region S.N.N.P
Zone SOUTH OMO
Wereda HAMER
Selected Indicator
Capacity: Community Preparedness against Increase in Disaster Intensity
KebeleName
Precaution_1
Comment_1
Precaution_2
Comment_2
Precaution_3
Comment_3
GEDBAK
ASELE
sending elders to
wereda
administration
office to get fast
response
Send application
to wereda
administration
office to settle the
arising conflict
Stresses given by
wereda
administration
office if elders
apply about the
magnitude of
disaster face to
face
If the magnitude
and duration of
conflict increases,
our livestock will be
affected due to
shortage of pasture
and water
Therefore seeking
solution with
counsellor of
government is the
only remedy to for
sustainable stability
of the community
Purchasing drugs at
pharmacy or
elsewhere
regardless of costs
We have got good
responses for some
disease in buying
drugs and treating by
ourselves
200
Page 7 of 8

Wereda Disaster
Risk Profile
Data_Collected_Date
September 2010
Disaster Risk Management and Food
Security Sector (DRMFSS)
Tuesday, September 30, 2014
Region S.N.N.P
Zone SOUTH OMO
Wereda HAMER
Selected Indicator
Capacity: Community Preparedness against Increase in Disaster Intensity
KebeleName
Precaution_1
Comment_1
Precaution_2
Comment_2
Precaution_3
Comment_3
WENBAYNO
For livestock
disease hazards
the only option is
taking livestock to
government vet
services and for
human diseases to
health centres as
well, but for food
and livestock feed
shortage, we
exchange grain for
shoats and sell
shoats for grain
purchased
The adaptive
measures for
livestock and human
diseases were the
experiences of
elder’s young hood,
but now the only
option for these
disasters is taking to
go health services
for every year crop
familiarity
purchasing has been
the only alternative
measure for the PA
community to
mitigate hunger
For livestock feed
shortage trekking to
grass and water
available areas is
the usual character
of the community
201
Page 8 of 8

Wereda Disaster
Risk Profile
Disaster Risk Management and Food
Security Sector (DRMFSS)
Data_Collected_Date
September 2010
Tuesday, September 30, 2014
Region S.N.N.P
Zone
SOUTH OMO
Wereda HAMER
Selected Indicator
Capacity: Community Preparedness against Disasters
Kebele Name
Precaution 1
Comment 1
Precaution 2
Comment 2
Precaution 3
Comment 3
HEDBAK
SHANKO
Store food grain
which collected at
good seasons until
the beginning of
the next wet
season.
There are no
precautions to
prevent the effect
but when the new
disease of livestock
can be occurring.
We were spending
food grain at good
harvest season by
selling and giving for
poor, but now the
harvest is becoming
small, even
insufficient for one
crop season .therefore
to reduce hunger
hazards majority of
the community start
saving from small
harvest for severe
hunger seasons.
The good experience
to take their livestock
for vaccination during
disease time .it is the
wise harder that
regulating the
community.
Vaccination for
livestock
annually to
prevent them
from fatal
disease as
anthrax, CBPP
etc…
202
Page 1 of 9

Wereda Disaster
Risk Profile
Disaster Risk Management and Food
Security Sector (DRMFSS)
Data_Collected_Date
September 2010
Tuesday, September 30, 2014
Region S.N.N.P
Zone
SOUTH OMO
Wereda HAMER
Selected Indicator
Capacity: Community Preparedness against Disasters
Kebele Name
DEGA KEJA
Precaution 1
For livestock feed
and water shortage
problems and food
shortages, we find
grazing areas and
food grain sources.
Comment 1
When the coming
months are expected
to be dry we already
find grazing and
watering points to
save our main stay.
Recently the majority
of the community have
started finding food
grain available areas
by affordable prices to
reduce livestock loss.
Precaution 2
For livestock
disease out
breaks, we bring
livestock for
vaccination
before driving to
dry season
grazing areas
especially for
anthrax and
CBPP.
Comment 2
Now we are
informed on the
importance of
vaccines and
have got great
changes on the
development
these diseases.
Precaution 3
Comment 3
SHANKO 2
Find food grain
available areas at
good price.
During peak dry and
food shortage seasons
finding food grain at
fair price is difficult.
Therefore, at current
condition, finding food
grain sources before
hunger seasons come
have become usual
and profiting.
Find livestock
feed and water
sources.
203
Page 2 of 9
Wereda Disaster
Risk Profile
Disaster Risk Management and Food
Security Sector (DRMFSS)
Data_Collected_Date
September 2010
Tuesday, September 30, 2014
Region S.N.N.P
Zone
SOUTH OMO
Wereda HAMER
Selected Indicator
Capacity: Community Preparedness against Disasters
Kebele Name
BESSA MEJAN
Precaution 1
No one has taken
preventive
measures except
roaming for
livestock feed and
water as usual
activities.
Comment 1
Still we have no
experience on
preventive measures
of hunger except
selling of livestock for
grain when bad
seasons come.
Precaution 2
We keep/herd
livestock
splitting at
different grazing
areas to save
from rival ethnic
looters.
Comment 2
to reduce
livestock by
rustlers, we split
herds at
different grazing
areas and
frequently
change grazing
areas to conceal
from rival ethnic
looters
(Dasenech and
gnangatom)
Precaution 3
Comment 3
204
Page 3 of 9

Wereda Disaster
Risk Profile
Disaster Risk Management and Food
Security Sector (DRMFSS)
Data_Collected_Date
September 2010
Tuesday, September 30, 2014
Region S.N.N.P
Zone
SOUTH OMO
Wereda HAMER
Selected Indicator
Capacity: Community Preparedness against Disasters
Kebele Name
MINOGELTI
Precaution 1
No measures have
taken for negative
effects of hunger
(precaution), but
for conflict routine
scout of boarders
made and warn all
the PA community
when there is sign
of conflict.
Comment 1
it is day to day activity
to save the lives of the
community and loss of
livestock by raiders ,so
that routine scouting
boarders is crucial to
prevent and control
from risk of conflict
disaster ,but for
hunger there is no any
precaution except
purchasing crops when
food shortage occur in
the house hold.
Precaution 2
For livestock
disease diseases,
we purchase
drugs regardless
of prices and its
quality.
Comment 2
Livestock is the
only main stay of
the community
without any
alternative,
therefore great
attention is
given for
livestock health.
Precaution 3
Comment 3
SHESHA GOYKE
Frequent scouting
out of boarder to
prevent rival
ethnic infiltration.
It is the only measure
to protect livestock
from raiders and loss
of life .early
identification of
looters movement also
reduce level of
conflict.
Finding grazing
and watering
points.
During prolonged
drought finding
grazing and
watering points
is the primary
issue to save loss
of livestock.
restrict movement
to disease source
areas (livestock
disease source
areas)
To reduce
livestock disease
distribution,
restriction to
grazing and
watering points is
the only option.
205
Page 4 of 9

Wereda Disaster
Risk Profile
Disaster Risk Management and Food
Security Sector (DRMFSS)
Data_Collected_Date
September 2010
Tuesday, September 30, 2014
Region S.N.N.P
Zone
SOUTH OMO
Wereda HAMER
Selected Indicator
Capacity: Community Preparedness against Disasters
Kebele Name
QUARO
Precaution 1
regular follow up
of cultural early
indicators to
escape before
onset of flooding
Comment 1
Cultural early
indicators have
becoming promising to
save the life of the
community, crop and
livestock damage.
Precaution 2
Follow early
warning
information
from
government and
NGOs and
evacuate
livestock and
community
before flooding
on set.
Comment 2
Precaution 3
Comment 3
KOLA KEJA
Practice crop
farming however
crop productivity
about every year
due to drought.
Due to crop price rises
from time to time
(goat -grain exchange
rise) and depletion of
livestock resources
and produce owing to
administrating of
pasture land due to
rain shortage.
Selling of
livestock for
grain purchase
waiting good
market seasons
and saving
money for bad
times.
Grain-goat
(grain-money)
purchasing is
becoming hard
or expensive
during dry
seasons and
affecting PA
resources by
external traders.
At this time
great change by
this activity.
searching good
market points for
livestock sell and
grain purchase
Some livestock
owners have
becoming livestock
market oriented
and getting
common price
offer for their
produce and also
their need from
market. This
activity is
promising.
206
Page 5 of 9

Wereda Disaster
Risk Profile
Disaster Risk Management and Food
Security Sector (DRMFSS)
Data_Collected_Date
September 2010
Tuesday, September 30, 2014
Region S.N.N.P
Zone
SOUTH OMO
Wereda HAMER
Selected Indicator
Capacity: Community Preparedness against Disasters
Kebele Name
ERBORE
Precaution 1
early identification
of early warning
indicators
(cultural) and
announce for the
community if there
is threat of
flooding
Comment 1
We have better early
warning indicators and
we have got good
response.
Precaution 2
shifting of
livestock to safe
grazing points
before flooding
Comment 2
Precaution 3
forward
application for
woreda
administration
office to get fuel
support for
motorized boat
Comment 3
we have saved
household utensils
from damage since
we get support
from government
(boat and fuel
support)
LALA
we didnt take any
precaution for
hunger but for
livestock disease,
we purchased
drugs against ccpp
and we have sent
livestock for
vaccination of
anthrax before
driving to disease
source areas(dry
season grazing
areas)
for several years back
we have not had any
precaution for hunger
but we have been
offered livestock for
vaccination to protect
them from death of
anthrax at disease
source areas(dry
season areas)
207
Page 6 of 9

Wereda Disaster
Risk Profile
Disaster Risk Management and Food
Security Sector (DRMFSS)
Data_Collected_Date
September 2010
Tuesday, September 30, 2014
Region S.N.N.P
Zone
SOUTH OMO
Wereda HAMER
Selected Indicator
Capacity: Community Preparedness against Disasters
Kebele Name
ERIYA
Precaution 1
we dont have any
precaution for
hunger, but for
livestock feed and
water shortages,
we already find
grazing and
watering points
when the coming
seasons are
prolonged dry
Comment 1
Hunger is beyond the
capacity of community
b/c of affecting all
community members
regardless of having
livestock resources.
Therefore we didnt
have any precaution
measures for food
shortage in the
previous hazards and
we will not have for
future as well.
Precaution 2
Comment 2
Precaution 3
Comment 3
208
Page 7 of 9

Wereda Disaster
Risk Profile
Disaster Risk Management and Food
Security Sector (DRMFSS)
Data_Collected_Date
September 2010
Tuesday, September 30, 2014
Region S.N.N.P
Zone
SOUTH OMO
Wereda HAMER
Selected Indicator
Capacity: Community Preparedness against Disasters
Kebele Name
MRSHA
Precaution 1
tending livestock
splitting at
different grazing
and water points to
protect our
resource from
looting ,death due
to drought and
disease
Comment 1
We have crop harvest
owing to erratic rain
fall every year .so our
harvest is only
livestock.
Precaution 2
Saving relief
grain giving
priority for
children.
Comment 2
Virtually in all
seasons (years of
the harvest)
there is crop
failures, we are
depend on relief
grain (on support
of the
government) as
though we are
selling several
shoats to meet
family food
need.
Precaution 3
Comment 3
GEDBAK
storing food grain
which harvested at
good seasons for
hunger seasons
At current condition
all community
members informed on
storing food grain at
good harvest seasons
to prevent households
from hunger.
Finding food
grain source
areas when
there is less
harvest.
Before hunger
seasons appear,
we find food
grain sources to
purchase before
crop prices rise.
209
Page 8 of 9

Wereda Disaster
Risk Profile
Disaster Risk Management and Food
Security Sector (DRMFSS)
Data_Collected_Date
September 2010
Tuesday, September 30, 2014
Region S.N.N.P
Zone
SOUTH OMO
Wereda HAMER
Selected Indicator
Capacity: Community Preparedness against Disasters
Kebele Name
ASELE
Precaution 1
We find grazing
and watering
points at distant
areas if the coming
seasons are dry and
unsuitable for
livestock.
Comment 1
This is the only
measure for our
community to save the
main stay of the
community (livestock).
There is no important
of shortages of feed
and water for
livestock.
Precaution 2
Comment 2
Precaution 3
Comment 3
WENBAYNO
There were no
precautions taken
by households to
prevent from
negative impacts
of drought.
all disaster negative
impacts which has
happened in the PA
were and will be
beyond the capacity of
the communitywide
(rain shortage and its
consequences)
210
Page 9 of 9

Wereda Disaster
Risk Profile
Data_Collected_Date
September 2010
Region S.N.N.P
Selected Indicator
Kebele Name
Type of Disaster(s)
Zone
SOUTH OMO
Hazard: Coping and recovering during last Disaster
HEDBAK
Hunger was the usual disaster affecting the community.
Disaster Risk Management and Food
Security Sector (DRMFSS)
Tuesday, September 30, 2014
Wereda HAMER
Coping_Strategy
Use of wild fruits and leaves, borrowing food grain from relatives (vicinity PA), selling shoats for grain.
Description
Recovery_Strategy
Recovery is easy for this community when good seasons come. They sow usual crops and recover easily, but they
return to shock when the next season becomes dry.
Crop farming at good seasons.
Description
The recover farming usual crops.
Community
Participation_Ways
Description
The well-being give loan for penniless without interest.
during hunger seasons, the well-being share purchased crops for their relatives and/or give loan without interest, the
penniless who don’t have relative in the same PA also find /beg food grain from the other area relatives.
211
Page 1 of 16

Wereda Disaster
Risk Profile
Disaster Risk Management and Food
Security Sector (DRMFSS)
Data_Collected_Date
September 2010
Tuesday, September 30, 2014
Region S.N.N.P
Selected Indicator
Kebele Name
Type of Disaster(s)
Zone
SOUTH OMO
Hazard: Coping and recovering during last Disaster
SHANKO
Hunger, livestock feed and water shortage, livestock production decrease.
Wereda HAMER
Coping_Strategy
Selling of their livestock for crop food purchases, use of well fruits and leaves in forest, decreasing feeding system.
Description
Recovery_Strategy
The government and NGO they relief the harder selling shoats for crop food, the outbreak of vaccination for livestock
disease and human being, to treatment of seek livestock.
Food supply from government and NGO for hunger and vaccination and treatment of disease.
Description
Community
Participation_Ways
Description
To continuous the relief has been for all the community well enough rain fall can become and the enough pasture for
their livestock.
Commonly they borrow and lend one for each other during hunger the goats or sheep.
During drought time (after the incidence of death of livestock one can borrow or loan for other with a cultural, that it
well be returned during good seasons or after the good pasture and water satisfied.
212
Page 2 of 16

Wereda Disaster
Risk Profile
Disaster Risk Management and Food
Security Sector (DRMFSS)
Data_Collected_Date
September 2010
Tuesday, September 30, 2014
Region S.N.N.P
Selected Indicator
Kebele Name
Type of Disaster(s)
Zone
SOUTH OMO
Hazard: Coping and recovering during last Disaster
DEGA KEJA
Food grain shortage, livestock feed and water shortage and livestock disease
Wereda HAMER
Coping_Strategy
Description
Selling of shoats to overcome hunger, begging food grain from relatives (wealthy) and neighbouring, taking livestock
other areas.
They sell shoats for food grain and sharing with poor relatives
Recovery_Strategy
Crop sowing at good season, keeping livestock.
Description
Community
Participation_Ways
Description
Sowing usual crops and keeping livestock were recovery strategies for wealthy and borrowing shoats from herds were
for whom lost their shoats by diseases.
During the incident the rich share food grain
During the incidence the wealthy and PSNP beneficiaries share their purchased and transfer to poor and
non-beneficiaries
213
Page 3 of 16

Wereda Disaster
Risk Profile
Data_Collected_Date
September 2010
Region S.N.N.P
Selected Indicator
Kebele Name
Type of Disaster(s)
Zone
SOUTH OMO
Hazard: Coping and recovering during last Disaster
SHANKO 2
drought(food crop, livestock feed and water shortage)
Disaster Risk Management and Food
Security Sector (DRMFSS)
Tuesday, September 30, 2014
Wereda HAMER
Coping_Strategy
Use of wild fruits and leaves, food supply from the government selling shoats for grain.
Description
Recovery_Strategy
The wealthy were selling extra surplus livestock produce to purchase grain, crop farming (increasing farm size to
reduce loss recovery efforts were promising and easy for pastoral community after rain.
crop farming when wet seasons come, keeping livestock caring for their health
Description
Crop farming increasing farm size at good seasons and keeping grain (store grain) for bad seasons.
Community
Participation_Ways
Description
214
Page 4 of 16
Wereda Disaster
Risk Profile
Data_Collected_Date
September 2010
Region S.N.N.P
Selected Indicator
Kebele Name
Type of Disaster(s)
Zone
SOUTH OMO
Hazard: Coping and recovering during last Disaster
BESSA MEJAN
Hunger, livestock feed and water shortage.
Disaster Risk Management and Food
Security Sector (DRMFSS)
Tuesday, September 30, 2014
Wereda HAMER
Coping_Strategy
Selling livestock for grain for hunger, trekking livestock to distant grazing points.
Description
During hunger time, they exchange goats for grain or sell and purchase grain. They also encroach the park for grazing
Recovery_Strategy
For 10 years there is no recovery from food and feed shortage.
Description
Community
Participation_Ways
Description
For the last 10 years there is no harvest and selling goats for grain is usual for this community except for 6 relief
months. We have got relief food for 6 months.
During hunger season the wealthy share purchased crops for poor.
It is usual for this community sharing food grain which is obtained either from relief or from purchase.
215
Page 5 of 16

Wereda Disaster
Risk Profile
Data_Collected_Date
September 2010
Region S.N.N.P
Selected Indicator
Kebele Name
Type of Disaster(s)
Zone
SOUTH OMO
Hazard: Coping and recovering during last Disaster
MINOGELTI
Unspecific sheep disease that introduced from Kenya and CCPP.
Disaster Risk Management and Food
Security Sector (DRMFSS)
Tuesday, September 30, 2014
Wereda HAMER
Coping_Strategy
Frequent changing of watering and grazing point, split flock to different grazing points.
Description
reduce selling of shoats for grain to replace losses by disease .(reducing food grain purchase)
Recovery_Strategy
The one who become poor by the effects of disease beg or take loan from well-being.
Description
The affected ones borrow shoats without interest from better-off relatives or friends
Community
Participation_Ways
Description
during the incident they exchange information about the distribution of disease
During incident, the elders restrict movement to outbreak areas
216
Page 6 of 16

Wereda Disaster
Risk Profile
Disaster Risk Management and Food
Security Sector (DRMFSS)
Data_Collected_Date
September 2010
Tuesday, September 30, 2014
Region S.N.N.P
Selected Indicator
Kebele Name
Type of Disaster(s)
Zone
SOUTH OMO
Hazard: Coping and recovering during last Disaster
SHESHA GOYKE
Food shortage, livestock feed and water shortage and newly introduced sheep disease.
Wereda HAMER
Coping_Strategy
Helping each other.
Description
Recovery_Strategy
The better off share purchase crops for poor relatives, they give (borrow) shoats for exchange for grain or sell for
grain purchase.
PSNP beneficiaries recover during PSNP implementation months and the others taking loan from well-being.
Description
Community
Participation_Ways
Description
PSNP beneficiaries replace sold goats during the implementation of PSNP programme where as the others whom are
not inclusive in PSNP take shoats loan from the wealthy which will be returned after they recover without interest.
During the incident of hunger the wealthy support the poor.
The wealthy share purchased crops for poor, borrow goats for crop exchange that will be returned in good times or
after recovery.
217
Page 7 of 16

Wereda Disaster
Risk Profile
Data_Collected_Date
September 2010
Region S.N.N.P
Selected Indicator
Kebele Name
Type of Disaster(s)
Zone
SOUTH OMO
Hazard: Coping and recovering during last Disaster
QUARO
flooding
Disaster Risk Management and Food
Security Sector (DRMFSS)
Tuesday, September 30, 2014
Wereda HAMER
Coping_Strategy
Shifting to temporary settlement areas in the same PA, shifting the livestock grazing points.
Description
Recovery_Strategy
During flooding the flooding PA residents leave their village and wait at temporary settlement area in the same
kebele, they shift their livestock to flood free areas.
Re-sowing to replace damaged crops, return to settlement areas and lead usual life.
Description
Community
Participation_Ways
Description
Erbore communities inclusive of this community farm in river recession agriculture therefore they harvest crop
whenever flooding ends.
During flooding the young and adults give priority for elders, children and women to evacuate first.
The young and adults evacuate women, elders and children using local boats regardless of blood linkages or relatives.
218
Page 8 of 16

Wereda Disaster
Risk Profile
Data_Collected_Date
September 2010
Region S.N.N.P
Selected Indicator
Kebele Name
Type of Disaster(s)
Zone
SOUTH OMO
Hazard: Coping and recovering during last Disaster
KOLA KEJA
drought(livestock feed shortage and hunger)
Disaster Risk Management and Food
Security Sector (DRMFSS)
Tuesday, September 30, 2014
Wereda HAMER
Coping_Strategy
Too distant grazing areas mobility for search of pasture land, split herds, sell of livestock for grain purchase.
Description
Recovery_Strategy
they maintain remaining livestock for breeding and replace the last by selling drought resistant animals when good
conditions come(they sell goats to replace cattle)
During heavy loss, the poor beg from well off however there are losses of livestock for well off.
Description
Community
Participation_Ways
Description
The affected ones borrow goats from well-to-do that remain some from many and he pay after his goats become
several. Some also take goats from well of marrying their daughters.
During the incident the better off slaughter livestock for poor to cope hunger, give goats or cattle when some bodies
livestock perished.
when there is prolonged ,the better off slaughter cattle or goat for poor to mitigate hunger, the better off also share
or give as loan the remaining livestock for his relatives after incident for recovery, the well-off also give livestock for
poor who have daughters for marriages.
219
Page 9 of 16

Wereda Disaster
Risk Profile
Data_Collected_Date
September 2010
Region S.N.N.P
Selected Indicator
Kebele Name
Type of Disaster(s)
Zone
SOUTH OMO
Hazard: Coping and recovering during last Disaster
ERBORE
flooding
Coping_Strategy
Shifting to temporary settlement.
Disaster Risk Management and Food
Security Sector (DRMFSS)
Tuesday, September 30, 2014
Wereda HAMER
Description
during flooding kuyle village communities shift to temporary settlement in the same PA
Recovery_Strategy
Return to their residences and lead their usual life, crop farming after flood retreated.
Description
Community
Participation_Ways
Description
They return to their usual residence after the flood resided and lead their usual life, when the flood damage crop
(harvest or seedling) they re-sow when it retreat.
During the incident the swimmers help elders and women to cross the flooded area.
During flooding the swimmer support elders and women to cross the flooded area.
220
Page 10 of 16

Wereda Disaster
Risk Profile
Disaster Risk Management and Food
Security Sector (DRMFSS)
Data_Collected_Date
September 2010
Tuesday, September 30, 2014
Region S.N.N.P
Selected Indicator
Kebele Name
Type of Disaster(s)
Zone
SOUTH OMO
Wereda HAMER
Hazard: Coping and recovering during last Disaster
LALA
Hunger and livestock diseases (anthrax, ccpp, and unspecific sheep disease still affecting several sheep of each
herder).
Coping_Strategy
Selling shoats for food grain to mitigate food shortage, the poor beg the wealthy for grain and shoats to be changed
or sold for grain.
Description
Recovery after wet seasons is easy for herders, but it is difficult for poor unless the wet season is sufficient for crop
farming.
Recovery_Strategy
Description
Community
Participation_Ways
Crop farming at wet season, breeding the remaining livestock, taking loan (borrow) shoats for breeding from
relatives.
The well-being rear livestock and use livestock produce after wet season and farm crops. Those who become poor
due to effects of livestock disease have also take shoat loan from herder relatives to be returned after breeding
without interest.
During the incidence of hunger the rich share purchased food grain for poor, they give also shoat’s loan for poor for
grain and for breeding.
Description
221
Page 11 of 16

Wereda Disaster
Risk Profile
Data_Collected_Date
September 2010
Region S.N.N.P
Selected Indicator
Kebele Name
Type of Disaster(s)
Zone
SOUTH OMO
Hazard: Coping and recovering during last Disaster
ERIYA
Recurrent drought is regular disaster of this community.
Disaster Risk Management and Food
Security Sector (DRMFSS)
Tuesday, September 30, 2014
Wereda HAMER
Coping_Strategy
Description
Recovery_Strategy
selling of shoats for grain, using wild fruits and leaves, borrowing shoats for sell to purchase grain, relief support from
govt.
During hunger seasons the livestock owners sell shoats to purchase grain, they also use wild fruits and leaves to save
life
rearing the remaining livestock ,farming crop at good season, taking shoat loan from wealthy
Description
Community
Participation_Ways
Description
Breeding the remaining livestock for livestock owners, taking or borrowing shoats for breeding without interest was
for those who become poor due to effects of drought.
during the incidence sharing purchased and relief grain ,after the incident taking or giving livestock loan without
interest
During the incidence the wealthy share purchased grain for poor relatives or neighbours of the same ethnic or clan
.after the incident the wealthy give or borrow shoats or cattle for poor relatives for breeding without interest as to
be returned after breeding.
222
Page 12 of 16

Wereda Disaster
Risk Profile
Disaster Risk Management and Food
Security Sector (DRMFSS)
Data_Collected_Date
September 2010
Tuesday, September 30, 2014
Region S.N.N.P
Selected Indicator
Kebele Name
Type of Disaster(s)
Zone
SOUTH OMO
Hazard: Coping and recovering during last Disaster
MRSHA
Hunger, livestock feed and water shortage, livestock death (drought).
Wereda HAMER
Coping_Strategy
Taking livestock to distant areas for grazing, sell of livestock for grain, utilizing wild fruits, splitting herds
Description
Recovery_Strategy
the better off maintain the remaining livestock at distant grazing areas till recovery time (good grazing seasons
come),
the one who become poor beg livestock from the better off, getting relief from govt.
Description
Community
Participation_Ways
Description
the one who become poor owing to drought beg shoats and /or cattle from the better off who have save his resource
trekking too distant areas.
During incident the well-off purchased and/or exchange goat for grain for poor, slaughter cattle or shoats for poor.
During hunger seasons, the well-being share purchased crops for poor and give livestock loan for those who become
destitute on the bad effects of drought.
223
Page 13 of 16

Wereda Disaster
Risk Profile
Data_Collected_Date
September 2010
Region S.N.N.P
Selected Indicator
Kebele Name
Type of Disaster(s)
Zone
SOUTH OMO
Hazard: Coping and recovering during last Disaster
GEDBAK
Food grain shortage was the disaster of this community.
Disaster Risk Management and Food
Security Sector (DRMFSS)
Tuesday, September 30, 2014
Wereda HAMER
Coping_Strategy
Description
Recovery_Strategy
Use of wild fruits and leaves, borrowing food grain from relatives (vicinity PA), selling shoats for grain, begging food
grain from relatives.
During the incident the well-being utilize stored food grain and sell shoats for food grain, the penniless borrow food
grain from rich relatives.
sowing crop at good wet season ,relief support from the government (food grain)
Description
Community
Participation_Ways
Description
they recover from hunger by sowing and harvesting crop at wet seasons, they get also food aid from the government
and until the next wet season, the poor recover getting seeds from well-being relatives and govt.
During the incident, the well-being we have stored food grain for bad seasons borrow for poor without interest, the
well-off give food grain for poor relatives.
During the incidence the penniless get support from government and rich relatives until the next harvest season,
after the incident they recover sowing and harvesting food grain.
224
Page 14 of 16

Wereda Disaster
Risk Profile
Disaster Risk Management and Food
Security Sector (DRMFSS)
Data_Collected_Date
September 2010
Tuesday, September 30, 2014
Region S.N.N.P
Selected Indicator
Kebele Name
Type of Disaster(s)
Zone
SOUTH OMO
Hazard: Coping and recovering during last Disaster
ASELE
Recurrent drought and livestock diseases, also food grain and livestock feed shortage
Wereda HAMER
Coping_Strategy
Description
Recovery_Strategy
Selling of shoats for grain, using wild fruits and leaves, borrowing shoats for sell to purchase grain, relief support
from government, begging food grain from relatives.
They sell shoats to purchase grains, they trek livestock to pasture water areas regardless of conflict threat. The poor
beg food grain from their relatives or neighbours until they get food aid from the government
Keeping livestock as usual.
Description
Selling shoats to purchase grains
Community
Participation_Ways
Description
During the incidence the well-being give food grain for penniless without any payment or interest. The poor also take
loan of livestock to rear without interest.
During hunger seasons the rich give purchased food grain for poor relatives without loan or interest. They also give
livestock loan to be returned after breeding without interest. At current condition recovery has become difficult.
225
Page 15 of 16

Wereda Disaster
Risk Profile
Data_Collected_Date
September 2010
Region S.N.N.P
Selected Indicator
Kebele Name
Type of Disaster(s)
Zone
SOUTH OMO
Hazard: Coping and recovering during last Disaster
WENBAYNO
drought (hunger, livestock feed and water shortage)
Disaster Risk Management and Food
Security Sector (DRMFSS)
Tuesday, September 30, 2014
Wereda HAMER
Coping_Strategy
Description
Recovery_Strategy
The well off sell livestock to purchase crops, the poor beg purchased crops; the poor beg purchased crops from better
off.
During hunger seasons the well-off sell livestock to purchase crops and drive their livestock too distant areas to save
their resource, the poor beg crops from their well off relatives.
The wealthy recover by rearing the remaining of livestock but it is difficult or no recovery option for poor.
Description
Community
Participation_Ways
Description
By splitting their herds, the better-off save the loss of more livestock and rear the remaining. But the poor have no
the option of recovery except getting some yield of crops when good rain seasons come or getting loan from wealthy.
The wealthy give livestock loan for poor, when the hunger become prolonged they slaughter for poor.
The one who have a number of livestock give livestock loan for poor or lower economic class to use the given loan for
crop exchange or for sale. The well off also share purchased crops for poor without payment.
226
Page 16 of 16

Data_Collected_Date
Region S.N.N.P
September 2010
Zone SOUTH OMO
Selected Indicator
Capacity: Type Community Participation
Kebele Name
Levels_Comm_Participation
HEDBAK
There was good cooperation among the
community before 10 to 15 years but
deteriorating very rapidly.
DEGA KEJA
The level of cooperation has become
decreasing from time to time as increasing
population and eroding of culture.
SHANKO
BESSA MEJAN
The level of cooperation among the
community is not reduced in the PA. It is
maintained as before.
The level of cooperation among the
community and household is decreasing when
compared to the father’s adult hood era.
MINOGELTI
SHESHA GOYKE
QUARO
KOLA KEJA
There is good cooperation during any type of
hazards.
There is strong cooperation among the
community since the young hood of elders to
this generation.
All PA community have strong linkage and
cooperation during any type of disasters
regardless of blood linkage or relationships.
In the era of elders the population were
cooperating in good and bad times and have
strong relation. The well of slaughter cattle or
shoats for poor in times hunger, they purchase
crops or exchange crops for shoats for poor.
Tuesday, September 30, 2014
Wereda HAMER
Changes_In_Last_Decade
There is high change on the level of
cooperation among the PA community
.at current condition it can be said
three is no cooperation.
There is greater change particularly
cooperation during hunger seasons.
But there is no change of cooperation
during conflict among and /or rival
ethnic groups.
No change at all.
Increased disasters specially hunger
disaster exhaust community resources
and recurrent drought as well as the
main cause of co-operation
deterioration among the community
and households.
No significant change yet.
No change on the level of
cooperation.
There is no any change on the level
of cooperation among the
community.
227
Page 1 of 2
Data_Collected_Date
September 2010
Region S.N.N.P
Zone SOUTH OMO
Selected Indicator
Capacity: Type Community Participation
Kebele Name
ERBORE
Levels_Comm_Participation
There is high level of cooperation among the
community.
LALA
There is no significant change on the level of
cooperation during hunger and other
disasters.
ERIYA
The level of cooperation is eroding due to
recurrent attack of food shortage.
MRSHA
GEDBAK
The level of cooperation among the PA
communities and vicinity. The same groups
are reducing from year to year.
ASELE
There is high level of cooperation during
conflict with rival group ethnic groups, but
the level of cooperation during hunger season
is reducing at certain level.
228
Tuesday, September 30, 2014
Wereda HAMER
Changes_In_Last_Decade
There is no as such significant change
on the level of cooperation on the
last decades.
The only change is the amount of
resource transfer i.e. if someone who
is poor request food grain or livestock
support during hunger, the wealthy
give less amount owing to reduced
resources for wealthy as well.
There is great change of cooperation
of local communities due to
exhaustion of well-being in
supporting the penniless who are not
included in PSNP in every day and
food shortage seasons. At the young
hood stage of elders the level of
cooperation had been strong during
food shortage seasons.
There is very great change on the
level of cooperation among PA and
other neighbouring communities. The
root cause for this cultural
deterioration is exhaustion by
shortage of food and recurrent
support for penniless by having.
there is no change on the level of
cooperation to overcome conflict
problems with rival ethnic groups
,but cooperation during hunger
seasons is reducing owing to
exhaustion of well off resources by
recurrent drought effects.
Page 2 of 2
Data_Collected_Date
September 2010
Tuesday, September 30, 2014
Region S.N.N.P
Selected Indicator
Zone
SOUTH OMO
Wereda HAMER
Capacity: Recovery from Losses from Disasters - Percentage of Households who
have managed to recover from losses of disasters
Percentage of households who have managed to recover from losses of disasters
Comments
20.20 %
229
Page 1 of 1
Data_Collected_Date
Region S.N.N.P
September 2010
Zone
SOUTH OMO
Tuesday, September 30, 2014
Wereda HAMER
Selected Indicator
Type of Disaster
Capacity: Recovery from Losses from Disasters - Percentage of households
recovered from past disasters by type of Disasters
Recovered Percentage
Droughts
Floods
Crop diseases
Livestock diseases
Human diseases
Heat waves/ High temp
Conflicts
Economic / Price shock
29.10
2.40
14.70
27.70
21.60
0.27
3.47
0.53
230
Page 1 of 1

Data_Collected_Date
September 2010
Tuesday, September 30, 2014
Region S.N.N.P
Zone SOUTH OMO
Wereda HAMER
Selected Indictor:
Capacity: Recovery from Losses from Disasters - Proportion of households
recovered by type of Losses
Type of Loss
Physical damages on houses and property
Percentage
1.61
Crop damage
27.10
Livestock damage
40.20
Death of household members
0.27
Illness/health problems
23.90
Loss of access to social services, including school
0.80
Loss of income
0.54
Loss of savings
1.07
Livestock were stolen
0.54
Lost access to grazing land
1.34
Lost access to water source
0.54
Had to flee/change residence area
0.54
Other losses/damages
1.61
231
Page 1 of 1

Data_Collected_Date
Region S.N.N.P
September 2010
Zone SOUTH OMO
Tuesday, September 30, 2014
Wereda HAMER
Selected Indicator
Capacity: Coping Options if More Resources Available - What coping strategy
could be adopted if more resource were available?
Coping Strategy To Be Adopted
Response (%)
Other losses/damages
12.20
Storage of food and other necessities
85.70
Physical protection of buildings and property
1.94
232
Page 1 of 1
Data_Collected_Date
September 2010
Tuesday, September 30, 2014
Region S.N.N.P
Zone SOUTH OMO
Wereda HAMER
Selected Indictor:
Capacity: Coping Strategies Adopted by Households - Percentage of households by
major type of coping strategies adopted (at least once)
Coping Strategy Adopted
Main Strategy
Secondary Strategy
Reduced expenditure on non-essential items (beer, cigarettes,
clothes, meat, etc.)
Consumption rather than sale of crop surplus
0.95
0.00
10.80
5.35
Sell more livestock than usual
23.00
8.72
Borrowing of food or cash (including purchasing food on credit)
5.39
8.39
Sale of non-productive assets (Jewelry, clothing, etc.)
0.30
0.16
Sending children of household for work
0.12
0.08
Short-term / seasonal labor migration
0.30
0.82
Long-term / permanent migration (including distress migration of
whole families)
Increased working hours
2.37
8.80
0.30
0.74
Seek alternative or additional jobs
0.83
2.63
Collection of wild food
25.50
14.10
Rely on less preferred and less expensive food
7.65
1.15
Rely on less preferred and less expensive food
1.13
5.43
Limit portion size at meals
1.84
3.54
Restrict consumption by adults in order for small children to eat
0.53
3.87
233
Page 1 of 2

Data_Collected_Date
September 2010
Tuesday, September 30, 2014
Region S.N.N.P
Zone SOUTH OMO
Wereda HAMER
Selected Indictor:
Capacity: Coping Strategies Adopted by Households - Percentage of households by
major type of coping strategies adopted (at least once)
Coping Strategy Adopted
Main Strategy
Secondary Strategy
Begging for money or for food
0.41
0.90
Reduce number of meals eaten in a day
13.90
29.50
Skip entire day without eating
0.30
2.14
234
Page 2 of 2

Wereda Disaster
Risk Profile
Data_Collected_Date
September 2010
Region S.N.N.P
Zone
SOUTH OMO
Disaster Risk Management and Food
Security Sector (DRMFSS)
Tuesday, September 30, 2014
Wereda HAMER
Selected Indicator
Capacity: Coping Strategies Adopted by Households - Main coping strategies adopted by households for respective
disasters
Coping Strtegies Adopted
Types of disaters for which HHs in the community adopt the listed
Coping Strtegies
Begging for money or for
food
Borrowing of food or cash
(including purchasing food
on credit)
Collection of wild food
235
Page 1 of 6

Wereda Disaster
Risk Profile
Data_Collected_Date
September 2010
Region S.N.N.P
Zone
SOUTH OMO
Disaster Risk Management and Food
Security Sector (DRMFSS)
Tuesday, September 30, 2014
Wereda HAMER
Selected Indicator
Capacity: Coping Strategies Adopted by Households - Main coping strategies adopted by households for respective
disasters
Coping Strtegies Adopted
Types of disaters for which HHs in the community adopt the listed
Coping Strtegies
Consumption rather than
sale of crop surplus
Increased working hours
Limit portion size at meals
236
Page 2 of 6

Wereda Disaster
Risk Profile
Data_Collected_Date
September 2010
Region S.N.N.P
Zone
SOUTH OMO
Disaster Risk Management and Food
Security Sector (DRMFSS)
Tuesday, September 30, 2014
Wereda HAMER
Selected Indicator
Capacity: Coping Strategies Adopted by Households - Main coping strategies adopted by households for respective
disasters
Coping Strtegies Adopted
Types of disaters for which HHs in the community adopt the listed
Coping Strtegies
Long-term / permanent
migration (including
distress migration)
Reduce number of meals
eaten in a day
Reduced expenditure on
non-essential items (beer,
cigarettes, etc)
237
Page 3 of 6
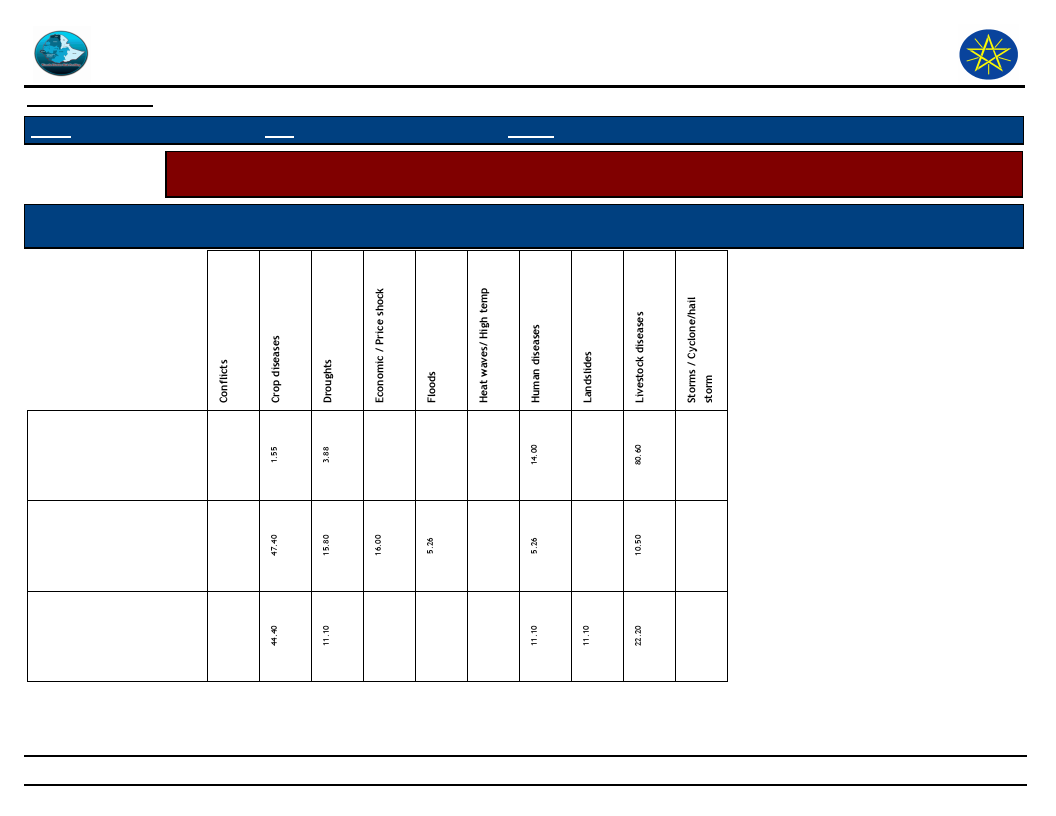
Wereda Disaster
Risk Profile
Data_Collected_Date
September 2010
Region S.N.N.P
Zone
SOUTH OMO
Disaster Risk Management and Food
Security Sector (DRMFSS)
Tuesday, September 30, 2014
Wereda HAMER
Selected Indicator
Capacity: Coping Strategies Adopted by Households - Main coping strategies adopted by households for respective
disasters
Coping Strtegies Adopted
Types of disaters for which HHs in the community adopt the listed
Coping Strtegies
Reduced expenditure on
productive inputs
(fertilizer, seeds, etc)
Rely on less preferred and
less expensive food
Restrict consumption by
adults in order for small
children
238
Page 4 of 6

Wereda Disaster
Risk Profile
Data_Collected_Date
September 2010
Region S.N.N.P
Zone
SOUTH OMO
Disaster Risk Management and Food
Security Sector (DRMFSS)
Tuesday, September 30, 2014
Wereda HAMER
Selected Indicator
Capacity: Coping Strategies Adopted by Households - Main coping strategies adopted by households for respective
disasters
Coping Strtegies Adopted
Types of disaters for which HHs in the community adopt the listed
Coping Strtegies
Sale of non-productive
assets (jewellery,
clothing, etc.)
Seek alternative or
additional jobs
Sell more livestock than
usual
239
Page 5 of 6

Wereda Disaster
Risk Profile
Data_Collected_Date
September 2010
Region S.N.N.P
Zone
SOUTH OMO
Disaster Risk Management and Food
Security Sector (DRMFSS)
Tuesday, September 30, 2014
Wereda HAMER
Selected Indicator
Capacity: Coping Strategies Adopted by Households - Main coping strategies adopted by households for respective
disasters
Coping Strtegies Adopted
Types of disaters for which HHs in the community adopt the listed
Coping Strtegies
Sending children of
household for work
Short-term / seasonal
labor migration
Skip entire day without
eating
240
Page 6 of 6
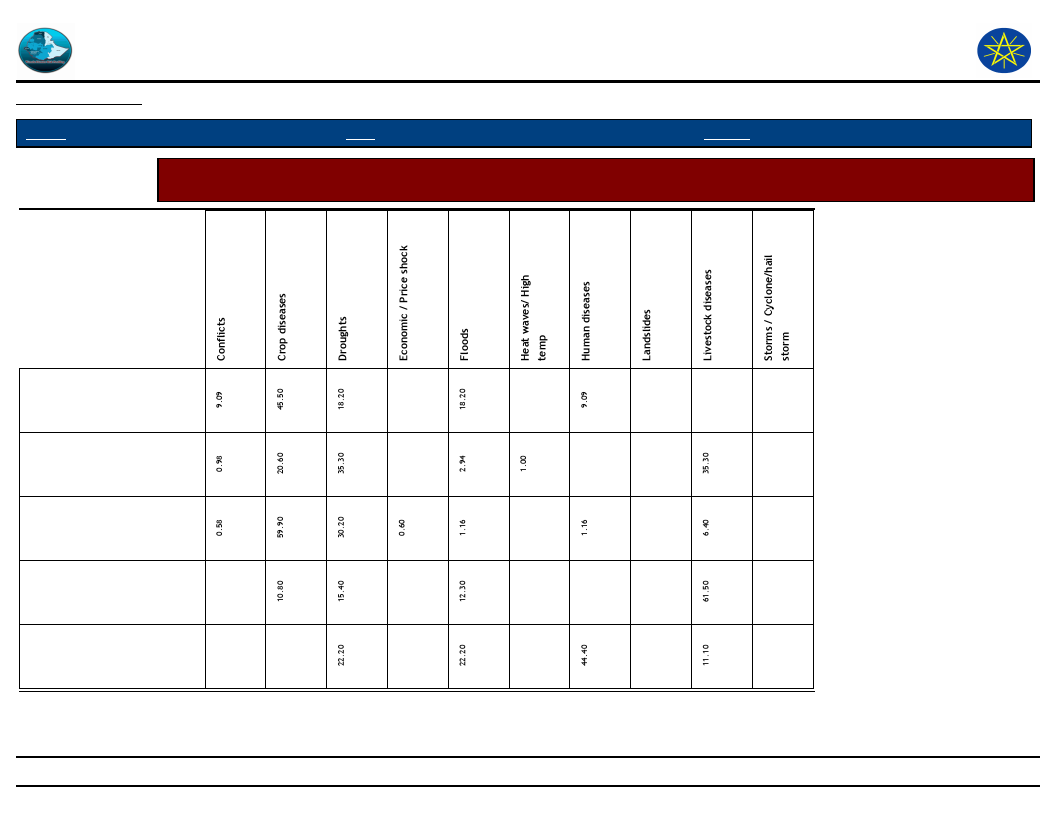
Wereda Disaster
Risk Profile
Data_Collected_Date
September 2010
Disaster Risk Management and Food
Security Sector (DRMFSS)
Tuesday, September 30, 2014
Region S.N.N.P
Zone
SOUTH OMO
Wereda HAMER
Selected Indicator
Capacity: Coping Strategies Adopted by Households - Secondary coping strategies adopted by households for
respective disasters
Begging for money or for
food
Borrowing of food or cash
(including purchasing food
on credit)
Collection of wild food
Consumption rather than
sale of crop surplus
Increased working hours
241
Page 1 of 4
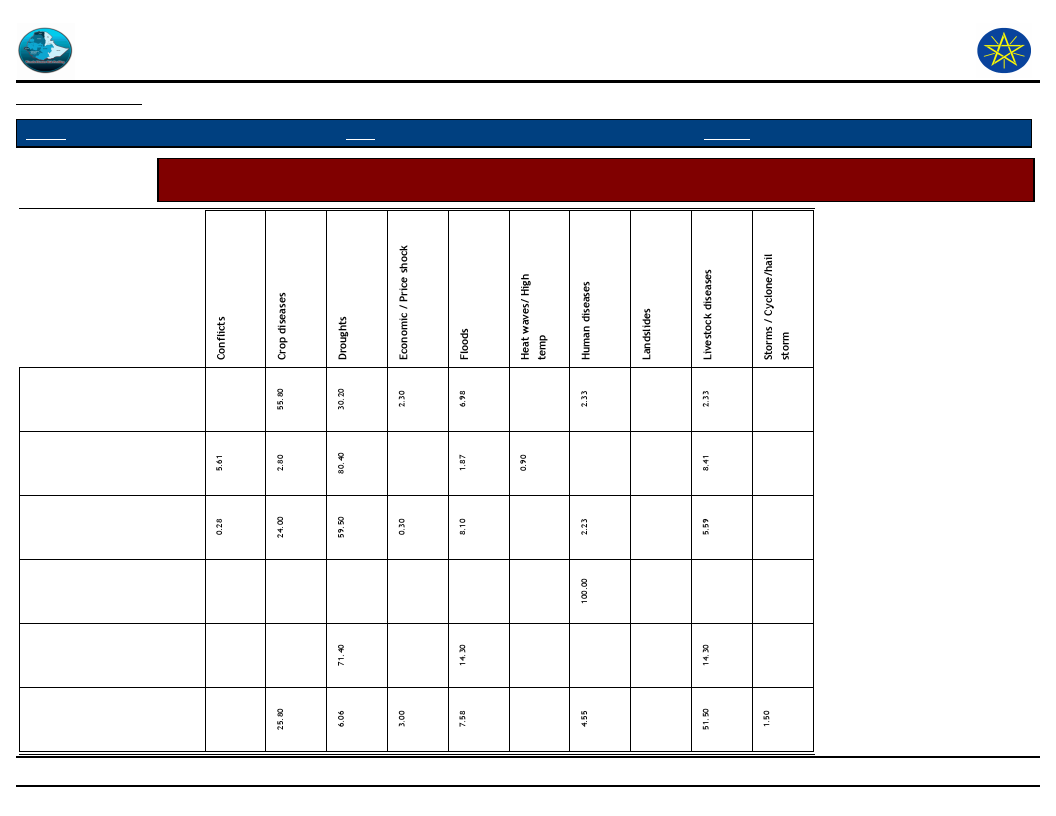
Wereda Disaster
Risk Profile
Data_Collected_Date
September 2010
Disaster Risk Management and Food
Security Sector (DRMFSS)
Tuesday, September 30, 2014
Region S.N.N.P
Zone
SOUTH OMO
Wereda HAMER
Selected Indicator
Capacity: Coping Strategies Adopted by Households - Secondary coping strategies adopted by households for
respective disasters
Limit portion size at meals
Long-term / permanent
migration (including
distress migration)
Reduce number of meals
eaten in a day
Reduced expenditure on
health and education
Reduced expenditure on
productive inputs
(fertilizer, seeds, etc)
Rely on less preferred and
less expensive food
242
Page 2 of 4

Wereda Disaster
Risk Profile
Data_Collected_Date
September 2010
Disaster Risk Management and Food
Security Sector (DRMFSS)
Tuesday, September 30, 2014
Region S.N.N.P
Zone
SOUTH OMO
Wereda HAMER
Selected Indicator
Capacity: Coping Strategies Adopted by Households - Secondary coping strategies adopted by households for
respective disasters
Restrict consumption by
adults in order for small
children
Sale of non-productive
assets (jewellery, clothing,
etc.)
Seek alternative or
additional jobs
Sell more livestock than
usual
Sending children of
household for work
Short-term / seasonal labor
migration
243
Page 3 of 4

Wereda Disaster
Risk Profile
Data_Collected_Date
September 2010
Disaster Risk Management and Food
Security Sector (DRMFSS)
Tuesday, September 30, 2014
Region S.N.N.P
Zone
SOUTH OMO
Wereda HAMER
Selected Indicator
Capacity: Coping Strategies Adopted by Households - Secondary coping strategies adopted by households for
respective disasters
Skip entire day without
eating
244
Page 4 of 4

Wereda Disaster
Risk Profile
Disaster Risk Management and
Food Security Sector (DRMFSS)
Data_Collected_Date
Region S.N.N.P
September 2010
Zone SOUTH OMO
Wereda HAMER
Tuesday, September 30, 2014
Selected Indicator
Capacity: Coping Strategies Adopted by Households - Main coping strategies adopted by households to recover
from respective losses
Type of Coping Strategy Adopted
Type of Loss
Begging for money or for food
Borrowing of food or cash
(including purchasing food on
credit)
Collection of wild food
Consumption rather than sale
of crop surplus
245
Page 1 of 5
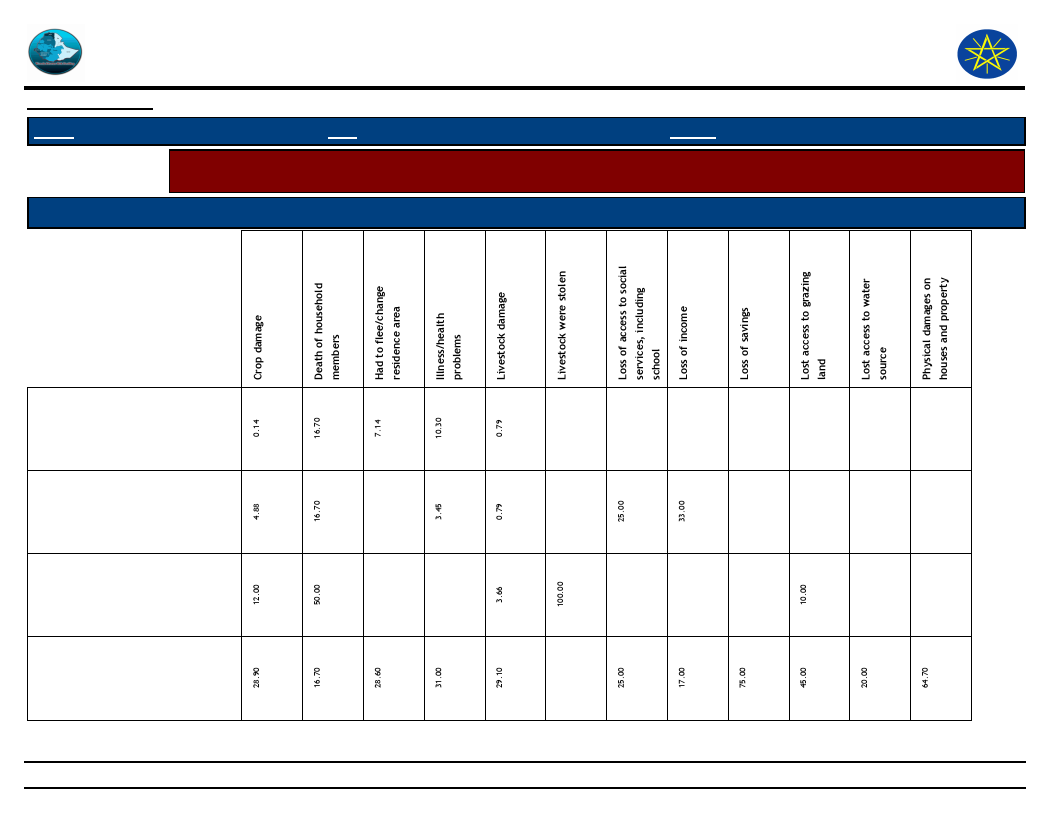
Wereda Disaster
Risk Profile
Disaster Risk Management and
Food Security Sector (DRMFSS)
Data_Collected_Date
Region S.N.N.P
September 2010
Zone SOUTH OMO
Wereda HAMER
Tuesday, September 30, 2014
Selected Indicator
Capacity: Coping Strategies Adopted by Households - Main coping strategies adopted by households to recover
from respective losses
Type of Coping Strategy Adopted
Type of Loss
Increased working hours
Limit portion size at meals
Long-term / permanent
migration (including distress
migration of whole families)
Reduce number of meals eaten
in a day
246
Page 2 of 5

Wereda Disaster
Risk Profile
Disaster Risk Management and
Food Security Sector (DRMFSS)
Data_Collected_Date
Region S.N.N.P
September 2010
Zone SOUTH OMO
Wereda HAMER
Tuesday, September 30, 2014
Selected Indicator
Capacity: Coping Strategies Adopted by Households - Main coping strategies adopted by households to recover
from respective losses
Type of Coping Strategy Adopted
Type of Loss
Reduced expenditure on health
and education (including taking
children out of school)
Reduced expenditure on
productive inputs (fertilizer,
seeds, livestock drugs, etc.)
Rely on less preferred and less
expensive food
Restrict consumption by adults
in order for small children to
eat
247
Page 3 of 5
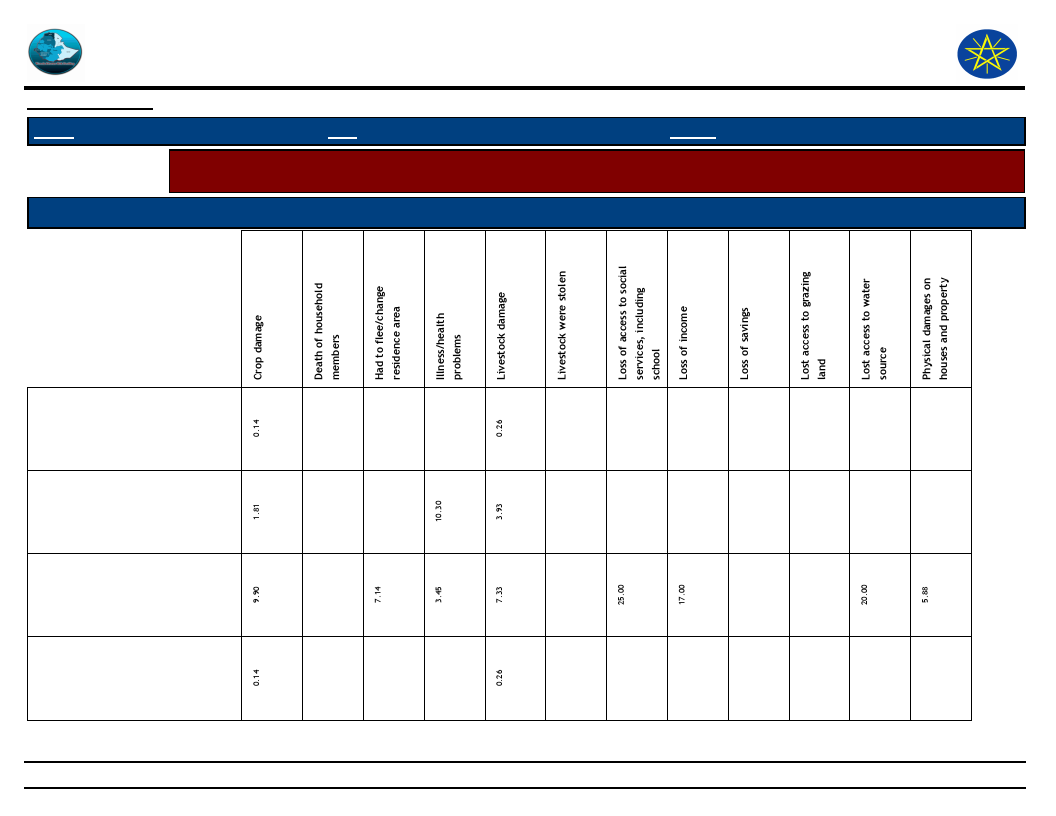
Wereda Disaster
Risk Profile
Disaster Risk Management and
Food Security Sector (DRMFSS)
Data_Collected_Date
Region S.N.N.P
September 2010
Zone SOUTH OMO
Wereda HAMER
Tuesday, September 30, 2014
Selected Indicator
Capacity: Coping Strategies Adopted by Households - Main coping strategies adopted by households to recover
from respective losses
Type of Coping Strategy Adopted
Type of Loss
Sale of non-productive assets
(Jewelry, clothing, etc.)
Seek alternative or additional
jobs
Sell more livestock than usual
Sending children of household
for work
248
Page 4 of 5
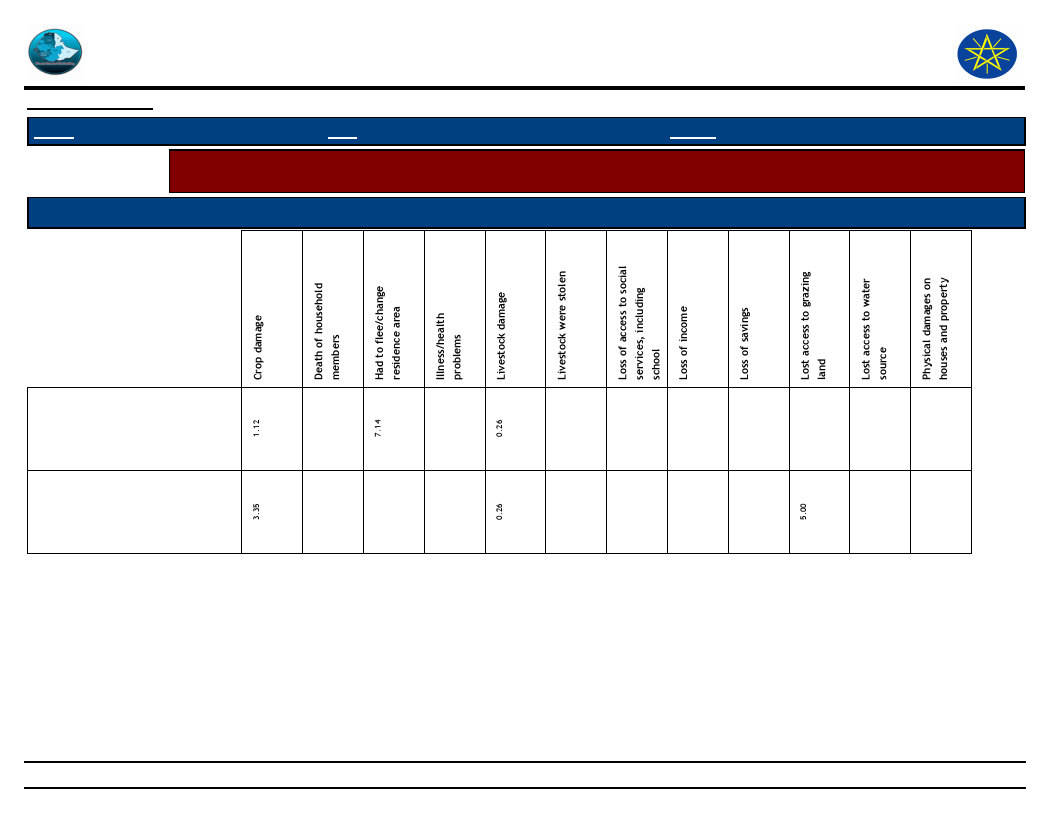
Wereda Disaster
Risk Profile
Disaster Risk Management and
Food Security Sector (DRMFSS)
Data_Collected_Date
Region S.N.N.P
September 2010
Zone SOUTH OMO
Wereda HAMER
Tuesday, September 30, 2014
Selected Indicator
Capacity: Coping Strategies Adopted by Households - Main coping strategies adopted by households to recover
from respective losses
Type of Coping Strategy Adopted
Type of Loss
Short-term / seasonal labor
migration
Skip entire day without eating
249
Page 5 of 5
Data_Collected_Date
September 2010
Tuesday, September 30, 2014
Region S.N.N.P
Selected Indicator
Zone SOUTH OMO
Wereda HAMER
Capacity: Coping Strategies Adopted by Households - Percentage of households by
frequency of main coping strategies adopted
Type of Coping Strategy Adopted
Frequency of Adoption
Begging for money or for food
Borrowing of food or cash (including purchasing
food on credit)
Collection of wild food
Consumption rather than sale of crop surplus
Increased working hours
Limit portion size at meals
Long-term / permanent migration (including
distress migration)
Reduce number of meals eaten in a day
Reduced expenditure on health and education
Reduced expenditure on non-essential items
(beer, cigarettes, etc)
Rely on less preferred and less expensive food
Restrict consumption by adults in order for small
children
33.30
55.60
11.10
19.10
66.30
14.60
28.60
21.40
28.60
21.40
1.69
2.25
21.90
73.60
0.56
23.10
5.13
10.30
61.50
44.40
44.40
5.56
5.56
20.00
60.00
20.00
57.10
42.90
100.00
100.00
16.00
75.50
3.81
4.76
25.80
61.30
9.68
3.23
250
Page 1 of 2
Data_Collected_Date
September 2010
Tuesday, September 30, 2014
Region S.N.N.P
Selected Indicator
Zone SOUTH OMO
Wereda HAMER
Capacity: Coping Strategies Adopted by Households - Percentage of households by
frequency of main coping strategies adopted
Type of Coping Strategy Adopted
Frequency of Adoption
Sale of non-productive assets (jewellery, clothing,
etc.)
Seek alternative or additional jobs
Sell more livestock than usual
Short-term / seasonal labor migration
Skip entire day without eating
50.00
50.00
40.00
60.00
0.28
20.90
41.00
37.50
0.28
3.13
1.56
18.80
76.60
25.20
61.70
6.09
6.96
251
Page 2 of 2

Wereda Disaster
Risk Profile
Data_Collected_Date
September 2010
Disaster Risk Management and Food
Security Sector (DRMFSS)
Tuesday, September 30, 2014
Region S.N.N.P
Selected Indicator
Zone SOUTH OMO
Wereda HAMER
Capacity: Alternative Livelihood Sources - Alternative livelihood sources suggested by the community
Kebele Name
Work_Option_1
Comment_1
Work_Option_2
Comment_2
Work_Option_3
Comment_3
HEDBAK
SHANKO
Store food grain
collected at good
seasons until the
beginning of the
next wet season.
Vaccination for
livestock annually
to prevent them
from fatal disease
such as
anthrax,CBPP
etc…
We were spending
food grain at good
harvest season by
selling and giving for
poor, but now the
harvest is becoming
small, even
insufficient for home
consuption. Therefore
to reduce hunger
hazards majority of
the community start
saving from small
harvest for severe
hunger seasons.
They have good
experience to take
their livestock for
vaccination during
disease time
252
Page 1 of 7

Wereda Disaster
Risk Profile
Data_Collected_Date
September 2010
Disaster Risk Management and Food
Security Sector (DRMFSS)
Tuesday, September 30, 2014
Region S.N.N.P
Selected Indicator
Zone SOUTH OMO
Wereda HAMER
Capacity: Alternative Livelihood Sources - Alternative livelihood sources suggested by the community
Kebele Name
DEGA KEJA
Work_Option_1
Comment_1
For livestock feed
and water
shortage problems
and food
shortages, we find
grazing areas and
food grain
sources.
When the coming
months are expected
to be dry we find
grazing and water
points to save animals
Work_Option_2
For livestock
disease out
breaks, we bring
livestock for
vaccination
Comment_2
Work_Option_3
SHANKO 2
Find food grain
from other areas
at good price.
During peak dry and
food shortage seasons
finding food grain at
fair price is difficult.
Therefore, at current
condition, finding
food grain sources
before hunger seasons
is profitable
Find livestock
feed and water
sources.
MRSHA
No one has taken
preventive
measures except
migrating for
livestock feed and
water as usual
activities.
Still we have no
experience on
preventive measures
of hunger except
selling of livestock for
grain when bad
seasons come.
We keep/herd
livestock splitting
at different
grazing areas to
save from rival
ethnic looters.
To avoid loss of animals
by theft
Comment_3
253
Page 2 of 7

Wereda Disaster
Risk Profile
Data_Collected_Date
September 2010
Disaster Risk Management and Food
Security Sector (DRMFSS)
Tuesday, September 30, 2014
Region S.N.N.P
Selected Indicator
Zone SOUTH OMO
Wereda HAMER
Capacity: Alternative Livelihood Sources - Alternative livelihood sources suggested by the community
Kebele Name
Work_Option_1
Comment_1
Work_Option_2
Comment_2
Work_Option_3
Comment_3
MINOGELTI
SHESHA GOYKE
No measures have
been taken for
negative effects
of hunger
(precaution), but
for conflict we
help each other
Frequent scouting
out of boarder to
prevent rival
ethnic
infiltration.
It is day to day
activity to save the
lives of the
community and loss
of livestock by raiders
,so that routine
scouting boarders is
crucial to prevent and
control from risk of
conflict disaster
It is the only measure
to protect livestock
from raiders and loss
of life .early
identification of
looters movement
also reduce level of
conflict.
For livestock
diseases, we
purchase drugs
regardless of
prices and its
quality.
Finding grazing
and watering
points.
Livestock is the only
main economic activity
of the community
During prolonged
drought finding grazing
and water points is the
primary issue to save
loss of livestock.
restrict
movement to
disease areas
To reduce
livestock
disease
distribution,
restriction to
grazing and
water points is
the only
option.
254
Page 3 of 7
Wereda Disaster
Risk Profile
Data_Collected_Date
September 2010
Disaster Risk Management and Food
Security Sector (DRMFSS)
Tuesday, September 30, 2014
Region S.N.N.P
Selected Indicator
Zone SOUTH OMO
Wereda HAMER
Capacity: Alternative Livelihood Sources - Alternative livelihood sources suggested by the community
Kebele Name
ERBORE
Work_Option_1
regular follow up
of cultural early
indicators to
escape before
onset of flooding
Comment_1
Cultural early
indicators have
becoming promising
to save the life of the
community, crop and
livestock damage.
Work_Option_2
Follow early
warning
information from
government and
NGOs and
evacuate
livestock and
community
before flooding
on set.
Comment_2
Good communication is
available
Work_Option_3
KOLA KEJA
Practice crop
farming however
crop productivity
about every year
due to drought.
Due to rising price of
crops from time to
time (goat -grain
exchange rise) and
depletion of livestock
resources and
produce owing to
administrating of
pasture land due to
rain shortage.
Selling of
livestock for
grain purchase
waiting good
market seasons
and saving money
for bad times.
Grain-goat
(grain-money)
purchasing is becoming
hard or expensive during
dry seasons and
affecting PA resources
by external traders. At
this time great change
by this activity.
searching good
market points for
livestock sell and
grain purchase
Comment_3
Some livestock
owners have
becoming
livestock
market
oriented and
getting
common price
offer for their
produce and
also their need
from market.
This activity is
promising.
255
Page 4 of 7

Wereda Disaster
Risk Profile
Data_Collected_Date
September 2010
Disaster Risk Management and Food
Security Sector (DRMFSS)
Tuesday, September 30, 2014
Region S.N.N.P
Selected Indicator
Zone SOUTH OMO
Wereda HAMER
Capacity: Alternative Livelihood Sources - Alternative livelihood sources suggested by the community
Kebele Name
Work_Option_1
Comment_1
Work_Option_2
Comment_2
Work_Option_3
Comment_3
QUARO
LALA
Using early
warning indicators
(cultural) and
announce for the
community if
there is threat of
flooding
We have better early
warning indicators
and we have got good
response.
Shifting of
livestock to safe
grazing areas
before flooding
No precaution for
hunger but for
livestock disease,
we purchased
drugs against ccpp
and we have sent
livestock for
vaccination of
anthrax before
driving to disease
source areas(dry
season grazing
areas)
for several years back
we have not had any
precaution for hunger
but we have been
offered livestock for
vaccination to protect
them from death of
anthrax at disease
source areas(dry
season areas)
forward
application for
woreda
administration
office to get fuel
support for
motorized boat
we have saved
households
utensils from
damage since
we get support
from
government
(boat and fuel
support)
256
Page 5 of 7

Wereda Disaster
Risk Profile
Data_Collected_Date
September 2010
Disaster Risk Management and Food
Security Sector (DRMFSS)
Tuesday, September 30, 2014
Region S.N.N.P
Selected Indicator
Zone SOUTH OMO
Wereda HAMER
Capacity: Alternative Livelihood Sources - Alternative livelihood sources suggested by the community
Kebele Name
ERIYA
Work_Option_1
Comment_1
We do not have
any precaution for
hunger, but for
livestock feed and
water shortages,
we search for
pasture and water
sources
Hunger is beyond the
capacity of
community b/c it
affects all community
members regardless
of livestock
resources. Therefore
we didnt have any
precaution measures
for food shortage in
the previous hazards
and we will not have
for future as well.
Work_Option_2
Comment_2
Work_Option_3
BESSA MEJAN
Tending livestock
splitting at
different grazing
and water points
to protect our
resource from
looting and death
due to drought
and disease
Saving relief
grain giving
priority for
children.
Comment_3
257
Page 6 of 7

Wereda Disaster
Risk Profile
Data_Collected_Date
September 2010
Disaster Risk Management and Food
Security Sector (DRMFSS)
Tuesday, September 30, 2014
Region S.N.N.P
Selected Indicator
Zone SOUTH OMO
Wereda HAMER
Capacity: Alternative Livelihood Sources - Alternative livelihood sources suggested by the community
Kebele Name
Work_Option_1
Comment_1
Work_Option_2
Comment_2
Work_Option_3
GEDBAK
Storing food grain
which harvested
at good seasons
for hunger
seasons
At current condition
all community
members informed on
storing food grain at
good harvest seasons
to prevent households
from hunger.
ASELE
Looking for water
and pasture in
other areas during
dry season
This is the only
measure for our
community to save
livestock
WENBAYNO
There were no
precautions taken
by households to
prevent from
negative impacts
of drought.
all disaster negative
impacts which has
happened in the PA
were and will be
beyond the capacity
of the
communitywide (rain
shortage and its
consequences)
Comment_3
258
Page 7 of 7
WDRP Indicators
Community
Perceptions and Suggestions
259

Data_Collected_Date
September 2010
Tuesday, September 30, 2014
Region S.N.N.P
Selected Indictor:
KebeleName
Zone SOUTH OMO
Wereda HAMER
Agricultural Situation: Access to Extension - Perception of the community on
Access to Agricultural extension Services
Current_Level
Change_In_Last_Decade
Comments
HEDBAK
SHANKO
DEGA KEJA
ADAMIE
SHANKO 2
BESSA MEJAN
MINOGELTI
SHESHA GOYKE
Good access for there are
two DAs in the kebele
Loss agricultural extension
services
There is good access on
government agricultural
extension services, better
than before condition das
are assigned in the PA and
they have been visiting every
months
There is irregular
agricultural extension
service by government
There is an access of
agricultural extension by
government Better than the
last 10 years
There is an access of
agricultural extension
service from government and
NGOs
There is good access for
agricultural extension
service by government and
NGOs
There is an access of
agricultural extension
service
Increase
There is no as such
prominent change on
agricultural services from
before
There is regular extension
service better than the last
decades
There are 3 DAs assigned for
disciplines (plant, animal
and natural resource
department)
DAs are assigned in the PA
since 1994
To allocate high budget
for those who give the
services for the
community
There are assigned DAs in
the PA ,but there were no
any DA before 10 years
except on and off services
given by agricultural
office experts
We get animal health
services in the PA and
other agricultural
technical aids
260
Page 1 of 3
Data_Collected_Date
September 2010
Tuesday, September 30, 2014
Region S.N.N.P
Selected Indictor:
KebeleName
Zone SOUTH OMO
Wereda HAMER
Agricultural Situation: Access to Extension - Perception of the community on
Access to Agricultural extension Services
Current_Level
Change_In_Last_Decade
Comments
QUARO
MURALE
KOLA KEJA
ERBORE
LALA
ERIYA
MRSHA
GEDBAK
There is good access of
agricultural extension and
training by both government
and NGO
It is better than before DAs
are assigned in the PA NGOs
(farm Africa) have giving
training for several
communities
There is agricultural
extension services especially
on livestock production and
natural resource
conservation
There is good access of
agricultural extension both
government and NGO (farm
Africa)
Agricultural extension
service by government is also
better than before These are
assigned DAs in the PA
Good access of agricultural
extension by government
There is good access of
agricultural extension in
both government and NGOs
There are more assigned
development agents better
than the previous years
Before 10 years there was
no agricultural extension
service in the areas
At current condition there
are assigned DAs in the PA
who were not before
There is great change on
access of agricultural
extension
There is good access of
agricultural extension
services by the government
better than before
261
Agricultural extension
services should be
strengthened by trained
many power
Before 10 years there
were not da in PA as
though on and off
agricultural extension
service has been given by
government and NGOs
Page 2 of 3

Data_Collected_Date
September 2010
Tuesday, September 30, 2014
Region S.N.N.P
Selected Indictor:
KebeleName
Zone SOUTH OMO
Wereda HAMER
Agricultural Situation: Access to Extension - Perception of the community on
Access to Agricultural extension Services
Current_Level
Change_In_Last_Decade
Comments
ASELE
At current condition, there is
better access to agricultural
extension services by
government and NGOs than
before 10 years situation,
however changes are
insignificant due to high
resistance from community’s
side
262
Page 3 of 3
Data_Collected_Date
September 2010
Tuesday, September 30, 2014
Region S.N.N.P
Selected Indictor:
KebeleName
HEDBAK
SHANKO
DEGA KEJA
SHANKO 2
BESSA MEJAN
MINOGELTI
SHESHA GOYKE
QUARO
LALA
ERIYA
MRSHA
GEDBAK
ASELE
MURALE
Zone SOUTH OMO
Wereda HAMER
Agricultural Situation: Access to Inputs - Perception of the community on access
to improved agricultural inputs
Current_Level
Change_In_Last_Decade
Comments
Inputs are accessible but the
community does not use due
to low awareness
Low access to improved
agricultural Inputs
Inputs are accessible but the
community does not use due
to low awareness
Inputs are accessible but the
community does not use due
to low awareness
There is access but
utilization is very poor
No important for this
community
No significance importance of
this area
There is an access but the
land is fertile which does not
need fertilizer
There is an access of
agricultural inputs
No utilization except seeds at
some level
There is access but
utilization is very poor
There is less access of
agricultural inputs
There is better access than
before, but utilization is poor
There is good access, but we
do not use due to high
fertility of our soil
Decreased
Do not use due to shortage
of rain
No change
No change
To create awareness
263
Page 1 of 2

Data_Collected_Date
September 2010
Tuesday, September 30, 2014
Region S.N.N.P
Selected Indictor:
KebeleName
ERBORE
GEDBAK
ASELE
Zone SOUTH OMO
Wereda HAMER
Agricultural Situation: Access to Inputs - Perception of the community on access
to improved agricultural inputs
Current_Level
There is an access of seeds
better than before, but it is
no sufficient and not supplied
on time There is also
shortage of pesticides as
before
There is less access of
agricultural inputs
There is better access than
before, but they didnt put to
use owing to despairing on
deterioration of rain fall and
environmental condition
Change_In_Last_Decade
Comments
264
Page 2 of 2

Data_Collected_Date
September 2010
Tuesday, September 30, 2014
Region S.N.N.P
Zone SOUTH OMO
Wereda HAMER
Selected Indictor:
KebeleName
Agricultural Situation: Water for irrigation - Access to water for irrigation in the
community
Current_Level
Change_In_Last_Decade
Comments
HEDBAK
SHANKO
DEGA KEJA
SHANKO 2
BESSA MEJAN
MINOGELTI
SHESHA GOYKE
QUARO
ERBORE
KOLA KEJA
LALA
ERIYA
MRSHA
ASELE
There is no access of water
for irrigation
No access
There is no any permanent
water to be used for
irrigation
No water for irrigation
No access of water for
irrigation
No access of water for
irrigation
No access to water for
irrigation
There is temporary water
suitable for irrigation
There is seasonal water
which can be put to use for
irrigation purpose
There is no access irrigation
in the PA
No any type of permanent
water to be used for
irrigation purpose
No water source
No access for irrigation at
all
No access of water for
irrigation
No change in decades
No rivers
No permanent water in the
PA
There is no permanent water
source in the PA or vicinity
There is no permanent water
source in the PA
No permanent water source
in the area
The water level is reducing
due to irrigation farm
expansion at high land and
low land areas
Since 2000 it becomes dry
with in short period of wet
seasons but before it stays
for months
No change in terms of
irrigation access
No permanent water resource
in the PA
It was seasonal because of rain
shortage
265
Page 1 of 2
Data_Collected_Date
September 2010
Tuesday, September 30, 2014
Region S.N.N.P
Zone SOUTH OMO
Wereda HAMER
Selected Indictor:
KebeleName
GEDBAK
MURALE
KOLA KEJA
Agricultural Situation: Water for irrigation - Access to water for irrigation in the
community
Current_Level
No access water for
irrigation and the land scape
is not suitable also for
irrigation farming as though
there is all weather springs
that drains b/n mountains
There is seasonal water
which can be put to use for
irrigation purpose
There is no access irrigation
in the PA
Change_In_Last_Decade
Since 2000 it becomes dry
with in short period of wet
seasons but before it was
stayed for a months and it
has had a good source of
water
Comments
266
Page 2 of 2
Data_Collected_Date
September 2010
Tuesday, September 30, 2014
Region S.N.N.P
Zone SOUTH OMO
Wereda HAMER
Selected Indictor:
Agricultural Situation: Water Availability for Livestock - Water availability for
livestock in the community
KebeleName
Current_Level
Change_In_Last_Decade
Comments
HEDBAK
SHANKO
BESSA MEJAN
MINOGELTI
SHESHA GOYKE
QUARO
KOLA KEJA
ERIYA
MRSHA
Good access
It was seasonal b/c of
rain shortage
There is high shortage of
water for livestock
There is shortage of
water for domestic
animals
Access of water for domestic
animals is obtained from the
next village
Decreased
In the previous years (before
15 years there was better
water source in temporary
sandy river)
Subsurface water in
temporary sandy rivers is
diminishing
Water sources for
livestock are temporary
sandy rivers
It is depleting due to
shortage of rain fall
In wet season there is
good access, but during
dry there is shortage
Water resources is
depleting from time to
time
Temporary sandy rivers
There is high shortage of
water for livestock
Temporary rivers (sandy
rivers) have had water
sources at near depth before
Water resources in temporary
sandy rivers are reducing due
to recurrent drought effects
Temporary sandy rivers are
becoming dry due to
prolonged dry season
There are three
Water source is diminishing
in temporary sandy rivers
due to recurrent drought
Before (10 to 15 years ago)
water was available at near
depth of temporary sandy
rivers but now days there is
no water in near depth
Before 10 to 15 years there
was water source at depth
of 1 to 2 meters in sandy
rivers, but now it is at
depth of 4 to 5 meters
Additional deep wells
should be established to
mitigate water shortage
Before 10 to 20 years there
was plenty of surface water
in seasonal sandy rivers
267
Page 1 of 3

Data_Collected_Date
September 2010
Tuesday, September 30, 2014
Region S.N.N.P
Zone SOUTH OMO
Wereda HAMER
Selected Indictor:
Agricultural Situation: Water Availability for Livestock - Water availability for
livestock in the community
KebeleName
DEGA KEJA
ADAMIE
SHANKO 2
MURALE
ERBORE
LALA
Current_Level
There is water source in
temporary sandy rivers
There is huge water
source
There is access of water
for domestic animals as
before, but the only
change is the depletion
of sub surface water
owing to recurrent
drought (rain shortage)
There is season access,
but it is depleting in dry
seasons owing irrigation
farm extension on the
beside Woito river at
other areas
There is seasonal access,
but during peak dry
seasons, water source
will be at distant areas or
digging of temporary
river (Woito) at depth of
3 to 5 metres to get
water
At current condition
there is high shortage of
water for livestock more
than 60% livestock are
derived to grazing and
watering points owing to
shortage
Change_In_Last_Decade
They dig at a depth of 3 to 4
meters to get water the
water source is diminishing
from time to time due to
shortage of rain fall
No change
Comments
268
Page 2 of 3

Data_Collected_Date
September 2010
Tuesday, September 30, 2014
Region S.N.N.P
Zone SOUTH OMO
Wereda HAMER
Selected Indictor:
Agricultural Situation: Water Availability for Livestock - Water availability for
livestock in the community
KebeleName
Current_Level
Change_In_Last_Decade
Comments
GEDBAK
ASELE
There is good access of
spring water for
livestock; however it is
depleting from time to
time owing to increasing
deforestation of stream
sources
There is no sufficient
access to water for
domestic animals- 80% of
the livestock are tending
at distant areas due to
shortage of water in their
PA swatter sources in
temporary river is also
diminishing
269
Page 3 of 3
Data_Collected_Date
September 2010
Tuesday, September 30, 2014
Region S.N.N.P
Selected Indictor:
Kebele Name
Zone SOUTH OMO
Wereda HAMER
Agricultural Situation: Soil Fertility - Perception of the community on soil fertility
and its change over time
Current_Level
Change_In_Last_Decade
Comments
HEDBAK
It is losing its fertility
Rocky due to soil erosion
SHANKO
DEGA KEJA
SHANKO 2
BESSA MEJAN
MINOGELTI
SHESHA GOYKE
QUARO
MURALE
KOLA KEJA
ERBORE
ERIYA
MRSHA
Decrease from year to year
The land is losing its
fertility year to year
Soil fertility is depleting
rapidly due to
deforestation
Soil fertility is reduced
Soil fertility is poor and
becoming sandy
Soil fertility is reducing as
a result of deforestation
The PA soil is fertile and
suitable for crop
production
Very fertile
Soil fertility is decreasing
due to increased flooding
The soil of this PA didnt
lost its fertility
Decreasing rapidly
Soil fertility is decreasing
Decreased
At current condition a
certain farm land is not
used for cropping due to
erosion
Almost most part of the PA
is cleared off for
agricultural activities
without sufficient yield
There is great change
within 15 years on soil
fertility
Many large trees have cut
down for different purposes
The same sense as the
above
No change
Several gullies are forming
due to natural resource
deterioration
Regular change of farm
places becomes usual due
to depletion of soil fertility
Soil fertility is decreasing
due to high run off as the
result of deforestation
So the flood brings fertile
soil at high land areas
Natural resource
conservation works should
be increased
Many trees, bushes and
shrubs have been cut
without replacing
270
Page 1 of 2

Data_Collected_Date
September 2010
Tuesday, September 30, 2014
Region S.N.N.P
Selected Indictor:
Kebele Name
Zone SOUTH OMO
Wereda HAMER
Agricultural Situation: Soil Fertility - Perception of the community on soil fertility
and its change over time
Current_Level
Change_In_Last_Decade
Comments
ADAMIE
LALA
GEDBAK
ASELE
good
The crop land has lost its
fertility due to rapid
deforestation and
increased run off from
mountain areas to plain
areas.
At current condition the
fertility of soil is reduced
too much and has great
difference from previous
fertility.
Soil fertility is also
reducing from year to year
as the increasing of
environmental temp and
deforestation.
The same sense as the
above
271
Page 2 of 2
Data_Collected_Date
September 2010
Tuesday, September 30, 2014
Region S.N.N.P
Selected Indictor:
Zone SOUTH OMO
Wereda HAMER
Economic Vulnerability: Change in Agricultural Situation - Households perception
on changes of crop type, size of cultivated area and crop yields
Proportion of households reporting change in crops grown
Adequate irrigation available
88.60
%
1st
2nd
3rd
1.43
0.00
0.00
Adequate rainfall
11.40
4.17
0.00
Insufficient irrigation available
1.43
0.00
0.00
Less rainfall
64.30
8.33
0.00
More drought resistant crop
1.43
4.17
8.33
More yielding crop
20.00
25.00
8.33
Proportion of households reporting change in size of area cultivated
95.90 %
Adequate fertilizer
1st
2nd
3rd
0.63
1.16
0.00
Adequate irrigation available
9.38
6.98
5.70
Better yielding crop
0.63
14.00
3.80
Insufficient rainfall
33.13
14.00
1.90
Landslides
0.63
1.16
19.00
Water logging
0.63
2.33
19.00
Proportion of households reporting change in crop yield
Adequate fertilizer
97.30
%
1st
2nd
3rd
0.20
47.50
0.00
272
Page 1 of 2
Data_Collected_Date
September 2010
Tuesday, September 30, 2014
Region S.N.N.P
Selected Indictor:
Zone SOUTH OMO
Wereda HAMER
Economic Vulnerability: Change in Agricultural Situation - Households perception
on changes of crop type, size of cultivated area and crop yields
1st
2nd
3rd
Adequate irrigation available
0.20
2.79
0.00
Adequate rainfall
14.00
3.91
5.00
Better yielding crop
1.60
19.00
35.00
Improved variety of seeds
0.40
26.30
50.00
Insufficient rainfall
84.00
0.56
10.00
273
Page 2 of 2
Data_Collected_Date
September 2010
Tuesday, September 30, 2014
Region S.N.N.P
Selected Indicator
Zone SOUTH OMO
Wereda HAMER
Environmental Situation: General Land Quality - Perceptions of the community
on changes in the general quality of land over a decade
KebeleName
Current_Situation
Change_Last_Decade
Comment
GEDBAK
SHANKO
DEGA KEJA
SHANKO
MRSHA
MINOGELTI
MINOGELTI
ERBORE
KOLA KEJA
The PA land is losing its
fertility due to farm
extension by
The quality of the land is
decreasing from year to
year
The quality of the land is
decreasing from year to
year
The quality of the land is
decreasing
The quality of land is
decreasing in terms of
pasture land
The land quality is poor
almost all parts of the PA
land is
"The quality of the land is
reducing due to
deforestation and
"The quality of the land is
good except encroachment
of some
Quality of land is
decreasing especially
grazing land
Decreased
Due to deforestation
Due to loss of fertility vast
area of pasture and browsing
land has been cleared and
affected for farm expansion
and settlements without
sufficient crop yield
2/4 of the PA land is cleared
for farm extension
"There were plenty of grass
types which filled all pasture
land
Many areas cleared off
for farm expansion due
to increasing settlements
Due to diminishing of grass
soil erosion is increasing
from time to time
Unless soil and water
conservation works
initiated many grazing
places become gully
274
Page 1 of 2
Data_Collected_Date
September 2010
Tuesday, September 30, 2014
Region S.N.N.P
Selected Indicator
Zone SOUTH OMO
Wereda HAMER
Environmental Situation: General Land Quality - Perceptions of the community
on changes in the general quality of land over a decade
KebeleName
ERBORE
Current_Situation
The quality of the land is
good
LALA
The quality of land is very
poor and degraded
ERIYA
MRSHA
GEDBAK
ASELE
Reducing due to increased
deforestation and run off
The quality of land use
system is decreasing
The quality of land is
reduced and over utilized
"The quality of the land is
reducing owing to
continuous
Change_Last_Decade
Good due to every year
flooding of woito river
leaving which is eroded from
high lands
As the community say, if
current condition there is
change on quality of land
When compared with the last
20 years
it is decreased by 40 to 50%
Deforestation increasing
from time to time, soil
erosion increasing
There is great change on the
quality of land due to losing
its fertility
Comment
Farm land extension
without crop harvest,
increasing settlements,
pasture degradation
275
Page 2 of 2
Data_Collected_Date
September 2010
Tuesday, September 30, 2014
Region S.N.N.P
Selected Indicator
KebeleName
GEDBAK
SHANKO
SHANKO
MRSHA
MINOGELTI
MINOGELTI
ERBORE
KOLA KEJA
ERBORE
Zone SOUTH OMO
Wereda HAMER
Environmental Situation: Changes in Landscape - Changes observed by the
community on landscape and the problems due to the changes
Changes_Observed
Problems_Due_To_Changes
"All terrain areas were
covered with bushes and
shrubs farm lands before
10 years
"The land use over last
decade was very less
because of soil fertility
loss, shortage
Many plain areas have
become ups and downs,
gullies, and gorges
"Plain and good pasture
areas are becoming gullies
and undulating due to
"The land cover is
decreasing owing to cut
off much large trees which
were used for
"The land cover is
decreasing because of
deforestation for
settlement purposes and
"The land cover by forest
is reducing; many places
are becoming gully due to
over
"Soil erosion and soil
fertility is increasing from
time to time due to grass
land
"There is no much change
on land scape of the area,
but there is great change
Damage of farm places, damage of pasture
276
Page 1 of 2
Data_Collected_Date
September 2010
Tuesday, September 30, 2014
Region S.N.N.P
Selected Indicator
KebeleName
LALA
ERIYA
MRSHA
GEDBAK
ASELE
Zone SOUTH OMO
Wereda HAMER
Environmental Situation: Changes in Landscape - Changes observed by the
community on landscape and the problems due to the changes
Changes_Observed
Problems_Due_To_Changes
"Land cover declining and
changes of land scape are
the main changes of the
area It
"The area was covered by
dense forest before 10 to
15 years but now it
becomes bare
Diminishing of various
grasses, range land
encroachment, loss of wild
life
"There is great change on
land use and land cover All
forest places, bushes and
"There is great change on
the land cover- almost 70%
of the PA forest and
bushes
"Reduced livestock produce and income, long
distance travel for search of livestock
277
Page 2 of 2
Wereda Disaster
Risk Profile
Data_Collected_Date
September 2010
Disaster Risk Management and Food
Security Sector (DRMFSS)
Tuesday, September 30, 2014
Region S.N.N.P
Zone
SOUTH OMO
Wereda HAMER
Selected Indicator
Kebele Name
Interventions: Community Perception on Mediums to Influence DRM Actors - Community perception on the
effectiveness of institutional channels to use to influence DRM actors
Institution_1
Process_Description
Institution_2 Process_Description
Institution_3
Process_Description
GEDBAK
SHANKO
SHANKO
community elders
to wereda
administration
office
Community elders
Community elders
to eoreda
pertinent
organizations.
Community elders
and wereda
administration office
representatives have
to contact at kebele
level.
Community elders
have contact with
governmental and
NGO body
representative.
Community elders
and pertinent
organization
representatives shall
meet at community
level.
wereda
administration
office to zonal
administration
office
wereda
administration office
to forward community
issues to zonal level
government officials.
Governmental
and NGO
responsible.
Affecting discussion
they made at
community level NGO
representative.
wereda
pertinent
organizations
to zonal.
Pertinent
organizations
representatives
handle community
issues and forward to
zonal level
organizations.
278
Page 1 of 8

Wereda Disaster
Risk Profile
Data_Collected_Date
September 2010
Disaster Risk Management and Food
Security Sector (DRMFSS)
Tuesday, September 30, 2014
Region S.N.N.P
Zone
SOUTH OMO
Wereda HAMER
Selected Indicator
Interventions: Community Perception on Mediums to Influence DRM Actors - Community perception on the
effectiveness of institutional channels to use to influence DRM actors
Kebele Name
MRSHA
MINOGELTI
Institution_1
Community elders
have to contact
with pertinent
organizations
representatives of
the wereda.
communities
representatives
with wereda
government
and/or NGOs
Process_Description
Community elders
representatives or
PA chairman have to
contact either with
zonal or regional
bureaus regarding
the level and type of
diseaster.
Before the
implementation or
plan of development
activities (against
disasters)
community elders
have to contact with
pertinent wereda
NGOs and
government for
getting approval.
Institution_2 Process_Description
wereda
government
and NGO
representative
s with zonal or
regional
bureaus.
Institution_3
governments
and/or NGOs
with zonal or
regional
pertinent govt.
After consensus with
community elders
pertinent worked
government and NGOs
contact with zonal
offices that concern
the issue.
Process_Description
279
Page 2 of 8

Wereda Disaster
Risk Profile
Data_Collected_Date
September 2010
Disaster Risk Management and Food
Security Sector (DRMFSS)
Tuesday, September 30, 2014
Region S.N.N.P
Zone
SOUTH OMO
Wereda HAMER
Selected Indicator
Interventions: Community Perception on Mediums to Influence DRM Actors - Community perception on the
effectiveness of institutional channels to use to influence DRM actors
Kebele Name
MINOGELTI
Institution_1
Communities with
government and
NGOs
representatives at
PA level.
Process_Description
Pertinent
development
organization
(government and
NGOs) contact with
PA community at
level and the
wereda government
and /or NGO contact
zone.
Institution_2 Process_Description
Government
and NGOs with
zones or
regions.
Concerned
government contact
with concerned
bureaus at regional
level.
Institution_3
Process_Description
280
Page 3 of 8

Wereda Disaster
Risk Profile
Data_Collected_Date
September 2010
Disaster Risk Management and Food
Security Sector (DRMFSS)
Tuesday, September 30, 2014
Region S.N.N.P
Zone
SOUTH OMO
Wereda HAMER
Selected Indicator
Interventions: Community Perception on Mediums to Influence DRM Actors - Community perception on the
effectiveness of institutional channels to use to influence DRM actors
Kebele Name
ERBORE
Institution_1
The same previous
contact channels
should continue.
Process_Description
During the incidence
the PA community
representatives
contact with PA
development agents
and the PA
development agents
contact with wereda
pastoral
development office
and then the office
contact with zonal
or regional early
warning response
and food security
work process. If the
condition becoming
worse, the wereda
PDO contact with
NGOs to get logistic
support from them.
Institution_2 Process_Description
Institution_3
Process_Description
281
Page 4 of 8

Wereda Disaster
Risk Profile
Data_Collected_Date
September 2010
Disaster Risk Management and Food
Security Sector (DRMFSS)
Tuesday, September 30, 2014
Region S.N.N.P
Zone
SOUTH OMO
Wereda HAMER
Selected Indicator
Interventions: Community Perception on Mediums to Influence DRM Actors - Community perception on the
effectiveness of institutional channels to use to influence DRM actors
Kebele Name
KOLA KEJA
Institution_1
the PA
representatives
contact to wereda
PDO and /or WAO
Process_Description
PA community
representatives
should have to
contact with wereda
pastoral
development office
and wereda NGO
which is working on
risk management.
Institution_2 Process_Description
wereda PDO to
zonal and or
regional
wereda PDO ought to
contact with zonal
and/or regional early
warning work
process.
Institution_3
Process_Description
282
Page 5 of 8

Wereda Disaster
Risk Profile
Data_Collected_Date
September 2010
Disaster Risk Management and Food
Security Sector (DRMFSS)
Tuesday, September 30, 2014
Region S.N.N.P
Zone
SOUTH OMO
Wereda HAMER
Selected Indicator
Interventions: Community Perception on Mediums to Influence DRM Actors - Community perception on the
effectiveness of institutional channels to use to influence DRM actors
Kebele Name
ERBORE
Institution_1
No problem on
channels or
contact of places
with concerned
organizations.
Process_Description
There was both ways
contact. Community
elders or members
with wereda
concerned
organization
representatives and
NGO
representatives,
there has been
contact with
regional and zonal
concerned
government
organization
representatives
about flood disasters
and settlement to
flood risk free areas.
Institution_2 Process_Description
Institution_3
Process_Description
283
Page 6 of 8
Wereda Disaster
Risk Profile
Data_Collected_Date
September 2010
Disaster Risk Management and Food
Security Sector (DRMFSS)
Tuesday, September 30, 2014
Region S.N.N.P
Zone
SOUTH OMO
Wereda HAMER
Selected Indicator
Interventions: Community Perception on Mediums to Influence DRM Actors - Community perception on the
effectiveness of institutional channels to use to influence DRM actors
Kebele Name
LALA
ERIYA
MRSHA
Institution_1
community elders
forward their
issues directly to
zonal and or
regional
concerned bodies
Community and
organization
representatives at
PA (community
level).
community
representatives to
government and
NGOs
Process_Description
Contacts were made
at community level
with government
officials and NGO
representatives, but
there are many
issues that didnt get
response for many
years.
community elders
should contact with
government and
NGO representatives
at kebele level and
concerned
government and
NGO representatives
contact at zone
level
Community
representatives
(elders) contact
with government
and NGO regarding
their PA issues.
Institution_2 Process_Description
Institution_3
wereda
organizations
at zonal level
government
and NGOs to
zones
Government and
NGOs pass
communities issues to
zonal pertinent
organizations.
Process_Description
284
Page 7 of 8
Wereda Disaster
Risk Profile
Data_Collected_Date
September 2010
Disaster Risk Management and Food
Security Sector (DRMFSS)
Tuesday, September 30, 2014
Region S.N.N.P
Zone
SOUTH OMO
Wereda HAMER
Selected Indicator
Kebele Name
Interventions: Community Perception on Mediums to Influence DRM Actors - Community perception on the
effectiveness of institutional channels to use to influence DRM actors
Institution_1
Process_Description
Institution_2 Process_Description
Institution_3
Process_Description
GEDBAK
ASELE
Community elders
have to contact
with wereda
administration
office of PA.
Community
representatives
with government
and NGO
representatives at
PA level.
Selected community
elders have to
contact with wereda
administration office
representatives at
kebele level.
Community
representatives and
concerned
government
organizations
representative
should have to
contact at PA level.
wereda
administration
office to zonal
administration
office
wereda
administration office
to forward community
issues to zonal level
government officials.
NGO and
government
representative
s submit
community
issues to zonal
level
government
officials.
Concerned
government officials
forward communities
issues to zonal level
government officials.
285
Page 8 of 8
Data_Collected_Date
Region S.N.N.P
September 2010
Zone
SOUTH OMO
Tuesday, September 30, 2014
Wereda HAMER
Selected Indicator
Interventions: Community Perception on their Knowledge used in DRM Process -
Perception of the community on how their knowledge influences the priorities
and measures of DRM actors
KebeleName
Community_Suggestions
ASELE
DEGA KEJA
ERBORE
ERBORE
ERIYA
GEDBAK
GEDBAK
KOLA KEJA
LALA
MINOGELTI
MINOGELTI
Some NGOs, like farm Africa have given great value and place for our suggestion
and Knowledge during some activities planning that the organization implemented
in the PA, but for others they dont give value for our suggestions and knowledge.
NGOs working in our locality give priority for our suggestions and knowledge, but
government institutions do not give value.
Both organizations have not any problem on implementation of community
suggestions and knowledge to protect the community from flooding incidence. The
only problem is negligence of the community after flooding disasters passed.
Government and NGO usually accept our suggestions and knowledge, and they have
also tried to implement activities based on community’s idea, but the only problem
is negligence of more community members in the PA to support this organization to
materialized planned activities on time.
Our suggestions have great places and value at current condition, particularly NGOs
have been implementing activities based on our knowledge and suggestion.
NGOs working in our locality give priority for our suggestions and knowledge, but
government institutions do not give value.
At current condition NGOs give great attention for our suggestions and knowledge.
They have been implementing some activities based on our knowledge and
suggestion as well.
At this time many development works, hazard preventing and precaution methods
and responses are going on the wishes of communities however there are many un
touched problems and more to be done according to the need and plan of the
community. Farm Africa has more experience on working risk management
activities based on the knowledge and influence of community.
Our knowledge and suggestions have great value and acceptance by NGOs but
intention is given by government organizations.
Usually NGOs have great outlook for community’s suggestions and knowledge and
give priority for community’s knowledge rather than their idea. Therefore if
governments follow their (MGOs) experience promising changes will be recorded.
NGOs and some government offices give priority for our suggestions and knowledge,
therefore on most activities that have been conducting regarding disasters by
government and NGOs, community’s knowledge have had great value and influence.
286
Page 1 of 2
Data_Collected_Date
Region S.N.N.P
September 2010
Zone
SOUTH OMO
Tuesday, September 30, 2014
Wereda HAMER
Selected Indicator
Interventions: Community Perception on their Knowledge used in DRM Process -
Perception of the community on how their knowledge influences the priorities
and measures of DRM actors
KebeleName
Community_Suggestions
MRSHA
MRSHA
SHANKO
SHANKO
WENBAYNO
Community suggestions and knowledge has great influence on preventing measures
of disasters, particularly NGOs give priority for our suggestions to resolve disasters.
We hope for future more to be done as the knowledge and priority of the
community, even though there are some promising measures have been taking on
the NGO side.
NGOs working in our locality give priority for our suggestions and knowledge, but
government institutions do not give value.
At current condition our suggestion and knowledge have great place and
development alternatives have been implementing as the wishes of the community.
287
Page 2 of 2

Wereda Disaster
Risk Profile
Data_Collected_Date
September 2010
Region S.N.N.P
Zone SOUTH OMO
Disaster Risk Management
and Food Security Sector (DRMFSS)
Tuesday, September 30, 2014
Wereda HAMER
Selected Indicator
Interventions: Suggestions to improve preparedness - Interventions suggested by the community to development
actors to improve preparedness in the area
KebeleName
Measure 1
Comment 1
Measure 2
Comment 2
Measure 3
Comment 3
GEDBAK
SHANKO
DEGA KEJA
We need solutions for
usual problems
Relief for all community
during risk management.
Supply of food aid for
non PSNP beneficiaries.
There is no animal health
service in the PA many
shoats has been dying due
to lack of treatment
.animal health services
farthest 56 km from the
PA.
Ignoring our culture relief
has been allocated for
some beneficiaries
during hunger seasons non
PSNP beneficiaries are the
most vulnerable and they
also share PSNP
beneficiaries .this sharing
activities has been also
affected PSNP
beneficiaries and
affecting the recovery of
effort of them.
Frequent animal
health services,
available of sufficient
human drugs in the
clinics.
supply of livestock
disease and human
beings,
Provision of sufficient
livestock drugs and
establishment of
animal health
services.
288
During supply and
water
establishment
activities are vital
activities for
areas.
During every
outbreak of
livestock diseases
drug shortages
were the main
problems for rapid
response as the
information we
have had from
animal health
workers.
Page 1 of 6

Wereda Disaster
Risk Profile
Data_Collected_Date
September 2010
Region S.N.N.P
Zone SOUTH OMO
Disaster Risk Management
and Food Security Sector (DRMFSS)
Tuesday, September 30, 2014
Wereda HAMER
Selected Indicator
Interventions: Suggestions to improve preparedness - Interventions suggested by the community to development
actors to improve preparedness in the area
KebeleName
Measure 1
Comment 1
Measure 2
Comment 2
Measure 3
Comment 3
SHANKO
MRSHA
MINOGELTI
Supply of treatment and
vaccination drugs.
Seek solution for newly
introduced disaster
Supply of veterinary
drugs and frequent
follow up.
Usually response is
delayed when un
expected livestock disease
outbreak occurred.
Newly introduced hazards
have becoming beyond
the community capacity;
therefore they have to
seek solution for them
rather than us.
Livestock health problems
affected the community in
different ways such as
high cost of drugs, loss
due to death, impaired
food grain exchange, less
offer of prices.
Establish sustainable
disaster prevention
measures as drinking
water development,
range land habitation,
strengthening animal
health services.
Supply of relief to
reduce food shortage
Recurrent drought
effects (feed and
watering points
shortage) are still
un touched
activities which
are the main
bottle neck for
community
livelihood.
shortage of food
grain is
diminishing
livestock resource
year to year
,therefore we
need help from
govt.
289
Page 2 of 6
Wereda Disaster
Risk Profile
Data_Collected_Date
September 2010
Region S.N.N.P
Zone SOUTH OMO
Disaster Risk Management
and Food Security Sector (DRMFSS)
Tuesday, September 30, 2014
Wereda HAMER
Selected Indicator
Interventions: Suggestions to improve preparedness - Interventions suggested by the community to development
actors to improve preparedness in the area
KebeleName
MINOGELTI
ERBORE
Measure 1
Supply support for poor.
Support for maintenance
of temporary
settlements.
Comment 1
During drought the poor
are the most vulnerable to
food shortage as though
the well-being support at
some time.
After flooding we shift our
families to temporary
settlement areas without
damaging our properties.
Measure 2
Establish water
sources (for livestock
and human drinking)
Support of food
items.
Comment 2
Drinking water for
livestock and
human being is
becoming the
main problem of
the community
from time to
time.
This month is
harvest season, so
if the crop is
damaged before
harvest there is no
food grain for our
family until the
next crop season.
Measure 3
Comment 3
290
Page 3 of 6

Wereda Disaster
Risk Profile
Data_Collected_Date
September 2010
Region S.N.N.P
Zone SOUTH OMO
Disaster Risk Management
and Food Security Sector (DRMFSS)
Tuesday, September 30, 2014
Wereda HAMER
Selected Indicator
Interventions: Suggestions to improve preparedness - Interventions suggested by the community to development
actors to improve preparedness in the area
KebeleName
KOLA KEJA
ERBORE
Measure 1
Aware the community to
produce livestock fodder
and crop using small
irrigation.
Supply of additional
motorized boat and fuel.
Comment 1
Rain fed agriculture is
becoming despair in this
area from time to time
due to erratic rain fall.
No alternative except
evacuating flooding and
return to usual settlement
after flood reside.
Measure 2
Improve the available
range land to improve
pasture land.
Supply of mosquito
net to prevent from
malaria.
Comment 2
Although there is
vast (vacant
pasture land
without grass) for
search of grazing
is increasing due
poor management
and bush
encroachment of
pasture land.
After flooding
there is high
mosquito attack,
so to prevent the
community from
infection of
malaria, supply of
mosquito net is
crucial.
Measure 3
Comment 3
291
Page 4 of 6
Wereda Disaster
Risk Profile
Data_Collected_Date
September 2010
Region S.N.N.P
Zone SOUTH OMO
Disaster Risk Management
and Food Security Sector (DRMFSS)
Tuesday, September 30, 2014
Wereda HAMER
Selected Indicator
Interventions: Suggestions to improve preparedness - Interventions suggested by the community to development
actors to improve preparedness in the area
KebeleName
MRSHA
ERIYA
MRSHA
Measure 1
Supply of vaccination
and treatment of drugs.
Comment 1
Usually there is shortage
of vaccines and drugs
during occurrence of
anthrax.
On time supply of vet
and human drugs to
prevent and control
disease outbreak.
Shortage of drug during
outbreak of livestock
disease
Livestock and human
drugs should be available
at all times for rapid
response.
During livestock and
human disease
occurrence, responses
couldnt give as the wish
or need of the community
on time.
Measure 2
Regular visit and
conduct animal
health services at dry
season grazing areas.
During food shortage
seasons all herders
have to be given
relief rather than
screening
Close follow up
should be made
Comment 2
There is no
regular health
service at dry
season grazing
areas. Services
have been given
when out breaks
occurred.
Therefore regular
health services
reduce death
rates and
distribution
This activity has
been affected the
usual cooperation
level b/n the poor
and well-being.
if close followups
are made
regularly ,we will
get relief
responses from
government
Measure 3
Comment 3
292
Page 5 of 6
Wereda Disaster
Risk Profile
Data_Collected_Date
September 2010
Region S.N.N.P
Zone SOUTH OMO
Disaster Risk Management
and Food Security Sector (DRMFSS)
Tuesday, September 30, 2014
Wereda HAMER
Selected Indicator
Interventions: Suggestions to improve preparedness - Interventions suggested by the community to development
actors to improve preparedness in the area
KebeleName
Measure 1
Comment 1
Measure 2
Comment 2
Measure 3
Comment 3
GEDBAK
ASELE
WENBAYNO
Supply of drugs and
establishment of health
institutions.
Prepare regular
discussion forums and
reconciliation
Supply of veteterinary
drugs
Due to lack of health
institutions in the PA,
many livestock have been
affected during disease
out breaks.
As the previous
experiences, regular
discussion forums reduce
conflict level and loss of
lives.
To save the livestock
On time relief food
supply.
Food grain support.
Supply of
supplementary and
relief food.
Relief supply is
delayed during
hunger seasons, if
dole out after we
lost our assets.
The price of grains
is very high
293
Page 6 of 6

Wereda Disaster
Risk Profile
Data_Collected_Date
September 2010
Disaster Risk Management and
Food Security Sector (DRMFSS)
Tuesday, September 30, 2014
Region S.N.N.P
Zone SOUTH OMO
Wereda HAMER
Selected Indicator
Interventions: Suggestions to DRM Actors in the Area - Community suggested measures to DRM actors in the area
for effective DRM actions
Kebele Name Measure 1
Comment 1
Measure 2
Comment 2
Measure 3
GEDBAK
SHANKO
Community
suggestions and
knowledge have to
get great place to
deal and find
solutions for
disasters.
Communities
have better
knowledge on
disasters
Animal health
institutions, animal
health workers and
drugs have to be
availed to reduce
death of livestock.
Participation and
self-responsibility of
the community.
The community
can be identifying
their problems
more than out
sides.
food for work cash
during drought season
There is great
problem in animal
health services, No
animal health
service in the
kebele and the
nearest is 56 km
far from the PA.
This project can
support the
community
problems drought
time.
livestock
vaccinations have
to be conducted
annually like
other areas to
reduce livestock
loss particularly
drought
power(drought
oxen)
Establish
sustainable
drinking water
sources.
Comment 3
livestock
vaccination was
not given for
years
294
Page 1 of 10

Wereda Disaster
Risk Profile
Data_Collected_Date
September 2010
Disaster Risk Management and
Food Security Sector (DRMFSS)
Tuesday, September 30, 2014
Region S.N.N.P
Zone SOUTH OMO
Wereda HAMER
Selected Indicator
Interventions: Suggestions to DRM Actors in the Area - Community suggested measures to DRM actors in the area
for effective DRM actions
Kebele Name
DEGA KEJA
Measure 1
Disasters causes and
best remedies for
disasters should be
identified with the
collaboration of
community
government and
NGOs.
Comment 1
Without
identification of
disasters and
causes with
community
participation,
solutions will not
be success full
and hit their
target.
Measure 2
Community knowledge
and suggestions should
be given priority.
Comment 2
Communities have
very well known
the courses and
solutions of each
disaster except
livestock and
human disease
unexpected out
breaks and
solutions for it.
Measure 3
livestock
development and
problems have to
be overcome
first,
SHANKO
Introduce cash and
food for work
projects and
participate all the
community to
reduce income loss
of participants (loss
by sharing for
others)
As the experience
of PSNP
beneficiary’s food
and cash for work
projects have
significant
importance on
reducing hunger
and other
households
problems.
Support petty trading
groups and strengthen
cooperatives.
Petty trading and
cooperatives have
become better
income generating
means as some
experiences seen
in the PA.
Comment 3
Because of
livestock is main
stay of the
community for
decades.
295
Page 2 of 10

Wereda Disaster
Risk Profile
Data_Collected_Date
September 2010
Disaster Risk Management and
Food Security Sector (DRMFSS)
Tuesday, September 30, 2014
Region S.N.N.P
Zone SOUTH OMO
Wereda HAMER
Selected Indicator
Interventions: Suggestions to DRM Actors in the Area - Community suggested measures to DRM actors in the area
for effective DRM actions
Kebele Name
MRSHA
Measure 1
Government and
NGO organizations
are making much
support in
preventing
disasters, the only
problem is frequent
change of the
environment
condition.
Comment 1
There is good
initiation on some
development
activities as
water
development
activities to
overcome water
shortage.
Measure 2
Comment 2
Measure 3
MINOGELTI
Improve food for
work and cash for
work activities.
Food for work
and cash for work
activities improve
the diminishing
resources owing
to recurrent rain
shortage effects
on community
and its resources.
continues supply for
poor to reduce burden
of well-being whom
become exhausting due
to continuous help for
penniless
If government and
NGOs help for poor
and medium
wealthy in
continuous way,
recovery from
drought effects
will be easy and
suitable.
Water point
development
activities should
be improved and
should touch all
PAs to reduce
burden of few
developed water
points.
Comment 3
There are only
two water points
(hand dug wells)
in the PA that
serve more than
4500 people in
minutely PA .so
to reduce the
burden of two
additional water
points have to be
established.
296
Page 3 of 10
Wereda Disaster
Risk Profile
Data_Collected_Date
September 2010
Disaster Risk Management and
Food Security Sector (DRMFSS)
Tuesday, September 30, 2014
Region S.N.N.P
Zone SOUTH OMO
Wereda HAMER
Selected Indicator
Interventions: Suggestions to DRM Actors in the Area - Community suggested measures to DRM actors in the area
for effective DRM actions
Kebele Name
MINOGELTI
Measure 1
NGOs have to supply
more money for
cultural association
that have promising
income from
tourism.
Comment 1
NGOs give more
priority for
community
knowledge and
have better
resources
including
transportation
facilities to
follow up
activities.
Measure 2
Government have to
strengthen water
development activities,
health services and
forage development
activities.
Comment 2
Government
offices have good
capacity to
implement
sustainable health
services, better
than NGOs.
Measure 3
ERBORE
Both institutions
have better
management
alternatives to
prevent and deal
with disasters
rather than our
suggestions.
They have been
training the
community
continuously how
to prevent and
deal with
disasters based
on community
initiatives (skill
and knowledge of
community)
Comment 3
297
Page 4 of 10

Wereda Disaster
Risk Profile
Data_Collected_Date
September 2010
Disaster Risk Management and
Food Security Sector (DRMFSS)
Tuesday, September 30, 2014
Region S.N.N.P
Zone SOUTH OMO
Wereda HAMER
Selected Indicator
Interventions: Suggestions to DRM Actors in the Area - Community suggested measures to DRM actors in the area
for effective DRM actions
Kebele Name
KOLA KEJA
Measure 1
government should
give fast response
for sustainable
agriculture system
(small irrigation)
Comment 1
We have been
practicing rain
fed agriculture to
support livestock
income but no
change for
decades due to
rain fall
deterioration
instead it is
becoming worse
and worse. So for
change practicing
small irrigation
for fodder and
crop production is
profitable for our
community.
Measure 2
NGOs should also
support the community
on small irrigation
farming for both crop
and fodder production.
Comment 2
Measure 3
Range land
management
activities should
be give priority to
save livestock
Comment 3
Range condition
is becoming
worse and worse
owing to bush
and un palatable
plant
encroachment,
although we have
suitable range
land for livestock
production.
298
Page 5 of 10

Wereda Disaster
Risk Profile
Data_Collected_Date
September 2010
Disaster Risk Management and
Food Security Sector (DRMFSS)
Tuesday, September 30, 2014
Region S.N.N.P
Zone SOUTH OMO
Wereda HAMER
Selected Indicator
Interventions: Suggestions to DRM Actors in the Area - Community suggested measures to DRM actors in the area
for effective DRM actions
Kebele Name
ERBORE
Measure 1
Establishment of
irrigation schemes
for crop farming to
avoid or reduce
crop damage by
flooding and food
grain shortage.
Comment 1
Unexpected
flooding has been
attacking for the
last two years
due to absence of
other alternatives
rather than flood
retreat
agriculture and
settlement to
river side.
Therefore
settlements to
flood safe areas
will be changed if
irrigation canal
established for
crop farming.
Measure 2
regular awareness
creation for
communities for
permanent settlement
of flood to safe areas
in the same PA
Comment 2
Communities are
reluctant for
permanent
settlement at flood
safe areas in the
same PA
Measure 3
Comment 3
299
Page 6 of 10

Wereda Disaster
Risk Profile
Data_Collected_Date
September 2010
Disaster Risk Management and
Food Security Sector (DRMFSS)
Tuesday, September 30, 2014
Region S.N.N.P
Zone SOUTH OMO
Wereda HAMER
Selected Indicator
Interventions: Suggestions to DRM Actors in the Area - Community suggested measures to DRM actors in the area
for effective DRM actions
Kebele Name
LALA
Measure 1
Supply of more
livestock drugs as
community needs,
disasters that have
been affecting the
community and
their effects should
have to be
identified with the
participation of this
community.
Comment 1
Usually drug
supports were not
sufficient and
potent enough to
recover sick
animals.
Measure 2
Each response with
regard to each disaster
effects have to
sustainable based on
community suggestions
and knowledge.
Comment 2
disasters and their
solutions shouldn’t
be properly
identified without
the participation
of the community
Measure 3
Responses have to
be also on time
before
community losses
their assets.
ERIYA
sufficient supply of
veterinary and
human drugs at
clinics before
disease out breaks
occurred
Mostly during
disease out
breaks responses
delayed until
essential drugs
transported and
purchased.
Provision of logistics
for vaccination and
mass treatment
activities.
Relief supply to
all community
members during
food shortage
rather without
screening.
Comment 3
Mostly responses
for each disaster
was delayed and
done after the
community lost
their resources
and it was not
also sufficient for
recovery.
300
Page 7 of 10

Wereda Disaster
Risk Profile
Data_Collected_Date
September 2010
Disaster Risk Management and
Food Security Sector (DRMFSS)
Tuesday, September 30, 2014
Region S.N.N.P
Zone SOUTH OMO
Wereda HAMER
Selected Indicator
Interventions: Suggestions to DRM Actors in the Area - Community suggested measures to DRM actors in the area
for effective DRM actions
Kebele Name
MRSHA
Measure 1
Activities should be
identified
separately for the
government and
NGOs
Comment 1
Measure 2
All agricultural
activities should be
accomplished by the
government including
human health works by
health office.
Comment 2
Activities that are
performed by
government
(agriculture and
health) have
content the
community as the
previous
experiences.
Measure 3
Identification of
disaster and
responses except
relief works
should be done by
NGOs.
GEDBAK
Supply of drugs and
establishment of
health institution
with appropriate
health personals.
Lack of health
institution is the
main problem of
this community to
overcome human
and livestock
disease disasters.
Disasters and remedies
for disasters should be
identified with the
participation of
communities.
Communities have
better knowledge
to identify
disasters and
solutions better
than out sides.
Pesticides and
improved seeds
have to be
supplied on time
and sufficiently
to reduce yield
loss.
Comment 3
we have got good
responses on
preventing
disaster from
NGOs better than
government ,but
we have been
getting better
relief from govt.
Pests attack has
become the main
problem for loss
of yield.
301
Page 8 of 10

Wereda Disaster
Risk Profile
Data_Collected_Date
September 2010
Disaster Risk Management and
Food Security Sector (DRMFSS)
Tuesday, September 30, 2014
Region S.N.N.P
Zone SOUTH OMO
Wereda HAMER
Selected Indicator
Interventions: Suggestions to DRM Actors in the Area - Community suggested measures to DRM actors in the area
for effective DRM actions
Kebele Name
ASELE
Measure 1
There should be full
participation of all
community
members to identify
disasters and
solutions,
community
suggestion and
knowledge should
have get priority to
achieve preventing
plans.
Comment 1
Community know
very well the
causes of
disasters and
better solutions
as well.
Measure 2
Small irrigation
schemes should have to
be established at wait
river over flow to
overcome food grain
shortage.
Comment 2
There is seasonal
irrigation water
potential to put to
use for small scale
irrigation at Gola
area
Measure 3
Livestock drugs
should be
supplied and
health (livestock)
institutions have
to be established
in the PA.
Comment 3
There is no any
type of livestock
health institution
in the PA we
couldnt get
animal health
services at near
distance.
302
Page 9 of 10

Wereda Disaster
Risk Profile
Data_Collected_Date
September 2010
Disaster Risk Management and
Food Security Sector (DRMFSS)
Tuesday, September 30, 2014
Region S.N.N.P
Zone SOUTH OMO
Wereda HAMER
Selected Indicator
Interventions: Suggestions to DRM Actors in the Area - Community suggested measures to DRM actors in the area
for effective DRM actions
Kebele Name
WENBAYNO
Measure 1
Identified disasters
and solutions by
government and
NGOs
Comment 1
No relief
Measure 2
Activities should be
separately given for
governments and
NGOs.
Comment 2
NGOs come to our
village and aske
the problems of
water and feed
shortages and the
same questions
asked by the
government ,so
each should be
given its activities
to identify which
organizations has
done well and not.
Measure 3
Agricultural
activities (supply
of veterinary
drugs
,agricultural
inputs and
human health
service )
activities should
be done by
government
Comment 3
We have seen
many changes
and got good
responses on the
government side
on these
activities rather
than NGOs.
303
Page 10 of 10

Wereda Disaster
Risk Profile
Data_Collected_Date
September 2010
Region S.N.N.P
Zone SOUTH OMO
Disaster Risk Management and Food
Security Sector (DRMFSS)
Tuesday, September 30, 2014
Wereda HAMER
Selected Indicator
Economic Vulnerability: Community Suggestions to Improve Economic Situation - Community suggested measures
to improve the economic situation of the area
KebeleName
Measure 1
Comment 1
Measure 2
Comment 2
Measure 3 Comment 3
GEDBAK
SHANKO
DEGA KEJA
SHANKO
MRSHA
Introducing cash and
food for work projects
Livestock production is
the main economic
activity that will
improve the life of the
community
Introduce cash and food
for work projects
cash and food for work
projects
Improve the pasture
condition of the area
Crop farming is
deteriorating and
affecting income sources
due to shortage of farm
land and rain
The environment is better
Improving
vegetables farming
at back yard
We have getting
better income
from selling
vegetables
Crop production
becomes high
The ecology is
good but there is a
shortage of rain
fall
Food and cash for work
projects are good to
improve income and
saving
Cash and food for work
projects help the
community
Improving livestock
production by
improving
management
system and range
land condition
including bee
keeping system
Petty trading
farming
cooperatives
improve animal
health service
304
There is suitable
environment for
keeping livestock
which is the best
income source for
this community
Protect large
trees
Page 1 of 5
Wereda Disaster
Risk Profile
Data_Collected_Date
September 2010
Region S.N.N.P
Zone SOUTH OMO
Disaster Risk Management and Food
Security Sector (DRMFSS)
Tuesday, September 30, 2014
Wereda HAMER
Selected Indicator
Economic Vulnerability: Community Suggestions to Improve Economic Situation - Community suggested measures
to improve the economic situation of the area
KebeleName
Measure 1
Comment 1
Measure 2
Comment 2
Measure 3 Comment 3
MINOGELTI
MINOGELTI
ERBORE
Increasing the member
of the beneficiaries in
cash for work and food
for work
program(increase the
number of PSNP
beneficiaries in the PA)
Help the community
through PSNP projects
Enhance crop
production using
seasonal irrigation
system
This is the only option for
this community if the
current condition
continues without
improvement therefore to
reduce more sale of
livestock for grain ,PSNP
beneficiaries should be
increased
Food purchasing is
depleting community’s
resource
Woito river is not
permanent river, so
seasonal irrigation system
is the only alternative to
improve crop failures
Frequent follow up
of conflicts that
will arise among
Borena, Dassenech
and hammer(to
reduce livestock
looting and to use
common grazing
and watering points
without dispute)
Aware the
community to
conserve natural
resources
Livestock fodder
improvement to
improve livestock
produce
The depletion of
natural resource is
becoming the main
case of livestock
resource depletion
Supply of
food grain at
fair prices or
at fair
goat-grain
exchange
Introduce
more food
and cash for
work projects
Less price
offer for
goats is
affecting the
main stay of
the
community
305
Page 2 of 5

Wereda Disaster
Risk Profile
Data_Collected_Date
September 2010
Region S.N.N.P
Zone SOUTH OMO
Disaster Risk Management and Food
Security Sector (DRMFSS)
Tuesday, September 30, 2014
Wereda HAMER
Selected Indicator
Economic Vulnerability: Community Suggestions to Improve Economic Situation - Community suggested measures
to improve the economic situation of the area
KebeleName
KOLA KEJA
ERBORE
LALA
Measure 1
Close and continuous
community awareness
about livestock
marketing
Comment 1
To lead sustainable life
and to reduce the means
of hazard
Crop and vegetable
farming using irrigation
(small scale irrigation)
Cash and food for work
projects
there is vast fertile
vacant land and
temporary running river
(woito) which have high
potential for irrigation
These activities save
livestock resources and
fill food gap
Measure 2
farm practice at
potential areas
(farming around
omo river by
irrigation)
farming of cash
crops(sesame)
Comment 2
To reduce the
level of hunger
and livestock loss
for medium class
herders
Measure 3
introduce
alternate
income
generating
activities to
the majority
of the
community(ca
sh or food for
work
activities)
Petty trading
in groups or
association
Comment 3
crop farming beside
permanent rivers
(omo river)
Rain fed
agriculture is
becoming
despairing due to
deterioration of
rain fall
Improve
livestock
production
system by
improving the
management
system
306
Page 3 of 5

Wereda Disaster
Risk Profile
Data_Collected_Date
September 2010
Region S.N.N.P
Zone SOUTH OMO
Disaster Risk Management and Food
Security Sector (DRMFSS)
Tuesday, September 30, 2014
Wereda HAMER
Selected Indicator
Economic Vulnerability: Community Suggestions to Improve Economic Situation - Community suggested measures
to improve the economic situation of the area
KebeleName
Measure 1
Comment 1
Measure 2
Comment 2
Measure 3 Comment 3
ERIYA
MRSHA
GEDBAK
Improving the range
land condition to
improve livestock
produce which is the
main economic activity
of the community
The degrading natural
environment should be
improved (range land
management activities
should be given focus to
improve livestock
resource)
Livestock production
(productivity and
produce) is decreasing
due to pasture land
diminishing
Cash and food for work
projects
These projects are good
Improve natural
resource to
improve honey
production which is
also the main
income generating
means of pastoral
communities
Fodder saving and
production
activities should be
introduced in the
area
Rearing domestic
chicken
the area was rich
with many bee
flora before it
cleared off,
therefore if it
renewed ,honey
production will be
improved
to save livestock
life in bad
condition
Introduce
cash and food
for work
projects
More
awareness
should be
given for well
off to sell
their
livestock to
market at
good
conditions
Vegetable
farming at
back yard
over grazing
is one of the
causes of
range land
degradation
in the area
due to
resistance of
more wealthy
for livestock
market
307
Page 4 of 5

Wereda Disaster
Risk Profile
Data_Collected_Date
September 2010
Region S.N.N.P
Zone SOUTH OMO
Disaster Risk Management and Food
Security Sector (DRMFSS)
Tuesday, September 30, 2014
Wereda HAMER
Selected Indicator
Economic Vulnerability: Community Suggestions to Improve Economic Situation - Community suggested measures
to improve the economic situation of the area
KebeleName
ASELE
Measure 1
Cash and food for work
projects
Comment 1
This projects support the
community during peak
dry and shortage seasons
Measure 2
Crop farming using
Woito river over
flow
Comment 2
Some community
households are
practicing using
over flow and
harvesting better
yield
Measure 3 Comment 3
308
Page 5 of 5

Wereda Disaster
Risk Profile
Disaster Risk Management and
Food Security Sector (DRMFSS)
Data_Collected_Date
September 2010
Tuesday, September 30, 2014
Region S.N.N.P
Selected Indicator
Zone SOUTH OMO
Community Awareness of Disaster Risk Management System and Actors
Wereda HAMER
Kebele Name
Institution 1 Responsibility
Activity Institution 2 Responsibility
Activity
Institution 3 Responsibility Activity
GEDBAK
Pastoralist
developmen
t office
Provide
agricultural
extension
services
Provide
animal
health
services,
provide
agricultur
al
extension
service
Health
office
Provide health
service
Provide
mosquito
net,
provide
child
vaccination
, and
provide
treatments
Catholic
church
support
health,
cooperative
and
education
office
Support
vaccinati
on,
program,
support
cooperati
ves,
support
alternati
ve basic
educatio
n
program
me (they
cover all
cost of
ABE
program
me
including
recur
renting
teachers
309
Page 1 of 8

Wereda Disaster
Risk Profile
Disaster Risk Management and
Food Security Sector (DRMFSS)
Data_Collected_Date
September 2010
Tuesday, September 30, 2014
Region S.N.N.P
Selected Indicator
Zone SOUTH OMO
Community Awareness of Disaster Risk Management System and Actors
Wereda HAMER
Kebele Name
SHANKO
DEGA KEJA
SHANKO
Institution 1 Responsibility
Pastoralist
developmen
t office
Supply animal
health
Pastoralist
developmen
t office
Provide
agricultural
services
Pastoralist
developmen
t office
Render
agricultural
services and
relief supply
Activity Institution 2
Supply
relief
during
food
shortage
Health
office
Provide
animal
health
services,
provide
relief, and
supply
seeds
Health
office
Supply
relief
during
drought,
provide
animal
health
services
PCDP
Responsibility
Provide
mosquito net
Provide health
service
Support the
community in
infrastructure
development
Activity
Supply
mosquito
net
Institution 3
Police and
justice
Responsibility
Protect
criminals
Activity
Prevent
the
conflict
Supply
mosquito
net,
conduct
child
vaccination
Water
resource
office
Establish
infrastruct
ures;
support
the
community
in cash for
work
projects
Health
office
Repair water
points
Repaired
water
points
(shallow
hand
pump
wells)
Provide
health
services
Conduct
child
vaccinati
on,
supply
mosquito
net
310
Page 2 of 8

Wereda Disaster
Risk Profile
Disaster Risk Management and
Food Security Sector (DRMFSS)
Data_Collected_Date
September 2010
Tuesday, September 30, 2014
Region S.N.N.P
Selected Indicator
Zone SOUTH OMO
Community Awareness of Disaster Risk Management System and Actors
Wereda HAMER
Kebele Name
MRSHA
MINOGELTI
Institution 1 Responsibility
Farm Africa
Working on
disasters
prevention
activities
Pastoralist
developmen
t office
supply relief
and animal
health service
Activity Institution 2
Developin
g watering
points,
train food
security
committe
e
Pastoralist
developmen
t Office
Responsibility
Supply relief,
collect early
warning
indicators
Provide
relief,
treat
livestock,
and
collect
early
warning
indicators
Farm Africa
provide help for
poor women
Activity
Institution 3
Supply
food relief,
provide
veterinary
service
Health
office
Responsibility
Health
surveillance
and provide
health
service
Give
support for
poor
women
Health
office
Provide
health
services
Activity
Conduct
routine
vaccinati
on for
children,
supply
mosquito
net
Provide
health
services,
vaccinate
children
311
Page 3 of 8

Wereda Disaster
Risk Profile
Disaster Risk Management and
Food Security Sector (DRMFSS)
Data_Collected_Date
September 2010
Tuesday, September 30, 2014
Region S.N.N.P
Selected Indicator
Zone SOUTH OMO
Community Awareness of Disaster Risk Management System and Actors
Wereda HAMER
Kebele Name
MINOGELTI
ERBORE
Institution 1 Responsibility
Pastoralist
developmen
t office
Agricultural
services and
relief supply
Pastoralist
developmen
t office
give response
for hazards
Activity
Supply
relief,
provide
animal
health
services
Institution 2
Farm Africa
Responsibility
Support during
hazards
Pass early
warning
informatio
n to the
communit
y, collect
early
warning
indicators
Farm Africa
give response
for hazards
Activity
Institution 3
supply
goats for
poor
women
,train early
warning
committee
Health
office
Train
kebele
food
security
committee
, collect
and
transmit
early
warning
indicators,
provide
fuel for
motorized
boat
Responsibility
Provide
health
services
Activity
Provide
health
services,
conduct
seasonal
vaccinati
ons,
provide
mosquito
net
312
Page 4 of 8

Wereda Disaster
Risk Profile
Disaster Risk Management and
Food Security Sector (DRMFSS)
Data_Collected_Date
September 2010
Tuesday, September 30, 2014
Region S.N.N.P
Selected Indicator
Zone SOUTH OMO
Community Awareness of Disaster Risk Management System and Actors
Wereda HAMER
Kebele Name
Institution 1 Responsibility
Activity Institution 2 Responsibility
Activity
Institution 3 Responsibility Activity
KOLA KEJA
Early
warning
committee
submit weekly
early warning
reports
collect
early
warning
indicators
from each
villages in
PA
wereda
early
warning WP
give response
for hazards
Collect and
submit
weekly and
monthly
early
warning
reports to
zone
Farm Africa
give response
for hazards
Train
early
warning
committe
e and
support
PA poor
by giving
seed
money
for petty
trading
and other
income
generatin
g
resources
Train
wereda
EW
experts
and DA
313
Page 5 of 8
Wereda Disaster
Risk Profile
Disaster Risk Management and
Food Security Sector (DRMFSS)
Data_Collected_Date
September 2010
Tuesday, September 30, 2014
Region S.N.N.P
Selected Indicator
Zone SOUTH OMO
Community Awareness of Disaster Risk Management System and Actors
Wereda HAMER
Kebele Name
ERBORE
LALA
Institution 1 Responsibility
Pastoralist
developmen
t office
Provide
agricultural
extension
services
Pastoralist
developmen
t office
Provide
agricultural
extension
services
Activity Institution 2
Provide
animal
health
services,
supply
seeds,
supply
relief
Health
office
Provide
agricultur
al
extension
services,
conduct
animal
treatment
and
vaccinatio
n
services,
supply
seed
Health
office
Responsibility
provide health
services
provide health
services
Activity
Institution 3 Responsibility
Provide
health
services,
supply
mosquito
net,
conduct
vaccination
Health
office
Regular
follow up of
health
condition
Provide
health
services,
supply
mosquito
net,
conduct
vaccination
Water
development
office
Repair water
points
Activity
Supply of
mosquito
net
Maintain
damaged
shallow
water
wells
314
Page 6 of 8
Wereda Disaster
Risk Profile
Disaster Risk Management and
Food Security Sector (DRMFSS)
Data_Collected_Date
September 2010
Tuesday, September 30, 2014
Region S.N.N.P
Selected Indicator
Zone SOUTH OMO
Community Awareness of Disaster Risk Management System and Actors
Wereda HAMER
Kebele Name
ERIYA
MRSHA
GEDBAK
Institution 1 Responsibility
Pastoralist
developmen
t office
give respond to
hunger and
livestock
disease
Pastoralist
developmen
t office
Provide
agricultural
extension
services
Activity Institution 2
Collect
early
warning
indicators
,
distribute
relief
Farm Africa
Supply
food aid,
provide
agricultur
al
extension
services
Health
office
Responsibility
give response
for hazards
Provide health
service
Pastoralist
developmen
t office
Provide
agricultural
extension
services
Conduct
livestock
vaccinatio
n, supply
food aid,
supply
seed
Farm Africa
support kebele
early warning
committee
Activity
Institution 3
Train PA
food
security
committee
, supply
goats
Police and
justice
office
Responsibility
protect crime
and conflict
Activity
Train the
communi
ty about
the
effect of
crime
Conduct
child
vaccination
, supply
mosquito
net,
conduct
treatment
Train
kebele
early
warning
committee
, support
of vet
drugs,
supply
seed
Health
office
Provide
health
services
Supply of
mosquito
net,
conduct
child
vaccinati
on and
other
health
services
315
Page 7 of 8

Wereda Disaster
Risk Profile
Disaster Risk Management and
Food Security Sector (DRMFSS)
Data_Collected_Date
September 2010
Tuesday, September 30, 2014
Region S.N.N.P
Selected Indicator
Zone SOUTH OMO
Community Awareness of Disaster Risk Management System and Actors
Wereda HAMER
Kebele Name
Institution 1 Responsibility
Activity Institution 2 Responsibility
Activity
Institution 3 Responsibility Activity
ASELE
Farm Africa
support the
community in
capacity
building
Train the
communit
y, how to
submit
early
warning
Pastoralist
developmen
t Office
Support the
community
Collect
early
warning
informatio
n and
supply
indicators
relief
316
Page 8 of 8
Wereda Disaster
Risk Profile
Data_Collected_Date
September 2010
Disaster Risk Management and Food
Security Sector (DRMFSS)
Tuesday, September 30, 2014
Region S.N.N.P
Selected Indicator
Zone SOUTH OMO
Wereda HAMER
Community Perception of DRM System and Actors - Perception of the community on the effectiveness of DRM
system in helping them to prevent, cope and recover from disasters
KebeleName
GEDBAK
SHANKO
DEGA KEJA
Prevention
All mentioned institutions
are far from the PA around
56 km. We didnt get fast
responses during hunger
and livestock disease
incidences. Therefore their
measured are not effective.
All the government sectors
and NGO activities have
helped the community on
preventing livestock
disease and malaria out
break and the organization
can protect from hunger.
Animal health services
,human health services and
support provided by Farm
Africa have helped the
community greatly to
prevent from disasters of
livestock and human
disease.
Coping
During hunger seasons and
human disease out breaks we
have got food aid and
treatments however food aid
was not sufficient for all the
community until the arrival
of good harvest.
Food aid, livestock
vaccination and treatment
activities child vaccination
and mosquito net supply.
Food aid and animal health
services during hunger and
disease out breaks have
backed the community.
Recovery
Except relief food all
activities didnt help the
community to recover
from livestock and human
element and drought
problem.
All the activities have had
great importance on
recovery phase.
Overall_Effectiveness
It is beyond our capacity to
evaluate government
organizations short falls to
achieve all activities on
time.
It is beyond over our
capacity about the
governmental policy.
All the above mentioned
activities were effective
except lack of response or
progress on recently
introduced sheep disease
which is new unspecific
and has high killing rate.
More activities have been
effective, even though we
have had some prevalence
on some activities as
screening for relief supply
(screening wealthy and
poor) and delay on animal
disease outbreak response)
317
Page 1 of 9

Wereda Disaster
Risk Profile
Data_Collected_Date
September 2010
Disaster Risk Management and Food
Security Sector (DRMFSS)
Tuesday, September 30, 2014
Region S.N.N.P
Selected Indicator
Zone SOUTH OMO
Wereda HAMER
Community Perception of DRM System and Actors - Perception of the community on the effectiveness of DRM
system in helping them to prevent, cope and recover from disasters
KebeleName
SHANKO
MRSHA
Prevention
Health office, animal
health services and cash for
work projects have helped
the community in
preventing from disasters
i.e. health services
(vaccination programmes
and mosquito net supply)
have prevented from
disease of livestock and
human. Cash for work
projects have also
prevented from hunger.
Mosquito net supply has
helped the community on
preventing malaria hazards,
but except for water
development activities and
animal health services,
hunger problems haven’t
got solution yet.
Coping
food aid supplies, cash for
work projects and curative
treatments for livestock
have helped in copping
hunger and disease disasters
No problem on relief work,
we have been getting all
resources that allocated by
the government, but the
main problem is
sustainability to get relief
from food shortage.
Recovery
Food supply have helped
in recovery from disasters
i.e. we have saved many
livestock from sale that
will help for the next
incidence
Overall_Effectiveness
We dont know why some
activities hadnt been
implemented as promised.
Therefore it is beyond our
capacity to evaluate why
some responses delayed
during disease outbreak
(both in livestock and
human)
We get relief on the time
of supply, but no
sustainable recovery.
The community have no the
capacity to identify short
falls of these organizations,
but our capacity is limited
only during the current
supply when problems
arises.
318
Page 2 of 9

Wereda Disaster
Risk Profile
Data_Collected_Date
September 2010
Disaster Risk Management and Food
Security Sector (DRMFSS)
Tuesday, September 30, 2014
Region S.N.N.P
Selected Indicator
Zone SOUTH OMO
Wereda HAMER
Community Perception of DRM System and Actors - Perception of the community on the effectiveness of DRM
system in helping them to prevent, cope and recover from disasters
KebeleName
MINOGELTI
MINOGELTI
Prevention
Both organizations have
worked very well on
prevention of livestock and
human disease.
Coping
PDO has been working
effectively on relief works
and give good advice for the
community to utilize
livestock resources properly
to cope the recurrent
drought.
Livestock and human health
sectors activities help in
preventing human health
and animal health
disasters, but preventing
crop shortage, livestock
feed and water shortage is
difficult for organizations.
Relief support and livestock
market awareness given by
pastoral development office
have great importance on
coping food shortage and sell
of more livestock.
Recovery
Recovery is becoming
difficult to the majority of
the community except
PSNP beneficiaries who
gets support for 6 months
or they have great support
for consecutive 6 months
Health sector activities
(animal and human) help
in recovering from loss of
livestock by some fatal
diseases like anthrax and
supply of mosquito net
help in recovering from
frequent ailment of
(malaria.
Overall_Effectiveness
Majority of the community
is this PA should have got
support as PSNP
beneficiaries either by
government and NGOs
particularly NGOs support
should be increased and
holistic rather than helping
few penniless from PA.
We have no capacity to
evaluate all activities of
organizations or short fall
of each organization.
319
Page 3 of 9

Wereda Disaster
Risk Profile
Data_Collected_Date
September 2010
Disaster Risk Management and Food
Security Sector (DRMFSS)
Tuesday, September 30, 2014
Region S.N.N.P
Selected Indicator
Zone SOUTH OMO
Wereda HAMER
Community Perception of DRM System and Actors - Perception of the community on the effectiveness of DRM
system in helping them to prevent, cope and recover from disasters
KebeleName
ERBORE
Prevention
Both organization have had
a strong effort to prevent
the community from
disasters, they have also
fast response during rapid
onset of flood.
Coping
They provide necessary
needs of the community that
can help each house hold in
curing from this incidence.
Recovery
All type of supplies has
been sufficient for each
community house hold
which could recover from
flood effect.
Overall_Effectiveness
we dont have any
prevalence on the
government and NGO side
in preventing and recovery
process of flood effect but
the only problem was and
will be on the community
side i.e. most of us are not
willing to accept preventive
measures from both
organizations response.
320
Page 4 of 9

Wereda Disaster
Risk Profile
Data_Collected_Date
September 2010
Disaster Risk Management and Food
Security Sector (DRMFSS)
Tuesday, September 30, 2014
Region S.N.N.P
Selected Indicator
Zone SOUTH OMO
Wereda HAMER
Community Perception of DRM System and Actors - Perception of the community on the effectiveness of DRM
system in helping them to prevent, cope and recover from disasters
KebeleName
KOLA KEJA
Prevention
Farm Africa has been
working effectively in the
PA for 5 years to alleviate
disaster and the community
has got several preventing
and precaution methods
from disasters through
repeated training and close
follow up by this
organization.
Coping
government office (pastoral
development office) is also
working well since last year
by distributing relief on time
and giving response when
disasters occurs in our PA
(livestock disease hinder).
DA s also pays close follow
up to submit early warning
indicators on time.
Recovery
Farm Africa and
government office have
been working well in
support of our community
due to hunger season, but
we need more help for
sustainable recovery from
food and livestock feed
shortage.
Overall_Effectiveness
During hunger season food
transfer is delayed,
however we dont have
information about the
cause of delay. Disasters
and causes have been
collected so many times by
different organization
inclusive of government,
but we dont get relief from
hunger, therefore we want
the change of rain fed
agriculture through more
endeavour (effort) of
governments and NGOs.
321
Page 5 of 9

Wereda Disaster
Risk Profile
Data_Collected_Date
September 2010
Disaster Risk Management and Food
Security Sector (DRMFSS)
Tuesday, September 30, 2014
Region S.N.N.P
Selected Indicator
Zone SOUTH OMO
Wereda HAMER
Community Perception of DRM System and Actors - Perception of the community on the effectiveness of DRM
system in helping them to prevent, cope and recover from disasters
KebeleName
ERBORE
LALA
Prevention
Mosquito net supply, animal
vaccination, and seed
supply activities have
helped the community from
preventing malaria
infection and animal
disease out breaks.
Coping
Supply of food aid and
support of temporary
settlement materials for
displaced community have
helped to recover from flood
disasters.
Livestock health services
and human health services
have been helped the
community to prevent from
loss of livestock resources
which is the main lively
hood.
Relief food supply, mosquito
net supply, controlling
vaccination and treatment
programmes backed the
community to cope during
diseases without breaks and
food shortage (hunger)
season.
Recovery
NGOs and government
offices have helped the
community to recover
from flood disasters by
making settlements,
fulfilling utensils and
various livestock and
human treatments
institutions, but the
communities are not
willing to leave.
All the above activities
have helped the
community to recover
from hunger and loss of
livestock disasters.
Particularly relief food
supplies have saved our
resources from sell or
lost.
Overall_Effectiveness
No we haven’t seen any
short falls from government
offices and NGOs activities.
No we dont know. It is
difficult to evaluate this by
pastoralist and rural
community.
322
Page 6 of 9

Wereda Disaster
Risk Profile
Data_Collected_Date
September 2010
Disaster Risk Management and Food
Security Sector (DRMFSS)
Tuesday, September 30, 2014
Region S.N.N.P
Selected Indicator
Zone SOUTH OMO
Wereda HAMER
Community Perception of DRM System and Actors - Perception of the community on the effectiveness of DRM
system in helping them to prevent, cope and recover from disasters
KebeleName
ERIYA
MRSHA
Prevention
Animal and human health
services (vaccination
activities) have helped us
for preventing livestock
disease, awareness creation
activities given by police
and justice office have
helped also to prevent from
committing crimes.
We dont know for future,
but till last year (2002)
both organizations have
been supporting the
community especially early
warning work process.
Coping
During outbreak of disease
and hunger responses given
by pastoral development
office used the community
to cope the existing
(appeared) disasters.
Nothing left from the
government and the NGO
side, but what is left is from
the community .i.e. our
community is resistant for
change, even relief work is
difficult for government
body due to lack of clarity
from the community.
Recovery
All the above activities
have helped us recovering
from the appeared
disasters.
Overall_Effectiveness
May be lack of sufficient
drugs at hand or in vet and
human health clinics
hampered activities to be
conducted frequently right
after the occurrence of
incidences.
As mentioned before the
government and NGO have
been supported us during
food shortage and other
development activities
which can reduce
disaster, but weakness are
remaining in the
community.
We dont claim any
organization for disaster
responses, but we have
grievance for not getting
water shortage responses
although several problem
identification assessments
made and water shortage
problem prioritized first so
that activities shouldnt be
promised for the
community, if there is no
money at hand for the
accomplishment of this
activity.
323
Page 7 of 9

Wereda Disaster
Risk Profile
Data_Collected_Date
September 2010
Disaster Risk Management and Food
Security Sector (DRMFSS)
Tuesday, September 30, 2014
Region S.N.N.P
Selected Indicator
Zone SOUTH OMO
Wereda HAMER
Community Perception of DRM System and Actors - Perception of the community on the effectiveness of DRM
system in helping them to prevent, cope and recover from disasters
KebeleName
GEDBAK
ASELE
Prevention
Except supply of mosquito
net and child vaccination
all activities havent
prevented from effects of
disaster.
activities conducted by
police and justice office
about reconciliation with
Borena other ethnics has
helped the community to
prevent from conflict and
reduced its level and
duration ,supply of
mosquito net and relief
food aid have helped to
prevent from severe hunger
and malaria.
Coping
Food aid activity has helped
the community to escape
hunger seasons.
Food aid supplies have
helped to cope hunger during
severe food shortage
seasons.
Recovery
However food supply was
delayed, it helped us to
recover from hunger
during peak food shortage
seasons.
At the time of disaster all
activities have helped to
cope the disaster, but we
couldnt recover from
food, and livestock feed
shortages yet.
Overall_Effectiveness
We dont know why all
activities hadnt been
effective.
No, we couldnt have
capacity to evaluate why
all government and NGOs
activities havent been
effective. To recover us
from hunger and livestock
feed and water shortages.
324
Page 8 of 9
Wereda Disaster
Risk Profile
Data_Collected_Date
September 2010
Disaster Risk Management and Food
Security Sector (DRMFSS)
Tuesday, September 30, 2014
Region S.N.N.P
Selected Indicator
Zone SOUTH OMO
Wereda HAMER
Community Perception of DRM System and Actors - Perception of the community on the effectiveness of DRM
system in helping them to prevent, cope and recover from disasters
KebeleName
WENBAYNO
Prevention
Both organizations asset
the community in
controlling some disasters
and prevention of some
(relief for hunger and
livestock vaccination and
treatment for disease
disasters)
Coping
Early warning work process
help (regional, zonal and
federal) very well during
prolonged drought in
supplying food.
Recovery
The organization EW
provides food items until
good seasons.
Overall_Effectiveness
We travel along distance to
take relief due to absence
of distribution points in our
areas. So grain store should
be established near our and
neighbouring village.
325
Page 9 of 9
Data_Collected_Date
Region S.N.N.P
September 2010
Zone
SOUTH OMO
Tuesday, September 30, 2014
Wereda HAMER
Selected Indicator
Major Public Interventions Desired - Percentage of households by type of
intervention desired
Major public interventions desired by the community
Degree of Importance for the community
Better job
1st
2nd
3rd
0.80
0.97
0.65
Cash transfers/social assistance
2.24
4.35
3.55
Cash-for-work activities (not employment)
12.00
35.10
0.16
Food aid
29.60
6.12
9.37
Food-for-work activities
35.50
8.37
7.75
Fuel subsidies
0.16
0.00
31.70
Medical assistance
5.59
13.50
4.20
Micro-credit programmes
5.59
11.80
10.30
School feeding for children
0.32
0.97
0.16
Subsidized health care
1.76
3.06
19.40
Supplementary feeding for women and young children
5.91
14.50
9.37
326
Page 1 of 1
WDRP Indicators
Other Community Characteristics
327

Wereda Disaster
Risk Profile
Data_Collected_Date
September 2010
Region S.N.N.P
Selected Indicator
Kebele Name
Zone SOUTH OMO
Capacity: Community Based Organizations in the Wereda
Name_Of_Organization
Est._Year
Formal/Informal
HEDBAK
Warcha purchasing
cooperative
2002
DEGA KEJA
loya dele women association
2001
SHANKO
BESSA MEJAN
MINOGELTI
KOLA KEJA
Pastoralist saving and credit
cooperative
no any type of formal and
informal association in PA
There is no any type of
formal informal organization
Voluntary saving group
2002
2000
ERBORE
LALA
Limo youth association
Lala women cooperative
2000
ERIYA
Pekela
1998
328
Disaster Risk Management and Food
Security Sector (DRMFSS)
Tuesday, September 30, 2014
Wereda HAMER
Type of Members
Voluntary 35 men
groups
women
Male and female
members
Male and female
members
Activity
"Purchasing and selling of
shop commodities, food,
grain, food oil, coffee,
brewing local drinks which is
called borde for local
community(for sale)
They voluntary save money
for any bad happenings
They voluntary save money
for any bad happenings
Women
Kuyle and Gonderoba
youth
Women
Voluntary all adult
groups
They contribute money and
save for the utilization of bad
times(hunger, health
familiarity)
Trading of livestock
Petty trading (they trade
food grain, coffee busk,
goats)
Food and coffee busk trading
Page 1 of 2

Wereda Disaster
Risk Profile
Data_Collected_Date
September 2010
Region S.N.N.P
Selected Indicator
Kebele Name
Zone SOUTH OMO
Capacity: Community Based Organizations in the Wereda
Name_Of_Organization
Est._Year
Formal/Informal
MRSHA
GEDBAK
There is no any type of
formal informal organization
Warecha multipurpose
cooperation
2002
Disaster Risk Management and Food
Security Sector (DRMFSS)
Tuesday, September 30, 2014
Wereda HAMER
Type of Members
Activity
voluntary man and
women
"trading of shop commodities
(soap,salt,tradational
ornaments,
329
Page 2 of 2
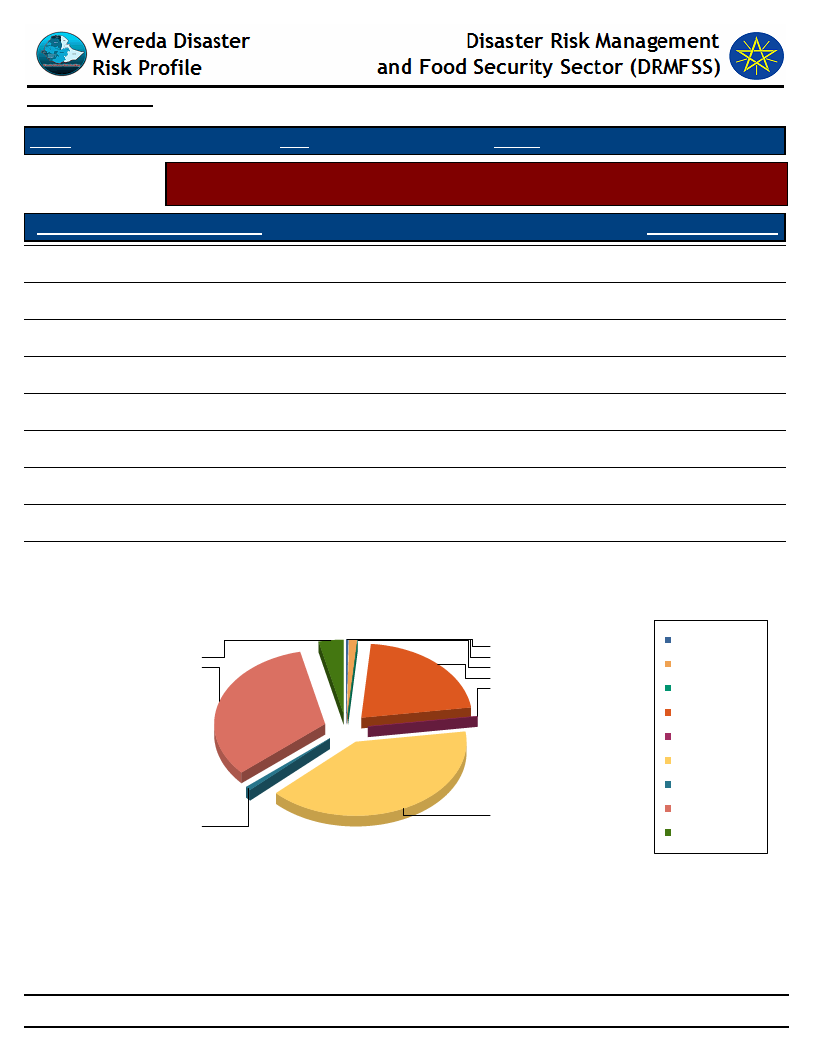
Data_Collected_Date
September 2010
Tuesday, September 30, 2014
Region S.N.N.P
Zone SOUTH OMO
Wereda HAMER
Selected Indicator
Supporting Agencies against Disasters - Percentage of households by supporting
institutions to handle or recover from disaster damages
Supporting Agencies Against Disasters
Response_Percentage
National or local authorities
40.00
International NGOs (e.g. UN organizations, ICRC, etc.)
21.20
Local NGOs
0.17
Family members in the same community
0.17
Friends and neighbors in the same community
0.17
Support via contacts working for the authorities
3.67
Support via contacts working for NGOs
32.80
Religious sources such as the mosque
0.67
Food Aid
1.17
Supporting Agencies Against Disasters
3.7
32.8
0.7
0.2
1.2
0.2
21.2
0.2
40
Family members in the
same community
Food Aid
Friends and neighbors in
the same community
International NGOs (e.g.
UN organizations, ICRC,
etc.)
Local NGOs
National or local
authorities
Religious sources such
as the mosque
Support via contacts
working for NGOs
Support via contacts
working for the
authorities
330
Page 1 of 1
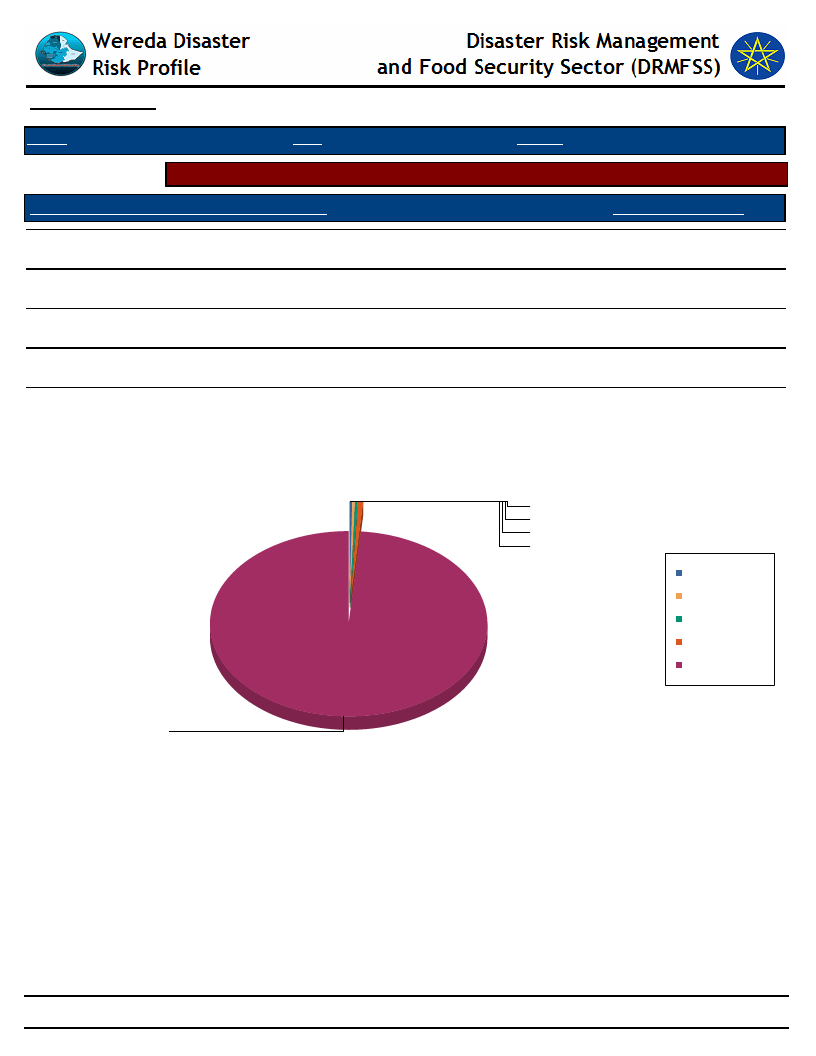
Data_Collected_Date
September 2010
Tuesday, September 30, 2014
Region S.N.N.P
Zone SOUTH OMO
Wereda HAMER
Selected Indicator
Types of support received by households during disasters
Type of Support Provided By Supporting Agencies
Response_Percentage
Emergency aid (food, water, shelter, etc.)
98.70
Capital for re-construction of house and property
0.33
Access to loan for re-construction
0.33
Access to capital or loan for adaptation/protection measures
0.16
DK
0.49
Type of Support Provided By Supporting Agencies
0
0
0
0
Access to capital or loan
for adaptation/protection
measures
Access to loan for
re-construction
Capital for
re-construction of house
and property
DK
Emergency aid (food,
water, shelter, etc.)
99
331
Page 1 of 1

Wereda Disaster
Risk Profile
Data_Collected_Date
September 2010
Disaster Risk Management and
Food Security Sector (DRMFSS)
Tuesday, September 30, 2014
Region S.N.N.P
Zone SOUTH OMO
Wereda HAMER
Selected Indicator
Government Actors in the Field of Disaster Risk Management - Government actors and their activities in the field
of Disaster Risk Managements
Government Institution
Activity
Description
Activity
Description Activity
Description Activity Description
Water Resource
Development Office
Health Office
Water office of the
woreda
Making weekly and
monthly databases
surveillance and
responses
technical
supports,
maintenance,
following up
community
water
management
committee
Health posts
make a target
diseases
surveillance and
report at weekly
and monthly
basis
Mobilizing the
community
action against
Epidemic
diseases
Short
maintenance
and
management
of the water
system , for
pump
institutions
Making a
regular
meeting with
health
committee
and voluntary
health
promoters at
kebele level
Assessing
regional and
national
assistance to
protect the
community
Early
identificatio
n of
epidemics
and early
report to
the
concerned
bodies in
order to get
financial
and
manpower
support
332
Page 1 of 4
Wereda Disaster
Risk Profile
Data_Collected_Date
September 2010
Disaster Risk Management and
Food Security Sector (DRMFSS)
Tuesday, September 30, 2014
Region S.N.N.P
Zone SOUTH OMO
Wereda HAMER
Selected Indicator
Government Actors in the Field of Disaster Risk Management - Government actors and their activities in the field
of Disaster Risk Managements
Government Institution
Activity
Description
Activity
Description Activity
Description Activity Description
Health Office
Pastoral Community
Development Office
Conduct vaccination
Train woreda early
warning experts
Conduct seasonal
vaccination for
children and
adults
(mother-lactatin
g, mothers)
Increase
awareness on
household
sanitation
The project has
trained woreda
early warning
and kebele level
development
agents about
early warning
indicators and
reporting system
Development of
water sources
House to
house
sanitation
awareness
has been
given for the
last five to
six years to
reduce
communicabl
e disease
The project
has allocated
budget for
shallow well
construction
Supply
mosquito net
and
anti-malaria
drugs to all
clinics and
health posts
Allocate
budget for
drug
procurement
Sufficient
mosquito
nets and
anti-malaria
drugs have
been
supplied
before
malaria
incidence
The project
allocate
budget for
drugs
procuremen
t
333
Page 2 of 4

Wereda Disaster
Risk Profile
Data_Collected_Date
September 2010
Disaster Risk Management and
Food Security Sector (DRMFSS)
Tuesday, September 30, 2014
Region S.N.N.P
Zone SOUTH OMO
Wereda HAMER
Selected Indicator
Government Actors in the Field of Disaster Risk Management - Government actors and their activities in the field
of Disaster Risk Managements
Government Institution
Activity
Description
Activity
Description Activity
Description Activity Description
Pastoral Community
Development Office
Peace and Security
Office
Collect and transfer
weekly early
warning reports
Crime prevention
Team collect
and analyse
weekly EW
indicators and
submit organized
report to zonal
level agricultural
department
collect and
transfer monthly
early warning
reports
Awareness
creation
collect and
analyse
monthly early
warning
report and
submit
organized
reports after
getting
approval
health office,
education
and water
office experts
on
organizationa
l concerned
early warning
issues
Conduct
meher and
belg crop
assessment
and submit
reports
Taking legal
actions
Conduct
annual belg
and meher
crop and
market
assessment
reports and
submit to
zonal,
regional and
federal
concerned
bodies
334
Page 3 of 4
Wereda Disaster
Risk Profile
Data_Collected_Date
September 2010
Disaster Risk Management and
Food Security Sector (DRMFSS)
Tuesday, September 30, 2014
Region S.N.N.P
Zone SOUTH OMO
Wereda HAMER
Selected Indicator
Government Actors in the Field of Disaster Risk Management - Government actors and their activities in the field
of Disaster Risk Managements
Government Institution
Activity
Description
Activity
Description Activity
Description Activity Description
Wereda Disaster
Preparedness and
Prevention Office (DPPO)
conduct weekly
early warning
assessment and
reports
Conduct weekly
EW assessment
including
livestock and
crop market and
submit reports to
zonal level EW
response and
food security
process
Conduct monthly
EW assessment
and report
collect
monthly EW
reports and
submit to
regional and
zonal level
EW response
and food
security work
process
Conduct belg
and meher
crop
assessment
and submit
reports
Conduct
annual belg
and meher
season crop
assessment
with
coordination
of health
office,
water and
livestock
and crop
developmen
t experts in
our office
335
Page 4 of 4
Data_Collected_Date
Region S.N.N.P
September 2010
Zone SOUTH OMO
Tuesday, September 30, 2014
Wereda HAMER
Selected Indicator
Non-Government Actors in the Field of Disaster Risk Management -
Non-government actors and their activities in the field of Disaster Risk
Management
Non Governmental Actors
in the Wereda
Activities
GTLI (Global Team for
local initiatives)
Farm Africa
Establish shallow wells
Provide training
336
Page 1 of 1
Wereda Disaster
Risk Profile
Data_Collected_Date
Region
Selected Indicator:
Zone
Interventions: Community Suggestions to Development Actors
Kebele Name
Type Of Disaster 1
Early Warning Indicator
Preparedness Measure
Type Of Disaster 2
Early Warning Indicator
Preparedness Measure
Type Of Disaster 3
Early Warning Indicator
Preparedness Measure
Type Of Disaster 4
Early Warning Indicator
Preparedness Measure
Disaster Risk Management
and Food Security Sector (DRMFSS)
September 30, 2014
Wereda
337
Page 1 of 1

Wereda Disaster
Risk Profile
Data_Collected_Date
September 2010
Region S.N.N.P
Zone
SOUTH OMO
Disaster Risk Management
and Food Security Sector (DRMFSS)
Tuesday, September 30, 2014
Wereda HAMER
Selected Indicator
Wereda Strengths, weaknesses, opportunites and treats (SWOT) Analysis
Kebele Name
Strength
Weakness
Opportunity
Threat
HEDBAK
SHANKO
DEGA KEJA
KARDESO
Water and soil conservation
initiatives (making terraces
at hills, up, downs)
High social cooperation
during food shortage and
high participation Keeping
high number of livestock to
reduce their problems
Strong social interaction
and collaboration during
disasters especially during
hunger Keeping a number
of livestock finding distant
grazing and watering points
by affecting themselves
Depending low cost
customary food and drink
and insurance for hunger
High social interaction to
farm to conflict areas on
the other side of omo river
Increasing bushes and shrubs
clearing far from extension,
rapidly increasing population
Increasing the deforestation
activities for farming
system(crop)
Increasing cutting down of
trees for sell and farm
extension Increased
negligence on management
of natural resources Erosion
of culture and lessening
social interaction
Addicting bad habits and
wasting incomes collected
from tourism (drinking too
much alcohols)
Increasing agricultural
extension for soil and water
conservation activities
To work infrastructure, making
places for national market
improving livestock products
Good price offer for livestock
and construction of all-weather
road For better improvement
of livestock market Introduce
of project that participate the
community in food and cash for
work projects, establishment of
health services
Increasing population and
conflict far from land
resource
Range land management to
decrease the degradation
of land, introducing new
technology
Rapid deforestation
activities deterioration of
rain fall, reduced livestock
produce and production
Increasing livestock
mobility and introduce new
livestock disease
Vast and fertile cultivable land
and permanent water resource
Lack of supply for
irrigation pumps, damage
of farm land by water
pressure /water bank farm
land/
338
Page 1 of 5

Wereda Disaster
Risk Profile
Data_Collected_Date
September 2010
Region S.N.N.P
Zone
SOUTH OMO
Disaster Risk Management
and Food Security Sector (DRMFSS)
Tuesday, September 30, 2014
Wereda HAMER
Selected Indicator
Wereda Strengths, weaknesses, opportunites and treats (SWOT) Analysis
Kebele Name
BESSA MEJAN
MINOGELTI
Strength
High social interaction
during food shortage and
conflict rises Ability to
identify early warning
indicators culturally
There is high social
collaboration during hunger
and conflict
Weakness
Low awareness on pasture
management and negligence
even awareness given
Increasing deforestation
activities for farm activities
The area is not suitable for
rain fed agriculture rather
the shoats keeping,
considering looting as
livestock acquisition
Opportunity
Be fitting environment for
livestock production and bee
keeping when rehabilitation
works made
Availability of road to improve
livestock and crop markets
SHESHA GOYKE
In discriminate helping each
other regardless of leaving
standard Dependency on
low price commodities
Maintaining livestock
resources/save livestock
resources trekking too long
distances where grass and
water points available
resisting hunger and other
difficulties
Increase environmental
degradation (cutting trees for
fire and construction wood
for sale)
Establishment of market points
and marketing of linkage
Threat
Increasing completion for
grazing and water points
which results conflict
Increasing of introduction
of new livestock disease
like CCPP and still
explicitly un identified
sheep disease introduced
from Kenya, increase of
conflict, depletion of
shoats
Increasing deterioration of
rain fall, increasing
degradation of natural
resources
339
Page 2 of 5

Wereda Disaster
Risk Profile
Data_Collected_Date
September 2010
Region S.N.N.P
Zone
SOUTH OMO
Disaster Risk Management
and Food Security Sector (DRMFSS)
Tuesday, September 30, 2014
Wereda HAMER
Selected Indicator
Wereda Strengths, weaknesses, opportunites and treats (SWOT) Analysis
Kebele Name
ERBORE
MURALE
KOLA KEJA
Strength
There is high social
interaction The level of
literate increasing from
year to year High social
cooperation during disaster
High social cooperation
during disaster
Strong tie among the
community to help each
other during disaster
Keeping large and
diversified livestock’s
Cultural ability to identified
livestock Insurance of
hazards especially for
hunger utilizing very low
cost commodities
Weakness
Deforestation of river side
areas, increasing settlement
beside the river
Resistance to change
settlement areas which are
prove for flooding
Deforestation of river side
areas, increasing settlement
beside the river
Lack of clarity for external
bodies during hazard
identification Unwillingness
to offer their livestock for
market Persistency on
cultural methods of hazard
speculation Dependency
syndrome instead of using
their livestock resource
Opportunity
Dam construction as though on
and off construction has been
implementing
Threat
Increase deforestation of
the side of Woitor river
which can be the main
cause of flooding
Dam construction for farm
purpose that will reduce over
flooding
Increase agricultural extension
and institutions Enough
marketable livestock resource
Increase institutions that work
on hazards Good price offer for
livestock
Increasing deforestation,
farm extension,
settlements to river sides
Prolonged dry seasons and
deterioration of pasture
land Unwillingness of the
community for changes,
increased resistance for
changes Lack of funding
Perishing of livestock
resources owing to drought
due to their resistance for
market offer
340
Page 3 of 5

Wereda Disaster
Risk Profile
Data_Collected_Date
September 2010
Region S.N.N.P
Zone
SOUTH OMO
Disaster Risk Management
and Food Security Sector (DRMFSS)
Tuesday, September 30, 2014
Wereda HAMER
Selected Indicator
Wereda Strengths, weaknesses, opportunites and treats (SWOT) Analysis
Kebele Name
LALA
ERIYA
Strength
High social interaction and
collaboration during
disasters Keeping a number
of livestock finding grazing
points at distant area to
resist hunger Ability to
survive on low cost
commodities
High social interaction
strong culture to help one
another during hunger
Keeping more livestock
whatever the severity of
feed shortage increased
driving too long distances to
save their resource Ability
to survive on low cost
commodities for long time
Weakness
Increasing the remaining
forest destruction
Settlement at hilly areas or
unwillingness to leave hilly
areas as though there is plain
area
Clearing of vast land for farm
extension without yield Low
awareness and reluctance for
livestock marketing (majority
of herders)
Opportunity
Increasing awareness about
natural resource rehabilitation
and change of them
Road construction and good
price offer for livestock
Extension of livestock health
services both in government
and private
Threat
Increasing population and
settlement, increasing
deforestation Reduce of
livestock produce, reduce
of honey produce due to
deforestation Increasing
soil erosion and reducing
soil fertility
Introduce of livestock
disease, bush and shrub
clearing for farm (blouses)
with yield without crop
yield Settlement
increment and pasture land
narrowing Increasing
population due to
polygamy
341
Page 4 of 5

Wereda Disaster
Risk Profile
Data_Collected_Date
September 2010
Region S.N.N.P
Zone
SOUTH OMO
Disaster Risk Management
and Food Security Sector (DRMFSS)
Tuesday, September 30, 2014
Wereda HAMER
Selected Indicator
Wereda Strengths, weaknesses, opportunites and treats (SWOT) Analysis
Kebele Name
MRSHA
ASELE
Strength
High level of cooperation
among the community
during food shortage Split
herding to reduce livestock
loss
Strong social interaction
Willingness of the majority
to avoid conflict with
Borena Increasing farm
practice using Woito river
over flow
Weakness
Unwillingness to reduce
livestock number and
resistance for change, relief
dependency syndrome
Reluctance to conserve
natural environment Lack of
early warning during
disasters Giving misleading
information about disasters
Increasing settlement at
unfavorable location
Increasing deforestation,
increasing livestock looting
for acquisition by youngsters
(looting from Borena)
Resistance for afforestation
awareness and reluctance
Opportunity
Road construction is promising
for livestock market improves
Road (all weather) construction
good livestock price offer
Threat
The level of dryness and
environmental change is
increasing from time to
time ie Dry seasons are
extending which results
shortage of livestock feed
and water
Increasing shortage of rain
fall, increasing competition
for grazing and conflict,
increasing population and
shortage of pasture land
342
Page 5 of 5