


NATIONAL
DISASTER RISK MANAGEMENT COMMISSION
(NDRMC)
WOREDA DISASTER RISK PROFILE (WDRP)
REGION: SNNP
ZONE: WOLAYTA
WEREDA: HUMBO
December, 2020
Addis Ababa

About the National Disaster Risk Management Commission (NDRMC)
The National Disaster Risk Management Commission (NDRMC) was reestablished in
December 2015 and recognized by an act of Council of Ministers (Regulation No.
363/2015) as an autonomous Federal Government office mandated to conduct
appropriate activities for the comprehensive implementation and realization of
the objectives of the National Disaster Risk Management Policy and Strategy and
to coordinate, monitor and provide appropriate support with respect to activities
carried out by the lead sector institutions.
Address: Kirkos Sub-city Behind Dembel City Center, Addis Ababa, Ethiopia.
P.O.Box: 5686
Tele: 0115524259/4272
Website: www.dppc.gov.et
© 2020 National Disaster Risk Management Commission. All rights reserved
Printed in Addis Ababa, Ethiopia.
Citation- This Document May be Cited as Follows:
National Disaster Risk Management Commission (2020), Humbo Woreda Disaster
Risk Profile, Addis Ababa, Ethiopia.

PREFACE
Ethiopia is well aware of the impact that disasters can have on the
development goals that we are rigorously pursuing through our
Growth and Transformation Plan II. With this recognition we
started a paradigm shift a few years ago, largely triggered by the
revised National Policy and Strategy on Disaster Risk Management.
To make the DRM programme implementation in the country well-informed, a
comprehensive information management system is required. We have been
undertaking a comprehensive risk assessment exercise under which Disaster Risk
Profiles are being prepared for each district and at sub-district levels in the country.
This Wereda Disaster Risk Profile establishes an extensive database on disaster risk
elements that will help decision makers at all levels to be better informed at
community and Wereda level about the characteristics of potential hazards, their
potential exposure, vulnerabilities of communities, capacities and that can also be an
input for Wereda Disaster Risk Reduction Plans and area specific early warning tools.
Wereda Disaster Risk Profiles developed are publically available here for the use of all
development partners and government sectors at all levels. Also, other data sources
of NDRMC, such as Desinventar, Livelihood Baseline and the Early Warning information
will be integrated and harmonized with this Information Management System.
Finally, we need to acknowledge the support of partners who have funded this
programme and we also look for the support of donors and all development partners
in order to achieve the ambitious indicators of this risk information and providing
every district with the disaster risk profile and their respective risk-informed plans.
H.E. Ato Mitiku Kassa
Commissioner
National Disaster Risk Management Commission (NDRMC)
The Federal Democratic Republic of Ethiopia (FDRE)

PREFACE
Woreda Disaster Risk Profiling (WDRP) is a government owned
programme undertaken by the National Disaster Risk
Management Commission (NDRMC) in collaboration with
regional DRM offices and development partners to provide
baseline information for disaster risk management practices
and activities in the country. The programme is designed by
taking into account the experiences gained from the implementation of pervious
strategies and actions like the Hygo Framework for Action (2000-2015) and the Sendai
Framework for Disaster Risk Reduction (2015-2030).
WDRP is composed of diversified indicators including hazard related issues, crop and
livestock production, landholding and environmental issues, human and livestock
health issues, education and social issues at wereda and kebele level. It provides
basic and detailed indicators with both quantitative and qualitative information which
obtained from both primary and secondary data sources.
Moreover, two pages summary of profiles is also prepared to help users easily
understand WDRP results for each wereda without going into detail for all indicators.
In addition to this booklet, developed profiles are uploaded on WDRP website
(http://profile.ndrmc.gov.et) to be viewed by all users; we encourage all DRM actors
at all levels to use this profile as baseline information for all DRM initiatives.
This WDRP booklet was produced through exemplary collaboration of all concerned
bodies and I would like to give my deepest gratitude to all who directly or indirectly
contribute for the success of the programme particularly for data enumerators and
supervisors, data encoders and profile development teams, consultants and advisors,
partner ministries and all DRM stakeholders.
Abraham Abebe
Director
Disaster Risk Reduction and Rehabilitation Directorate (DRRRD)
National Disaster Risk Management Commission (NDRMC)
Contents
No. Indicator Name
Page
Preliminary Information
I.
Preface
II.
Wereda Location in Ethiopian Map
III.
Methodology
IV.
Summary Profile
Hazard Related Characteristics
1
1
Biological Hazards of the Wereda
2
2
Geological Hazards of the Wereda
3
3
Hydro Metrological Hazards of the Wereda
4
4
Socio Economic Hazards of the Wereda
5
5
Technological Hazards of the Wereda
6
6
Disaster Characteristics By Kebele
7
7
Hazards: Conflict as an Issue
35
8
Hazard Situation During Last Disaster - Characteristics of most recent disaster that
affected the community
37
9
Frequency of Disaster Occurrence
41
10
Household Exposure to Hazards
42
11
Months of Occurrence of Frequent Disasters
43
Conflicts: Perception of households on conflict issues - Is conflict an issue in this
12
community?
44
13
Conflicts: Perception of households on conflict issues - Who do you turn to in case
of a conflict?
45
14
Losses from Disasters - Losses from all disasters (household response in %)
46
No. Indicator Name
Page
15
Losses from Disasters - Main Losses by Type of Disasters (household response in %) 47
16
Losses from Disasters - Secondary Losses by Type of Disasters (household response
in %)
50
17
Seasonal Calendar for Hazards, Activities and Income Level By Kebele
53
Infrastructure Access Characteristics
18
Physical Vulnerability: Access to Roads & Urban Centres - Households access to
road and urban centre
81
Physical Vulnerability: Access to Electricity - Households’ access and utilization of
19
electricity
82
20
Physical Vulnerability: Type of Dwelling Units - Households’ type of dwelling houses 83
Socio Demographic Characteristics
21
Economic Vulnerability: Level of Migration - Migration level and its characteristics
by Kebele
85
22
Economic Vulnerability: Household Migration - Household migration and reason for 88
migration
23
Economic Vulnerability: Household Migration - Disasters as a triggering factor for
migration (households response in %)
89
24
Demography: Population Structure
90
25
Demography: Population Trends and Ethnic Groups
93
26
Social Vulnerability: Household Demographic Characteristics - Demographic
characteristics of households
95
27
Social Vulnerability: Level of Educational Attainment - Education status of
household members
96
28
Social Vulnerability: Gender Parity - Gender parity in education level (7+ years)
and household heading
98
Environmental Characteristics
29
Environmental Situation: Environmental Problems - Major environmental problems
by Kebele
100
No. Indicator Name
Page
30
Environmental Situation: General Land Quality - Perceptions of the community
on changes in the general quality of land over a decade
101
31
Environmental Situation: Changes in Landscape - Changes observed by the
community on landscape and the problems due to the changes
104
32
Environmental Situation: Land-Use other than crop production - Types of land use
other than crop production across Kebeles
106
33
Environmental Situation: Deforestation - Observed changes over levels of
deforestation by the community and its problems
108
34
Environmental Situation: Natural Resources Availability - Natural resources
available and changes observed by the community
110
35
Environmental Situation: Rainfall & Temperature - Observed changes on rainfall
and temperature by the community over the last decade
123
36
Environmental Situation: Reasons for Environmental Changes
126
37
Environmental Situation: Soil Erosion - Observed changes on levels of soil erosion
by the community
128
Livelihood, Occupation and Source of food
38
Economic Vulnerability: Major Occupational Categories - Major categories of
131
occupation and percent of population engaged in the occupation by Kebele
39
Economic Vulnerability: Livelihoods - Households important sources of
livelihood (response in %)
134
40
Economic Vulnerability: Occupational Categories - Percent of population above 15
years age by occupation categories
138
41
Economic Vulnerability: Sources of Food - Households source for different food
items (response in %)
139
Crop Production
42
Hazards: Change in Crop Damages - Proportion of total crop damage (percentage
response by households)
143
43
Hazards: Change in Crop Damages - Major reasons for crop damage (percentage
response by households)
144
44
Hazards: Change in Crop Damages - Proportion of Damage for Major Crops
(percentage response by households)
145
No. Indicator Name
43
Hazards: Change in Crop Damages - Reasons for Damage of Major Crops
(percentage response by households)
44
Agricultural Situation: Change in Crops Grown - Five major crops grown by
proportion of total cultivated land
45
Agricultural Situation: Access to Extension - Perception of the community on
Access to Agricultural extension Services
Page
148
151
159
46
Economic Vulnerability: Crops Grown - Types of crops grown by households
161
47
Economic Vulnerability: Crops Grown - Proportion of households by amount of yield
of major crops (last year)
163
48
Economic Vulnerability: Crops Grown - Proportion of households by amount of yield
of major crops (Five years ago)
165
49
Economic Vulnerability: Land Ownership and Quality - Landownership of households 167
50
Economic Vulnerability: Land Ownership and Quality - Farmers’ perception on the
quality of their agricultural land
168
51
Agricultural Situation: Access to Inputs - Perception of the community on access
169
to improved agricultural inputs
52
Agricultural Situation: Water for irrigation - Access to water for irrigation in the
community
171
53
Agricultural Situation: Soil Fertility - Perception of the community on soil fertility
and its change over time
173
54
Economic Vulnerability: Status of Agriculture - Methods of tillage, Irrigation and
other agricultural input utilization by households
175
55
Economic Vulnerability: Change in Agricultural Situation - Households
perception on changes of crop type, size of cultivated area and crop yields
176
56
Economic Vulnerability: Crops Grown - Number of crops grown by households
178
Livestock Production
57
Agricultural Situation: Status of Livestock Disease - Change In Livestock Disease
Status By Kebele
180
58
Livestock Prevalent of Diseases & Veterinary Facility - Livestock Diseases
Prevalence
182
No. Indicator Name
Page
59
Livestock Prevalent of Diseases & Veterinary Facility - Evaluation of Access to
Veterinary Services and Livestock Drugs
183
60
Agricultural Situation: Water Availability for Livestock - Water availability for
livestock in the community
184
61
Agricultural Situation: Livestock Diversity - Type of livestock and their economic
importance in the community
186
62
Economic Vulnerability: Livestock Ownership and Changes - Percentage of
households by number and type of livestock owned
190
63
Economic Vulnerability: Livestock Ownership and Changes - Households’ perception 192
on changes in livestock number in the last five years (response in %)
64
Economic Vulnerability: Livestock Ownership and Changes - Households
perception on changes in livestock number in the last five years (response in %)
193
65
Agriculture (Livestock): Pasture Availability - Households’ perception on access and
quality of pasture
195
66
Agriculture (Livestock): Pasture Availability - Households’ perception on
problematic months for pasture availability
196
67
Agriculture (Livestock): Water Availability - Households’ response on water
availability for livestock
197
68
Agriculture (Livestock): Water Availability - Households’ perception on problematic
months of water availability for livestock
198
69
Agriculture (Livestock): Water Availability - Sources of water for livestock
(households response in %)
199
Access to Markets and Credit
70
Economic Vulnerability: Proportion of Produce Sold and Market - Proportion of
crops and livestock sold from total production and markets
201
71
Economic Vulnerability: Kebele Access to Markets - Access to market by Kebele
204
72
Economic Vulnerability: Formal & Informal Transfers - Percentage of households
reporting received formal transfers
206
No. Indicator Name
Page
73
Capacity: Access to Credit Facilities - Households access to credit facilities
208
74
Capacity: Access to Credit Facilities - Percentage of households by major reasons
of borrowing money
209
Capacity: Access to Credit Facilities - Percentage of households by major sources
75
of credit
210
76
Capacity: Access to Credit Facilities - Percent of households with ability to raise
500 birr in one week
211
Health and Sanitation Characteristics
77
Household Access to Health Facilities - Where do patients go for health care?
213
78
Hazards: Health problems and changes over the last decade
215
79
Household Health Status - Households’ health condition and major health problems 217
80
Household Access to Sanitation - Percentage of households with access to different
kind of toilet facilities
219
81
Household Access to Drinking Water - Sources of drinking water for households
(response in %)
220
82
Household Access to Drinking Water - Households’ methods of treating drinking
water
221
83
Household Access to Drinking Water - Number of times households fetch water in a
week
222
84
Household Access to Drinking Water - Time taken per day to fetch water for
households
223
Coping Mechanisms and Preparedness Measures
85
Capacity: Community Preparedness against Sudden Onset Disasters
225
86
Capacity: Community Preparedness against Increase in Disaster Intensity
228
87
Capacity: Community Preparedness against Disasters
232
88
Hazard: Coping and recovering during last Disaster
236
89
Capacity: Type Community Participation
249
No. Indicator Name
Page
90
Capacity: Recovery from Losses from Disasters - Percentage of Households who
have managed to recover from losses of disasters
251
91
Capacity: Coping Strategies Adopted by Households - Main coping strategies
adopted by households to recover from respective losses
252
92
Capacity: Coping Strategies Adopted by Households - Percentage of households
by frequency of main coping strategies adopted
257
93
Capacity: Alternative Livelihood Sources - Alternative livelihood sources suggested
by the community
259
94
Capacity: Recovery from Losses from Disasters - Percentage of households
recovered from past disasters by type of Disasters
262
95
Capacity: Recovery from Losses from Disasters - Proportion of households
recovered by type of Losses
263
96
Capacity: Coping Options if More Resources Available - What coping strategy could
be adopted if more resource were available?
264
97
Capacity: Coping Strategies Adopted by Households - Percentage of households by
major type of coping strategies adopted (at least once)
265
98
Capacity: Coping Strategies Adopted by Households - Main coping strategies
adopted by households for respective disasters
267
99
Capacity: Coping Strategies Adopted by Households - Secondary coping strategies
adopted by households for respective disasters
274
Community Perception and Suggestions
Interventions: Community Perception on Mediums to Influence DRM Actors -
101
Community perception on the effectiveness of institutional channels to use to
279
influence DRM actors
Interventions: Community Perception on their Knowledge used in DRM Process -
102
Perception of the community on how their knowledge influences the priorities and 285
measures of DRM actors
Interventions: Suggestions to improve preparedness - Interventions suggested by
103
the community to development actors to improve preparedness in the area
287
No. Indicator Name
Page
104
Interventions: Suggestions to DRM Actors in the Area - Community suggested
measures to DRM actors in the area for effective DRM actions
288
105
Economic Vulnerability: Community Suggestions to Improve Economic Situation -
Community suggested measures to improve the economic situation of the area
292
106
Community Awareness of Disaster Risk Management System and Actors
296
Community Perception of DRM System and Actors - Perception of the community on
107
the effectiveness of DRM system in helping them to prevent, cope and recover
309
from disasters
108
Major Public Interventions Desired - Percentage of households by type of
intervention desired
312
Others
109
Capacity: Community Based Organizations
314
110
Supporting Agencies against Disasters - Percentage of households by supporting
institutions to handle or recover from disaster damages
322
111
Type of Support Received From Supporting Agencies – Household responses of types
of support received from supporting agencies
323
112
Government Actors in the Field of Disaster Risk Management - Government actors 324
and their activities in the field of Disaster Risk Managements
Non-Government Actors in the Field of Disaster Risk Management - Non-government
113
actors and their activities in the field of Disaster Risk Management
327
114
Interventions: Community Suggestions to Development Actors
328
115
Wereda SWOT Analysis
341
METHODOLOGY
WDRP Content :
• Comprehensive information on disaster risk components
(Hazards, Vulnerability and Capacity)
• Multi-sectoral and multi-hazard information.
Research Approach:
• Mixed Approach
• Both quantitative and qualitative information
Data Sources:
• Primary Data:
Household Questionnaires: statistically significant number
(around 400 households).
Focus Groups Discussions: One per kebele
Key Informant Interviews: with major woreda level government
and non-government DRM actors
Problem Tree Analyses : to see the cause and effect of disasters
• Secondary Data:
collected relevant to WDRP indicators:
LIU, SERA Project, Risk baseline, other ministries…
Sampling Technique:
• Multistage cluster sampling
• Both Probability and Non-probability sampling
Methods of Analysis:
• Descriptive Statistics
• Textual Analysis
• Cispro and SPSS
• Automate WDRP software

WEREDA
SUMMARY DISASTER RISK PROFILE
INFORMATION
Wereda Disaster Risk Profiling Programme: SNNP
Disaster Risk Profile: Humbo Wereda
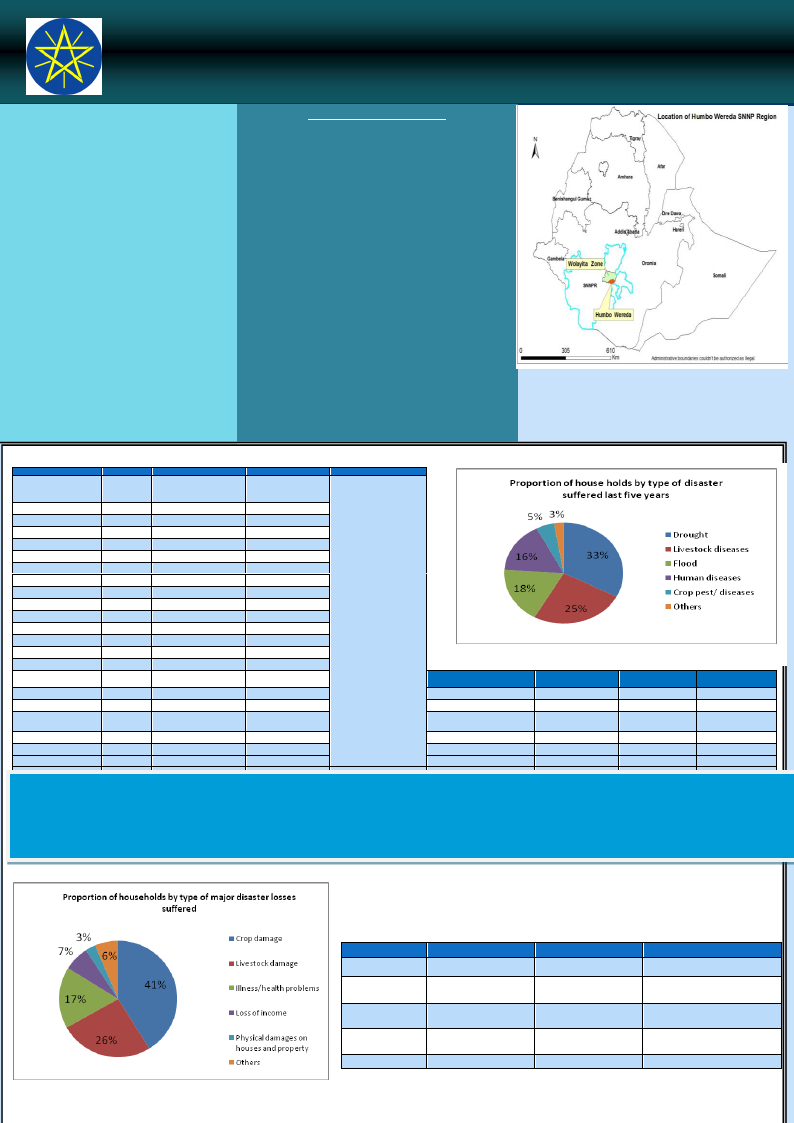
SUMMARY OF WEREDA PROFILE
Drought a nd livestock disease a re the mos t
chroni c hazards i n the woreda fol l owed by
fl ood, human disease a nd crop pest/ disease
whi ch a ffects the hous ehol ds .
Soi l erosion, deforestation, l and degradation
a nd pes ts a re a mong envi ronmenta l
probl ems i n the area a nd they a rea reported
i ncrea s i ng over ti me .
La ck of i nfra s tructure s uch a s roa d a nd
el ectri ci ty, l a ck of fa mi l y pl a nni ng a nd
l i tera cy a re the fa ctors whi ch ma ke the
communi ty vul nera bl e to di s a s ter i n the
wo re d a
Devel oping infrastructures such as road a nd
el ectri ci ty, cons tructi ng da m, hea l th pos t
a nd s chool , enha nci ng s oi l cons erva ti on
mea sures i mprovi ng i rri ga ti on s chemes ,
us i ng agricultural inputs specia l l y ferti l i zer,
improved seeds a nd pesticides are some of
the s uggestion intervention i n the woreda .
LIVELIHOOD ZONE SUMMARY
Population pressure in this zone has led to v ery small
landholdings, but maximum use is made of what there is,
with possibly the most varied cropping in all Ethiopia. But
rain failure as well as pests frequently push part of the
population over the hunger threshold and onto relief food
aid. In ordinary production years, households with at least
half a hectare of land will be nearly or actually self-
sufficient in staple food. The main food crops are maize
and beans intercropped, and sweet potatoes in two
harvests, whilst Enset is important as a backstop in the
lean months of February to May. With scarce grazing,
livestockmust be largely hand-fed with crop residues and
fodder bought on the market. The biggest investment is in
cattle. Cattle owners commonly contract poorer
households to keep and fatten some of their stock,
rewarded by a share in the sales. Crop sales are far less
important as a source of cash.
This zone is essentially food secure and, despite erratic
rainfall, isone of the most prosperous in the Region. The
main road to Addis Ababa allows most of the bulk-
produced bananas to be sold in Addis Ababa. Not all
Kebeles have accessto irrigation, and there the main cash
crop is cotton, sold in Hawassa and Addis for processing.
The dominant food crop ismaize and middle and better-off
households are usually self-sufficient in staple foods.
Abundant pasturesmean that even poor households keep
three to five cattle.
MAJOR DISASTERS REPORTED IN WEREDA
Kebele
ABULE
Disaster 1 Disaster 2
Drought Livestock diseases
MUKEGURACHA
ABAYA GUNUCHO
ABELA AJAJA
Flood
Drought
Drought
Flood
ABELA GEFETA
Drought
Livestock disease
ABELA LONGENA
Drought
Livestock disease
ANKA WECHA
Drought
Livestock disease
BOSA WANCHE
Drought
Livestock disease
ABAYA CHOKARE
Flood
Drought
DEMBA KOYISHA
Drought
Crop pest/disease
ELA KEBELA
Drought
Livestock disease
HOBICHA DIGISO
Drought
Livestock disease
GALICHA KARA
Drought
Livestock disease
GUTUTO LARENA
Drought
Flood
HOBICHA BADA
Drought
Flood
HOBICHA BONGOTA
Drought
Livestock disease
ABELA ZEGRE
Drought
Human disease
Disaster 3
Human
diseases
Livestock disease
Livestock disease
Human disease
Flood
Crop pest/disease
Flood
Livestock disease
Flood
Flood
Flood
Crop pest/disease
Livestock disease
Livestock disease
Human disease
Livestock disease
KODO KANKO
KOYISHA GOLA
KOYISHA OGODAMA
Drought
Drought
Drought
Flood
Crop pest/disease
Flood
Human disease
Livestock disease
Crop pest/disease
OYISHA WANGALA
AMBE SHOYA
AMPO KOYISHA
Drought
Drought
Drought
Flood
Flood
Human disease
Livestock disease
Crop pest/disease
Flood
LIU Info
Chronic
Hazards:
Kebele
SERE TAWURETA
SHOCHORA ABELA
SHOCHORA FESHO
SHOCHORA OGODAMA
SHOCHORA OSE
Disaster
Drought
Drought
Drought
Drought
Drought
Disaster 2
Flood
Flood
Flood
Crop pest/disease
Crop pest/disease
Disaster 3
Crop pest/disease
Crop pest/disease
Livestock disease
Livestock disease
Livestock disease
SHORT NARRATIVE ON MAJOR DISASTERS:
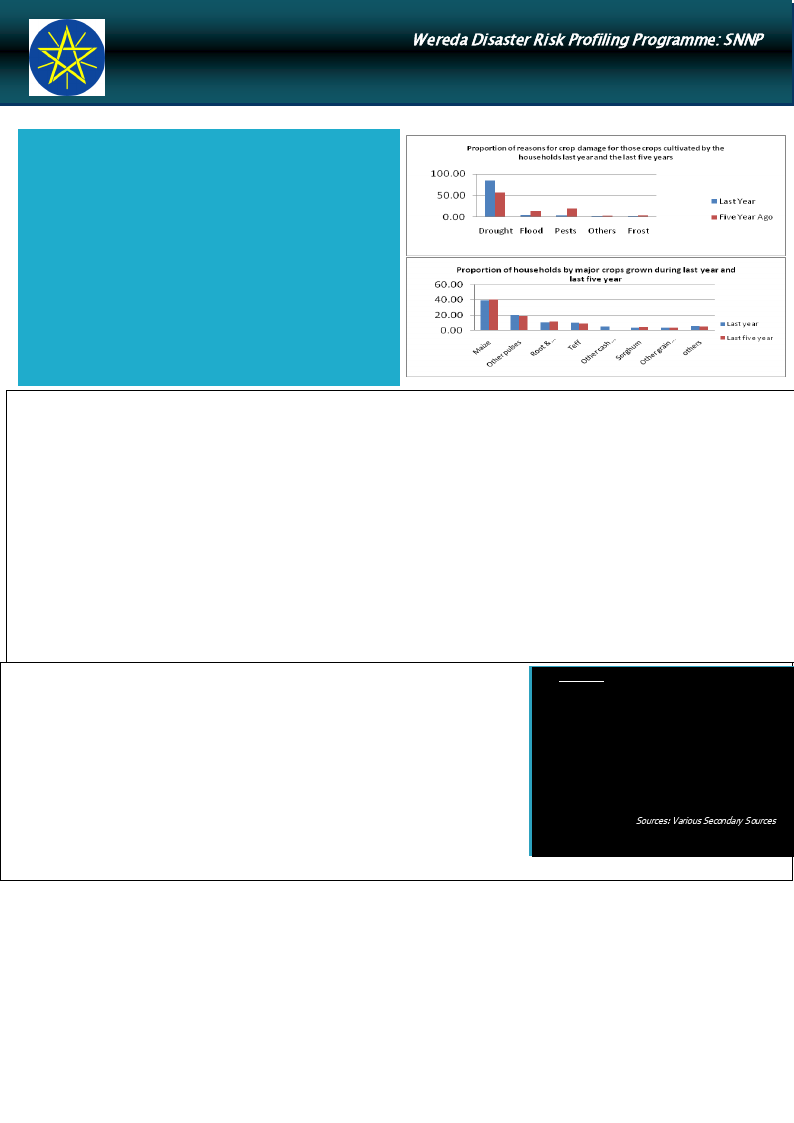
Drought is the major disaster risk in the wereda which is the cause for other problems in the community s uch as water s hortage, crop a nd l ivestock
da mage, which in turn resulted in food i nsecurity. Flooding is a nother problem which occurs from April to July ca using crop damage, water l ogging on farm
l a nd a nd land degradation (soil erosion). Biological hazards such as crop pests a nd diseases, human diseases s uch a s malaria and livestock diseases such as
Trypa nosomiasis ( the single most important problem affecting l ivestock in the wereda ) a re also prevalent in the a rea.
Disasters
Drought
Livestock
disease
Flood
Human disease
Crop disease
EFFECT OF DISASTERS
Loss 1
Crop damage
Loss 2
Loss of income
Livestock damage Loss of income
Crop damage
Illn ess/h ealt h
problems
Crop damage
P hysical damages on
houses and property
Loss of saving
Loss of income
Loss 3
Livestock damage
Loss of saving
Livestock damage
Death of household
members
Illness/health problems
Wereda Disaster Risk Profiling Programme: SNNP
Disaster Risk Profile: Humbo Wereda (February 2017)
HOUSEHOLD AND COMMUNITY
VULNERABILITY
VULNERABILITY
The l ivelihood of the community i s highly dependent on cereal crop s uch
a s s orghum, wheat, teff, barley a nd maize. Haricot bea n, s weet pota to,
pota to, and root a nd tubers are a lso produced i n the woreda. Selli ng of
cerea ls a nd other foods a nd rearing & s el l i ng a ni ma l s (ca mel s , ca ttl e,
s heep, goa ts ) i s the s ource of i ncome .
Li ves tock number is reported decreasing over ti me ma i nl y due drought
a nd disease. 83% of the households have received formal transfers in the
form of ca s h-for-work, food for work a nd emergency food a i d.
La ck of enough farming land, lack of family planning, a nd l a ck of na tura l
res ource cons erva ti on a cti vi ti es a re a mong the wea knes s of the
communi ty whi ch ma kes them vul nera bl e .
Termi te i nfestation, no a cces s to roa ds , el ectri ci ty, a nd l a ck of cl ea n
dri nking water, and unsatisfactory s anitati on i s a l s o fa ctors expos i ng
them to di s a s ter.
Accessibility:
Access to road and urban centre: 62% of the households reported either there is no road or dirty road that is difficult for car. The average time taken to reach the nearest
paved road in the woreda is 1 hour and 18 minutes and the average time to reach the nearest urban canter is only 29 minutes
Accesses to electricity: Of the household surveyed 14.00% are located in the community with electricityand 10% of the community located with electricity are actually
connected to electric power.
Access to veterinary facility: of the total households surveyed, 66.76% and 66.40% of them reported to have poor (very poor) access to veterinary service an d livestock
drugs respectively.
Access to market: Most of the kebels reported the problem is during harvesting time where the price is decreasing, price fluctuation and lack of road accessibility.
Access to agricultural extension service: All most all households reported there is no problem and there is an increasing condition from the last decade in a better way.
Also from the survey findings 92.08% of the households have received agricultural extension service
Access to fertilizer, pesticides and improved seeds: Most of the households use fertilizers both chemical and Natural (35%) they reported also that they uses chemicals
(49%) and Natural/Animal manure (10%), 74% of the households uses pesticides where 90% of them uses improved verity of seeds
Access to water and sanitation: Most of the households (97%) use water for drinking from communal tab (bono), river (streams) and piped water outside the house.
where 74% of them have no treating methods. Out of the surveyed households 7% have no toilet facilities in the house and 92% of them are using outdoor latrines.
5.35% of them are sharing toilets.
Access to credit: 82% of the households surveyed have borrowed money for different proposes mainly to buy agricultural inputs(47.37%) and 35% to buy food the main
source is bank or formal institutions (91%)
Pasture and water for livestock: Pa s ture a nd water availability for l ivestock is most problematic from Tir to Megabit (Janua ry to Ma rch) Ma y). In both
s ea s ons the ma i n s ource of wa ter i s ri ver a nd s trea m .
Level of Awareness and Institutional Development
Literacy level The proportion of literate population above 7 years old is 10.03% out of which 26.38%
completed below 1st grade level, 43.16% and 27.68% of the population completed primary and secondary
school respectively. With regard to gender parity in education the proportion of women is higher than me n
1st grade level only. But their number is dominated by the male students at primary, secondary and higher
levels. From the total number of households surveyed, only 20.73% of them are female headed households.
Community awareness about disaster risk management system and actors is relatively good There are
different Community based organizations such as Edir to facilitate funeral ceremonies , equb (informal),
Omo micho and microfinance help them to save money for social service ( formal organization). There are
also some formal associations such as women association, farmers and youth association engaged in
different activities. There are also different non government organization such as WFP, IRC, IMC, concern
worldwide, World vision and CDC working on providing supplementary food like oil and csb, providing seed,
food , shelter and logistics for immunization.
InfoBits:
Population
Sex ratio
Urban Population
Mean Altitude
Mean Slope
Road density
Measles caseload
:125,286 (2007)
:989.7 F/1000 M
:6,246(2007)
:1430.84 m
:3.7 %
:31.3 %
: 17 (2004-2009)
Sources: Various Secondary S ources
COMMUNITY CAPACITY TO COPE
Major coping mechanisms are sel l more livestock than usual, consumption rather than sale of crop surplus, borrowing of food or cash
(i ncl uding purchasing food on credit) a nd Seek alternative or additional jobs
In the woreda i t is reported that 52% of the households managed to recover from l oss of disaster faced.
In the events of more resource available :- 44.62% a dopted economic activities to hazards s eason (e.g. cropping cycl e, short term crops, etc.),
25.46% of the households a dopted Storage of food a nd other necessities and 21% Phys ical protection of buildings and property.
Duri ng disaster 86% of the hous ehol ds a re a bl e to ra i s e Bi rr 500.00 i n one week through s a vi ng a nd perha ps but doubt from others .
The social capital i s helping each other during time of disaster a nd strong cooperation i n all a ctiviti es , l oa n wi th no i nteres t, s eed gi ft, free
l a bour a nd edi r, i n ti me of dea th.
Crop a nd l ivestock diversity: The most commonly grown crops i n the woreda are Teff, wheat, sorghum, barley, maize a nd legume followed by
ha ri cot bean, s weet potato, potato, a nd root a nd tubers. The major types of livestock reared in the woreda a re ca ttl e, s hoa ts , ox, cow a nd
donkey (for tra ns porti ng goods ) a nd poul try
WDRP Indicators
Hazard Related Characteristics
1

Wereda Disaster
Risk Profile
National Disaster Risk Management
Commission (NDRMC)
Data_Collected_Date
Thursday, December 12, 2019
Region S.N.N.P
Zone
WOLAYITA
Wereda
HUMBO
Selected Indicator
Biological Hazards of the Wereda
Hazard_Name
Hazard_Sub_Type
Crop diseases
Cause_Of_Hazard
Crop diseases
Shortage of rain fall, Maize virus
Effects_Of_Hazard
Loss and reduction of yield, lack of
fodder, crop damage and income loss
Hazard_Sub_Type
Malaria
Diarrhea
Stomach pain
Hazard_Sub_Type
Trypanosomiasis
Foot and mouth disease
Anthrax affecting cattle
Human disease
Breeding of Mosquito, Stagnant water,
lack of balanced diet, drinking of
unclean water, poor sanitation.
Livestock diseases
High breeding of tsetse fly, lack of
pasture land, scarcity of water.
Illness, mortality and morbidity, loss of
income, high cost, asset loss, loss of
productive man power
Body loss of livestock, livestock death,
reduction of farming activities, income
loss.
Page 1 of 1
2

Wereda Disaster
Risk Profile
National Disaster Risk Management
Commission (NDRMC)
Data_Collected_Date
Thursday, December 12, 2019
Region S.N.N.P
Zone
WOLAYITA
Wereda
HUMBO
Selected Indicator
Geological Hazards of the Wereda
Hazard_Name
Hazard_Sub_Type
No Report
Cause_Of_Hazard
No Geological Hazard
Effects_Of_Hazard
Page 1 of 1
3
Wereda Disaster
Risk Profile
National Disaster Risk Management
Commission (NDRMC)
Data_Collected_Date
Thursday, December 12, 2019
Region S.N.N.P
Zone
WOLAYITA
Wereda
HUMBO
Selected Indicator
Hydro Metrological Hazards of the Wereda
Hazard_Name
Hazard_Sub_Type
Drought
Hazard_Sub_Type
Flood
Cause_Of_Hazard
Drought
Erratic rainfall, deforestation, Increase
of surface temperature climate change.
Agricultural expansion, Charcoal
production
Flood
Overflow of the river, lack of dam along
the river, Improper irrigation canal
High rainfall, Poor water ditch with
road, high runoff.
Deforestation, Weakening of soil and
water conservation
Effects_Of_Hazard
Crop failure, loss of vegetation, loss of
pasture land, scarcity of water,
malnutrition
Loss of soil fertility, farm land and crop
damage, water logging on farming land,
Property damage and Migration
Page 1 of 1
4

Wereda Disaster
Risk Profile
National Disaster Risk Management
Commission (NDRMC)
Data_Collected_Date
Thursday, December 12, 2019
Region S.N.N.P
Zone
WOLAYITA
Wereda
HUMBO
Selected Indicator
Socio Economic Hazards of the Wereda
Hazard_Name
Hazard_Sub_Type
No Report
Cause_Of_Hazard
No Socio Economic Hazard
Effects_Of_Hazard
Page 1 of 1
5
Wereda Disaster
Risk Profile
National Disaster Risk Management
Commission (NDRMC)
Data_Collected_Date
Thursday, December 12, 2019
Region S.N.N.P
Zone
WOLAYITA
Wereda
HUMBO
Selected Indicator
Technological Hazards of the Wereda
Hazard_Name
Hazard_Sub_Type
No Report
Cause_Of_Hazard
No Technological Hazard
Effects_Of_Hazard
Page 1 of 1
6

Wereda Disaster
Risk Profile
National Disaster Risk Management
Commission (NDRMC)
Data_Collected_Date
Thursday, December 12, 2019
Region S.N.N.P
Zone WOLAYITA
Wereda HUMBO
Selected Indictor:
Kebele Name
ABAYA GUNUCHO
Disaster Characteristics By Kebele
Disaster_Type Common Period
Year
Worst_ Trends of
Occured Year Effects
Flood
June, May, July
1998,
1999,
2006,
2006,
2007,
2008
Increased
Drought
May and
September
1991,
1998,
2003,
2008
2008
Increased
Root Causes
Change of
River
direction,
Over flow
Bilate river
Shortage of
rainfall
ABELA AJAJA
Livestock
diseases
Drought
April, May,
March
January - June
2000,
2001,
2005,
2006,
2007,
2008
1977,
1994,
2001,
2005,
2007
2008
Increased
Drought,
shortage of
range land
1977
Increased
Deforestation
, erratic
rainfall,
increase
temperature
Effects
Shortage of
food,
destruction
of shelter,
soil erosion
Human and
livestock
disease,
shortage of
food
Loss of
income,
migration
Crop loss,
loss of
pasture,
environment
al change,
water
shortage,
malnutrition
Vulnerability
Existence of Bilate
river, food
insecurity
Shortage of clean
water, high
population
Poor economic
status
Agro ecology of the
area, rain fall
dependent
agricultural system
Coping Strategy
Water and soil
conservation, use
different tracing
methods
Being daily laborer,
request support from
the government
Use traditional
treatment
Firel wood sell,
charcoal sell,
migration, daily
laborer, restocking
7
Page 1 of 28

Wereda Disaster
Risk Profile
National Disaster Risk Management
Commission (NDRMC)
Data_Collected_Date
Thursday, December 12, 2019
Region S.N.N.P
Zone WOLAYITA
Wereda HUMBO
Selected Indictor:
Kebele Name
ABELA AJAJA
Disaster Characteristics By Kebele
Disaster_Type Common Period
Flood
April, July,
August
Year
Occured
1982,
1998,
2008
Worst_
Year
2008
Trends of
Effects
Increased
Root Causes
High amount
of rainfall,
Poor soil and
water
conservation
ABELA GEFETA
Livestock
diseases
January, April
Crop diseases May, July
Drought
March to June
1981,
2001,
2007
1994,
1999,
2003,
2007
1977,
1983,
1987,
1991,
2000,
2006,
2007,200
8
1981
2003
1977
Decreased Breading of
tsetse fly
Decreased Pests, erratic
rainfall
Increased
Deforestation
, climate
change,
erratic
rainfall
Effects
Loss of soil
fertility,
gully
formation,
crop
damage,
property
damage
Crop loss
Crop loss,
loss of
livestock
fodder
Vulnerability
Coping Strategy
Migration, helping
each other,
restocking
Vaccination
Use pesticide
Being rainfall
dependent, practice
traditional
agricultural
technologies
Charcoal selling
8
Page 2 of 28
Wereda Disaster
Risk Profile
National Disaster Risk Management
Commission (NDRMC)
Data_Collected_Date
Thursday, December 12, 2019
Region S.N.N.P
Zone WOLAYITA
Wereda HUMBO
Selected Indictor:
Kebele Name
ABELA GEFETA
Disaster Characteristics By Kebele
Disaster_Type Common Period
Livestock
diseases
April, May, June
Year
Occured
1977,
1983,
1987,
1991,
2000,
2002,
2006,
2007,
2008
Worst_
Year
1977
Trends of
Effects
Increased
Root Causes
Reproduction
of Tsetse fly
Human
diseases
March to June
1980,
1981,
1982,
2008
1980
Decreased
Stagnant
water, miss
use of bed
net
Crop Pest
April to June
1992,
2006,
2007,
2008
2006
Decreased Erratic
rainfall
Flood
April
2003,
2005,
2008
2008
Decreased
Heavy
rainfall,
deforestation
Effects
Livestock
death,
income loss
Vulnerability
presence of large
number of livestock
in the area, poor
awareness
Human
illness, loss
of production
man power
Poor habit of bed
net use, poor
sanitation
Crop yield
reduction
Use similar variety
of seed, poor use of
chemical pesticides
Crop
damage,
property
damage
Geographical
location, poor soil
and water
conservation
practice
Coping Strategy
Medical treatment
(Spray chemicals)
Spray malaria
chemical,
distribution of
mosquito net
Use pest resistant
seed
Construct drainage
dams
9
Page 3 of 28

Wereda Disaster
Risk Profile
National Disaster Risk Management
Commission (NDRMC)
Data_Collected_Date
Thursday, December 12, 2019
Region S.N.N.P
Zone WOLAYITA
Wereda HUMBO
Selected Indictor:
Kebele Name
ABELA LONGENA
Disaster Characteristics By Kebele
Disaster_Type Common Period
Drought
March to June
Year
Occured
1977,
1983,
1991,
2001,
2002,
2007,
2008
Worst_
Year
2008
Trends of
Effects
Increased
Root Causes
Deforestation
, climate
change
Livestock
diseases
January to July
1977,
1984,
2003,
2008
2008
Decreased
Lack of
fodder,
Tsetse fly
ANKA WECHA
Flood
Human
diseases
Drought
April, May
April to June
March, April,
May, June
2002,
2008
1977,
1984,
1988,
2003,
1991,
2000,
2001,
2002,
2003,
2004,
2002
2008
Decreased
Decreased
Heavy
rainfall,
deforestation
Stagnant
water, poor
mosquito net
use
2008
Increased
Deforestation
, lack of
rainfall
10
Effects
Shortage of
water, crop
damage
Vulnerability
Rainfall dependent,
poor agricultural
practice
loss of
livestock
body,
livestock
death
Crop damage
High number of
livestock, poor
awareness
Awareness problem
Economic
loss, human
death
Miss-behavior on
bet net use
Crop
damage, Loss
of income,
shortage of
water,
livestock
damage
Highly dependent
on agricultural
practice, Poor use
of agricultural
technology
Coping Strategy
selling property,
daily laborer
Vaccination ,
medical treatment
Soil and water
conservation
Bed net distribution,
medical treatment
Daily Labor work,
Selling of livestock
Page 4 of 28

Wereda Disaster
Risk Profile
National Disaster Risk Management
Commission (NDRMC)
Data_Collected_Date
Thursday, December 12, 2019
Region S.N.N.P
Zone WOLAYITA
Wereda HUMBO
Selected Indictor:
Kebele Name
ANKA WECHA
BOSA WANCHE
Disaster Characteristics By Kebele
Disaster_Type Common Period
Year
Worst_ Trends of
Occured Year Effects
Livestock
diseases
March, April,
May, June, July
2002,
2003,
2004,
2005,
2006,
2007
Increased
Crop diseases
April, May, June
2003,
2004,
2005,
2007
2007
Increased
Human
diseases
April, May,
June, July
2007,
2008
2007
Increased
Flood
Drought
April, May,
March
February-May
2004,
2005,
2006,
2007,
2008
1973,197
7,1991,2
000,2007
2006
1977
Increased
Increased
Root Causes
Shortage of
water,
shortage of
grass
Loss of
rainfall
Topographic
factor,
shortage of
water
Crop damage
Erratic
rainfall,
deforestation
, Increase of
surface
temperature.
Effects
Vulnerability
Shortage of
income,
poverty
Loss of income,
shortage of water
Crop
damage, Loss
of yield
Types of crop
varieties, Poor
practice of
agriculture
Migration,
Poverty
Environmental
factor, dirty water
Loss of
production
Crop damage, Loss
of income
Crop failure,
loss of
vegetation,
loss of
pasture land,
scarcity of
water,
malnutrition
Scarcity of land,
large family size
Coping Strategy
Use of vaccination
Use of modern
agricultural practice,
use of chemical
pesticide
Go to health center,
Medical services
Soil and water
conservation
Wood selling, daily
labor work, petty
trade, restocking,
food preparation
11
Page 5 of 28

Wereda Disaster
Risk Profile
National Disaster Risk Management
Commission (NDRMC)
Data_Collected_Date
Thursday, December 12, 2019
Region S.N.N.P
Zone WOLAYITA
Wereda HUMBO
Selected Indictor:
Kebele Name
BOSA WANCHE
Disaster Characteristics By Kebele
Disaster_Type Common Period
Year
Worst_ Trends of
Occured Year Effects
Livestock
diseases
March-May
1984,200 1984
0,2008
Increased
Root Causes
High breeding
of tsetse fly,
lack of
pasture land,
scarcity of
water.
Flood
April-July
1998,
2008
2008
Decreased
High rainfall,
Poor water
ditch with
road, High
runoff
Human
diseases
May-June
1980,200 1980
8
Decreased
Breeding of
Mosquito,
Stagnant
water, lack of
balanced
diet, drinking
of unsafe
water, poor
sanitation.
Effects
Vulnerability
Weight loss
of livestock,
Livestock
death,
Reduction of
farming
activities.
Loss of soil
fertility, crop
damage,
water logging
on farming
land,
Property
damage.
Illness,
Mortality and
morbidity,
loss of
income, high
cost, asset
loss.
Scarcity of pasture
land, Scarcity of
domestic water
supply.
Topography of the
land.
Drinking of unsafe
water, lack of
awareness about
draining of stagnant
water, poor
environmental
sanitation.
Coping Strategy
Medication and
vaccination,
Chemical spray,
Traditional
medication, Shifting
of pasture land,
Fodder preparation
Evacuation, diversion
drain, helping one
another.
Medical treatment,
use of Mosquito net,
chemical spray.
12
Page 6 of 28

Wereda Disaster
Risk Profile
National Disaster Risk Management
Commission (NDRMC)
Data_Collected_Date
Thursday, December 12, 2019
Region S.N.N.P
Zone WOLAYITA
Wereda HUMBO
Selected Indictor:
Kebele Name
BOSA WANCHE
Disaster Characteristics By Kebele
Disaster_Type Common Period
Crop diseases May and June
Year
Occured
2007,200
8
Worst_
Year
2008
Trends of
Effects
Increased
Root Causes
Attack of
crop virus,
lack of
rainfall.
Effects
Crop
damage,
yield loss.
Vulnerability
ABAYA CHOKARE
Flood
Drought
Livestock
diseases
April, July,
August
1989,
2003,
2004,
2005,
2006,
2007,
2008
February,
March, April,
May, June
January, March
1977,
1983,
1992,
2002,
2006,
2007
1983,
2000,
2007,
2008
2003
2007
2008
Increased
Increased
Overflow of
the river,
Lack of dam
along the
river,
Improper
irrigation
canal
Deforestation
, Agricultural
expansion,
Charcoal
production
Increased
Loss of
fodder, High
breeding of
tsetse fly
13
Crop
damage, Soil
erosion,
Property
damage
Improper irrigation
system
Fall in crop
production,
Poor pasture,
Shortage of
water,
Malnutrition
Agro-ecological
factors of the area
with high
temperature
Animal
weight loss,
Animal
death,
Weakening of
farming
activities,
Loss of
income
Poor grazing,
Contaminated
water
Coping Strategy
Avoiding of infected
crop from stock or
total removal and
sowing after one
year.
Dam construction,
Soil and water
conservation,
Evacuation
Irrigation, Water
harvesting system,
Daily labor works
Medical treatment,
Vaccination
Page 7 of 28

Wereda Disaster
Risk Profile
National Disaster Risk Management
Commission (NDRMC)
Data_Collected_Date
Thursday, December 12, 2019
Region S.N.N.P
Zone WOLAYITA
Wereda HUMBO
Selected Indictor:
Kebele Name
ABAYA CHOKARE
Disaster Characteristics By Kebele
Disaster_Type Common Period
Year
Worst_ Trends of
Occured Year Effects
Crop diseases May, June
2005,
2006,
2007
2006
Increased
Root Causes
Maize virus
Human
diseases
March, June
1981,
2001,
2005
2001
Decreased
Stagnant
water, High
breeding of
mosquito
DEMBA KOYISHA
Drought
Drought
Crop Pest
January up to
June
January up to
June
July
1997,198
3,2000,2
001,2002
,2005
1977
Increased
Deforestation
and climate
change
1997,198
3,2000,2
001,2002
,2005
1987,198
8,2005
2000
2000
Decreased
Deforestation
and climate
change
Decreased
Lack of crop
resistant
verity
Effects
Vulnerability
Loss of yield,
Lack of
fodder, Low
income
Morbidity
and
mortality,
Loss of
income, Low
productivity
of workers
Crop damage
Loss of crop,
loss of
income
Dependency on
agricultural activity
Poor sanitation
High dependency on
rainfall agriculture
and Poor usage of
modern agricultural
system
Using local verity
crop
Loss of crop,
Loss of
income
Using local verity
crop
Coping Strategy
Removal of infected
crop from stock
Medical treatment,
Use of mosquito bed
net
Daily labor work and
sell properties
Chemical pray, using
pest resistant crop
Chemical pray, using
pest resistant crop
14
Page 8 of 28

Wereda Disaster
Risk Profile
National Disaster Risk Management
Commission (NDRMC)
Data_Collected_Date
Thursday, December 12, 2019
Region S.N.N.P
Zone WOLAYITA
Wereda HUMBO
Selected Indictor:
Kebele Name
DEMBA KOYISHA
Disaster Characteristics By Kebele
Disaster_Type Common Period
Crop Pest
July
Year
Occured
1987,198
8,2005
Worst_
Year
1977
Trends of
Effects
Increased
Root Causes
Lack of crop
resistant
verity
Flood
Flood
Human
diseases
April to July
1984,198
5,2000,2
002 and
2008
1984
Decreased Heavy rainfall
April to July
March, April and
May
1984,198
5,2000,2
002 and
2008
1980,
2007 and
2008
2007
---------
Heavy rainfall
Decreased
Stagnant
water and
mosquito
Human
diseases
Livestock
diseases
March, April and
May
Feb, April, May
1980,
2007 and
2008
1977,200
00,20008
1977
---------
Stagnant
water and
mosquito
Decreased Lack of feed
Effects
Crop damage
Crop damage
Loss of
income
Livestock
death, Loss
of income
Vulnerability
High dependency on
rainfall agriculture
and Poor usage of
modern agricultural
system
Poor settlement,
lack of flood
mitigation
structures and
measures
lack of awareness in
usage of mosquito
net and poor
sanitation and
hygiene practice
lack of veterinary
service
Coping Strategy
Daily labor work and
sell properties
Medical treatment
using traditional
treatment
15
Page 9 of 28

Wereda Disaster
Risk Profile
National Disaster Risk Management
Commission (NDRMC)
Data_Collected_Date
Thursday, December 12, 2019
Region S.N.N.P
Zone WOLAYITA
Wereda HUMBO
Selected Indictor:
Kebele Name
DEMBA KOYISHA
ELA KEBELA
Disaster Characteristics By Kebele
Disaster_Type Common Period
Livestock
diseases
Feb, April, May
Year
Occured
1977,200
00,20008
Worst_
Year
Trends of
Effects
---------
Root Causes
Lack of feed
Crop Pest
July
1987,198 2000
8,2005
Decreased
Lack of crop
resistant
verity
Crop Pest
July
1987,198
8,2005
---------
Lack of crop
resistant
verity
Drought
February, May
1977,
2001,
2007
2001
Increased
Climate
change,
Deforestation
, Rainfall
fluctuation
Livestock
diseases
February, June
2001,
2004,
2007,
2008
2008
Increased
Long dry
season, Loss
of pasture
land, and
water
Flood
April, July
1999,
2008
2008
Increased
High rain fall,
Deforestation
, Weakening
of soil and
water
conservation
Effects
Vulnerability
Loss of crop,
Loss of
income
Using local verity
crop
Crop failure,
Loss of
pasture and
water
Poor agro-ecology
conditions
Animal
weight loss,
Animal
death,
Weakening
farming
activity
Soil erosion,
Property
damage,
Crop damage
Shortage of pasture
land
Topography
Coping Strategy
Chemical pray, using
pest resistant crop
Livestock selling,
Petty trade, Fuel
wood sell, Daily
employment,
Temporary migration
Medication,
Vaccination,
Traditional
medication
Restocking,
Strengthening of
water ways
16
Page 10 of 28

Wereda Disaster
Risk Profile
National Disaster Risk Management
Commission (NDRMC)
Data_Collected_Date
Thursday, December 12, 2019
Region S.N.N.P
Zone WOLAYITA
Wereda HUMBO
Selected Indictor:
Kebele Name
ELA KEBELA
Disaster Characteristics By Kebele
Disaster_Type Common Period
Year
Worst_ Trends of
Occured Year Effects
Root Causes
Human
diseases
March, April,
May, September,
October
1982,
2008
2008
Decreased
Poor use of
bed net, Poor
diet, Poor
sanitation,
Lack of spray
chemical,
Shortage of
clean water
Crop diseases June
2007
2007
Increased
Pest,
Shortage of
rainfall
Effects
Vulnerability
Illness,
Mortality,
Low
productivity
workers
Improper utilization
of mosquito net
Crop damage
HOBICHA DIGISO
Drought
February,
March, April,
May
1971,
1977,
1983,
1997,
2000,
2003,
2005,
2007
1977
Increased
Long dry
season, Low
rainfall
Crop failure,
Loss of yield,
Scarcity of
pasture land,
Shortage of
fodder,
Illness, Loss
of asset in
selling
Land scarcity,
Dependence on
rainfall only
Coping Strategy
Medication,
Vaccination,
Sanitation
Use of chemical
pesticide, Avoiding
of infected crops
from stock
Daily labor work,
Migration, Livestock
selling, Malnutrition,
Saving, Buying of
grass from local
market
17
Page 11 of 28

Wereda Disaster
Risk Profile
National Disaster Risk Management
Commission (NDRMC)
Data_Collected_Date
Thursday, December 12, 2019
Region S.N.N.P
Zone WOLAYITA
Wereda HUMBO
Selected Indictor:
Kebele Name
HOBICHA DIGISO
Disaster Characteristics By Kebele
Disaster_Type Common Period
Livestock
diseases
January,
February, March
Year
Occured
1971,
1977,
1983,
2008
Worst_
Year
1977
Trends of
Effects
Increased
Root Causes
Shortage of
fodder and
water, Long
dry season,
Weakening of
vaccination,
Pests
Flood
April
1973,
1978,
1990,
2008,
1988
2008
Increased
High rainfall,
Deforestation
, Insufficient
soil and
water
conservation
Effects
Vulnerability
Loss of
livestock,
Weakening of
farming
activity,
More
expenditure
for
treatment,
Diminishing
of income
Loss of soil
fertility, High
run-off, Crop
damage,
Gully format,
Property
damage
Shortage of pasture
land
Steepness of the
land
Human
diseases
September,
October,
November,
February,
March, April
1984,
1997,
2000,
2008
2008
Increased
18
Lack of
balanced
diet,
Contaminated
water and
food, Poor
sanitation,
Poor toilet
use
High cost,
Weakening of
working
activity
Scarcity of food,
Poor economic
status
Coping Strategy
Medication,
Vaccination, Fodder
preparation
Strengthening of
water ways,
Restocking, Asset
selling, Cultivating
land with only
farming tools on
behalf of farming
animals
Medical treatment,
Vaccination,
Sanitation
Page 12 of 28

Wereda Disaster
Risk Profile
National Disaster Risk Management
Commission (NDRMC)
Data_Collected_Date
Thursday, December 12, 2019
Region S.N.N.P
Zone WOLAYITA
Wereda HUMBO
Selected Indictor:
Kebele Name
GALICHA KARA
GUTUTO LARENA
Disaster Characteristics By Kebele
Disaster_Type Common Period
Year
Worst_ Trends of
Occured Year Effects
Drought
April, May, June
and July
1998,200
0,2001,2
002,2004
and 2
2000
Increased
Root Causes
Deforestation
, late onset
and erratic
rainfall
Livestock
diseases
Crop diseases
Flood
February,
March, April,
May and June
May, June and
July
April, May, June
and July
1997,199
8,2000,2
001,2004
and 2
1998,200
0,2001,2
003 and
2007
2001,200
3,2004,2
006 and
2008
1998
2001
2008
Increased
Poor livestock
management
system
Increased
Fluctuation of
rainfall
Increased
Heavy rainfall
and poor
settlement
Drought
January-June
1977,
1991,
2000,
2003,
2007,
2008
Increased
Deforestation
, climate
change
Effects
Vulnerability
Crop and
livestock
damage, loss
of income,
migration
Livestock
death, loss of
income
depend on rain fed
agriculture
Shortage of pasture
and water, Poor
livestock
management system
Crop damage
and income
loss
lack of crop disease
resistant crops
Farm land
damage,
crop damage
crop
damage, loss
of income
Lack of flood
mitigation measures
and lack of strong
early warning
system
Rainfall dependent
agriculture
Coping Strategy
Planting short cycle
crops, adopt drought
resistant crops
Vaccination
Using agrochemicals
and other traditional
treatment methods
Evacuation, soil and
water conservation
property selling,
labor work
19
Page 13 of 28

Wereda Disaster
Risk Profile
National Disaster Risk Management
Commission (NDRMC)
Data_Collected_Date
Thursday, December 12, 2019
Region S.N.N.P
Zone WOLAYITA
Wereda HUMBO
Selected Indictor:
Kebele Name
GUTUTO LARENA
HOBICHA BADA
Disaster Characteristics By Kebele
Disaster_Type Common Period
Flood
April- May
Year
Occured
1988,
1989,
2003,
2008
Worst_
Year
2008
Trends of
Effects
Increased
Root Causes
Heavy rainfall
Livestock
diseases
February, March
1997,
1983,
2008,
2008
Decreased Loss of fodder
Crop Pest
April, May
2007,
2008
2007
Increased
Shortage of
rainfall
Human
diseases
April, May
2008
2008
Decreased Poor
sanitation
Drought
February - May
1971,
1977,
1994,
2000,
2007
1977
Increased
Lack of
rainfall,
Erratic
rainfall,
Deforestation
Flood
April, July
1992,
2006,
2008
2008
Increased
High rainfall,
Topographic
character,
poor road
construction
Effects
Crop
damage,
Vulnerability
Awareness problems
Poverty, lack
of animal
product
Poor grazing
systems
Loss of crop
yield
Using similar Varity
crop, cross seed
Loss of
manpower
Lack of chemical
treatment
Crop failure,
Yield loss,
Loss of
pasture,
shortage of
drinking
water
Loss of soil
fertility,
Crop
damage,
water logging
and property
damage
Land scarcity,
Land topography,
Marshy soil type and
settlement of
community
Coping Strategy
Soil and water
conservation
Vaccination
Using chemical,
using technologies
Medical treatment
Daily labor,
migration,
restocking, Asset
selling, fodder
preparation,
charcoal production
Evacuation plan,
building temporary
shelter, daily labor
20
Page 14 of 28

Wereda Disaster
Risk Profile
National Disaster Risk Management
Commission (NDRMC)
Data_Collected_Date
Thursday, December 12, 2019
Region S.N.N.P
Zone WOLAYITA
Wereda HUMBO
Selected Indictor:
Kebele Name
HOBICHA BADA
Disaster Characteristics By Kebele
Disaster_Type Common Period
Livestock
diseases
December to
March
Year
Occured
1983,
1973,
1977,
1996,
2008
Worst_
Year
1977
Trends of
Effects
Increased
Root Causes
High breeding
of tsetse fly
Effects
Loss of
weight and
animal death
Vulnerability
Pasture scarcity,
high breeding of
tsetse fly in the
area
HOBICHA
BONGOTA
Human
diseases
Drought
Livestock
diseases
Human
diseases
June to
November
April, May, June
January,
February, March
January,
February, April,
March
1983,
1977,
1992,
2008
1971,
1977,
1985,
1993,
2000,
1977,
1985,
1998,
2003,
2008
2005,
2007,
2008
1977
Decreased Mosquito
1977
Increased
Lack of rain
fall, Agro
ecological
effect
Mortality and
morbidity ,
loss of
income
Crop failure,
Illness, loss
of yield
Lack of awareness
Poor environmental
sanitation
Deforestation,
charcoal
production, farming
activities
2008
2007
Increased
Loss of
fodders,
shortage of
water
Increased
Malnutrition,
contaminated
water, poor
sanitation
Reducing of
farming
activity,
livestock
death
High cost for
treatment,
death
Firing of grass land,
unavailability of
fodder, Poor
grazing
Poor hygiene in
toilet and drinking
of unsafe water
Coping Strategy
Trapping of tsetse
fly, Medical
treatment, shifting
of grazing land,
Fodder preparation,
spray of chemical
Medication, chemical
spray, proper
utilization of bed net
Charcoal production,
fire wood sell, daily
labor, petty trade
Medical treatment,
borrowing of cattle
from other areas fro
breeding, daily labor
Medical treatment
21
Page 15 of 28
Wereda Disaster
Risk Profile
National Disaster Risk Management
Commission (NDRMC)
Data_Collected_Date
Thursday, December 12, 2019
Region S.N.N.P
Zone WOLAYITA
Wereda HUMBO
Selected Indictor:
Kebele Name
HOBICHA
BONGOTA
Disaster Characteristics By Kebele
Disaster_Type Common Period
Flood
April
Year
Occured
1973,
2008
Worst_
Year
2008
Trends of
Effects
Increased
Root Causes
High rainfall,
deforestation
ABELA ZEGRE
Drought
Human
diseases
Livestock
diseases
Flood
March up to July
April up to
September
March, April,
May
April
1957,
1977,
1983,
1961,
1991,
1977,
1979,
1995,
1980,
1981,
1977,
1980,
1981,
1983,
1984,
2006,
2008
1977
Increased
Deforestation
, climate
change
1995
2008
Decreased
Stagnate of
water,
Mosquito and
poor habit of
bed net use
Decreased Tsetse fly
2008
Decreased
Heavy rain
fall,
deforestation
, Poor soil
and water
conservation
Effects
Vulnerability
Loss of soil
fertility, loss
of crops,
migration
Damage of
crop,
shortage of
grass.
No terrace,
deforestation
Depending on rain
fall, use of poor
agricultural
technology
Loss of
income
Poor use of bed net,
Poor sanitation
Loss of
animal
weight,
Animal death
Awareness problem
Loss of crop
Settlement
problem, awareness
problem, soil and
water conservation
Coping Strategy
Soil and water
conservation, re
cultivation, change
the area
Daily labor work, sell
of wood, grass and
other resources.
Spray chemical,
distribution of bed
net for mosquito
Spray chemical,
medical treatment
Soil and water
conservation
22
Page 16 of 28

Wereda Disaster
Risk Profile
National Disaster Risk Management
Commission (NDRMC)
Data_Collected_Date
Thursday, December 12, 2019
Region S.N.N.P
Zone WOLAYITA
Wereda HUMBO
Selected Indictor:
Kebele Name
ABELA ZEGRE
KODO KANKO
Disaster Characteristics By Kebele
Disaster_Type Common Period
Crop Pest
MAY
Year
Occured
1978,
1992,
2003,
2006,
2007
Worst_
Year
1992
Trends of
Effects
Decreased
Root Causes
Shortage of
rain, erratic
rainfall
Drought
January- June
1977,
1983,
2000,
2007,
2008
1977
Decreased
Deforestation
, climate
change
Flood
April to June
1998,
2005,
2008
1998
Decreased Heavy rainfall
Human
diseases
January, April,
February, July
1982,
2007,
2008
1982
Decreased Lack of
sanitation
Livestock
diseases
Crop Pest
October,
January,
February
April, May
1983,
1984,
2007,
2008`
1994,
2005,
20006,
2007,
2008
1983
1994
Decreased Lack of
fodder
Decreased Shortage of
rain
Effects
Vulnerability
Yield
reduction,
crop damage
Use of variety crop
seeds, low use of
chemical spray
Crop damage
Dependent on
rainfall agriculture
Crop and
property
damage
Settlement and
awareness problem
Loss of
income in
case of
human power
Animal death
and loss of
animal
weight
Lack of awareness
on proper using of
bed net
Poor grazing system
Yield
reduction
Using similar Varity
crop
Coping Strategy
Chemical spray, use
pest resistant seed
Property sell, daily
labor
Water and soil
conservation
Medical treatment
Vaccination
Using pest resistant
seed, using pest side
23
Page 17 of 28

Wereda Disaster
Risk Profile
National Disaster Risk Management
Commission (NDRMC)
Data_Collected_Date
Thursday, December 12, 2019
Region S.N.N.P
Zone WOLAYITA
Wereda HUMBO
Selected Indictor:
Kebele Name
KOYISHA GOLA
Disaster Characteristics By Kebele
Disaster_Type Common Period
Year
Worst_ Trends of
Occured Year Effects
Root Causes
Drought
January up to
June
1977,
1997,
2000,
2003,
2008
1977
Increased
Deforestation
, climate
change
Crop Pest
April & May
1992,
2003
1992
Decreased Shortage of
rain
Effects
Vulnerability
Lack of
income, crop
damage
Dependent on
rainfall
Yield
reduction
Use of variety crop
seeds.
Livestock
diseases
Flood
Human
diseases
February &
March
April & July
April & August
1997,
1983,
2008
2006,
2008
1977,
1979,
1995,
2002,
2008
1997
2008
1995
Decreased Loss of food,
tsetse fly
Decreased Heavy rain,
deforestation
Decreased
Mosquito,
Stagnant
water, Poor
use of bed
net
Poverty, lack
of animal
product
Loss of crop
Loss of
income
Poor grazing
Geographical
location
vulnerability, lack
of awareness
Poor use of bed net,
poor sanitation
Coping Strategy
Daily labor work,
selling of resources
Sowing pest resistant
crop, chemical spray
pesticide
Medical treatment
Soil and water
conservation
Spray chemical,
distribution of bed
nets
24
Page 18 of 28

Wereda Disaster
Risk Profile
National Disaster Risk Management
Commission (NDRMC)
Data_Collected_Date
Thursday, December 12, 2019
Region S.N.N.P
Zone WOLAYITA
Wereda HUMBO
Selected Indictor:
Kebele Name
KOYISHA
OGODAMA
Disaster Characteristics By Kebele
Disaster_Type Common Period
Drought
February,
March, April,
May, June, July
Year
Occured
1991,
1992,
1996,
1999,
2000,
Worst_
Year
2000
Trends of
Effects
Increased
Root Causes
Shortage of
rain fall,
Deforestation
Flood
May, June, July
2001,
2002,
2003,
2008
Crop Pest
April, May,
June, July
Trypanasomia
sis
April, May,
March
2005,
2006,
2007,
2008
2001,
1984,
2000,
2008
2008
2008
2008
Increased
Increased
Topographic
factor,
deforestation
, low
awareness
about soil and
water
conservation
Shortage of
rainfall,
climate
change
Decreased Tsetse fly
Effects
Loss of
income,
malnutrition,
crop
damage,
reduction of
pasture
Crop
damage, loss
of income,
land
degradation
Crop
damage, loss
of yield
Loss of
animal
weight,
animal death
Vulnerability
Highly dependent
on rainfall, poor
agricultural
technology use, less
adaptation of
drought
Un proper
settlement, Lack of
awareness on
terracing
Types of crop
variety, poor
practice of
agriculture
High number of
tsetse fly in the
area, lack of
awareness
Coping Strategy
Daily labor,
destocking,
temporary migration
Soil and water
conservation,
terracing, a
forestation
By using chemical
spray, use of modern
agricultural practice
Spray of chemical,
medical treatment
25
Page 19 of 28

Wereda Disaster
Risk Profile
National Disaster Risk Management
Commission (NDRMC)
Data_Collected_Date
Thursday, December 12, 2019
Region S.N.N.P
Zone WOLAYITA
Wereda HUMBO
Selected Indictor:
Kebele Name
KOYISHA
OGODAMA
KOYISHA
WANGALA
Disaster Characteristics By Kebele
Disaster_Type Common Period
Human
diseases
April, May, June
Year
Occured
2001,
2002,
2003,
2006,
2007,
Worst_
Year
2008
Trends of
Effects
Increased
Drought
February,
March, May,
June, July
2000,
20002,
2004,
2006,
2007,
2008
2008
Increased
Flood
March, May,
June, July
2000,
2002,
2005,
2007,
2008
2008
Increased
Livestock
diseases
February, April,
May, June, July
2000,
2002,
2005,
2007,
2008
2007
Increased
Root Causes
Erratic
rainfall,
Stagnant
water
Shortage of
rain,
population
growth
Low soil and
water
conservation
Shortage of
water and
animal food
Effects
Vulnerability
Illness,
human
death, loss of
income
Poor use of
mosquito bed net
Loss of
income,
asset loss,
animal death
Shortage of farm
land
Crop damage
Productive soil
highly eroded,
Improper
settlement
Livestock
death, loss of
income
Lack of pasture
Coping Strategy
Spray chemical,
medical treatment,
use of bed net,
avoiding of stagnant
water
Daily labor
Soil and water
conservation, using
tracing
Vaccination
26
Page 20 of 28

Wereda Disaster
Risk Profile
National Disaster Risk Management
Commission (NDRMC)
Data_Collected_Date
Thursday, December 12, 2019
Region S.N.N.P
Zone WOLAYITA
Wereda HUMBO
Selected Indictor:
Kebele Name
KOYISHA
WANGALA
AMBE SHOYA
Disaster Characteristics By Kebele
Disaster_Type Common Period
Road shortage
February, April,
May, June, July
Year
Occured
2000,
2002,
2003,
20004,20
05, 2006,
2007,
2008
Worst_
Year
2008
Trends of
Effects
Increased
Root Causes
Lack of
infrastructure
Crop Pest
May, June, July
2006,
2007,200
8
2006
Decreased Shortage of
rainfall
Drought
April, May,
June, July
1997,
1998,
1999,
2000,
2007,
2008
Increased
Climate
change,
unseasonal
rain fall
Flood
April, May, June
2000,
2001,
2002,
2003,
2006,
2008
Increased
Topographic
factor
Crop Pest
May, June, July
1991,
2000,
2007,
2008
1991
Increased
Shortage of
rain fall
Effects
Death of
pregnant
women
Crop damage
and shortage
of income
Migration,
disease
Crop
damage, loss
of soil
fertility
Crop
damage, low
production
Vulnerability
No access to road,
less attention for
road construction
Lack of different
varity crop, poor
farming system
Low production,
unseasonal rain fall
Crop damage, loss
of fertile soil from
top cover
Crop damage, low
production
Coping Strategy
Community
participation on road
construction
Using of pestside
chemicals
Daily labor works,
soil and water
conservation, selling
fire woods and
charcoal
Control soil and
water erosion,
diverting of flood
direction
Spray chemical,
pesticides
27
Page 21 of 28

Wereda Disaster
Risk Profile
National Disaster Risk Management
Commission (NDRMC)
Data_Collected_Date
Thursday, December 12, 2019
Region S.N.N.P
Zone WOLAYITA
Wereda HUMBO
Selected Indictor:
Kebele Name
AMBE SHOYA
AMPO KOYISHA
Disaster Characteristics By Kebele
Disaster_Type Common Period
Livestock
diseases
February,
March, April,
May, June
Year
Occured
2000,
2002,
2007,
2008
Worst_
Year
2008
Trends of
Effects
Increased
Drought
March, April,
May
1973,
1977,
1983,
2000,
2007
2007
Increased
Root Causes
Shortage of
grass and
water
Climate
change,
shortage of
rainfall,
deforestation
Effects
Vulnerability
Poverty, loss
of income
Loss of milk and
butter production
Crop failure, The area of high
loss of fodder temperature
Drought
Human
diseases
March, April,
May
October,
November,
December
1973,
1977,
1983,
2000,
2007
1983,
1981,
2005,
2008
2008
2008
Decreased
Climate
change,
shortage of
rainfall,
deforestation
Decreased
Poor
sanitation,
mosquito,
poor use of
bed net, no
spray
chemical
Loss of life,
Poor health
condition,
high cost for
treatment
Loss of life,
Poor health
condition,
high cost for
treatment
Poor toilet use
Poor toilet use
Coping Strategy
Vaccination
Daily labor, selling of
assets, temporary
migration, borrowing
of money, petty
trade, restocking,
irrigation
Medical treatment,
vaccination
Medical treatment,
Vaccination
28
Page 22 of 28

Wereda Disaster
Risk Profile
National Disaster Risk Management
Commission (NDRMC)
Data_Collected_Date
Thursday, December 12, 2019
Region S.N.N.P
Zone WOLAYITA
Wereda HUMBO
Selected Indictor:
Kebele Name
AMPO KOYISHA
Disaster Characteristics By Kebele
Disaster_Type Common Period
Human
diseases
October,
November,
December
Year
Occured
1983,
1981,
2005,
2008
Worst_
Year
2007
Trends of
Effects
Increased
Flood
April, July
1988,
2008
2008
Increased
Root Causes
Poor
sanitation,
mosquito,
Poor use of
bed net, No
spray
chemical
High rainfall,
Slope of the
land,
Deforestation
Flood
Human
diseases
April, July
October,
November,
December
1988,
2008
1983,
1981,
2005,
2008
2008
---------
Decreased
High rainfall,
Slope of the
land,
deforestation
Poor
sanitation,
mosquito,
poor use of
bed net, lack
of spray
chemical
Effects
Vulnerability
Crop failure, The area of high
loss of fodder temperature
Crop
damage, soil
erosion, loss
of soil
fertility,
property
damage
Topography of the
area
Poor health
condition,
high cost for
treatment,
loss of life
Poor toilet use
Coping Strategy
Daily labor, selling of
assets, temporary
migration, borrowing
of money, petty
trade, restocking,
irrigation
Re-cultivation,
restocking, daily
labor, borrowing of
money, petty trade
Medical treatment,
vaccination
29
Page 23 of 28
Wereda Disaster
Risk Profile
National Disaster Risk Management
Commission (NDRMC)
Data_Collected_Date
Thursday, December 12, 2019
Region S.N.N.P
Zone WOLAYITA
Wereda HUMBO
Selected Indictor:
Kebele Name
AMPO KOYISHA
SERE TAWURETA
Disaster Characteristics By Kebele
Disaster_Type Common Period
Human
diseases
October,
November,
December
Year
Occured
1983,
1981,
2005,
2008
Worst_
Year
Trends of
Effects
---------
Crop diseases
Crop diseases
Drought
Flood
Crop Pest
May, June
May, June
February,
March, April,
May, June, July
May, June, July
April, May, June
and July
2006,
2007,
2008
2007
2006,
2007,
2008
2000,
2001,
2002,
2006,200
7,2008
2001,200
2,2003,2
006,2008
2008
2008
2008
2008
Increased
---------
Increased
Increased
Increased
Root Causes
Poor
sanitation,
mosquito,
poor use of
bed net, lack
of spray
chemical
Pests
Pests
Climate
change
Topographic
factor, highly
eroded area
Shortage of
rainfall
Effects
Vulnerability
Loss of yield,
selling of
assets
Human
disease and
migration
crop damage,
human disease
Crop and
property
damage
Crop
damage, loss
of income
Poor soil and water
conservation
Climate change
Coping Strategy
Avoiding of infected
crop
Daily labor, uses top
short time crop
some how water and
soil conservation,
tracing
using pest side
30
Page 24 of 28

Wereda Disaster
Risk Profile
National Disaster Risk Management
Commission (NDRMC)
Data_Collected_Date
Thursday, December 12, 2019
Region S.N.N.P
Zone WOLAYITA
Wereda HUMBO
Selected Indictor:
Kebele Name
SERE TAWURETA
SHOCHORA
ABELA
Disaster Characteristics By Kebele
Disaster_Type Common Period
Crop diseases
March, May,
April, June and
July
Year
Occured
2000,
2001,
2002,
2003,
2008
Worst_
Year
2000
Trends of
Effects
Increased
Road shortage Throughout the
All
year
2008
Increased
Drought
Flood
Crop Pest
Livestock
diseases
January,
February,
March, April,
May, June
March, April,
July, August
April, May, June
February,
March, May,
April, June
2000,
2005,
2002,
2003,
2005,
2001,
2003,
2004,
2006,
2008
2002,
2005,
2006
2008
2000,
2005,
2007,
2008
2008
Increased
2008
Increased
2005
Increased
2005
Increased
Root Causes
Lack of
animal feed,
shortage of
water
Less attention
on road
construction
Shortage of
rainfall,
climate
change
Deforestation
, agro
ecological
factors
Shortage of
rainfall,
climate
change
Shortage of
water and
grass
Effects
Poverty, loss
of income
Death of
pregnant
women
Asset
depletion,
malnutrition,
migration
Crop
damage, loss
of soil
fertility
Crop
damage, loss
of income
Loss of
animal
weight,
animal death
Vulnerability
Drought
Lack of
transportation
High dependency on
rainfall, shortage of
farm land
Un proper
settlement, lack of
awareness about
terracing
Poor agricultural
practice, types of
crop variety
High number of
tsetse fly, lack of
awareness about
tsetse fly
Coping Strategy
vaccination
By building Gaban
working, maintain
roads
Daily labor work,
selling of livestock,
temporary migration
Soil and water
conservation, a
forestation,
terracing
Use of modern
agricultural practice
Spray of chemical,
medical treatment,
proper utilization of
mosquito bed net
31
Page 25 of 28

Wereda Disaster
Risk Profile
National Disaster Risk Management
Commission (NDRMC)
Data_Collected_Date
Thursday, December 12, 2019
Region S.N.N.P
Zone WOLAYITA
Wereda HUMBO
Selected Indictor:
Kebele Name
SHOCHORA
ABELA
SHOCHORA
FESHO
Disaster Characteristics By Kebele
Disaster_Type Common Period
Year
Worst_ Trends of
Occured Year Effects
Human
diseases
May, June, July
2005,
2006,
2007,
2008
2005
Increased
Drought
January,
February, March
1997,
2000,
2003,
2007
2000
Increased
Root Causes
Erratic rain
fall, Stagnant
water
Climate
change, High
temperature
Flood
March, July,
August
1993,
1995,
1998,
2002,
2004,
2008
2008
Increased
High rain fall,
Low
vegetation
cover
Livestock
diseases
January,
February
Crop diseases
March, April,
May
2000,
2008
2000,
2007
2000
2000
Increased
Increased
Loss of
fodder,
Decline of
grass land
Climate
change
32
Effects
Vulnerability
Illness,
Death, Loss
of income
Un proper
utilization of
mosquito bed net,
lack of bed net
Crop
damage, Loss
of vegetation
and grass,
Loss of
property,
Famine
Soil erosion,
Crop
damage,
Gully
formation,
Loss of soil
fertility,
Land
degradation
Loss of
assets, Loss
of property
Low a forestation,
Cutting of ever
green trees,
Planting of
eucalyptus tree only
Insufficient soil and
water conservation
Dependence on
rainfall only
Famine, Crop
damage
Insufficient use of
improved fertilizer
and crops
Coping Strategy
Medical treatment,
proper utilization of
mosquito bed net
Borrowing of money
and food from
relatives, Selling of
domestic animals,
Daily labor works
Re-cultivation, Aid
Page 26 of 28

Wereda Disaster
Risk Profile
National Disaster Risk Management
Commission (NDRMC)
Data_Collected_Date
Thursday, December 12, 2019
Region S.N.N.P
Zone WOLAYITA
Wereda HUMBO
Selected Indictor:
Kebele Name
SHOCHORA
FESHO
Disaster Characteristics By Kebele
Disaster_Type Common Period
Year
Worst_ Trends of
Occured Year Effects
Root Causes
Human
diseases
February,
March, April,
May
2000
2000
Decreased
Malnutrition,
Poor
sanitation
SHOCHORA
OGODAMA
Drought
Crop Pest
January up to
June
April, May
1977,
1997,
2000,
2003,
2008
1992,
2003
1977
Increased
Deforestation
, Climate
change
1992
Decreased Loss of rain
Effects
Vulnerability
Loss of life,
Loss of
working
human power
Lack of
income, Crop
damage
Poor use of
mosquito bed net,
Poor sanitation and
toilet use
Dependence on
rainfall
Yield
reduction
Use variety of crops
Livestock
diseases
Flood
Human
diseases
February, March
April, July
1997,
1983,
2008
2006,
2008
April up to
August
1977,
1979,
1995,
2002,
2008
1997
2008
1995
Decreased
Loss of
fodder,
Tsetse fly
Decreased
Decreased
Heavy
rainfall,
Deforestation
Mosquito,
Stagnant of
water, Poor
use of
mosquito bed
net
Poverty,
Reduction of
production
Crop damage
Poor grazing
Topography, Lack of
awareness
Loss of
income
Poor use of
mosquito bed net,
Poor sanitation
Coping Strategy
Medical treatment
Daily labor work, Sell
of assets
Planting of pest
resistant crops,
Spray chemical
pesticide
Medical treatment
Soil and water
conservation
Spray chemical,
Distribution of
treated bed net
33
Page 27 of 28

Wereda Disaster
Risk Profile
National Disaster Risk Management
Commission (NDRMC)
Data_Collected_Date
Thursday, December 12, 2019
Region S.N.N.P
Zone WOLAYITA
Wereda HUMBO
Selected Indictor:
Kebele Name
SHOCHORA OSE
Disaster Characteristics By Kebele
Disaster_Type Common Period
Drought
January up to
June
Year
Occured
1977,
1997,
2000,
2003,
2008
Worst_
Year
1977
Trends of
Effects
Increased
Root Causes
Deforestation
, Climate
change
Crop Pest
April, May
1992,
2003
1992
Decreased Loss of rain
Effects
Vulnerability
Lack of
income, Crop
damage
Dependent on rain
fall
Yield
reduction
Use of variety crop
seeds
Livestock
diseases
February, March
1983,
1997,
2008
1983
Decreased
Loss of
fodder,
Tsetse fly
Flood
April, July
2006,
2008
2008
Decreased
Heavy
rainfall,
Deforestation
Human
diseases
April up to
August
1977,
1979,
1995,
2002,
2008
1995
Decreased
Mosquito,
Stagnant
water, Poor
use of
mosquito bed
net
IMPORTANT: The years and months mentoned in this report are according to Ethiopian Calendar (EC).
Poverty, Loss
of animal
weight
Crop damage
Poor grazing
Topography factors,
Lack of awareness
Loss of
income
Poor use of
mosquito bed net,
Poor sanitation
Coping Strategy
Daily labor work,
Selling of assets
Use of pest resistant
crops, Spray
chemical pesticide
Medical treatment
Soil and water
conservation
Spray chemical,
Distribution of
treated bed net
34
Page 28 of 28

Wereda Disaster
Risk Profile
Data_Collected_Date
Region S.N.N.P
Zone WOLAYITA
Selected Indictor:
KebeleName
ABAYA GUNUCHO
Hazards: Conflict as an Issue
Description_Of_Conflict
There was conflict in 1993 and 1994
ABELA AJAJA
ABELA GEFETA
ANKA WECHA
BOSA WANCHE
Low
No conflict
No Conflict
There is conflict.
GALICHA KARA
GUTUTO LARENA
HOBICHA BONGOTA
HOBICHA BADA
ABELA ZEGRE
KOYISHA GOLA
KODO KANKO
KOYISHA OGODAMA
No
Low
Low
Medium
No conflict
No conflict
National Disaster Risk Management
Commission (NDRMC)
Thursday, December 12, 2019
Wereda HUMBO
Change_In_Last_Decade
Decrease
Main_Causes_Of_Conflict
Boundary between
Wolayita and Sidama
No
Decreased
Decreased
Decreased
Decreased
No
Boundary between two
kebeles, Prohibition of
cultivation land, Poor
social interaction of people
around boundary.
Conflict with Ampokoysha
kebele by water resource
Awareness creation,
Immediate solution for
conflicts.
Boundary between two
neighbor kebeles
35
Page 1 of 2
Wereda Disaster
Risk Profile
Data_Collected_Date
Region S.N.N.P
Zone WOLAYITA
Selected Indictor:
KebeleName
AMBE SHOYA
Hazards: Conflict as an Issue
Description_Of_Conflict
No conflict
KOYISHA WANGALA
Land
AMPO KOYISHA
Low
SHOCHORA ABELA
No
DEMBA KOYISHA
SERE TAWURETA
No
ABAYA CHOKARE
Medium
ELA KEBELA
Low
HOBICHA DIGISO
Medium
SHOCHORA OSE
SHOCHORA OGODAMA
SHOCHORA FESHO
No conflict
No conflict
Medium
National Disaster Risk Management
Commission (NDRMC)
Thursday, December 12, 2019
Wereda HUMBO
Change_In_Last_Decade
Main_Causes_Of_Conflict
Decrease
Better
Boundary conflict
Government interference
Decreased
Minimized
Increased
Decreased
Boundary between Wolaita
and Sidama
Government interference
and local elders
Because of boundary
between neighbor kebeles
Boundary between
neighbor
36
Page 2 of 2
Wereda Disaster Risk
Profile
Data_Collected_Date
National Disaster Risk Management
Commission (NDRMC)
Thursday, December 12, 2019
Region S.N.N.P
Zone
WOLAYITA
Wereda
HUMBO
Selected Indicator: Hazard Situation During Last Disaster - Characteristics of most recent disasters that affected the community
KebeleName
Types of Disasters
Hazard_Description
Effect_Of_Disaster
Most_Severly_Affected
Reason
ABAYA GUNUCHO
Flood
ABELA AJAJA
Flood
High magnitude
Human disease,
migration
Pregnant women, elders,
children and poor people
Economically and
physically not
capable to this
disaster
ABELA GEFETA
ANKA WECHA
Drought
Drought
BOSA WANCHE
Flood
ABAYA CHOKARE
Flood
DEMBA KOYISHA
Drought
Very high
All Anka Wecha kebele in April, May,
June, July
One month (April), Very high in
magnitude.
Very high in magnitude for one
month, April
Very high from January to June
Migration
Children, women, elder
Migration, Loss of
income
Children, Pregnant
women, Elders
Crop damage, Soil
erosion, Property
damage, Water
logging on farming
land, Road
deterioration.
Property damage,
Animal death, Soil
erosion, Evacuation,
Crop damage
Assets depletion, crop
damage
Children, Elders,
Pregnant and Lactating
women.
Lactating and pregnant
women, Children and
Elders
Children, Elder, Women
They have poor
capacity and low
income sources
They are low
income groups,
Lack of capacity to
cope
Low capacity for
resistance, Unable
to participate in
income generating
activity.
Low capacity to
cope disaster
Lack of capacity
37
Page 1 of 4

Wereda Disaster Risk
Profile
Data_Collected_Date
National Disaster Risk Management
Commission (NDRMC)
Thursday, December 12, 2019
Region S.N.N.P
Zone
WOLAYITA
Wereda
HUMBO
Selected Indicator: Hazard Situation During Last Disaster - Characteristics of most recent disasters that affected the community
KebeleName
ELA KEBELA
Types of Disasters
Animal disease
HOBICHA DIGISO
Drought
GALICHA KARA
Drought
GUTUTO LARENA
HOBICHA BADA
Drought
Flood
HOBICHA BONGOTA
Animal Disease
ABELA ZEGRE
Drought
KODO KANKO
KOYISHA GOLA
Drought
Drought
Hazard_Description
High magnitude from January up to
May
January up to March, High magnitude
The effect of the disaster were
covered all area of the kebele and it
was high in its magnitude
Very high
Very high for one month
High
Very high from April to June
Very high
Very high fro January up to June
Effect_Of_Disaster
Loss of livestock, Loss
of farming animals
Seasonal fluctuation,
Loss of livestock, Loss
of grass land, Scarcity
of water
Loss of income,
Migration
Crop damage, Loss of
asset
Crop damage, soil
erosion, property
damage
Livestock death
Assets depletion,
damage of crop, Lack
of pasture,
Malnutrition
Asset depletion, crop
damage, malnutrition
Damage of crops
Most_Severly_Affected
Children, Elders,
Pregnant and lactating
women
Children, Lactating and
pregnant women, Elders
Children, pregnant and
lactating women
Women, children, elders
children, elders,
pregnant and lactating
women
Lactating and pregnant
women, Childs, Elders
Children, Elder and
Women
children, women,
eElders
Children, Women s and
Elders
Reason
Low capacity to
cope the impact of
the disaster
low capacity to
cope with the
effect of disaster
Lack of capacity
low capacity, low
ability to escape
from disaster
Lack of capacity,
Low income
Lack of capacity
Lack of capacity
38
Page 2 of 4

Wereda Disaster Risk
Profile
Data_Collected_Date
National Disaster Risk Management
Commission (NDRMC)
Thursday, December 12, 2019
Region S.N.N.P
Zone
WOLAYITA
Wereda
HUMBO
Selected Indicator: Hazard Situation During Last Disaster - Characteristics of most recent disasters that affected the community
KebeleName
Types of Disasters
Hazard_Description
Effect_Of_Disaster
Most_Severly_Affected
Reason
KOYISHA OGODAMA
Drought
KOYISHA WANGALA
Drought
AMBE SHOYA
Drought
AMPO KOYISHA
Flood
SERE TAWURETA
SHOCHORA ABELA
Drought
Drought
SHOCHORA FESHO
Flood
SHOCHORA
OGODAMA
Drought
Very high from March to June
In all kebeles very high( February-
July)
All kebele areas include in 2008 E.C
April, High intensity
Very high, (March- July)
All kebele includes, very high, March
up to July
High rainfall intensity and soil erosion
Very high from January up to June
39
Crop damage,
malnutrition,
reduction of pasture,
loss of income
Crop damage,
malnutrition, range
land and pasture
problems
Migration, Loss of
income
Children, elders,
pregnant women
Children, pregnant
women, elder
Children, Elders,
Pregnant women
Crop damage, Soil
erosion, Property
damage
Crop damage, loss of
income
Crop damage,
Malnutrition, Loss of
income
Property damage, Loss
of assets, Leaching of
top fertile soil, Human
death
Assets depletion, Crop
damage
Children, Elders,
Pregnant and Lactating
women
Elder, children, Women
Children, Pregnant
women, Elders
Children, Disabled
group, Elders, Pregnant
women
Children, Women, Elders
Low capacity to
cope and law
income
Lack of capacity,
they are low
economic class
Shortage of farm
land, Shortage of
income, Lack of
capacity
Low adaption to the
hazard
Lack of capacity to
resist
They have low
income and lack of
capacities.
Lack of capacity
Page 3 of 4
Wereda Disaster Risk
Profile
Data_Collected_Date
National Disaster Risk Management
Commission (NDRMC)
Thursday, December 12, 2019
Region S.N.N.P
Zone
WOLAYITA
Wereda
HUMBO
Selected Indicator: Hazard Situation During Last Disaster - Characteristics of most recent disasters that affected the community
KebeleName
Types of Disasters
Hazard_Description
Effect_Of_Disaster
Most_Severly_Affected
Reason
SHOCHORA OSE
Drought
Very high from January up to June
Asset depletion, Crop
damage
Children, Women, Elders
Lack of capacity to
cope the impact of
disaster.
40
Page 4 of 4
Data_Collected_Date
Region S.N.N.P
Zone WOLAYITA
Selected Indictor: Frequency of Disaster Occurrence
Wereda
Thursday, December 12, 2019
HUMBO
Conflicts
Crop diseases
DK
Drought
Economic / Price shock
Flood
Heat waves/ High temp
Heavy Rain
Human diseases
Landslide
Livestock diseases
Road Accident
Storms / hail storm
33.33
33.33
33.33
16.67
16.67
37.50
29.17
100.00
21.04
44.21
29.27
5.49
66.67
33.33
9.14
13.71
22.86
53.71
0.57
100.00
50.00
50.00
18.67
26.00
22.00
32.67
0.67
25.00
75.00
10.46
20.92
45.19
23.43
33.33
66.67
33.33
66.67
41
Page 1 of 1
Data_Collected_Date
Region S.N.N.P
Zone WOLAYITA
Selected Indictor: Household Exposure to Hazards
Disaster Type
Drought
Livestock diseases
Flood
Human diseases
Crop diseases
Storms / hail storm
Heavy Rain
Economic / Price shock
Heat waves/ High temp
Frost / Cold waves
Forest Fires
Landslide
No Disaster
Conflicts
Road Accident
DK
Earthquake
Thursday, December 12, 2019
Wereda HUMBO
General_Exposure
27.45
21.15
17.40
15.73
6.91
2.80
2.27
1.66
1.05
0.87
0.70
0.70
0.52
0.44
0.26
0.17
0.09
Last_Five_Years_Exposure
32.71
25.54
17.98
16.31
4.91
0.29
0.20
0.29
0.69
0.39
0.10
0.29
0.29
0.10
42
Page 1 of 1
Wereda Disaster
Risk Profile
Data_Collected_Date
Region S.N.N.P
Selected Indictor:
Zone WOLAYITA
Months of Occurrence of Frequent Disasters
National Disaster Risk Management
Commission (NDRMC)
Thursday, December 12, 2019
Wereda HUMBO
Conflicts
Crop diseases
DK
Drought
Economic / Price shock
Flood
Heat waves/ High temp
Human diseases
Landslide
Livestock diseases
Road Accident
Storms / hail storm
50.00
50.00
14.29
28.57
33.33
23.81
100.00
0.91
1.36
1.36
0.45
23.18
26.82
25.91
17.27
1.82
0.45
0.45
66.67
33.33
3.26
9.78
8.70
59.78
18.48
100.00
3.70
8.33
1.85
6.48
4.63
14.81
17.59
25.93
10.19
0.93
3.70
1.85
66.67
33.33
0.65
1.31
4.58
4.58
11.11
36.60
24.84
8.50
7.19
0.65
100.00
100.00
43
Page 1 of 1
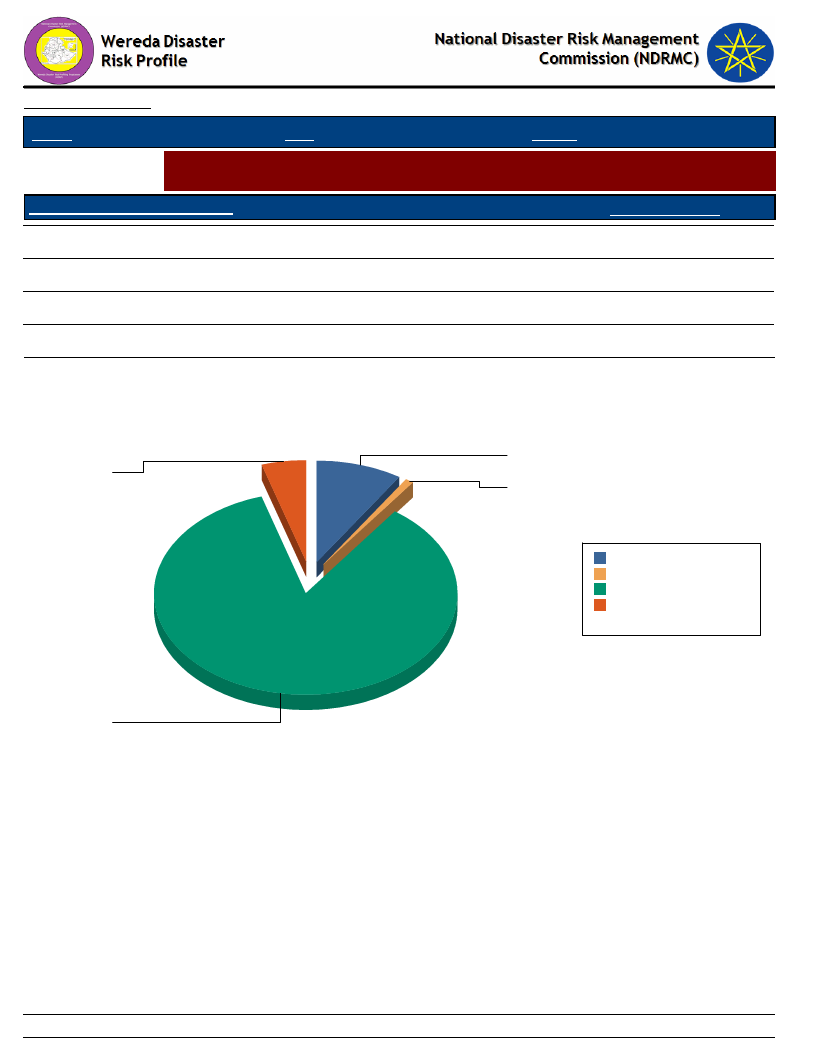
Data_Collected_Date
Thursday, December 12, 2019
Region S.N.N.P
Zone WOLAYITA
Wereda HUMBO
Selected Indictor:
Conflicts: Perception of households on conflict issues - Is conflict an issue in this
community?
Is Conflict an Issue in Community?
Response_Percent
Yes
4.75
No
85.22
DK
9.23
NA
0.79
Is Conflict an Issue in Community?
DK
Yes
9.2
4.8
NA
0.8
DK
9.2 9.2%
NA
0.8 0.8%
No 85.2 85.2%
Yes 4.8 4.8%
Total: 100.0 100.0%
No
85.2
44
Page 1 of 1
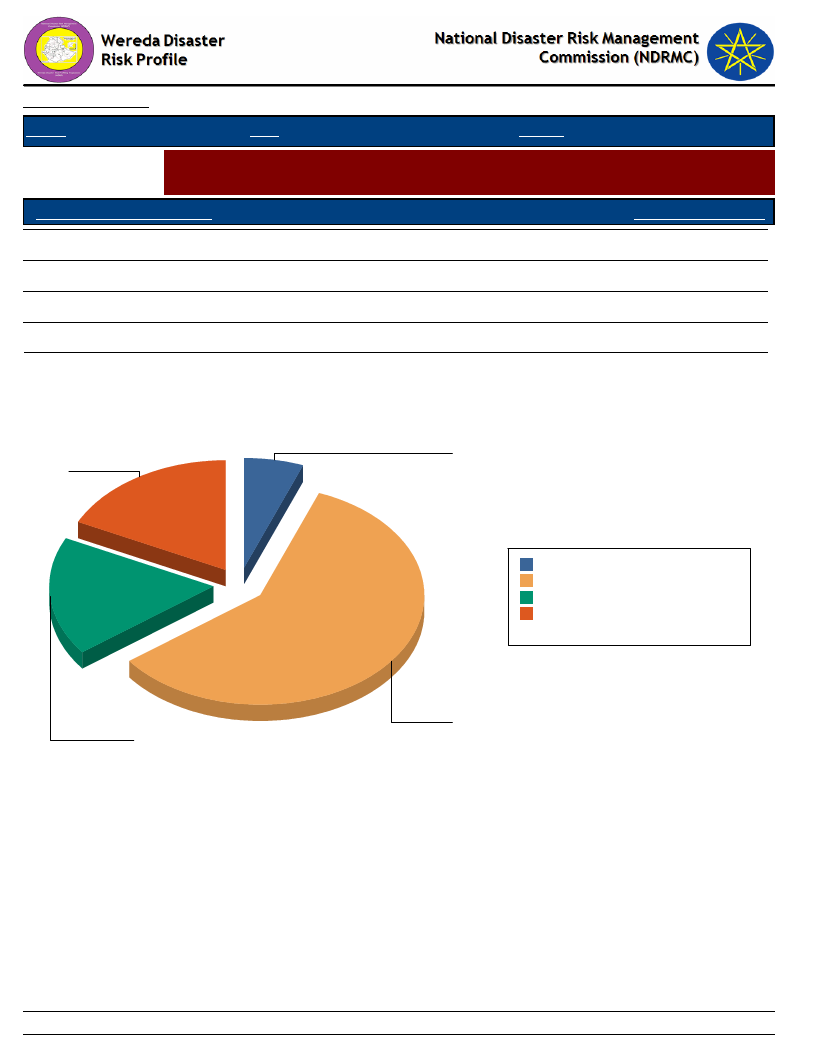
Data_Collected_Date
Region S.N.N.P
Zone WOLAYITA
Thursday, December 12, 2019
Wereda HUMBO
Selected Indictor:
Conflicts: Perception of households on conflict issues - Who To Turn To in case
of Conflict?
Who To Turn During Conflict?
Response_Percentage
Family members
17.65
Elders
58.82
Amakaris
5.88
Police
17.65
Who To Turn During Conflict?
Police
18
Amakaris
6
Family members
18
Amakaris
Elders
Family members
Police
6 5.9%
59 58.8%
18 17.6%
18 17.6%
Total:
100 100.0%
Elders
59
45
Page 1 of 1
Data_Collected_Date
Region S.N.N.P
Zone WOLAYITA
Thursday, December 12, 2019
Wereda HUMBO
Selected Indictor: Losses from Disasters - Losses from all disasters (household response in %)
Type of Loss
Main_Loss_Percent
Secondary_Loss_Percent
Physical damages on houses and property
2.81
6.32
Crop damage
41.13
4.65
Livestock damage
25.65
6.88
Death of household members
1.08
0.93
Illness/health problems
16.99
3.53
Loss of access to social services, including school
0.32
2.79
Loss of income
6.93
47.21
Loss of savings
2.71
21.00
Livestock were stolen
0.00
0.19
Lost access to grazing land
1.19
3.72
Lost access to water source
0.32
0.74
Had to flee/change residence area
0.65
1.67
Other losses/damages
0.11
0.19
NA
0.00
0.19
46
Page 1 of 1
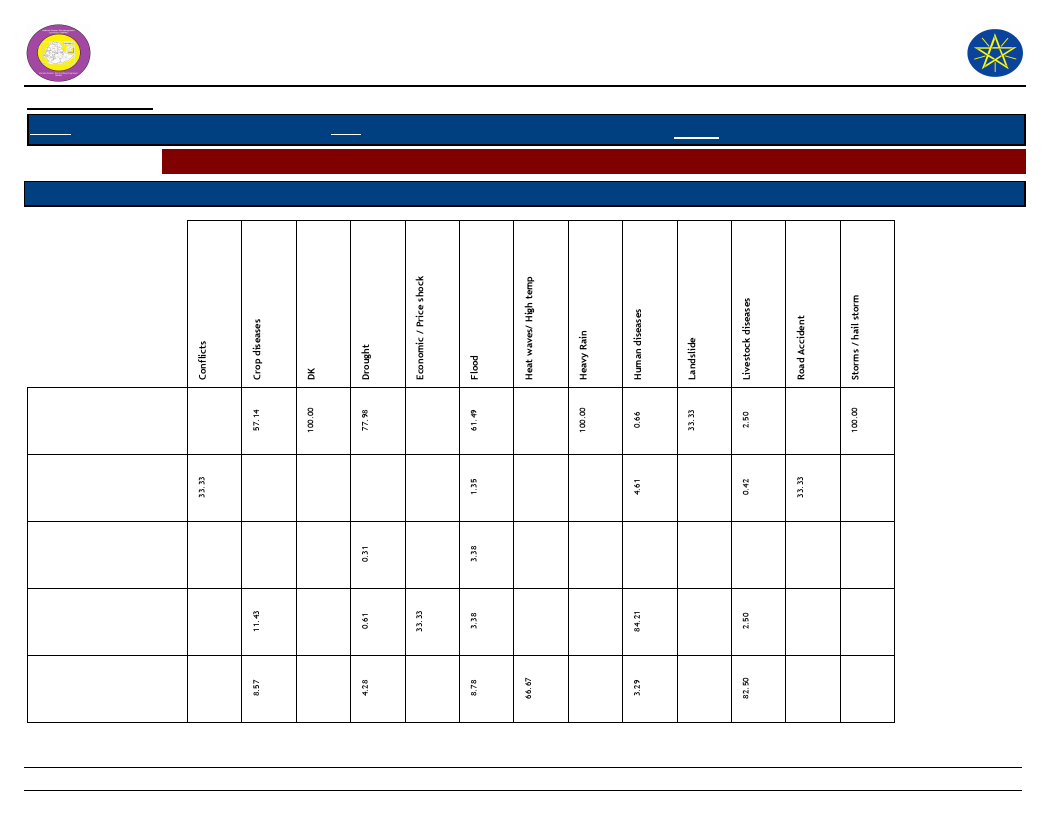
Wereda Disaster
Risk Profile
National Disaster Risk Management
Commission (NDRMC)
Data_Collected_Date
Region S.N.N.P
Zone WOLAYITA
Wereda HUMBO
Thursday, December 12, 2019
Selected Indictor: Losses from Disasters - Main Losses by Type of Disasters (household response in %)
Type of Loss
Type of Disasters which mainly caused Listed Losses
Crop damage
Death of household
members
Had to flee/change
residence area
Illness/health problems
Livestock damage
47
Page 1 of 3

Wereda Disaster
Risk Profile
National Disaster Risk Management
Commission (NDRMC)
Data_Collected_Date
Region S.N.N.P
Zone WOLAYITA
Wereda HUMBO
Thursday, December 12, 2019
Selected Indictor: Losses from Disasters - Main Losses by Type of Disasters (household response in %)
Type of Loss
Type of Disasters which mainly caused Listed Losses
Loss of access to social
services, including
school
Loss of income
Loss of savings
Lost access to grazing
land
Lost access to water
source
48
Page 2 of 3

Wereda Disaster
Risk Profile
National Disaster Risk Management
Commission (NDRMC)
Data_Collected_Date
Region S.N.N.P
Zone WOLAYITA
Wereda HUMBO
Thursday, December 12, 2019
Selected Indictor: Losses from Disasters - Main Losses by Type of Disasters (household response in %)
Type of Loss
Type of Disasters which mainly caused Listed Losses
No Losses
Other losses/damages
Physical damages on
houses and property
49
Page 3 of 3
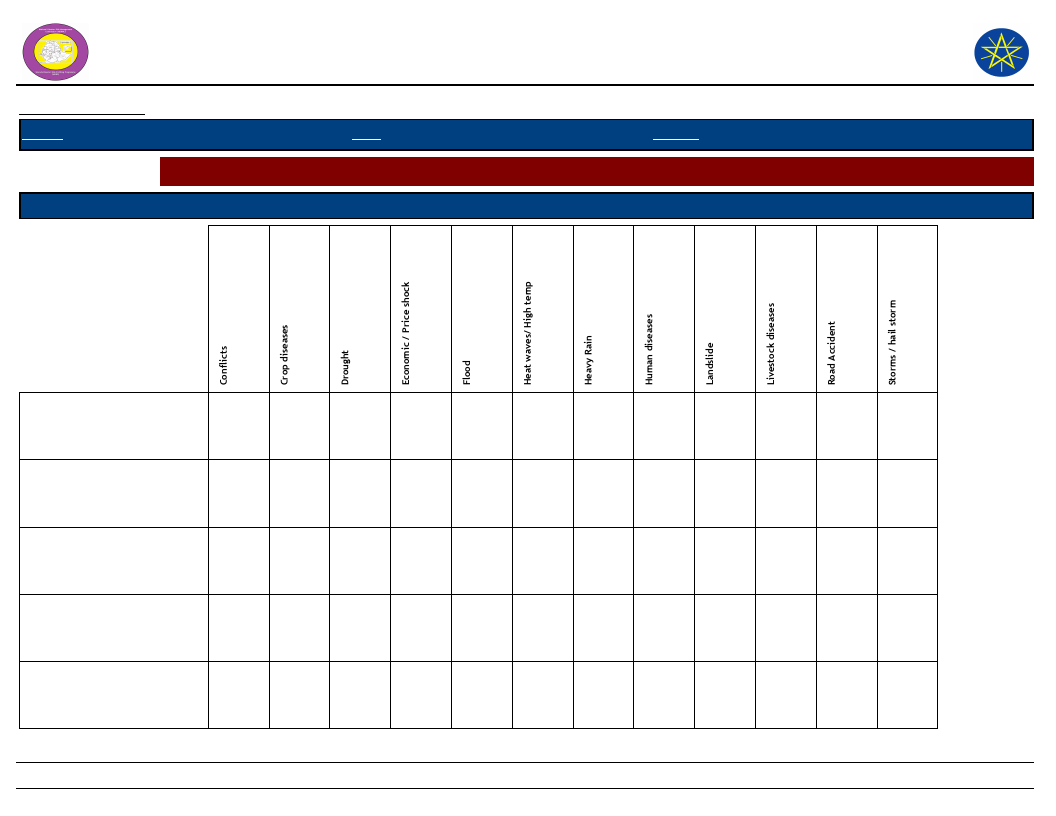
Wereda Disaster Risk
Profile
Data_Collected_Date
Region S.N.N.P
Zone WOLAYITA
National Disaster Risk Management
Commission (NDRMC)
Wereda HUMBO
Thursday, December 12, 2019
Selected Indictor: Losses from Disasters - Secondary Losses by Type of Disasters (household response in %)
Type of Loss
Type of Disasters which caused Listed Secondary Losses
Crop damage
Death of household
members
Had to flee/change
residence area
Illness/health problems
Livestock damage
13.04
5.16
50.00
4.23
8.70
11.27
8.60
8.60
1.08
3.23
50
1.30
1.69
5.19
0.85
5.19
4.24
1.30
5.93
Page 1 of 3

Wereda Disaster Risk
Profile
Data_Collected_Date
Region S.N.N.P
Zone WOLAYITA
National Disaster Risk Management
Commission (NDRMC)
Wereda HUMBO
Thursday, December 12, 2019
Selected Indictor: Losses from Disasters - Secondary Losses by Type of Disasters (household response in %)
Type of Loss
Type of Disasters which caused Listed Secondary Losses
Livestock were stolen
Loss of access to social
services, including school
Loss of income
Loss of savings
Lost access to grazing land
1.08
4.35
2.35
2.15
33.33
6.49
0.85
47.83
58.22
37.63
33.33
36.36
100.00
43.22
50.00
50.00
50.00
21.74
7.98
100.00
22.58
100.00
35.06
31.36
50.00
50.00
5.63
1.30
5.93
51
Page 2 of 3
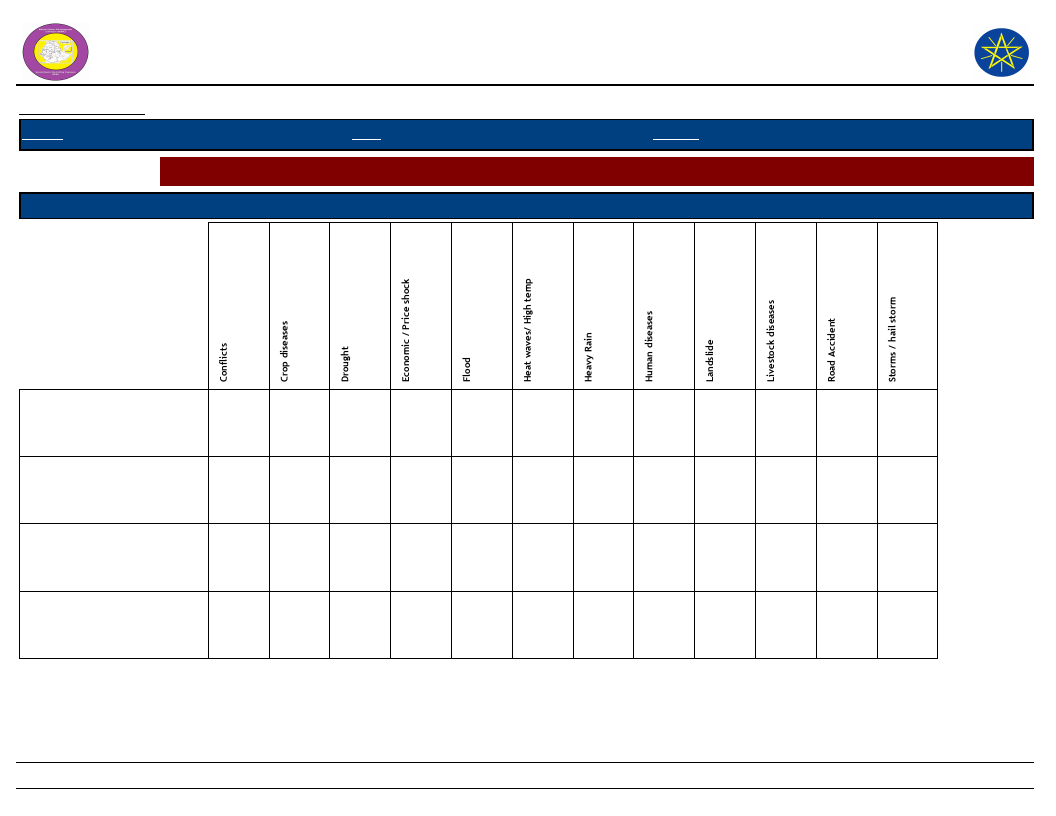
Wereda Disaster Risk
Profile
Data_Collected_Date
Region S.N.N.P
Zone WOLAYITA
National Disaster Risk Management
Commission (NDRMC)
Wereda HUMBO
Thursday, December 12, 2019
Selected Indictor: Losses from Disasters - Secondary Losses by Type of Disasters (household response in %)
Type of Loss
Type of Disasters which caused Listed Secondary Losses
Lost access to water source
NA
Other losses/damages
Physical damages on houses
and property
1.41
33.33
0.85
0.47
4.35
3.29
15.05
7.79
5.08
52
Page 3 of 3

Wereda Disaster
Risk Profile
Data_Collected_Date
National Disaster Risk Management
Commission (NDRMC)
Thursday, December 12, 2019
Region S.N.N.P
Zone WOLAYITA
Wereda HUMBO
Selected Indictor: Seasonal Calendar for Hazards, Activities and Income Level By Kebele
Month of Hazard
Major_Problems /Disasters
Hazard Severity
Rank
Agricultural_Activities
Kebele Name ABAYA CHOKARE
E - Jan (Tir)
Shortage of water, Drought
1
Cultivating
Income
Level Rank
3rd
F - Feb (Yekatit)
Shortage of grass, Drought
2
Cultivating
8th
G - Mar (Megabit)
Human disease, Animal disease, Drought
3
Cultivating
9th
H - Apr (Meazea)
Human disease, Flood
3
Crop sowing
10th
I - May (Ginbot)
Crop disease, Human disease, Drought
3
Weeding
11th
J - Jun (Sene)
Human disease, Crop destruction, Drought
2
Weeding
12th
K - Jul (Hamle)
Flood
2
Harvesting Livestock activities
4th
L - Aug (Nehase)
Flood
1
Harvesting Livestock activities
5th
A - Sep (Meskerem)
Human disease, Malaria
2
Weeding
6th
B - Oct (Tikimt)
1
Harvesting
7th
C - Nov (Hidar)
1
Harvesting
1st
D - Dec (Tahsas)
1
Harvesting
2nd
NOTE: Hazard Severity Rank helps prioritize the more severe hazards that have occurred in the months of disaster occurrence, 3 being the worst and 1
the least severe hazards.
53
Page 1 of 27

Wereda Disaster
Risk Profile
Data_Collected_Date
National Disaster Risk Management
Commission (NDRMC)
Thursday, December 12, 2019
Region S.N.N.P
Zone WOLAYITA
Wereda HUMBO
Selected Indictor: Seasonal Calendar for Hazards, Activities and Income Level By Kebele
Month of Hazard
Major_Problems /Disasters
Hazard Severity
Rank
Agricultural_Activities
Kebele Name ABAYA GUNUCHO
E - Jan (Tir)
Shortage of clean water
2
Weeding
Income
Level Rank
4th
F - Feb (Yekatit)
Shortage of grass
3
Crop sowing
2nd
G - Mar (Megabit)
---------
Harvesting
7th
H - Apr (Meazea)
Drought
1
Crop sowing
1st
I - May (Ginbot)
Drought
3
Harvesting
3rd
J - Jun (Sene)
Crop pest
1
Crop sowing
5th
K - Jul (Hamle)
Drought
2
Harvesting
6th
L - Aug (Nehase)
Malaria
---------
Livestock rearing
8th
A - Sep (Meskerem)
---------
Livestock rearing
9th
B - Oct (Tikimt)
---------
Harvesting
10th
C - Nov (Hidar)
---------
Harvesting
11th
D - Dec (Tahsas)
---------
Harvesting
12th
NOTE: Hazard Severity Rank helps prioritize the more severe hazards that have occurred in the months of disaster occurrence, 3 being the worst and 1
the least severe hazards.
54
Page 2 of 27

Wereda Disaster
Risk Profile
Data_Collected_Date
National Disaster Risk Management
Commission (NDRMC)
Thursday, December 12, 2019
Region S.N.N.P
Zone WOLAYITA
Wereda HUMBO
Selected Indictor: Seasonal Calendar for Hazards, Activities and Income Level By Kebele
Month of Hazard
Major_Problems /Disasters
Hazard Severity
Rank
Agricultural_Activities
Kebele Name ABELA AJAJA
E - Jan (Tir)
1
Income
Level Rank
---------
F - Feb (Yekatit)
1
---------
G - Mar (Megabit)
1
---------
H - Apr (Meazea)
1
Crop sowing
10th
I - May (Ginbot)
1
Crop sowing
11th
J - Jun (Sene)
1
Livestock rearing
7th
K - Jul (Hamle)
Human disease
1
Crop sowing
6th
L - Aug (Nehase)
Human disease
1
Crop sowing
5th
A - Sep (Meskerem)
1
---------
B - Oct (Tikimt)
1
---------
C - Nov (Hidar)
1
---------
D - Dec (Tahsas)
1
---------
NOTE: Hazard Severity Rank helps prioritize the more severe hazards that have occurred in the months of disaster occurrence, 3 being the worst and 1
the least severe hazards.
55
Page 3 of 27
Wereda Disaster
Risk Profile
Data_Collected_Date
National Disaster Risk Management
Commission (NDRMC)
Thursday, December 12, 2019
Region S.N.N.P
Zone WOLAYITA
Wereda HUMBO
Selected Indictor: Seasonal Calendar for Hazards, Activities and Income Level By Kebele
Month of Hazard
Major_Problems /Disasters
Hazard Severity
Rank
Agricultural_Activities
Kebele Name ABELA GEFETA
E - Jan (Tir)
Shortage of pasture and water
1
Livestock rearing
Income
Level Rank
7th
F - Feb (Yekatit)
Shortage of pasture and water
1
Livestock rearing
9th
G - Mar (Megabit)
Livestock disease, Drought
3
Crop sowing
10th
H - Apr (Meazea)
Flood
1
Crop sowing
11th
I - May (Ginbot)
Livestock disease, Drought
2
Weeding
12th
J - Jun (Sene)
Drought
1
Weeding
8th
K - Jul (Hamle)
Flood
1
Crop sowing and Weeding
5th
L - Aug (Nehase)
Flood
1
Weeding
4th
A - Sep (Meskerem)
---------
Harvesting
3rd
B - Oct (Tikimt)
---------
Harvesting
2nd
C - Nov (Hidar)
---------
Harvesting
1st
D - Dec (Tahsas)
---------
Livestock rearing
6th
NOTE: Hazard Severity Rank helps prioritize the more severe hazards that have occurred in the months of disaster occurrence, 3 being the worst and 1
the least severe hazards.
56
Page 4 of 27

Wereda Disaster
Risk Profile
Data_Collected_Date
National Disaster Risk Management
Commission (NDRMC)
Thursday, December 12, 2019
Region S.N.N.P
Zone WOLAYITA
Wereda HUMBO
Selected Indictor: Seasonal Calendar for Hazards, Activities and Income Level By Kebele
Month of Hazard
Major_Problems /Disasters
Hazard Severity
Rank
Agricultural_Activities
Kebele Name ABELA ZEGRE
E - Jan (Tir)
Shortage of grass and water
1
Livestock activity
Income
Level Rank
5th
F - Feb (Yekatit)
Shortage of grass and water
1
Livestock activity
6th
G - Mar (Megabit)
Animal disease and drought
2
Crop sowing
7th
H - Apr (Meazea)
Flood and drought
3
Crop sowing
10th
I - May (Ginbot)
Drought, animal diseases and crop pest
3
Weeding
10th
J - Jun (Sene)
Drought
3
Crop sowing
12th
K - Jul (Hamle)
Flood
1
Crop sowing
9th
L - Aug (Nehase)
Flood
1
Weeding
8th
A - Sep (Meskerem)
1
Harvesting
4th
B - Oct (Tikimt)
1
Harvesting
2nd
C - Nov (Hidar)
1
Harvesting
1st
D - Dec (Tahsas)
1
Livestock activity
3rd
NOTE: Hazard Severity Rank helps prioritize the more severe hazards that have occurred in the months of disaster occurrence, 3 being the worst and 1
the least severe hazards.
57
Page 5 of 27

Wereda Disaster
Risk Profile
Data_Collected_Date
National Disaster Risk Management
Commission (NDRMC)
Thursday, December 12, 2019
Region S.N.N.P
Zone WOLAYITA
Wereda HUMBO
Selected Indictor: Seasonal Calendar for Hazards, Activities and Income Level By Kebele
Month of Hazard
Major_Problems /Disasters
Hazard Severity
Rank
Agricultural_Activities
Kebele Name AMBE SHOYA
E - Jan (Tir)
Shortage of grass
2
Crop sowing
Income
Level Rank
6th
F - Feb (Yekatit)
Shortage of water
1
Crop sowing
7th
G - Mar (Megabit)
Drought
1
Crop sowing
8th
H - Apr (Meazea)
Drought
2
Weeding
9th
I - May (Ginbot)
Drought
3
Weeding
10th
J - Jun (Sene)
Crop pest
4
Weeding
11th
K - Jul (Hamle)
Drought
1
Crop sowing
12th
L - Aug (Nehase)
Drought
4
Weeding
5th
A - Sep (Meskerem)
1
Livestock activities
4th
B - Oct (Tikimt)
1
Livestock activities
3rd
C - Nov (Hidar)
1
Harvesting
1st
D - Dec (Tahsas)
1
Harvesting
2nd
NOTE: Hazard Severity Rank helps prioritize the more severe hazards that have occurred in the months of disaster occurrence, 3 being the worst and 1
the least severe hazards.
58
Page 6 of 27

Wereda Disaster
Risk Profile
Data_Collected_Date
National Disaster Risk Management
Commission (NDRMC)
Thursday, December 12, 2019
Region S.N.N.P
Zone WOLAYITA
Wereda HUMBO
Selected Indictor: Seasonal Calendar for Hazards, Activities and Income Level By Kebele
Month of Hazard
Major_Problems /Disasters
Hazard Severity
Rank
Agricultural_Activities
Kebele Name AMPO KOYISHA
E - Jan (Tir)
Drought
1
Re cultivation
Income
Level Rank
3rd
E - Jan (Tir)
---------
Re cultivation
3rd
F - Feb (Yekatit)
Drought
1
Fodder preparation
8th
F - Feb (Yekatit)
---------
Fodder preparation
8th
G - Mar (Megabit)
Drought
1
Sowing of crops
9th
G - Mar (Megabit)
---------
Sowing of crops
9th
H - Apr (Meazea)
Drought and Flood
1
Sowing of crops
10th
H - Apr (Meazea)
---------
Sowing of crops
10th
I - May (Ginbot)
Drought
1
Weeding
11th
I - May (Ginbot)
---------
Weeding
11th
J - Jun (Sene)
Crop disease
1
Urea application
12th
J - Jun (Sene)
---------
Urea application
12th
NOTE: Hazard Severity Rank helps prioritize the more severe hazards that have occurred in the months of disaster occurrence, 3 being the worst and 1
the least severe hazards.
59
Page 7 of 27

Wereda Disaster
Risk Profile
Data_Collected_Date
National Disaster Risk Management
Commission (NDRMC)
Thursday, December 12, 2019
Region S.N.N.P
Zone WOLAYITA
Wereda HUMBO
Selected Indictor:
Month of Hazard
K - Jul (Hamle)
Seasonal Calendar for Hazards, Activities and Income Level By Kebele
Major_Problems /Disasters
Flood
Hazard Severity
Rank
1
Agricultural_Activities
Sowing of crops
Income
Level Rank
7th
K - Jul (Hamle)
---------
Sowing of crops
7th
L - Aug (Nehase)
Flood
1
Sowing of crops
6th
L - Aug (Nehase)
---------
Sowing of crops
6th
A - Sep (Meskerem)
1
Weeding and Harvesting
5th
A - Sep (Meskerem)
---------
Weeding and Harvesting
5th
B - Oct (Tikimt)
Human diseased
1
Harvesting
4th
B - Oct (Tikimt)
---------
Harvesting
4th
C - Nov (Hidar)
Human diseased
1
Harvesting
2nd
C - Nov (Hidar)
---------
Harvesting
2nd
D - Dec (Tahsas)
Human diseased
1
Cultivation
1st
D - Dec (Tahsas)
---------
Cultivation
1st
Kebele Name ANKA WECHA
NOTE: Hazard Severity Rank helps prioritize the more severe hazards that have occurred in the months of disaster occurrence, 3 being the worst and 1
the least severe hazards.
60
Page 8 of 27
Wereda Disaster
Risk Profile
Data_Collected_Date
National Disaster Risk Management
Commission (NDRMC)
Thursday, December 12, 2019
Region S.N.N.P
Zone WOLAYITA
Wereda HUMBO
Selected Indictor:
Month of Hazard
E - Jan (Tir)
Seasonal Calendar for Hazards, Activities and Income Level By Kebele
Major_Problems /Disasters
Human disease
Hazard Severity
Rank
1
Agricultural_Activities
Livestock activities
Income
Level Rank
5th
F - Feb (Yekatit)
Livestock disease
2
Livestock activities
6th
G - Mar (Megabit)
Shortage of water
3
Crop sowing
7th
H - Apr (Meazea)
Human diseases
2
Crop sowing
8th
I - May (Ginbot)
Crop diseases
3
Crop sowing
9th
J - Jun (Sene)
Drought
2
Weeding
10th
K - Jul (Hamle)
Drought
1
Weeding
11th
L - Aug (Nehase)
Drought
2
Weeding
12th
A - Sep (Meskerem)
Drought
3
Livestock activities
4th
B - Oct (Tikimt)
---------
Harvesting
3rd
C - Nov (Hidar)
---------
Harvesting
2nd
D - Dec (Tahsas)
---------
Livestock activities
1st
Kebele Name BOSA WANCHE
NOTE: Hazard Severity Rank helps prioritize the more severe hazards that have occurred in the months of disaster occurrence, 3 being the worst and 1
the least severe hazards.
61
Page 9 of 27
Wereda Disaster
Risk Profile
Data_Collected_Date
National Disaster Risk Management
Commission (NDRMC)
Thursday, December 12, 2019
Region S.N.N.P
Zone WOLAYITA
Wereda HUMBO
Selected Indictor:
Month of Hazard
E - Jan (Tir)
Seasonal Calendar for Hazards, Activities and Income Level By Kebele
Major_Problems /Disasters
Drought
Hazard Severity
Rank
1
Agricultural_Activities
Cultivation
Income
Level Rank
7th
F - Feb (Yekatit)
Drought
2
Cultivation
8th
G - Mar (Megabit)
Drought and Livestock disease
3
Crop sowing
10th
H - Apr (Meazea)
Flood and Livestock disease
3
Crop sowing
11th
I - May (Ginbot)
Drought, Livestock disease, Human disease and crop
3
Weeding
12th
disease
J - Jun (Sene)
Human disease and Crop disease
2
Weeding
9th
K - Jul (Hamle)
Flood
2
Crop sowing and livestock activities
6th
L - Aug (Nehase)
---------
Crop sowing and livestock activities
5th
A - Sep (Meskerem)
---------
Weeding and livestock activities
4th
B - Oct (Tikimt)
---------
Harvesting
3rd
C - Nov (Hidar)
---------
Harvesting
1st
D - Dec (Tahsas)
---------
Cultivation
2nd
Kebele Name DEMBA KOYISHA
NOTE: Hazard Severity Rank helps prioritize the more severe hazards that have occurred in the months of disaster occurrence, 3 being the worst and 1
the least severe hazards.
62
Page 10 of 27
Wereda Disaster
Risk Profile
Data_Collected_Date
National Disaster Risk Management
Commission (NDRMC)
Thursday, December 12, 2019
Region S.N.N.P
Zone WOLAYITA
Wereda HUMBO
Selected Indictor:
Month of Hazard
E - Jan (Tir)
Seasonal Calendar for Hazards, Activities and Income Level By Kebele
Major_Problems /Disasters
Drought
Hazard Severity
Rank
1
Agricultural_Activities
Cultivation, Livestock activities
Income
Level Rank
8th
E - Jan (Tir)
---------
Cultivation, Livestock activities
8th
F - Feb (Yekatit)
Drought
1
Livestock activities
9th
F - Feb (Yekatit)
---------
Livestock activities
9th
G - Mar (Megabit)
Drought
3
Crop sowing
10th
G - Mar (Megabit)
---------
Crop sowing
10th
H - Apr (Meazea)
Flood, Animal and human disease
3
Crop sowing
11th
H - Apr (Meazea)
---------
Crop sowing
11th
I - May (Ginbot)
Flood, Animal and human disease
3
Weeding
12th
I - May (Ginbot)
---------
Weeding
12th
J - Jun (Sene)
Drought
2
Weeding
7th
J - Jun (Sene)
---------
Weeding
7th
K - Jul (Hamle)
Crop pest
1
Crop sowing
6th
NOTE: Hazard Severity Rank helps prioritize the more severe hazards that have occurred in the months of disaster occurrence, 3 being the worst and 1
the least severe hazards.
63
Page 11 of 27

Wereda Disaster
Risk Profile
Data_Collected_Date
National Disaster Risk Management
Commission (NDRMC)
Thursday, December 12, 2019
Region S.N.N.P
Zone WOLAYITA
Wereda HUMBO
Selected Indictor:
Month of Hazard
K - Jul (Hamle)
Seasonal Calendar for Hazards, Activities and Income Level By Kebele
Major_Problems /Disasters
Hazard Severity
Rank
---------
Agricultural_Activities
Crop sowing
Income
Level Rank
6th
L - Aug (Nehase)
---------
Weeding
5th
L - Aug (Nehase)
---------
Weeding
5th
A - Sep (Meskerem)
---------
Harvesting
3rd
A - Sep (Meskerem)
---------
Harvesting
3rd
B - Oct (Tikimt)
---------
Harvesting, Cultivation
2nd
B - Oct (Tikimt)
---------
Harvesting, Cultivation
2nd
C - Nov (Hidar)
---------
Harvesting, Cultivation
1st
C - Nov (Hidar)
---------
Harvesting, Cultivation
1st
D - Dec (Tahsas)
---------
Livestock activities
4th
D - Dec (Tahsas)
---------
Livestock activities
4th
Kebele Name
E - Jan (Tir)
ELA KEBELA
Drought
1
Cultivation of land
1st
NOTE: Hazard Severity Rank helps prioritize the more severe hazards that have occurred in the months of disaster occurrence, 3 being the worst and 1
the least severe hazards.
64
Page 12 of 27

Wereda Disaster
Risk Profile
Data_Collected_Date
National Disaster Risk Management
Commission (NDRMC)
Thursday, December 12, 2019
Region S.N.N.P
Zone WOLAYITA
Wereda HUMBO
Selected Indictor:
Month of Hazard
F - Feb (Yekatit)
Seasonal Calendar for Hazards, Activities and Income Level By Kebele
Major_Problems /Disasters
Drought
Hazard Severity
Rank
1
Agricultural_Activities
2nd cultivation of land
Income
Level Rank
1st
G - Mar (Megabit)
Drought
1
Cultivation
1st
H - Apr (Meazea)
Drought , Flood
1
Crop sowing
1st
I - May (Ginbot)
Drought
1
Weeding
1st
J - Jun (Sene)
Drought
1
Weeding
1st
K - Jul (Hamle)
Flood
1
Crop sowing and Livestock activities
1st
L - Aug (Nehase)
1
Crop sowing and Livestock activities
1st
A - Sep (Meskerem)
Un seasonal rainfall and Human disease
1
Livestock activities
1st
B - Oct (Tikimt)
Un seasonal rainfall and Human disease
1
Harvesting and Livestock activities
1st
C - Nov (Hidar)
Un seasonal rainfall
1
Harvesting
1st
D - Dec (Tahsas)
1
Harvesting of teff
1st
Kebele Name GALICHA KARA
E - Jan (Tir)
Livestock disease
2
Livestock activity
9th
NOTE: Hazard Severity Rank helps prioritize the more severe hazards that have occurred in the months of disaster occurrence, 3 being the worst and 1
the least severe hazards.
65
Page 13 of 27

Wereda Disaster
Risk Profile
Data_Collected_Date
National Disaster Risk Management
Commission (NDRMC)
Thursday, December 12, 2019
Region S.N.N.P
Zone WOLAYITA
Wereda HUMBO
Selected Indictor:
Month of Hazard
F - Feb (Yekatit)
Seasonal Calendar for Hazards, Activities and Income Level By Kebele
Major_Problems /Disasters
Drought
Hazard Severity
Rank
1
Agricultural_Activities
Crop sawing
Income
Level Rank
10th
G - Mar (Megabit)
Livestock disease
2
Crop sawing
11th
H - Apr (Meazea)
Drought
3
Weeding
12th
I - May (Ginbot)
Flood
1
Weeding
8th
J - Jun (Sene)
Crop pest and disease
2
Weeding
7th
K - Jul (Hamle)
Flood
3
Crop sawing
6th
L - Aug (Nehase)
---------
Crop sawing
5th
A - Sep (Meskerem)
---------
Harvesting
4th
B - Oct (Tikimt)
12
Harvesting
3rd
C - Nov (Hidar)
---------
Livestock rearing
2nd
D - Dec (Tahsas)
---------
1st
Kebele Name GUTUTO LARENA
E - Jan (Tir)
Drought
2
Cultivating
8th
NOTE: Hazard Severity Rank helps prioritize the more severe hazards that have occurred in the months of disaster occurrence, 3 being the worst and 1
the least severe hazards.
66
Page 14 of 27

Wereda Disaster
Risk Profile
Data_Collected_Date
National Disaster Risk Management
Commission (NDRMC)
Thursday, December 12, 2019
Region S.N.N.P
Zone WOLAYITA
Wereda HUMBO
Selected Indictor:
Month of Hazard
F - Feb (Yekatit)
Seasonal Calendar for Hazards, Activities and Income Level By Kebele
Major_Problems /Disasters
Drought
Hazard Severity
Rank
2
Agricultural_Activities
Cultivating
Income
Level Rank
9th
G - Mar (Megabit)
Drought, Animal disease
3
Crop sowing
10th
H - Apr (Meazea)
Crop pest, flood, animal disease
3
Crop sowing
11th
I - May (Ginbot)
Hunan disease
3
Weeding
12th
J - Jun (Sene)
Drought
2
Weeding and Cultivating
7th
K - Jul (Hamle)
Drought
1
Crop sowing
6th
L - Aug (Nehase)
Drought
1
Weeding
5th
A - Sep (Meskerem)
Human disease
1
Weeding and Harvesting
3rd
B - Oct (Tikimt)
Human disease
1
Harvesting
2nd
C - Nov (Hidar)
Human disease
1
Harvesting
1st
D - Dec (Tahsas)
Human disease
1
Harvesting
9th
Kebele Name
E - Jan (Tir)
HOBICHA BADA
Drought
1
Cultivation of Land
7th
NOTE: Hazard Severity Rank helps prioritize the more severe hazards that have occurred in the months of disaster occurrence, 3 being the worst and 1
the least severe hazards.
67
Page 15 of 27

Wereda Disaster
Risk Profile
Data_Collected_Date
National Disaster Risk Management
Commission (NDRMC)
Thursday, December 12, 2019
Region S.N.N.P
Zone WOLAYITA
Wereda HUMBO
Selected Indictor:
Month of Hazard
F - Feb (Yekatit)
Seasonal Calendar for Hazards, Activities and Income Level By Kebele
Major_Problems /Disasters
Drought
Hazard Severity
Rank
2
Agricultural_Activities
Cultivation of Land
Income
Level Rank
9th
G - Mar (Megabit)
Drought
3
Crop Sowing
10th
H - Apr (Meazea)
Flood and drought
2
Crop Sowing
12th
I - May (Ginbot)
Drought
3
Weeding
11th
J - Jun (Sene)
Human disease
1
Weeding & Livestock activities
8th
K - Jul (Hamle)
Human disease and flood
2
Crop Sowing & Livestock activities
5th
L - Aug (Nehase)
Human disease
1
Crop Sowing & Livestock activities
6th
A - Sep (Meskerem)
Human disease
2
Weeding & Livestock activities
4th
B - Oct (Tikimt)
Human disease
2
Harvesting & Livestock activities
2nd
C - Nov (Hidar)
Human disease
2
Harvesting & Livestock activities
1st
D - Dec (Tahsas)
1
Land Preparation
3rd
Kebele Name HOBICHA BONGOTA
E - Jan (Tir)
Drought
1
Livestock activities
5th
NOTE: Hazard Severity Rank helps prioritize the more severe hazards that have occurred in the months of disaster occurrence, 3 being the worst and 1
the least severe hazards.
68
Page 16 of 27

Wereda Disaster
Risk Profile
Data_Collected_Date
National Disaster Risk Management
Commission (NDRMC)
Thursday, December 12, 2019
Region S.N.N.P
Zone WOLAYITA
Wereda HUMBO
Selected Indictor:
Month of Hazard
F - Feb (Yekatit)
Seasonal Calendar for Hazards, Activities and Income Level By Kebele
Major_Problems /Disasters
Drought
Hazard Severity
Rank
1
Agricultural_Activities
Livestock activities
Income
Level Rank
6th
G - Mar (Megabit)
Drought
2
Crop sowing
7th
H - Apr (Meazea)
Flood
1
Crop sowing
12th
I - May (Ginbot)
Drought
3
Weeding
11th
J - Jun (Sene)
Drought
2
Weeding
10th
K - Jul (Hamle)
Human disease
2
Crop sowing
9th
L - Aug (Nehase)
Human disease
2
Crop sowing
8th
A - Sep (Meskerem)
1
Harvesting
4th
B - Oct (Tikimt)
1
Harvesting
3rd
C - Nov (Hidar)
1
Cultivation
1st
D - Dec (Tahsas)
1
Cultivation
2nd
Kebele Name HOBICHA DIGISO
E - Jan (Tir)
Drought
3
Cultivation
6th
NOTE: Hazard Severity Rank helps prioritize the more severe hazards that have occurred in the months of disaster occurrence, 3 being the worst and 1
the least severe hazards.
69
Page 17 of 27

Wereda Disaster
Risk Profile
Data_Collected_Date
National Disaster Risk Management
Commission (NDRMC)
Thursday, December 12, 2019
Region S.N.N.P
Zone WOLAYITA
Wereda HUMBO
Selected Indictor:
Month of Hazard
F - Feb (Yekatit)
Seasonal Calendar for Hazards, Activities and Income Level By Kebele
Major_Problems /Disasters
Drought and Livestock disease
Hazard Severity
Rank
2
Agricultural_Activities
Cultivation
Income
Level Rank
8th
G - Mar (Megabit)
Drought and Livestock disease
1
Crop sowing
9th
H - Apr (Meazea)
Drought and Livestock disease
1
Crop sowing
12th
I - May (Ginbot)
Drought and Livestock disease
1
Weeding
11th
J - Jun (Sene)
Drought
1
Weeding
10th
K - Jul (Hamle)
1
Crop sowing and livestock activities
7th
L - Aug (Nehase)
1
Crop sowing and livestock activities
5th
A - Sep (Meskerem)
Human disease
2
Weeding and livestock activities
4th
B - Oct (Tikimt)
Human disease
2
Harvesting and livestock activities
2nd
C - Nov (Hidar)
Human disease
2
Harvesting
1st
D - Dec (Tahsas)
1
1st
Kebele Name KODO KANKO
E - Jan (Tir)
Drought
2
Cultivating
8th
NOTE: Hazard Severity Rank helps prioritize the more severe hazards that have occurred in the months of disaster occurrence, 3 being the worst and 1
the least severe hazards.
70
Page 18 of 27

Wereda Disaster
Risk Profile
Data_Collected_Date
National Disaster Risk Management
Commission (NDRMC)
Thursday, December 12, 2019
Region S.N.N.P
Zone WOLAYITA
Wereda HUMBO
Selected Indictor:
Month of Hazard
F - Feb (Yekatit)
Seasonal Calendar for Hazards, Activities and Income Level By Kebele
Major_Problems /Disasters
Drought
Hazard Severity
Rank
2
Agricultural_Activities
Cultivating
Income
Level Rank
9th
G - Mar (Megabit)
Drought
3
Crop sowing
10th
H - Apr (Meazea)
Human disease, crop disease, Animal disease
3
Crop sowing
12th
I - May (Ginbot)
Human disease, crop disease, Animal disease
3
Weeding, crop sowing
12th
J - Jun (Sene)
Human disease, crop disease, Animal disease
1
Weeding, crop sowing
7th
K - Jul (Hamle)
1
crop sowing, Weeding
6th
L - Aug (Nehase)
1
Weeding
5th
A - Sep (Meskerem)
1
Weeding, harvesting
3rd
B - Oct (Tikimt)
Human disease
1
Harvesting
2nd
C - Nov (Hidar)
1
Harvesting
1st
D - Dec (Tahsas)
1
Harvesting
4th
Kebele Name KOYISHA GOLA
E - Jan (Tir)
Drought
1
Livestock
5th
NOTE: Hazard Severity Rank helps prioritize the more severe hazards that have occurred in the months of disaster occurrence, 3 being the worst and 1
the least severe hazards.
71
Page 19 of 27

Wereda Disaster
Risk Profile
Data_Collected_Date
National Disaster Risk Management
Commission (NDRMC)
Thursday, December 12, 2019
Region S.N.N.P
Zone WOLAYITA
Wereda HUMBO
Selected Indictor:
Month of Hazard
F - Feb (Yekatit)
Seasonal Calendar for Hazards, Activities and Income Level By Kebele
Major_Problems /Disasters
Drought & Livestock disease
Hazard Severity
Rank
1
Agricultural_Activities
Crop sowing
Income
Level Rank
6th
G - Mar (Megabit)
Drought & Livestock disease
3
Crop sowing
9th
H - Apr (Meazea)
Drought, Crop pest & Livestock disease
3
Crop sowing and Weeding
11th
I - May (Ginbot)
Drought, Crop pest & Livestock disease
3
Crop sowing and Weeding
12th
J - Jun (Sene)
Drought
1
Crop sowing
10th
K - Jul (Hamle)
1
Crop sowing, Weeding and Harvesting
8th
L - Aug (Nehase)
1
Crop sowing, Weeding and Harvesting
7th
A - Sep (Meskerem)
1
Crop sowing, Weeding and Harvesting
4th
B - Oct (Tikimt)
1
Crop sowing, Weeding and Harvesting
2nd
C - Nov (Hidar)
1
Crop sowing, Weeding and Harvesting
1st
D - Dec (Tahsas)
1
Livestock activities
3rd
Kebele Name KOYISHA OGODAMA
E - Jan (Tir)
Drought
1
Crop sowing
4th
NOTE: Hazard Severity Rank helps prioritize the more severe hazards that have occurred in the months of disaster occurrence, 3 being the worst and 1
the least severe hazards.
72
Page 20 of 27

Wereda Disaster
Risk Profile
Data_Collected_Date
National Disaster Risk Management
Commission (NDRMC)
Thursday, December 12, 2019
Region S.N.N.P
Zone WOLAYITA
Wereda HUMBO
Selected Indictor:
Month of Hazard
F - Feb (Yekatit)
Seasonal Calendar for Hazards, Activities and Income Level By Kebele
Major_Problems /Disasters
Drought and Shortage of grass
Hazard Severity
Rank
3
Agricultural_Activities
Crop sowing
Income
Level Rank
5th
G - Mar (Megabit)
Drought and Shortage of water
2
Crop sowing
6th
H - Apr (Meazea)
Drought
1
Weeding
7th
I - May (Ginbot)
Drought
2
Weeding
8th
J - Jun (Sene)
Drought and Crop pest
1
Weeding
9th
K - Jul (Hamle)
Drought
2
Weeding
10th
L - Aug (Nehase)
Flood
1
Weeding
11th
A - Sep (Meskerem)
Flood
2
Livestock activities
12th
B - Oct (Tikimt)
Flood
3
Livestock activities
3rd
C - Nov (Hidar)
1
Livestock activities
2nd
D - Dec (Tahsas)
1
Harvesting
1st
Kebele Name KOYISHA WANGALA
E - Jan (Tir)
Shortage of water
1
Plowing
4th
NOTE: Hazard Severity Rank helps prioritize the more severe hazards that have occurred in the months of disaster occurrence, 3 being the worst and 1
the least severe hazards.
73
Page 21 of 27
Wereda Disaster
Risk Profile
Data_Collected_Date
National Disaster Risk Management
Commission (NDRMC)
Thursday, December 12, 2019
Region S.N.N.P
Zone WOLAYITA
Wereda HUMBO
Selected Indictor:
Month of Hazard
F - Feb (Yekatit)
Seasonal Calendar for Hazards, Activities and Income Level By Kebele
Major_Problems /Disasters
Shortage of animal feed
Hazard Severity
Rank
2
Agricultural_Activities
Plowing
Income
Level Rank
5th
G - Mar (Megabit)
Drought
3
Weeding
6th
H - Apr (Meazea)
Livestock death
2
Sowing crop
7th
I - May (Ginbot)
Drought
1
Weeding
8th
J - Jun (Sene)
Crop pest
2
Weeding
9th
K - Jul (Hamle)
Drought
3
--
L - Aug (Nehase)
Drought
1
Sowing crop
11th
A - Sep (Meskerem)
1
Sowing crop
12th
B - Oct (Tikimt)
1
Harvesting
3rd
C - Nov (Hidar)
1
Harvesting
2nd
D - Dec (Tahsas)
1
--
Kebele Name
E - Jan (Tir)
SERE TAWURETA
Drought
1
Livestock activities
4th
NOTE: Hazard Severity Rank helps prioritize the more severe hazards that have occurred in the months of disaster occurrence, 3 being the worst and 1
the least severe hazards.
74
Page 22 of 27

Wereda Disaster
Risk Profile
Data_Collected_Date
National Disaster Risk Management
Commission (NDRMC)
Thursday, December 12, 2019
Region S.N.N.P
Zone WOLAYITA
Wereda HUMBO
Selected Indictor:
Month of Hazard
F - Feb (Yekatit)
Seasonal Calendar for Hazards, Activities and Income Level By Kebele
Major_Problems /Disasters
Shortage of water and animal feed
Hazard Severity
Rank
2
Agricultural_Activities
Crop sowing
Income
Level Rank
5th
G - Mar (Megabit)
Shortage of water
3
Crop sowing
5th
H - Apr (Meazea)
Drought
1
Weeding
6th
I - May (Ginbot)
Drought
2
Weeding
8th
J - Jun (Sene)
Crop pest
3
Weeding
9th
K - Jul (Hamle)
Flood
1
Crop sowing
10th
L - Aug (Nehase)
Drought
3
Weeding
10th
A - Sep (Meskerem)
1
Weeding
12th
B - Oct (Tikimt)
1
Livestock activities
3rd
C - Nov (Hidar)
1
Harvesting
2nd
D - Dec (Tahsas)
1
Harvesting
1st
Kebele Name
E - Jan (Tir)
SHOCHORA ABELA
Shortage of grass
1
Livestock activities
4th
NOTE: Hazard Severity Rank helps prioritize the more severe hazards that have occurred in the months of disaster occurrence, 3 being the worst and 1
the least severe hazards.
75
Page 23 of 27

Wereda Disaster
Risk Profile
Data_Collected_Date
National Disaster Risk Management
Commission (NDRMC)
Thursday, December 12, 2019
Region S.N.N.P
Zone WOLAYITA
Wereda HUMBO
Selected Indictor:
Month of Hazard
F - Feb (Yekatit)
Seasonal Calendar for Hazards, Activities and Income Level By Kebele
Major_Problems /Disasters
Livestock disease
Hazard Severity
Rank
2
Agricultural_Activities
Crop sowing
Income
Level Rank
5th
G - Mar (Megabit)
Drought
1
Crop sowing
6th
H - Apr (Meazea)
Drought
2
Crop sowing
7th
I - May (Ginbot)
Drought
3
Weeding
8th
J - Jun (Sene)
Crop pest
2
Weeding
9th
K - Jul (Hamle)
Drought, Flood
1
Weeding
10th
L - Aug (Nehase)
Drought
2
Weeding
11th
A - Sep (Meskerem)
Flood
1
Weeding
12th
B - Oct (Tikimt)
Flood
2
Livestock activities
3rd
C - Nov (Hidar)
Human disease
1
Harvesting
4th
D - Dec (Tahsas)
Human disease
2
Harvesting
1st
Kebele Name SHOCHORA FESHO
E - Jan (Tir)
Drought
2
Cultivation
5th
NOTE: Hazard Severity Rank helps prioritize the more severe hazards that have occurred in the months of disaster occurrence, 3 being the worst and 1
the least severe hazards.
76
Page 24 of 27

Wereda Disaster
Risk Profile
Data_Collected_Date
National Disaster Risk Management
Commission (NDRMC)
Thursday, December 12, 2019
Region S.N.N.P
Zone WOLAYITA
Wereda HUMBO
Selected Indictor:
Month of Hazard
F - Feb (Yekatit)
Seasonal Calendar for Hazards, Activities and Income Level By Kebele
Major_Problems /Disasters
Drought and Livestock disease
Hazard Severity
Rank
1
Agricultural_Activities
Cultivation
Income
Level Rank
12th
G - Mar (Megabit)
Drought
1
Crop sowing
11th
H - Apr (Meazea)
Flood
1
Crop sowing
10th
I - May (Ginbot)
Flood
2
Weeding
9th
J - Jun (Sene)
Crop disease
2
Weeding
8th
K - Jul (Hamle)
Flood
1
Crop sowing , Livestock activities
7th
L - Aug (Nehase)
Flood
2
Crop sowing , Weeding
6th
A - Sep (Meskerem)
Human disease
4
Harvesting, Crop sowing
4th
B - Oct (Tikimt)
1
Harvesting
3rd
C - Nov (Hidar)
1
Harvesting, Crop sowing
3rd
D - Dec (Tahsas)
1
Cultivation
1st
Kebele Name SHOCHORA OGODAMA
E - Jan (Tir)
Drought
1
Livestock activities
5th
NOTE: Hazard Severity Rank helps prioritize the more severe hazards that have occurred in the months of disaster occurrence, 3 being the worst and 1
the least severe hazards.
77
Page 25 of 27

Wereda Disaster
Risk Profile
Data_Collected_Date
National Disaster Risk Management
Commission (NDRMC)
Thursday, December 12, 2019
Region S.N.N.P
Zone WOLAYITA
Wereda HUMBO
Selected Indictor:
Month of Hazard
F - Feb (Yekatit)
Seasonal Calendar for Hazards, Activities and Income Level By Kebele
Major_Problems /Disasters
Drought and Livestock disease
Hazard Severity
Rank
1
Agricultural_Activities
Crop sowing
Income
Level Rank
6th
G - Mar (Megabit)
Drought, Crop pest and Livestock disease
3
Crop sowing
9th
H - Apr (Meazea)
Drought, Crop pest and Livestock disease
3
Crop sowing
1st
I - May (Ginbot)
Drought, Crop pest and Livestock disease
3
Crop sowing, Weeding
12th
J - Jun (Sene)
Drought, Crop pest and Livestock disease
1
Crop sowing, Weeding
--
K - Jul (Hamle)
1
Crop sowing
9th
L - Aug (Nehase)
1
Weeding, Harvesting
7th
A - Sep (Meskerem)
1
Weeding, Harvesting
4th
B - Oct (Tikimt)
1
Weeding, Harvesting
2nd
C - Nov (Hidar)
1
Weeding, Harvesting
1st
D - Dec (Tahsas)
1
Livestock activities
3rd
Kebele Name
E - Jan (Tir)
SHOCHORA OSE
Drought
1
Livestock activities
5th
NOTE: Hazard Severity Rank helps prioritize the more severe hazards that have occurred in the months of disaster occurrence, 3 being the worst and 1
the least severe hazards.
78
Page 26 of 27
Wereda Disaster
Risk Profile
Data_Collected_Date
National Disaster Risk Management
Commission (NDRMC)
Thursday, December 12, 2019
Region S.N.N.P
Zone WOLAYITA
Wereda HUMBO
Selected Indictor:
Month of Hazard
F - Feb (Yekatit)
Seasonal Calendar for Hazards, Activities and Income Level By Kebele
Major_Problems /Disasters
Drought, Livestock disease
Hazard Severity
Rank
1
Agricultural_Activities
Livestock activities
Income
Level Rank
6th
G - Mar (Megabit)
Drought
1
Crop sowing
9th
H - Apr (Meazea)
Drought, Crop pest, Livestock disease
3
Crop sowing, Weeding
12th
I - May (Ginbot)
Drought, Crop pest
3
Crop sowing, Weeding
12th
J - Jun (Sene)
Drought
1
Crop sowing, Weeding
9th
K - Jul (Hamle)
1
Crop sowing, Weeding
7th
L - Aug (Nehase)
1
Harvesting
7th
A - Sep (Meskerem)
1
Harvesting
4th
B - Oct (Tikimt)
1
Harvesting
2nd
C - Nov (Hidar)
1
Harvesting
1st
D - Dec (Tahsas)
1
Livestock activities
3rd
NOTE: Hazard Severity Rank helps prioritize the more severe hazards that have occurred in the months of disaster occurrence, 3 being the worst and 1
the least severe hazards.
79
Page 27 of 27
WDRP Indicators
Infrastructure Access Characteristics
80
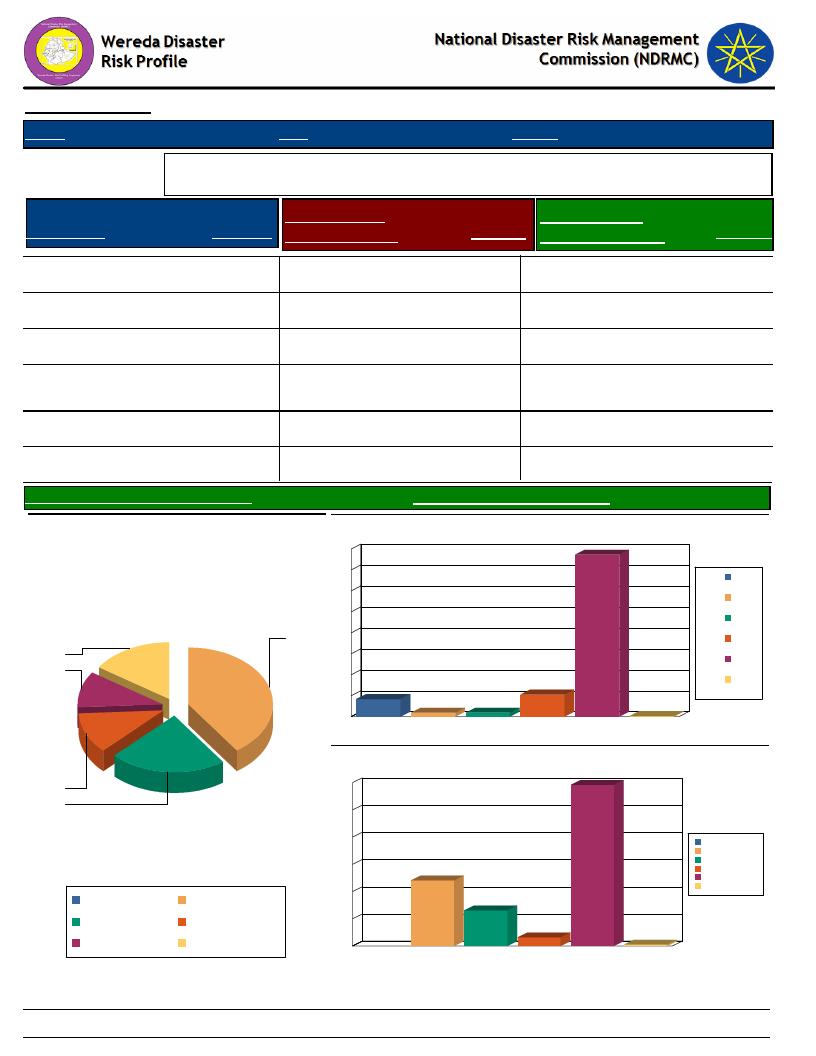
Data_Collected_Date
Region S.N.N.P
Zone WOLAYITA
Thursday, December 12, 2019
Wereda HUMBO
Selected Indicator
Type of Road
Physical Vulnerability: Access to Roads & Urban Centres - Households access to
road and urban centre
Time to Nearest
Response Paved Road (Mins.)
Time To Nearest
Response Urban Center (Mins.)
Response
Yes, paved
15.18 Less than 30 min
77.23 Less than 1 hr
59.16
Yes, partly paved road
10.21 30 – 60 min
10.47 1 - 2 hrs
24.08
Yes, gravel road
11.52 1 – 2 hrs
8.38 2 - 4 hrs
13.09
Yes, dirt road (difficult
for car)
No road
21.73 2 – 3 hrs
39.53 3 – 4 hrs
1.83 4 - 6 hrs
3.14
1.83 More than 6 hrs
0.52
More than 4 hrs
0.26
Avg Time To Nearest Urban Center(Mins.)
Type of Road
40
15
10
12
22
Yes, dirt road (difficult
for car)
Yes, partly paved road
No road
Yes, gravel road
Yes, paved
78.39
Avg_Time_To_Nearest_Paved_Road
29.21
Time to reach the nearest paved road from the HH
80
77
70
60
50
40
30
20
10
8
0
1 – 2 hrs
2
2 – 3 hrs
2
3 – 4 hrs
10
30 – 60 min
Less than 30
min
0
More than 4
hrs
1 – 2 hrs
2 – 3 hrs
3 – 4 hrs
30 – 60 min
Less than 30 min
More than 4 hrs
Time to reach nearest urban center from the HH
60
59
50
40
30
24
20
1 - 2 hrs
2 - 4 hrs
4 - 6 hrs
Less than 1 hr
More than 6 hrs
13
10
3
1
0
1 - 2 hrs
2 - 4 hrs
4 - 6 hrs
Less than 1 hr More than 6 hrs
81
Page 1 of 1
Data_Collected_Date
Region S.N.N.P
Zone WOLAYITA
Thursday, December 12, 2019
Wereda HUMBO
Selected Indicator
Physical Vulnerability: Access to Electricity - Households access and utilization
of electricity
Household_Located_In_Electricity
13.95
Household_Connected_To Electricity
10.00
82
Page 1 of 1
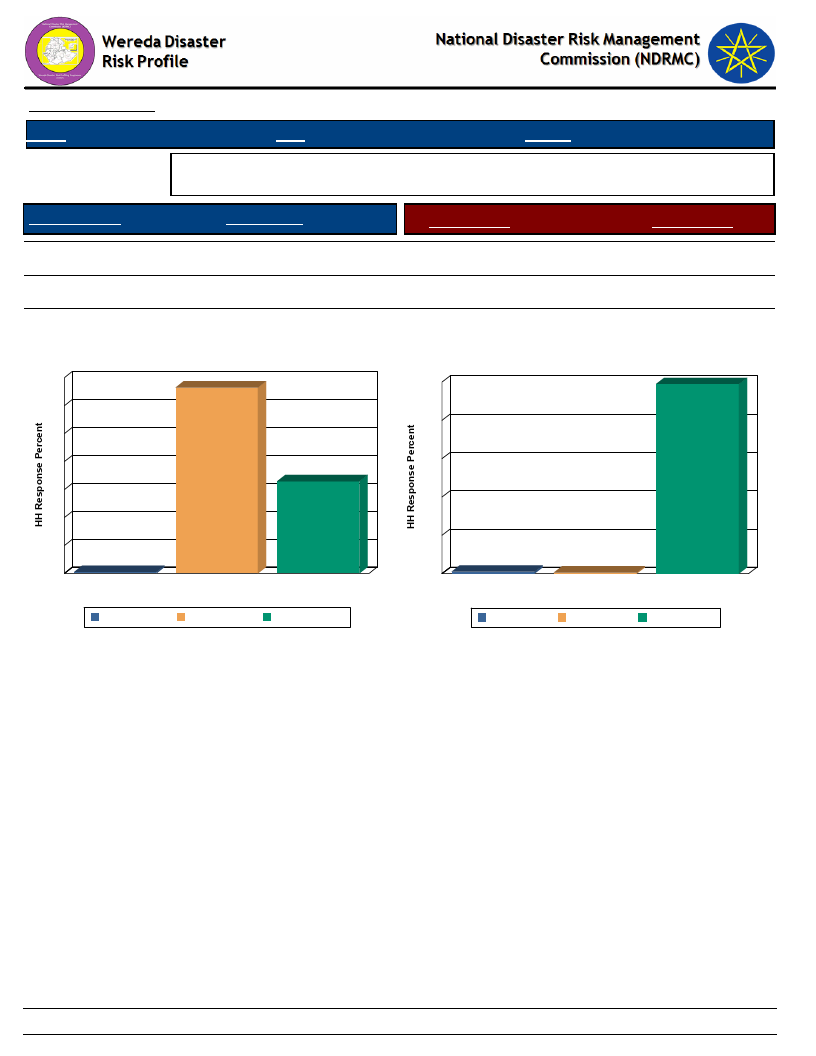
Data_Collected_Date
Region S.N.N.P
Zone WOLAYITA
Thursday, December 12, 2019
Wereda HUMBO
Selected Indicator
Physical Vulnerability: Type of Dwelling Units - Households type of dwelling
houses
Floor Structure
HH Response
Type of Floor
HH Response
Tin house
66.49
Concrete
1.06
Wood and mud
32.98
Non-Concrete
98.94
Bamboo
0.52
DK
0.53
Floor Structure
70
66
60
50
40
33
30
20
10
1
0
Bamboo
Bamboo
Tin house
Floor Structure
Tin house
Wood and mud
Wood and mud
Type of Floor
99
100
80
60
40
20
1
0
Concrete
1
DK
Type of Floor
Non-Concrete
Concrete
DK
Non-Concrete
83
Page 1 of 1
WDRP Indicators
Socio Demographic Characteristics
84
Wereda Disaster
Risk Profile
National Disaster Risk Management
Commission (NDRMC)
Data_Collected_Date
Thursday, December 12, 2019
Region S.N.N.P
Selected Indicator
Kebele Name
ABAYA GUNUCHO
ABELA AJAJA
ABELA GEFETA
ANKA WECHA
BOSA WANCHE
GALICHA KARA
GUTUTO LARENA
DEMBA KOYISHA
HOBICHA BADA
Zone WOLAYITA
Wereda HUMBO
Economic Vulnerability: Level of Migration - Migration level and its characteristics by Kebele
Approx_No. Age_Group
Sex
Migration_Period
Migration Trend
Migration_Reason
1890
All groups
Both
March, April May
Increased
20-30
Youth
Both
January - June
Increased
40-60
50-100
20-30
Male
Youth and Adult Both
February
February, March,
April, May, J
Increased
Increased
300-400
Youth
Both
April-August
Increased
200-250
20-30
50-100
Youth and
productive
20-27
20-27
Both
M
M
May, April and
March
February
January-June
Increased
Increased
Decreased
Economic hardship,
loss of asset, seek
job opportunities
Economic hardship,
seek job
opportunities
Seek job
opportunities
Poor economic
status, Loss of
assets, Job
opportunities
Job opportunity,
Loss of assets,
Economic hardship.
Economic Hardship,
Loss of assets and
job opportunity
No job opportunities,
loss of assets
Job opportunity
300-400
Youth and
children
Both
January to May
Increased
Lack of job
opportunities, loss of
assets, Economic
hard ship
Destination
Sumara, Adama, Awash,
Jigjiga, Konso
Awash, Jinka, Humera,
Nurera
Rural ( Gambella )
Awash, Zeway, Woyto,
Jinka, Mursi-hana.
To rural area of Humera
and Gambella
Rural area, Gawane, South
omo, Gambella
Awash ,Gewane, Jigigiga,
Gambella
Addis abeba, Zeway, Jinka,
Awash
85
Page 1 of 3

Wereda Disaster
Risk Profile
National Disaster Risk Management
Commission (NDRMC)
Data_Collected_Date
Thursday, December 12, 2019
Region S.N.N.P
Selected Indicator
Kebele Name
HOBICHA BONGOTA
ABELA ZEGRE
KOYISHA GOLA
Zone WOLAYITA
Wereda HUMBO
Economic Vulnerability: Level of Migration - Migration level and its characteristics by Kebele
Approx_No. Age_Group
Sex
Migration_Period
Migration Trend
Migration_Reason
100
Youths
12-15
25-35
MALE
October-December,
January-Marc
Increased
M
April to June
Decreased
Job opportunities,
Assess of grass land
for domestic
animals, economic
hardship.
Loss of assets
Increased
Destination
To strong farming focus
rural areas, e.g, Zeway,
Awash, Woyito, Oumer,
Abaya (Kasharany,
Danboba, tita)
Rural, Ziway, Addiss
Abeba, Basketo, Jinka
KODO KANKO
5-10
25-30
M
January
Increased
KOYISHA OGODAMA
200-220
Youth
Both
May, April, March
Increased
AMBE SHOYA
100-200
25 up to 45
Both
2003
Increased
KOYISHA WANGALA
AMPO KOYISHA
200-250
Youth
50-70
Youth
Both
Both
February, March,
April, May
March, April, May
Increased
Increased
Job opportunities,
loss of asset
Economic hardship,
Loss of assets, Job
opportunities
Economic hardship,
Loss of income,
Seeking of job
opportunity
Economic hardship,
Loss of asset, Lack
of job opportunities
Job opportunity, Low
income, Economic
hardship, Low living
standard
Rural: Gamo gafa ( mirab
Abaya), Keffa(Gumaro),
Gambela( Abobo)
Rural, Kafta, Gamblella
Rural, Awash
Rural; Abela ajaja,
Gambella
Urban, Awash, Jinka,
Woyto, Strong Farming
focus areas
86
Page 2 of 3

Wereda Disaster
Risk Profile
National Disaster Risk Management
Commission (NDRMC)
Data_Collected_Date
Thursday, December 12, 2019
Region S.N.N.P
Selected Indicator
Kebele Name
SHOCHORA ABELA
SERE TAWURETA
ABAYA CHOKARE
ELA KEBELA
HOBICHA DIGISO
SHOCHORA OSE
Zone WOLAYITA
Wereda HUMBO
Economic Vulnerability: Level of Migration - Migration level and its characteristics by Kebele
Approx_No. Age_Group
Sex
Migration_Period
Migration Trend
Migration_Reason
200-260
Youth
100-150
Youth
Both
Both
January, February,
March, Apri
2000
Increased
Increased
50-70
All, but more
youth
Both
April - September
Increased
70-100
300-400
Youth working
group
Both
Youth, Children Both
May and June
February up to
June
Increased
Increased
Increased
Economic hardship,
Loss of asset, Job
opportunities
Economic hardship,
Loss of asset, Job
opportunity
To escape from the
hazard, Loss of
assets, Job
opportunity
Job opportunities,
Economic hardship,
To generate income
Seeking of Job
opportunity, Due to
loss of assets and
economic hardship
Destination
Rural and urban, Gambela,
Jinka
Rural/ kaffa/ Gambella
Rural and urban area,
Awash, Zeway, Jinka,
Boramita, Shuru shude,
Kawo-nate, Chalga, Oso
Jinka, Zeway, Awash,
Gambella of rural and
urban areas
Urban are, such as, Awash,
Woyto, Zeway, W/Sodo,
Addis Ababa, etc.
SHOCHORA OGODAMA
Increased
SHOCHORA FESHO
50
Youth working
group
Both
February up to July
Increased
Job opportunity,
Economic hardship,
Low income and low
living standard
Zeway, Shashemene,
Awash and Jinka, Urban
areas
87
Page 3 of 3
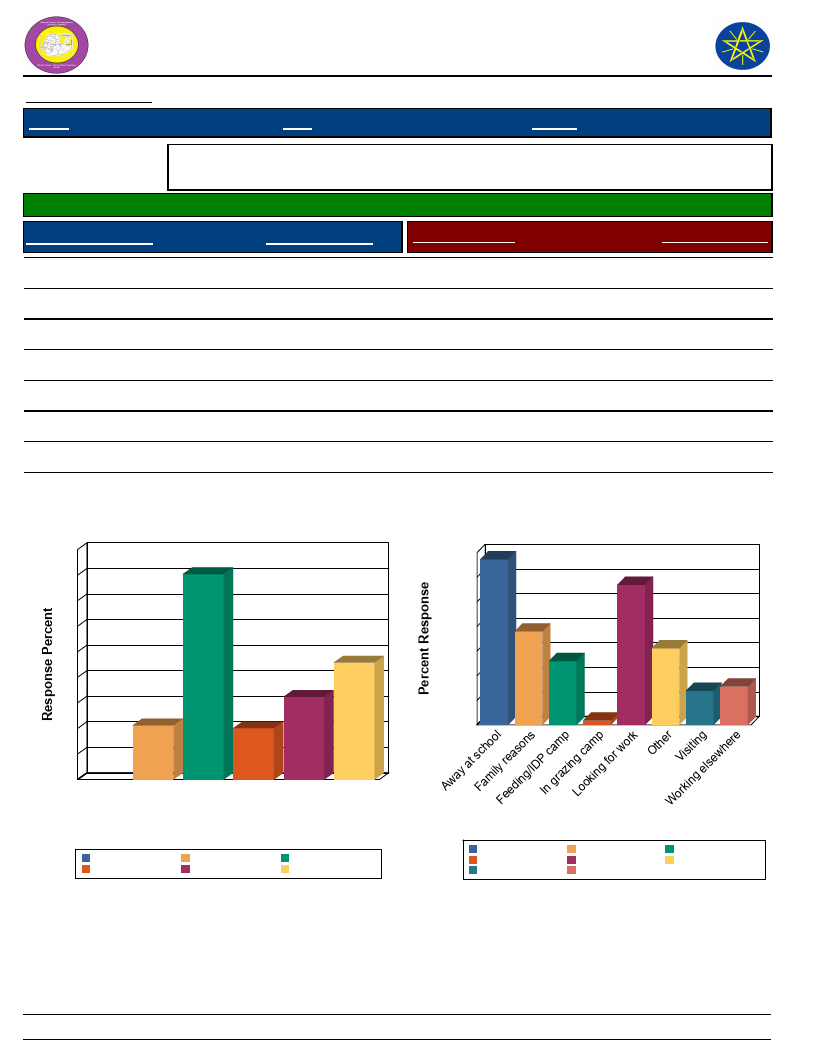
Wereda Disaster
Risk Profile
Data_Collected_Date
Region S.N.N.P
National Disaster Risk Management
Commission (NDRMC)
Thursday, December 12, 2019
Zone WOLAYITA
Wereda HUMBO
Selected Indicator
Economic Vulnerability: Household Migration - Household migration and reason
for migration
Households who migrated (%)
7.52
Duration of Migration
Response Percent
Migration Reason
Response Percent
Less than 2 weeks
Two weeks – month
A month – 3 months
3 – 6 months
> 6 months
16.20
22.91
10.06
40.22
10.61
Visiting
Family reasons
Looking for work
Working elsewhere
In grazing camp
Feeding/IDP camp
Away at school
Other
5.52
15.17
22.76
6.21
0.69
10.34
26.90
12.41
Duration of Migration
45
40
40
35
30
25
23
20
15
11
10
16
10
5
0
> 6 3 – 6 A month Less Two
months months – 3 than 2 weeks –
months weeks month
Duration of Migration
A month – 3 months
> 6 months
Less than 2 weeks
3 – 6 months
Two weeks – month
Migration Reason
28 27
24
23
20
16
15
12
12
10
8
66
4
1
0
Migration Reason
Away at school
In grazing camp
Visiting
Family reasons
Looking for work
Working elsewhere
Feeding/IDP camp
Other
88
Page 1 of 1
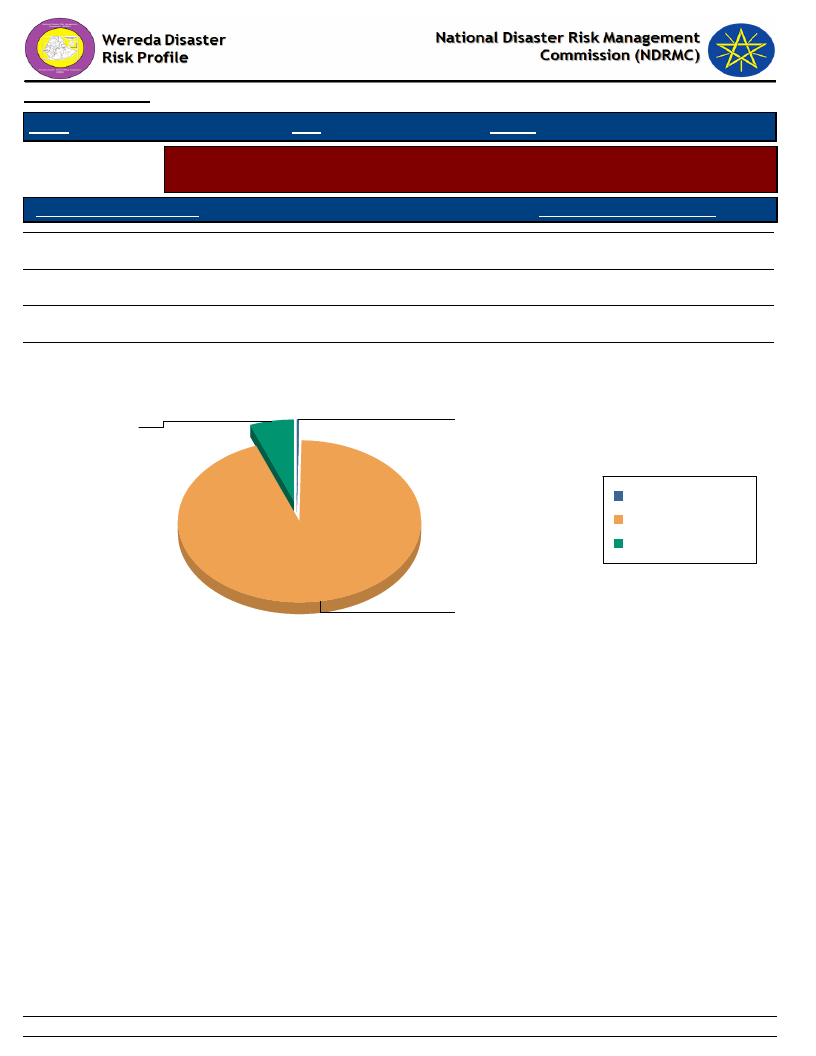
Data_Collected_Date
Thursday, December 12, 2019
Region S.N.N.P
Zone WOLAYITA
Wereda HUMBO
Selected Indicator
Economic Vulnerability: Household Migration - Disasters as a triggering factor for
migration (households response in %)
Is Migration Due to Hazard?
HH Response - Due To Hazard
No
93.87
Yes
5.85
Migration partly because of such impacts
0.28
Is Migration Due to Hazard?
Migration partly because of such
Yes
impacts
5.8
0.3
Migration partly because
of such impacts
No
Yes
No
93.9
89
Page 1 of 1
Data_Collected_Date
Region S.N.N.P
Zone WOLAYITA
Selected Indictor: Demography: Population Structure
KEY:
Male
Female
A-Children
(0-12 yrs)
ABAYA CHOKARE
40
60
ABAYA GUNUCHO
40
60
ABELA AJAJA
55
45
ABELA GEFETA
48
52
ABELA ZEGRE
45
55
AMBE SHOYA
42
58
AMPO KOYISHA
38
62
ANKA WECHA
32
68
BOSA WANCHE
49
51
DEMBA KOYISHA
40
60
ELA KEBELA
-
-
GALICHA KARA
40
60
Wereda HUMBO
Thursday, December 12, 2019
B-Youth
(12-25 yrs)
40
60
42
58
49
51
45
55
42
55
30
70
45
55
40
60
50
50
42
58
-
-
30
70
C-Working
(25-55 yrs)
62
38
30
70
53
47
46
52
40
60
25
75
44
56
38
62
49
51
48
52
-
-
42
58
D-Older
(Above 55
55
45
41
59
52
48
49
51
40
60
34
56
80
20
40
60
49
51
40
60
53
47
30
70
90
Page 1 of 3
Data_Collected_Date
Region S.N.N.P
Zone WOLAYITA
Selected Indictor: Demography: Population Structure
A-Children
(0-12 yrs)
GUTUTO LARENA
-
-
HOBICHA BADA
49
51
HOBICHA BONGOTA
51
49
HOBICHA DIGISO
-
-
KODO KANKO
-
-
KOYISHA GOLA
48
52
KOYISHA OGODAMA
42
58
KOYISHA WANGALA
-
-
SERE TAWURETA
40
60
SHOCHORA ABELA
48
52
SHOCHORA FESHO
49
51
SHOCHORA OGODAMA
45
55
Wereda HUMBO
Thursday, December 12, 2019
B-Youth
(12-25 yrs)
-
-
45
55
54
46
-
-
-
-
45
55
34
66
-
-
32
68
42
58
52
48
40
60
C-Working
(25-55 yrs)
-
-
-
-
54
46
56
44
-
-
46
54
46
54
-
-
45
55
40
60
51
49
48
52
D-Older
(Above 55
-
-
49
51
60
40
78
22
-
-
48
51
40
60
-
-
40
60
41
59
52
48
40
60
91
Page 2 of 3
Data_Collected_Date
Region S.N.N.P
Zone WOLAYITA
Selected Indictor: Demography: Population Structure
A-Children
(0-12 yrs)
SHOCHORA OSE
48
52
Wereda HUMBO
Thursday, December 12, 2019
B-Youth
(12-25 yrs)
45
55
C-Working
(25-55 yrs)
49
51
D-Older
(Above 55
48
52
92
Page 3 of 3
Data_Collected_Date
Region S.N.N.P
Zone WOLAYITA
Thursday, December 12, 2019
Wereda HUMBO
Selected Indicator
Demography: Population Trends and Ethnic Groups
Kebele Name
Population Change Trend
Population Change Reasons
Ethnic_Groups
ABAYA GUNUCHO
ABELA AJAJA
ABELA GEFETA
ANKA WECHA
BOSA WANCHE
GALICHA KARA
GUTUTO LARENA
HOBICHA BONGOTA
HOBICHA BADA
ABELA ZEGRE
KOYISHA GOLA
KODO KANKO
KOYISHA OGODAMA
AMBE SHOYA
KOYISHA WANGALA
AMPO KOYISHA
SHOCHORA ABELA
DEMBA KOYISHA
SERE TAWURETA
ABAYA CHOKARE
ELA KEBELA
HOBICHA DIGISO
SHOCHORA OSE
SHOCHORA
OGODAMA
Increased
Increased
Increased
Increased
Increased
Increased
Increased
Increased
Increased
Increased
Increased
Increased
Increased
Increased
Increased
Increased
Increased
Increased
Increased
Increased
Increased
Increased
Increased
Increased
More children
More children
More Children
More children
More children
More children
More children
Population growth
Population growth
Children
More children
More children
More children
More children
More children
More children
More children
More children
More children
More children
Population growth
Population growth
93
Wolayita
Wolaita
Wolaita
Wolaita
Wolaita
Wolaita
Wolaita
Wolaita
Wolayita
Wolaita
Wolaita
Wolayita
Wolaita
Wolaita
Wolaita
Wolaita
Wolaita
Wolaita
Wolaita
Wolaita
Wolaita
Page 1 of 2
Data_Collected_Date
Region S.N.N.P
Zone WOLAYITA
Thursday, December 12, 2019
Wereda HUMBO
Selected Indicator
Demography: Population Trends and Ethnic Groups
Kebele Name
Population Change Trend
Population Change Reasons
Ethnic_Groups
SHOCHORA FESHO
Increased
More children
Wolaita
94
Page 2 of 2

Data_Collected_Date
Thursday, December 12, 2019
Region S.N.N.P
Zone
WOLAYITA
Wereda HUMBO
Selected Indicator
Social Vulnerability: Household Demographic Characteristics - Demographic
characteristics of households
Demographic Indicator
Indicator_Value Comments
Average household size
5.9
Sex ratio
990.0 Number of females per 1000 males
Child sex ratio (under 14 yrs)
1,033.0 Number of females per 1000 males
Adult sex ratio (18 & Above yrs)
951.0 Number of females per 1000 males
Dependency ratio ([(0-14)+(64+)] / (15-64)
0.9
yrs)
95
Page 1 of 1
Wereda Disaster
Risk Profile
Data_Collected_Date
National Disaster Risk Management
Commission (NDRMC)
Thursday, December 12, 2019
Region S.N.N.P
Selected Indicator
General Awareness
Zone
WOLAYITA
Wereda HUMBO
Social Vulnerability: Level of Educational Attainment - Education status of household members
Percentage Educational Level
Percentage
Read and understand text - Yes, easily
Read and understand text - Yes, with
difficulty
Can write letters - Yes, easily
Can write letters - Yes, with difficulty
6.41
From Proportion of population (7+) - Less than 1st grade completed
8.50
Primary Education (Grade 1 - 6) Student
5.97
Secondary School Education (7 - 12) Student
6.54
From Proportion of population (7+) - Technical / vocational
certificate or diploma
From Proportion of population (15+) - Diploma
From Proportion of population (15+) - Pursuing or completed
University
UNIVERSITY DEGREE
From Proportion of population (7+) - Pursuing University degree
From Proportion of population (7+) - University degree or higher
From Proportion of population (15+) - Less than 1st grade
From Proportion of population (15+) - Primary (1-6)
From Proportion of population (15+) - Secondary (7-12)
From Proportion of population (15+) - Technical
From Proportion of population (7+) - University diploma
26.38
43.16
27.68
0.49
1.54
1.38
0.49
0.93
0.33
27.09
33.09
35.69
0.73
1.04
96
Page 1 of 2
Wereda Disaster
Risk Profile
Data_Collected_Date
National Disaster Risk Management
Commission (NDRMC)
Thursday, December 12, 2019
Region S.N.N.P
Selected Indicator
General Awareness
Zone
WOLAYITA
Wereda HUMBO
Social Vulnerability: Level of Educational Attainment - Education status of household members
Percentage Educational Level
Percentage
General Literacy Rate
Proportion of literate population (7+) to total 7+
population
Percentage
10.03
Adult Literacy Rate
Proportion of literate population (15+) to total 15+
population
Percentage
8.92
97
Page 2 of 2

Data_Collected_Date
Thursday, December 12, 2019
Region S.N.N.P
Zone WOLAYITA
Wereda HUMBO
Selected Indicator
Educational Level
Social Vulnerability: Gender Parity - Gender parity in education level (7+ years)
and household heading
Male_Percent
Female_Percent
From Proportion of population (7+) - Less than 1st grade
completed
From Proportion of population (7+) - Technical / vocational
certificate or diploma
From Proportion of population (7+) - University diploma
38.46
87.50
73.68
61.54
12.50
26.32
From Proportion of population (7+) - Pursuing University degree
70.59
29.41
From Proportion of population (7+) - University degree or higher
66.67
33.33
Primary Education (Grade 1 - 6) Student
48.60
51.40
Secondary School Education (7 - 12) Student
62.85
37.15
Male Head of HH
79.27
Female Head of HH
20.73
98
Page 1 of 1
WDRP Indicators
Environmental Characteristics
99
Data_Collected_Date
Region S.N.N.P
Zone WOLAYITA
Thursday, December 12, 2019
Wereda HUMBO
Selected Indicator
Environmental Situation: Environmental Problems - Major environmental
problems by Kebele
KebeleName
Problem_1
Problem_2
Problem_3
Problem4
ABAYA GUNUCHO
Soil erosion
Deforestation
Water pollution
ABELA AJAJA
Soil erosion
Deforestation
ABELA GEFETA
Soil
Pests
Deforestation
ANKA WECHA
Soil erosion
Pest
Deforestation
Water pollution
BOSA WANCHE
Soil erosion
Climate change
GALICHA KARA
Soil erosion
Deforestation
Pest
Air pollution
GUTUTO LARENA
Soil erosion
Pests
Deforestation
HOBICHA
BONGOTA
HOBICHA BADA
Soil erosion
Soil erosion
Land pollution
Land pollution
Deforestation
Air pollution
ABELA ZEGRE
Soil erosion
Crop Pests
Deforestation
KOYISHA GOLA
Soil erosion
Crop pests
Deforestation
KODO KANKO
Soil erosion
pest
Deforestation
KOYISHA
OGODAMA
AMBE SHOYA
Soil erosion
Soil erosion
Deforestation
Deforestation
Crop pest
KOYISHA
WANGALA
AMPO KOYISHA
Soil erosion
Soil erosion
Crop pest
Land degradation
Water pollution
Deforestation, Pests
SHOCHORA ABELA
Soil erosion
Deforestation
DEMBA KOYISHA
Soil erosion
Deforestation
Crop pests
100
Page 1 of 2

Data_Collected_Date
Region S.N.N.P
Zone WOLAYITA
Thursday, December 12, 2019
Wereda HUMBO
Selected Indicator
Environmental Situation: Environmental Problems - Major environmental
problems by Kebele
KebeleName
Problem_1
Problem_2
Problem_3
Problem4
SERE TAWURETA
Soil erosion
Crop pest
Deforestation
ABAYA CHOKARE
Soil erosion
Land degradation
Water pollution
Crop pests
ELA KEBELA
Soil erosion
Pests
Deforestation
HOBICHA DIGISO
Soil erosion
Land degradation
SHOCHORA OSE
Soil erosion
Pests
Deforestation
SHOCHORA
OGODAMA
SHOCHORA FESHO
Soil erosion
Soil erosion
Pests
Deforestation
Increment of surface
temperature
Low rainfall
Water pollution
101
Page 2 of 2

Data_Collected_Date
Thursday, December 12, 2019
Region S.N.N.P
Zone WOLAYITA
Wereda HUMBO
Selected Indicator
Environmental Situation: General Land Quality - Perceptions of the community
on changes in the general quality of land over a decade
KebeleName
Current_Situation
Change_Last_Decade
Comment
ABAYA GUNUCHO Decrease
Decrease
Soil erosion
ABELA AJAJA
Medium
ABELA GEFETA
Low
Decrease
Land degradation
ANKA WECHA
BOSA WANCHE
GALICHA KARA
Poor
Medium
Medium
GUTUTO LARENA
Low
HOBICHA
BONGOTA
HOBICHA BADA
Medium
Low quality
ABELA ZEGRE
Low
KOYISHA GOLA
Low
KODO KANKO
Low
KOYISHA
OGODAMA
AMBE SHOYA
Decreased
Weak
Decreased
Decreased
Decrease
Decreased
Decreased
Declined
Decrease
Decreased
Decrease
Decreased
Decreased
Soil and water
conservation
Extensive use of land or
exploitation.
Soil erosion has been
decreasing the quality of
land
Soil erosion and poor
agricultural practice.
Deforestation and soil
erosion
Because of land
degradation.
Soil erosion, poor
agricultural practice
Soil erosion and poor
agricultural practice
Soil erosion, poor
agriculture practice
By soil erosion
Over production
KOYISHA
WANGALA
AMPO KOYISHA
Decrease
Medium
Decrease
Decreased
Soil erosion
SHOCHORA ABELA Decreased
Decreased
By soil erosion
DEMBA KOYISHA
Low
Decreased
102
Soil erosion and poor
agricultural practice
Page 1 of 2
Data_Collected_Date
Thursday, December 12, 2019
Region S.N.N.P
Zone WOLAYITA
Wereda HUMBO
Selected Indicator
Environmental Situation: General Land Quality - Perceptions of the community
on changes in the general quality of land over a decade
KebeleName
Current_Situation
Change_Last_Decade
Comment
SERE TAWURETA
Decreased
Decreased
Due to soil erosion
ABAYA CHOKARE
Good
Decreased
Due to deforestation
ELA KEBELA
Medium
Decreased
HOBICHA DIGISO
Low
Decreased
stoniness of the land
SHOCHORA OSE
Low
Decreased
Soil erosion
SHOCHORA
OGODAMA
SHOCHORA
FESHO
Low
Good
Decreased
Increased
Soil erosion
103
Page 2 of 2

Data_Collected_Date
Thursday, December 12, 2019
S.N.N.P
Region
Selected Indicator
Zone WOLAYITA
Wereda HUMBO
Environmental Situation: Changes in Landscape - Changes observed by the
community on landscape and the problems due to the changes
KebeleName
Changes_Observed
Problems_Due_To_Changes
ABAYA GUNUCHO
Decrease
Production loss
ABELA AJAJA
Decreased
ABELA GEFETA
Decrease
Production reduction
ANKA WECHA
Decreased
Reduction of production
BOSA WANCHE
Decreased
GALICHA KARA
Land cover decline
Production reduction
GUTUTO LARENA
Decreased (Land use)
Product reduction.
HOBICHA BONGOTA
Decreased
HOBICHA BADA
Decreased
Productivity of land become decrease.
ABELA ZEGRE
Land use decrease
Reduction of production
KOYISHA GOLA
Decreased in land use
Reduction of production
KODO KANKO
Land use
production reduction
KOYISHA OGODAMA
Decreased
Reduction of production
AMBE SHOYA
Land use
Reduction of production
KOYISHA WANGALA
Decrease
Production reduction
AMPO KOYISHA
Land use Decreased
Reduction of productivity
SHOCHORA ABELA
Decreased
Reduction of production
DEMBA KOYISHA
Land use decreased
Reduction of production
SERE TAWURETA
Land use decreased
Reduction of production
ABAYA CHOKARE
ELA KEBELA
Land cover and land use is
declined
Decreased
Productivity decreased
HOBICHA DIGISO
Land cover and land use
declined
Reduction in production
104
Page 1 of 2

Data_Collected_Date
Thursday, December 12, 2019
S.N.N.P
Region
Selected Indicator
Zone WOLAYITA
Wereda HUMBO
Environmental Situation: Changes in Landscape - Changes observed by the
community on landscape and the problems due to the changes
KebeleName
Changes_Observed
Problems_Due_To_Changes
SHOCHORA OSE
Land use decrease
Reduction of production
SHOCHORA OGODAMA
Land use decreased
Reduction of production
SHOCHORA FESHO
Land cover and land use is
declined
Reduction of production
105
Page 2 of 2

Wereda Disaster Risk
Profile
Data_Collected_Date
Region S.N.N.P
Zone WOLAYITA
National Disaster Risk Management
Commission (NDRMC)
Thursday, December 12, 2019
Wereda HUMBO
Selected Indicator
Kebele Name
Environmental Situation: Land-Use other than crop production - Types of land use other than crop production
across Kebeles
Landuse_1
Comments_1
Landuse_2
Comments_2
Landuse_3
Comments_3
ABAYA GUNUCHO
ABELA AJAJA
Grazing land
Grazing land
For Livestock rearing
Forest
For soil and water
conservation
ABELA GEFETA
Forest
For fuel use
ANKA WECHA
BOSA WANCHE
GALICHA KARA
Grazing land
Grazing land
Honey production
Raring of livestock
Forest harvest
Quarter of the land
was left for livestock.
For income purpose
Forest harvest
For wild animals
Income from
carbon trade.
Honey production
Production of
honey
GUTUTO LARENA
Grazing land
Reserved for livestock
HOBICHA BONGOTA
HOBICHA BADA
ABELA ZEGRE
Grazing land
Grazing land
Forest
Land that is not used
for farming.
Uses for livestock
pasture
For fuel use
Planting trees
Bee keeping and
Honey production
At the margin of
the land.
To generate
income from
honey production
KOYISHA GOLA
Forest
For fuel uses
KODO KANKO
Range lands
for livestock
KOYISHA OGODAMA
Grazing land
For the use of
livestock pasture
Honey production
106
Production of
honey
Page 1 of 2
Wereda Disaster Risk
Profile
Data_Collected_Date
Region S.N.N.P
Zone WOLAYITA
National Disaster Risk Management
Commission (NDRMC)
Thursday, December 12, 2019
Wereda HUMBO
Selected Indicator
Kebele Name
Environmental Situation: Land-Use other than crop production - Types of land use other than crop production
across Kebeles
Landuse_1
Comments_1
Landuse_2
Comments_2
Landuse_3
Comments_3
AMBE SHOYA
Forest
To keep soil fertility
Grazing lands
Raring of animals
KOYISHA WANGALA
Grazing land
For cattle
AMPO KOYISHA
SHOCHORA ABELA
DEMBA KOYISHA
Grazing land
Grazing land
Raring livestock s
Forest harvesting
Honey production
To produce honey
Honey production
Forest
Accessibility of
flower trees for
bees
To control soil
erosion
SERE TAWURETA
ABAYA CHOKARE
Grazing land
Grazing lands
Raring of animals
For livestock pasture
Forest
To control soil
erosion
Honey production
To produce honey
ELA KEBELA
Grazing land
HOBICHA DIGISO
Grazing land
SHOCHORA OSE
SHOCHORA OGODAMA
Grazing land
Forest
Pasture for livestock
Forest harvesting
For pasture of
livestock
For fuel uses
Income from
carbon trade
Honey production
To maximize
income from
honey sell
SHOCHORA FESHO
Farming land
Grazing land
Tree harvesting
107
Page 2 of 2
Data_Collected_Date
Region S.N.N.P
Zone WOLAYITA
Thursday, December 12, 2019
Wereda HUMBO
Selected Indicator
KebeleName
Environmental Situation: Deforestation - Observed changes over levels of
deforestation by the community and its problems
Changes_Observed
Problems_Due_To_Changes
ABAYA GUNUCHO
Increase
Land degradation
ABELA AJAJA
Increased
ABELA GEFETA
Decrease
ANKA WECHA
Decreased
Reduction of soil fertility, Climate change and drought
BOSA WANCHE
Medium
Soil erosion and surface temperature increase.
GALICHA KARA
Increase
Climate change
GUTUTO LARENA
Increased
To build house and use for fuel.
HOBICHA
BONGOTA
HOBICHA BADA
Increased
Medium
Soil erosion
ABELA ZEGRE
decreased
Carbon project and a forestation
KOYISHA GOLA
Decreased
Carbon project and a forestation
KODO KANKO
Decrease
Use for fuel, building
KOYISHA
OGODAMA
AMBE SHOYA
Increased
Increased
Loss of soil fertility, Climate change
Shortage of rainfall, Loss of soil fertility
KOYISHA
WANGALA
AMPO KOYISHA
Increase
Increased
Loss of soil fertility, climate change
Soil erosion and land degradation
SHOCHORA ABELA
Increased
Loss of soil fertility, Climate change, Drought
DEMBA KOYISHA
Increased
Due to selling of woods
SERE TAWURETA
Increased
Reduction of soil fertility, Climate change, Drought
108
Page 1 of 2
Data_Collected_Date
Region S.N.N.P
Zone WOLAYITA
Thursday, December 12, 2019
Wereda HUMBO
Selected Indicator
KebeleName
Environmental Situation: Deforestation - Observed changes over levels of
deforestation by the community and its problems
Changes_Observed
Problems_Due_To_Changes
ABAYA CHOKARE
Increased
Soil erosion and land degradation
ELA KEBELA
Increased
HOBICHA DIGISO
Increased
Soil erosion and increase surface temperature
SHOCHORA OSE
Increased
SHOCHORA
OGODAMA
SHOCHORA FESHO
Decreased
Increased
The carbon project in the area closer and a forestation
Soil erosion and land degradation
109
Page 2 of 2
Wereda Disaster
Risk Profile
National Disaster Risk Management
Commission (NDRMC)
Data_Collected_Date
Region S.N.N.P
Zone WOLAYITA
Wereda HUMBO
Thursday, December 12, 2019
Selected Indicator
KebeleName
Environmental Situation: Natural Resources Availability - Natural resources available and changes observed by
the community
ABAYA CHOKARE
Resources_1
Land
Resources_3
Forest
Observed_Change_1
Minimized
Observed_Change_3
Minimized
Problems_Changes_1
Soil erosion
Problems_Changes_3
Sell fuel wood, Charcoal production
Resources_2
Water
Resources_4
Fish
Observed_Change_2
Problems_Changes_2
Lack of water increased
Observed_Change_4
Problems_Changes_4
Decreased
Illegal fishing practice
KebeleName
ABAYA GUNUCHO
Resources_1
Water
Observed_Change_1
Decrease
Problems_Changes_1
Crop loss
Resources_3
Observed_Change_3
Problems_Changes_3
Forest
Decrease
Resources_2
Fish
Resources_4
Land
Observed_Change_2
Problems_Changes_2
Increase
Observed_Change_4
Problems_Changes_4
Decrease
KebeleName
ABELA AJAJA
110
Page 1 of 13

Wereda Disaster
Risk Profile
National Disaster Risk Management
Commission (NDRMC)
Data_Collected_Date
Region S.N.N.P
Zone WOLAYITA
Wereda HUMBO
Thursday, December 12, 2019
Selected Indicator
Resources_1
Observed_Change_1
Environmental Situation: Natural Resources Availability - Natural resources available and changes observed by
the community
Land
Resources_3
Forest
Decreased
Observed_Change_3
Decreased
Problems_Changes_1
Resources_2
Water
Problems_Changes_3
Resources_4
Soil erosion, wild life disturbance, climate
change
Wood
Observed_Change_2
Problems_Changes_2
Decreased
Observed_Change_4
Problems_Changes_4
Decreased
KebeleName
ABELA GEFETA
Resources_1
Land
Observed_Change_1
Decreased
Problems_Changes_1
Production reduction
Resources_3
Observed_Change_3
Problems_Changes_3
Resources_2
Observed_Change_2
Problems_Changes_2
Water
Decreased
Resources_4
Observed_Change_4
Problems_Changes_4
KebeleName
ABELA ZEGRE
111
Page 2 of 13

Wereda Disaster
Risk Profile
National Disaster Risk Management
Commission (NDRMC)
Data_Collected_Date
Region S.N.N.P
Zone WOLAYITA
Wereda HUMBO
Thursday, December 12, 2019
Selected Indicator
Resources_1
Observed_Change_1
Problems_Changes_1
Environmental Situation: Natural Resources Availability - Natural resources available and changes observed by
the community
Land
Resources_3
Decreased
Observed_Change_3
Reduction of production
Problems_Changes_3
Resources_2
Observed_Change_2
Problems_Changes_2
Water
Decreased
Shortage of rain
Resources_4
Observed_Change_4
Problems_Changes_4
KebeleName
AMBE SHOYA
Resources_1
Land
Observed_Change_1
Decreased
Problems_Changes_1
Soil erosion
Resources_3
Observed_Change_3
Problems_Changes_3
Wood
Decreased
Over carkeli production
Resources_2
Observed_Change_2
Problems_Changes_2
Forest
Decreased
Deforestation
Resources_4
Observed_Change_4
Problems_Changes_4
KebeleName
AMPO KOYISHA
112
Page 3 of 13
Wereda Disaster
Risk Profile
National Disaster Risk Management
Commission (NDRMC)
Data_Collected_Date
Region S.N.N.P
Zone WOLAYITA
Wereda HUMBO
Thursday, December 12, 2019
Selected Indicator
Resources_1
Observed_Change_1
Problems_Changes_1
Environmental Situation: Natural Resources Availability - Natural resources available and changes observed by
the community
Land
Resources_3
Forest
Decreased
Observed_Change_3
Decreased
Problems_Changes_3
Resources_2
Observed_Change_2
Problems_Changes_2
Water
Decreased
Spring water shortage
Resources_4
Observed_Change_4
Problems_Changes_4
KebeleName
ANKA WECHA
Resources_1
Land
Observed_Change_1
Decreased
Problems_Changes_1
Low production
Resources_3
Observed_Change_3
Problems_Changes_3
Wood
Decreased
Deforestation
Resources_2
Observed_Change_2
Problems_Changes_2
Forest
Decreased
Deforestation
Resources_4
Observed_Change_4
Problems_Changes_4
Water
Decreased
Shortage of water
KebeleName
BOSA WANCHE
113
Page 4 of 13

Wereda Disaster
Risk Profile
National Disaster Risk Management
Commission (NDRMC)
Data_Collected_Date
Region S.N.N.P
Zone WOLAYITA
Wereda HUMBO
Thursday, December 12, 2019
Selected Indicator
Resources_1
Observed_Change_1
Environmental Situation: Natural Resources Availability - Natural resources available and changes observed by
the community
Land
Resources_3
Wood
Decreased
Observed_Change_3
Decreased
Problems_Changes_1
Resources_2
Insufficient production of crop compared
to demand.
Water
Problems_Changes_3
Resources_4
High price of wood for different use.
Forest
Observed_Change_2
Problems_Changes_2
Increased
Observed_Change_4
Problems_Changes_4
Medium
KebeleName
DEMBA KOYISHA
Resources_1
Land
Observed_Change_1
Decreased
Problems_Changes_1
Reduction of production
Resources_3
Observed_Change_3
Problems_Changes_3
Resources_2
Observed_Change_2
Problems_Changes_2
Resources_4
Observed_Change_4
Problems_Changes_4
KebeleName
ELA KEBELA
114
Page 5 of 13

Wereda Disaster
Risk Profile
National Disaster Risk Management
Commission (NDRMC)
Data_Collected_Date
Region S.N.N.P
Zone WOLAYITA
Wereda HUMBO
Thursday, December 12, 2019
Selected Indicator
Resources_1
Observed_Change_1
Problems_Changes_1
Environmental Situation: Natural Resources Availability - Natural resources available and changes observed by
the community
Land
Resources_3
Wood
Decreased
Observed_Change_3
Decreased
Problems_Changes_3
Resources_2
Observed_Change_2
Problems_Changes_2
Water
Decreased
Resources_4
Observed_Change_4
Problems_Changes_4
KebeleName
GALICHA KARA
Resources_1
Land
Observed_Change_1
Decrease
Problems_Changes_1
Shortage of cultivated land
Resources_3
Observed_Change_3
Problems_Changes_3
Water
Decrease
Shortage of water for livestock and human
Resources_2
Observed_Change_2
Problems_Changes_2
Forest
Decrease
Shortage of rainfall
Resources_4
Observed_Change_4
Problems_Changes_4
KebeleName
GUTUTO LARENA
115
Page 6 of 13

Wereda Disaster
Risk Profile
National Disaster Risk Management
Commission (NDRMC)
Data_Collected_Date
Region S.N.N.P
Zone WOLAYITA
Wereda HUMBO
Thursday, December 12, 2019
Selected Indicator
Resources_1
Observed_Change_1
Problems_Changes_1
Environmental Situation: Natural Resources Availability - Natural resources available and changes observed by
the community
Land
Resources_3
Minimized
Observed_Change_3
Reduction of production.
Problems_Changes_3
Resources_2
Observed_Change_2
Problems_Changes_2
Water
Minimized
Lack of rain fall.
Resources_4
Observed_Change_4
Problems_Changes_4
KebeleName
HOBICHA BADA
Resources_1
Land
Observed_Change_1
Decreased
Problems_Changes_1
Low yield
Resources_3
Observed_Change_3
Problems_Changes_3
Wood
Increased
Resources_2
Observed_Change_2
Problems_Changes_2
Forest
Increased
Resources_4
Observed_Change_4
Problems_Changes_4
Domestic animals
Decreased
Loss of income
KebeleName
HOBICHA BONGOTA
116
Page 7 of 13

Wereda Disaster
Risk Profile
National Disaster Risk Management
Commission (NDRMC)
Data_Collected_Date
Region S.N.N.P
Zone WOLAYITA
Wereda HUMBO
Thursday, December 12, 2019
Selected Indicator
Resources_1
Observed_Change_1
Problems_Changes_1
Environmental Situation: Natural Resources Availability - Natural resources available and changes observed by
the community
Land
Resources_3
Wood
Reduced
Observed_Change_3
Reduced
Gully Formation
Problems_Changes_3
Cutting for home construction
Resources_2
Observed_Change_2
Problems_Changes_2
Forest
Reduced
Cutting of trees
Resources_4
Observed_Change_4
Problems_Changes_4
Minerals
The same
KebeleName
HOBICHA DIGISO
Resources_1
Land
Observed_Change_1
Decreased
Problems_Changes_1
Low yield
Resources_3
Observed_Change_3
Problems_Changes_3
Wood
Decreased
Resources_2
Observed_Change_2
Problems_Changes_2
Forest
Decreased
Climate change
Resources_4
Observed_Change_4
Problems_Changes_4
KebeleName
KODO KANKO
117
Page 8 of 13

Wereda Disaster
Risk Profile
National Disaster Risk Management
Commission (NDRMC)
Data_Collected_Date
Region S.N.N.P
Zone WOLAYITA
Wereda HUMBO
Thursday, December 12, 2019
Selected Indicator
Resources_1
Observed_Change_1
Problems_Changes_1
Environmental Situation: Natural Resources Availability - Natural resources available and changes observed by
the community
Land
Resources_3
Minimized
Observed_Change_3
Production reduction
Problems_Changes_3
Resources_2
Observed_Change_2
Problems_Changes_2
Water
Minimized
Due to rainfall
Resources_4
Observed_Change_4
Problems_Changes_4
KebeleName
KOYISHA GOLA
Resources_1
Land
Observed_Change_1
Decreased
Problems_Changes_1
Reduction of production
Resources_3
Observed_Change_3
Problems_Changes_3
Water
Decreased
Due to availability of rain
Resources_2
Observed_Change_2
Problems_Changes_2
Forest
Decreased
Resources_4
Observed_Change_4
Problems_Changes_4
KebeleName
KOYISHA OGODAMA
118
Page 9 of 13

Wereda Disaster
Risk Profile
National Disaster Risk Management
Commission (NDRMC)
Data_Collected_Date
Region S.N.N.P
Zone WOLAYITA
Wereda HUMBO
Thursday, December 12, 2019
Selected Indicator
Resources_1
Observed_Change_1
Problems_Changes_1
Environmental Situation: Natural Resources Availability - Natural resources available and changes observed by
the community
Land
Resources_3
Decreased
Observed_Change_3
Reduction of production
Problems_Changes_3
Resources_2
Observed_Change_2
Problems_Changes_2
Forest
Decreased
Climate change
Resources_4
Observed_Change_4
Problems_Changes_4
KebeleName
KOYISHA WANGALA
Resources_1
Land
Observed_Change_1
Decrease
Problems_Changes_1
Resources_2
Production reduction and environmental
hardship
Forest
Observed_Change_2
Decrease
Problems_Changes_2
Climate change and population growth
Resources_3
Observed_Change_3
Problems_Changes_3
Resources_4
Observed_Change_4
Problems_Changes_4
KebeleName
SERE TAWURETA
119
Page 10 of 13

Wereda Disaster
Risk Profile
National Disaster Risk Management
Commission (NDRMC)
Data_Collected_Date
Region S.N.N.P
Zone WOLAYITA
Wereda HUMBO
Thursday, December 12, 2019
Selected Indicator
Resources_1
Observed_Change_1
Problems_Changes_1
Environmental Situation: Natural Resources Availability - Natural resources available and changes observed by
the community
Land
Resources_3
Decreased
Observed_Change_3
Reduction of production
Problems_Changes_3
Resources_2
Observed_Change_2
Problems_Changes_2
Forest
Decreased
Climate change, High temperature
Resources_4
Observed_Change_4
Problems_Changes_4
KebeleName
SHOCHORA ABELA
Resources_1
Land
Observed_Change_1
Decreased
Problems_Changes_1
Reduction of production
Resources_3
Observed_Change_3
Problems_Changes_3
Resources_2
Observed_Change_2
Problems_Changes_2
Forest
Decreased
Climate change, High temperature
Resources_4
Observed_Change_4
Problems_Changes_4
KebeleName
SHOCHORA FESHO
120
Page 11 of 13

Wereda Disaster
Risk Profile
National Disaster Risk Management
Commission (NDRMC)
Data_Collected_Date
Region S.N.N.P
Zone WOLAYITA
Wereda HUMBO
Thursday, December 12, 2019
Selected Indicator
Resources_1
Observed_Change_1
Problems_Changes_1
Environmental Situation: Natural Resources Availability - Natural resources available and changes observed by
the community
Land
Resources_3
Wood
Decreased
Observed_Change_3
Decreased
Stratified for soil
Problems_Changes_3
Cutting of more trees
Resources_2
Observed_Change_2
Problems_Changes_2
Water
Decreased
Decline of river size
Resources_4
Observed_Change_4
Problems_Changes_4
Forest
Increased
Because of a forestation
KebeleName
SHOCHORA OGODAMA
Resources_1
Land
Observed_Change_1
Decreased
Problems_Changes_1
Reduction of production
Resources_3
Observed_Change_3
Problems_Changes_3
Water
Decreased
Fluctuation of rainfall
Resources_2
Observed_Change_2
Problems_Changes_2
Forest
Decreased
Resources_4
Observed_Change_4
Problems_Changes_4
KebeleName
SHOCHORA OSE
121
Page 12 of 13
Wereda Disaster
Risk Profile
National Disaster Risk Management
Commission (NDRMC)
Data_Collected_Date
Region S.N.N.P
Zone WOLAYITA
Wereda HUMBO
Thursday, December 12, 2019
Selected Indicator
Resources_1
Observed_Change_1
Problems_Changes_1
Environmental Situation: Natural Resources Availability - Natural resources available and changes observed by
the community
Land
Resources_3
Minimized
Observed_Change_3
Reduction of production
Problems_Changes_3
Resources_2
Observed_Change_2
Problems_Changes_2
Resources_4
Observed_Change_4
Problems_Changes_4
122
Page 13 of 13
Wereda Disaster
Risk Profile
National Disaster Risk Management
Commission (NDRMC)
Data_Collected_Date
Region S.N.N.P
Selected Indicator
Zone WOLAYITA
Wereda HUMBO
Environmental Situation: Rainfall & Temperature - Observed changes on rainfall and temperature by the
community over the last decade
Rainfall
Temperature
Thursday, December 12, 2019
Kebele Name
Changes Observed Problems
Changes Observed
Problems
ABAYA GUNUCHO
ABELA AJAJA
ABELA GEFETA
ANKA WECHA
Decrease
Decreased
Increase
Decreased
BOSA WANCHE
GALICHA KARA
Decreased
Decrease
GUTUTO LARENA
HOBICHA
BONGOTA
HOBICHA BADA
Decreased
Decreased
Decreased
ABELA ZEGRE
Decreased
KOYISHA GOLA
Decreased
KODO KANKO
Decrease
Crop damage
Crop damage,
Crop damage, shortage of food,
drought and poverty
Low crop production.
Crop damage and shortage of pasture
as a result of drought
Crop damage.
Low production, Decline of pasture
land.
Damage of crop, Reduction of
pasture
Damage of crop, Reduction of
pasture
Damage of crop and pasture
Increase
Increased
Decrease
Increased
Increased
Increase
Increased
Increased
Increased
Increased
Increased
Increase
Weather change
Drought, climate change
Crop pest, climate change
Drought
Climate change
Disease, Drought and climate change.
Drought
Drought, Climate change
Drought, Climate change
Drought and climate change
123
Page 1 of 3
Wereda Disaster
Risk Profile
National Disaster Risk Management
Commission (NDRMC)
Data_Collected_Date
Region S.N.N.P
Selected Indicator
Zone WOLAYITA
Wereda HUMBO
Environmental Situation: Rainfall & Temperature - Observed changes on rainfall and temperature by the
community over the last decade
Rainfall
Temperature
Thursday, December 12, 2019
Kebele Name
KOYISHA
OGODAMA
AMBE SHOYA
KOYISHA
WANGALA
AMPO KOYISHA
SHOCHORA ABELA
DEMBA KOYISHA
SERE TAWURETA
ABAYA CHOKARE
ELA KEBELA
HOBICHA DIGISO
SHOCHORA OSE
Changes Observed Problems
Decreased
Decreased
Decrease
Decreased
Crop damage, Shortage of fodder,
Drought
Loss of assets, Crop damage,
Shortage of fodder, Drought
Drought, crop damage, shortage of
fodder
Crop production
Decreased
Decreased
Crop damage, Shortage of fodder,
Drought
Crop damage, Reduction of pasture
Decreased
Decreased
Decreased
Crop damage, Shortage of fodder,
Drought
Fall in crop production, Drought,
Poor pasture growth
Fluctuation of
rainfall
Decreased
Low production of crop
Crop damage, reduction of pasture
Changes Observed
Problems
Increased
Climate change, Crop pest
Increased
Climate change, Crop pest
Increase
climate change, crop pest
Increased
Increased
Drought
Climate change, Crop pest
Increased
Increased
Drought, Climate change
Climate change
Increased
Drought, Not conducive for life
Increased
Increased
Drought
Increased
Drought, Climate change
124
Page 2 of 3
Wereda Disaster
Risk Profile
National Disaster Risk Management
Commission (NDRMC)
Data_Collected_Date
Region S.N.N.P
Selected Indicator
Zone WOLAYITA
Wereda HUMBO
Environmental Situation: Rainfall & Temperature - Observed changes on rainfall and temperature by the
community over the last decade
Rainfall
Temperature
Thursday, December 12, 2019
Kebele Name
SHOCHORA
OGODAMA
SHOCHORA FESHO
Changes Observed Problems
Decreased
Crop damage, Reduction of pasture
Fluctuation year
to year become
decreased
Fall in crop production, Poor pasture
growth
Changes Observed
Problems
Increased
Drought, Climate change
Increased
Drought, Reduction of crop production
125
Page 3 of 3

Data_Collected_Date
Region S.N.N.P
Zone WOLAYITA
Thursday, December 12, 2019
Wereda HUMBO
Selected Indicator
KebeleName
Environmental Situation: Reasons for Environmental Changes
Reason_For_Environmental_Changes
ABAYA GUNUCHO
Shortage of rainfall, deforestation, high population
ABELA AJAJA
ABELA GEFETA
High population pressure, shortage of rainfall, deforestation
ANKA WECHA
Soil erosion, deforestation, high population growth, loss of soil fertility
BOSA WANCHE
GALICHA KARA
High population density, soil erosion, deforestation, increase of
temperature.
Deforestation
GUTUTO LARENA
HOBICHA BONGOTA
Deforestation, population growth, shortage of rainfall, poor farming
system.
Deforestation, soil erosion, shortage of rain fall
HOBICHA BADA
ABELA ZEGRE
Deforestation, high expansion of agricultural land, land degradation,
population growth on scarce land
Population growth, shortage of rain fall, deforestation
KOYISHA GOLA
Population growth, shortage of rainfall, deforestation
KODO KANKO
Population increment, shortage of rainfall, deforestation
KOYISHA OGODAMA
Shortage of rain fall, deforestation, population growth
AMBE SHOYA
KOYISHA WANGALA
Soil erosion, shortage of rainfall, deforestation
AMPO KOYISHA
Deforestation, land degradation, soil erosion, increase in temperature
SHOCHORA ABELA
Shortage of rain fall, deforestation, population growth
DEMBA KOYISHA
Population growth, shortage of rain fall, deforestation
SERE TAWURETA
Shortage of rain fall, high temperature
ABAYA CHOKARE
ELA KEBELA
Deforestation, land degradation, erratic rainfall, soil erosion, high
temperature
Soil erosion, deforestation, land degradation
126
Page 1 of 2
Data_Collected_Date
Region S.N.N.P
Zone WOLAYITA
Thursday, December 12, 2019
Wereda HUMBO
Selected Indicator
KebeleName
Environmental Situation: Reasons for Environmental Changes
Reason_For_Environmental_Changes
HOBICHA DIGISO
SHOCHORA OSE
Deforestation, population growth, agricultural expansion, land
degradation
Population growth, shortage of rain fall, deforestation
SHOCHORA OGODAMA
Population growth, shortage of rainfall, deforestation
SHOCHORA FESHO
Deforestation, population growth, soil erosion, shortage of rainfall
127
Page 2 of 2

Data_Collected_Date
Region S.N.N.P
Zone WOLAYITA
Thursday, December 12, 2019
Wereda HUMBO
Selected Indicator
KebeleName
ABAYA GUNUCHO
Environmental Situation: Soil Erosion - Observed changes on levels of soil
erosion by the community
Changes_Observed
Problems_Observed
Increase
Loss of soil fertility
ABELA AJAJA
Increased
ABELA GEFETA
Decrease
Soil fertility loss
ANKA WECHA
Increased
Loss of production and soil fertility
BOSA WANCHE
Increased
Soil fertility decline.
GALICHA KARA
Increase
Loss of soil fertility as a result poor crop yield
GUTUTO LARENA
Increased
Decrease soil fertility.
HOBICHA BONGOTA
Increased
HOBICHA BADA
Increased
Loss of fertility and Low yield.
ABELA ZEGRE
Increased
Decrease soil fertility
KOYISHA GOLA
Increased
Decrease soil fertility
KODO KANKO
Increase
Loss of soil fertility
KOYISHA OGODAMA
Increased
Loss of soil fertility, Land degradation
AMBE SHOYA
Increased
Land degradation, Loss of soil fertility
KOYISHA WANGALA
Increase
Loss of soil fertility
AMPO KOYISHA
Increased
Loss of soil fertility
SHOCHORA ABELA
Increased
Loss of soil fertility, Land degradation
DEMBA KOYISHA
Increased
Decrease soil fertility
SERE TAWURETA
Increased
Reduction of soil fertility, Land degradation
ABAYA CHOKARE
ELA KEBELA
Increased
Increased
Soil fertility decline, Crop production decrease, Gully
formation
128
Page 1 of 2
Data_Collected_Date
Region S.N.N.P
Zone WOLAYITA
Thursday, December 12, 2019
Wereda HUMBO
Selected Indicator
KebeleName
Environmental Situation: Soil Erosion - Observed changes on levels of soil
erosion by the community
Changes_Observed
Problems_Observed
HOBICHA DIGISO
Increased
Decline of soil fertility
SHOCHORA OSE
Decreased
Decrease soil fertility
SHOCHORA OGODAMA
Decreased
Reduction of soil fertility
SHOCHORA FESHO
Increased
Soil fertility decline
129
Page 2 of 2
WDRP Indicators
Livelihood, Occupation and Source
of Food Characteristics
130
Wereda Disaster
Risk Profile
Data_Collected_Date
National Disaster Risk Management
Commission (NDRMC)
Thursday, December 12, 2019
Region S.N.N.P
Zone
WOLAYITA
Wereda HUMBO
Selected Indicator
Economic Vulnerability: Major Occupational Categories - Major categories of occupation and percent of population
engaged in the occupation by Kebele
Occupational Categories and Percent of Population engaged within these occupational categories
Percent (%) of Population
KebeleName
Occupation 1
Population Occupation 2
Population Occupation 3
Population Occupation 4
Population
ABAYA GUNUCHO
Agriculture -
85
Daily labor work -
10
Trading -
5
-
ABELA AJAJA
Agriculture - Crop
90
Off farming - Petty trade
10
-
-
production, livestock
rearing
ABELA GEFETA
Agriculture -
Off farm -
-
-
ANKA WECHA
Agricultural practice -
50
Agricultural practice -
50
-
-
Livestock production
Crop production
BOSA WANCHE
Agriculture - Crop
production
60
- Livestock activities
30
Off-farm - Petty trade
10
-
GALICHA KARA
Livestock production -
48
Crop production -
42
Petty trade -
5
Poultry -
5
GUTUTO LARENA
Agriculture - Crop
80
- Livestock Production
12
Off-farm - Poultry
1
- Petty Trade
7
Production
Production
HOBICHA
Farming activity and
95
Petty trade -
5
-
-
BONGOTA
livestock production -
HOBICHA BADA
Agriculture - Crop
60
- Livestock activities
20
Off-farm - Petty trade
5
- Daily Labor
15
production
ABELA ZEGRE
Agriculture - Crop
85
- Livestock
12
Off-farm - Petty trade
2
- Poultry
1
KOYISHA GOLA
Agriculture - Crop
85
- Livestock
14
Off-farm - Petty trade
1
-
131
Page 1 of 3
Wereda Disaster
Risk Profile
Data_Collected_Date
National Disaster Risk Management
Commission (NDRMC)
Thursday, December 12, 2019
Region S.N.N.P
Zone
WOLAYITA
Wereda HUMBO
Selected Indicator
Economic Vulnerability: Major Occupational Categories - Major categories of occupation and percent of population
engaged in the occupation by Kebele
Occupational Categories and Percent of Population engaged within these occupational categories
Percent (%) of Population
KebeleName
Occupation 1
Population Occupation 2
Population Occupation 3
Population Occupation 4
Population
KODO KANKO
Agriculture - Crop
production
80
- livestock production
15
of farming activities -
5
-
Petty trade
KOYISHA OGODAMA
Agriculture - Crop
production
48
- Livestock production
50
Petty trade - Petty
trade
2
-
AMBE SHOYA
Agriculture -
85
Daily labor work -
5
Petty trade -
5
Carpentry -
5
KOYISHA WANGALA
Agriculture - Crop and
85
Off farm activities - Petty
10
- Daily labor
livestock production
trade
5
-
AMPO KOYISHA
Agriculture - Crop
production
60
- Livestock Production
25
Off-farm - Petty trade
15
-
SHOCHORA ABELA
Agriculture - Crop
48
- Livestock production
40
Off farming - Hand
2
- Petty trade
10
production
crafts
DEMBA KOYISHA
Agriculture - Crop
85
- Livestock
14
Off farm - Petty trade
1
-
SERE TAWURETA
Agriculture - 85
Daily Labor Work - 10
Trade - 5
-
ABAYA CHOKARE
ELA KEBELA
HOBICHA DIGISO
Agriculture - Crop
production
Agriculture - Crop
production
Agriculture - Crop
production
40
- Livestock disease
45
- Livestock
50
- Livestock activity
35
Off farm - Petty trade
15
- Daily employment
10
activity
25
Petty trade -
10
Daily employment -
20
30
Off-farm - Petty trade
5
- Daily labor work
15
132
Page 2 of 3

Wereda Disaster
Risk Profile
Data_Collected_Date
National Disaster Risk Management
Commission (NDRMC)
Thursday, December 12, 2019
Region S.N.N.P
Zone
WOLAYITA
Wereda HUMBO
Selected Indicator
Economic Vulnerability: Major Occupational Categories - Major categories of occupation and percent of population
engaged in the occupation by Kebele
Occupational Categories and Percent of Population engaged within these occupational categories
Percent (%) of Population
KebeleName
Occupation 1
Population Occupation 2
Population Occupation 3
Population Occupation 4
Population
SHOCHORA OSE
SHOCHORA
OGODAMA
SHOCHORA FESHO
Agriculture - Crop
production
Agriculture - Crop
production
Agriculture - Farming
activity
85
- Livestock activity
85
- Livestock activities
45
- Livestock production
14
Off farm - Petty trade
1
-
14
Off farm - Petty trade
1
-
45
Off farm - Petty trade
10
-
133
Page 3 of 3

Data_Collected_Date
Region S.N.N.P
Zone WOLAYITA
Thursday, December 12, 2019
Wereda HUMBO
Selected Indicator
Economic Vulnerability: Livelihoods - Households important sources of
livelihood (response in %)
Type of Livelihood Activity
Order of Importnce
Agricultural laborer
1st
2nd
3rd
10.99
3.43
5.69
Animal herder
0.00
0.00
0.81
Barber or Hairdresser
0.00
0.62
0.00
Basket-making, Mat-making
0.26
0.00
0.00
Begging activities
0.79
0.62
0.00
Buying and selling livestock (cattle, sheep, goats, camels)
4.97
6.85
4.88
Carpenter, Furniture-maker, or Metal-worker
0.79
0.93
1.63
Counselor (disputes, marriage)
0.26
0.00
0.00
Daily laborer
7.85
8.41
9.76
Making jewellery
0.00
0.62
0.00
Making traditional utensils or farm tools
0.26
1.25
0.00
Others
0.79
0.31
0.00
Pottery
0.52
0.00
1.63
134
Page 1 of 4
Data_Collected_Date
Region S.N.N.P
Zone WOLAYITA
Thursday, December 12, 2019
Wereda HUMBO
Selected Indicator
Economic Vulnerability: Livelihoods - Households important sources of
livelihood (response in %)
Type of Livelihood Activity
Order of Importnce
1st
2nd
3rd
Rearing & selling animals (camels, cattle, sheep, goats)
13.61
15.58
9.76
Religious teacher
0.26
0.31
0.00
Restaurant or hotel worker
0.00
0.00
0.81
Salaried job
0.79
1.56
8.13
Sale_Of_Natural_Products - Animal feed (grass, fodder, forage, salty
sand, etc.)
Sale_Of_Natural_Products - Charcoal
1.83
11.21
13.82
6.02
3.74
7.32
Sale_Of_Natural_Products - Construction materials (sand, grass,
wooden poles, etc.)
Sale_Of_Natural_Products - Firewood
0.52
0.31
0.00
12.30
7.79
4.88
Sale_Of_Natural_Products - Incense, frankincense, and natural gum
0.26
0.31
0.00
Sale_Of_Natural_Products - Precious stones (gold, gem-stones)
0.52
0.00
0.00
Sale_Of_Natural_Products - Water
0.00
0.62
1.63
Sale_Of_Natural_Products - Wild fruits
0.26
0.00
0.00
Selling Cereal food crops (sorghum, maize, wheat, barley)
24.61
10.59
6.50
135
Page 2 of 4

Data_Collected_Date
Region S.N.N.P
Zone WOLAYITA
Thursday, December 12, 2019
Wereda HUMBO
Selected Indicator
Economic Vulnerability: Livelihoods - Households important sources of
livelihood (response in %)
Type of Livelihood Activity
Order of Importnce
1st
2nd
3rd
Selling Chat / Khat
0.52
0.00
0.00
Selling Clothes and shoes
0.26
0.00
0.00
Selling cooked food
0.26
0.00
0.00
Selling dairy products (milk, butter, ghee, cheese)
2.88
12.77
8.94
Selling eggs (from own chickens) Beekeeping (selling honey
bees-wax, or bee-hives)
Selling Fruits (mango, papaya, banana, orange, lemon, etc.)
0.26
0.62
1.63
1.83
3.74
3.25
Selling hides and skins (from goats, sheep, cattle)
0.00
0.62
0.00
Selling meat (from own livestock)
0.00
0.31
0.00
Selling Oil seeds (sesame, sunflower)
0.52
0.00
0.00
Selling Other foods (sugar, flour, coffee, etc.)
2.09
3.12
4.07
Selling Pulses (beans, cow-pea, chick-pea)
0.52
0.62
0.00
Selling Root crops (Irish potato, sweet potato)
0.26
1.25
1.63
Selling tea, coffee, cake, bread, “areki”, “tella”
0.26
0.00
0.00
136
Page 3 of 4
Data_Collected_Date
Region S.N.N.P
Zone WOLAYITA
Thursday, December 12, 2019
Wereda HUMBO
Selected Indicator
Economic Vulnerability: Livelihoods - Households important sources of
livelihood (response in %)
Type of Livelihood Activity
Order of Importnce
1st
2nd
3rd
Selling Vegetables (onion, tomato, cabbage, pumpkin, etc.)
0.79
1.87
1.63
Selling wool (from sheep)
0.00
0.00
0.81
Weaving, Knitting, Embroidery, Tailoring
1.05
0.00
0.81
137
Page 4 of 4

Data_Collected_Date
Region S.N.N.P
Zone WOLAYITA
Thursday, December 12, 2019
Wereda HUMBO
Selected Indicator
Economic Vulnerability: Occupational Categories - Percent of population
above 15 years age by occupation categories
Type of Livelihood Activity
Main Occupation
Secondary Occupation
B)Student
C)Unemployed & seeking work
D)Neither studying nor working nor seeking work
E)Retired/ Old
F)Cultivator
G)Agricultural labourer
H)Livestock rearing
I)Non-agricultural labour
J)Craftsman
K)Shopkeeper and Petty trade
L)Home-maker (housewife)
M)Salaried
N)Chronically ill
O)Physically disabled
P)Others (specify)
Q)None
1st Occupation
29.01
1.76
0.65
1.58
33.55
0.74
0.56
0.65
0.74
2.32
27.53
0.56
0.09
0.09
0.19
2nd Occupation
6.67
3.59
3.08
4.62
7.18
20.51
8.21
14.87
23.59
3.08
1.54
3.08
138
Page 1 of 1
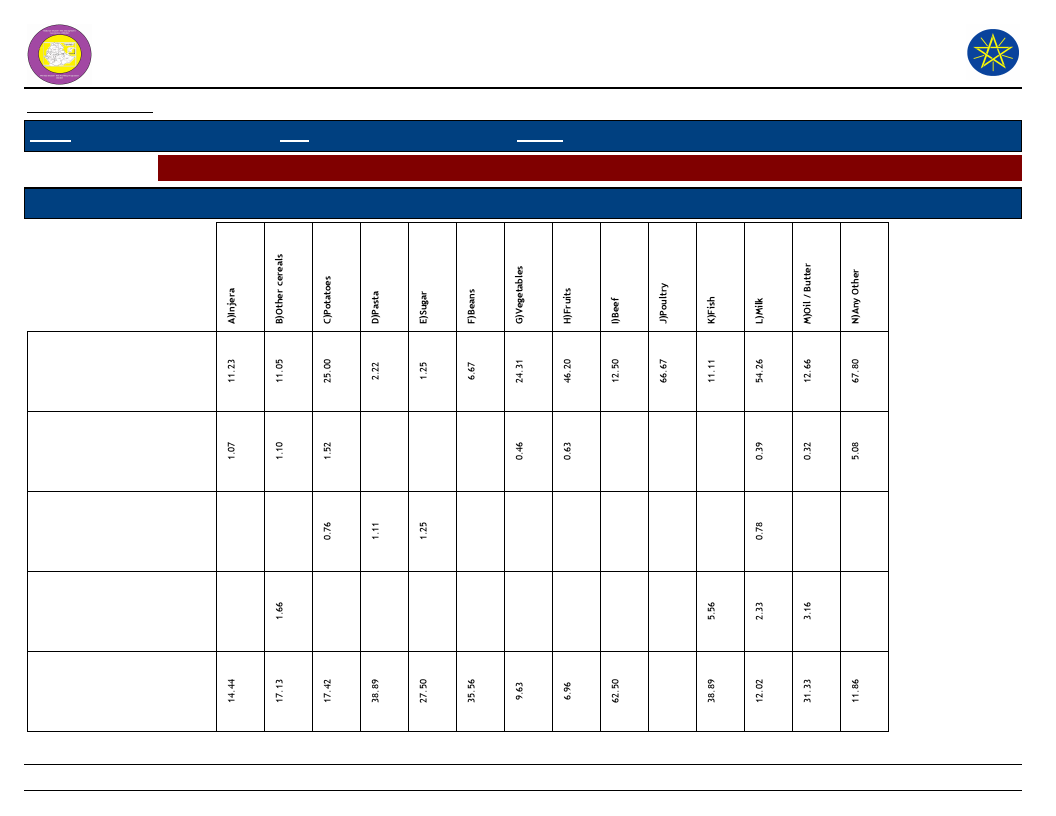
Wereda Disaster Risk
Profile
National Disaster Risk Management
Commission (NDRMC)
Data_Collected_Date
Region S.N.N.P
Zone WOLAYITA
Wereda HUMBO
Thursday, December 12, 2019
Selected Indictor: Economic Vulnerability: Sources of Food - Households source for different food items (response in %)
Source of Food
Types of Food Item
A)Own
cultivation/production
B)Casual labor
C)Borrowed
D)Gifts from
friends/neighbors
E)Purchases from main
shop
139
Page 1 of 3
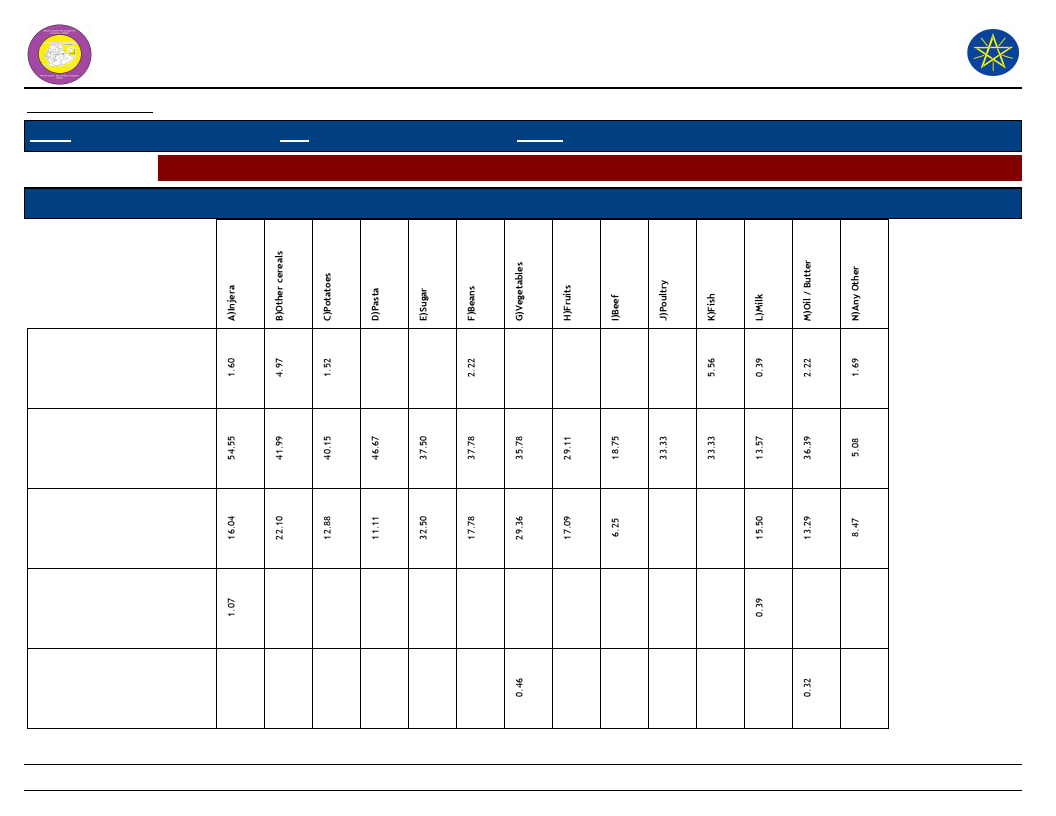
Wereda Disaster Risk
Profile
National Disaster Risk Management
Commission (NDRMC)
Data_Collected_Date
Region S.N.N.P
Zone WOLAYITA
Wereda HUMBO
Thursday, December 12, 2019
Selected Indictor: Economic Vulnerability: Sources of Food - Households source for different food items (response in %)
Source of Food
Types of Food Item
F)Free meals/Food
assistance
G)Purchase from
roadside vendor/tuck
shop
H)Purchase subsidized
food from Kebele shop
I)Gathering catching
J)Begging
140
Page 2 of 3
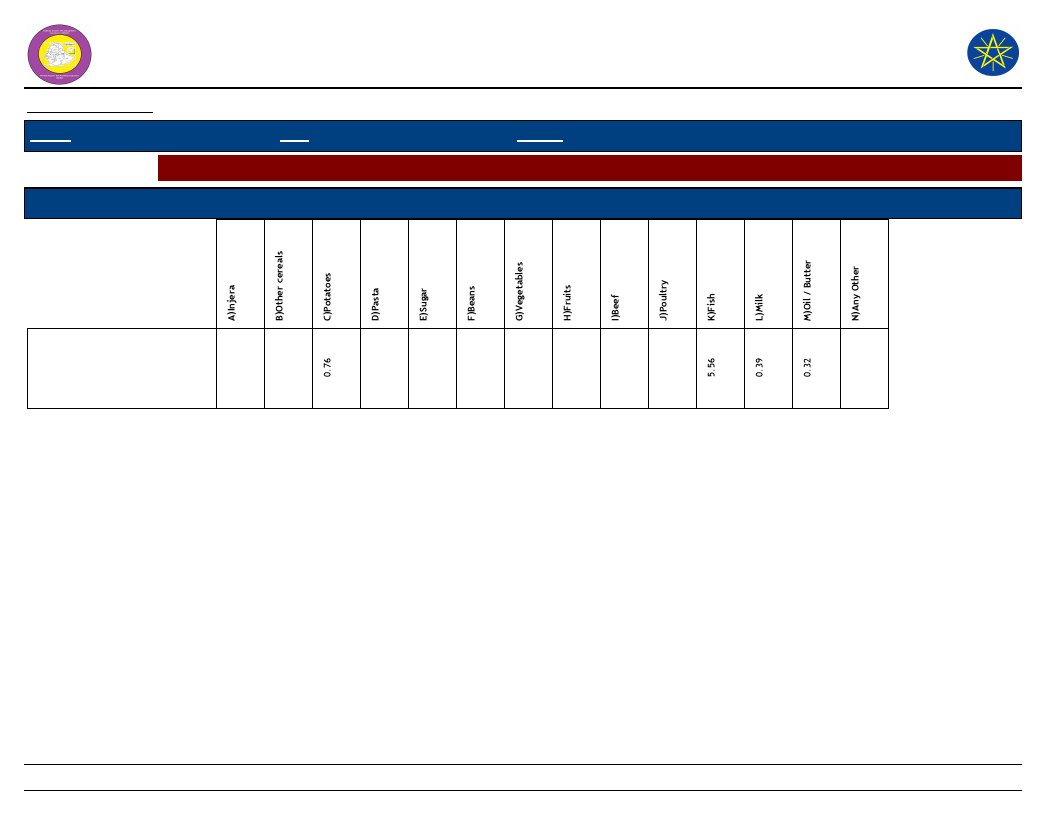
Wereda Disaster Risk
Profile
National Disaster Risk Management
Commission (NDRMC)
Data_Collected_Date
Region S.N.N.P
Zone WOLAYITA
Wereda HUMBO
Thursday, December 12, 2019
Selected Indictor: Economic Vulnerability: Sources of Food - Households source for different food items (response in %)
Source of Food
Types of Food Item
K)Other
141
Page 3 of 3
WDRP Indicators
Crop Production Characteristics
142
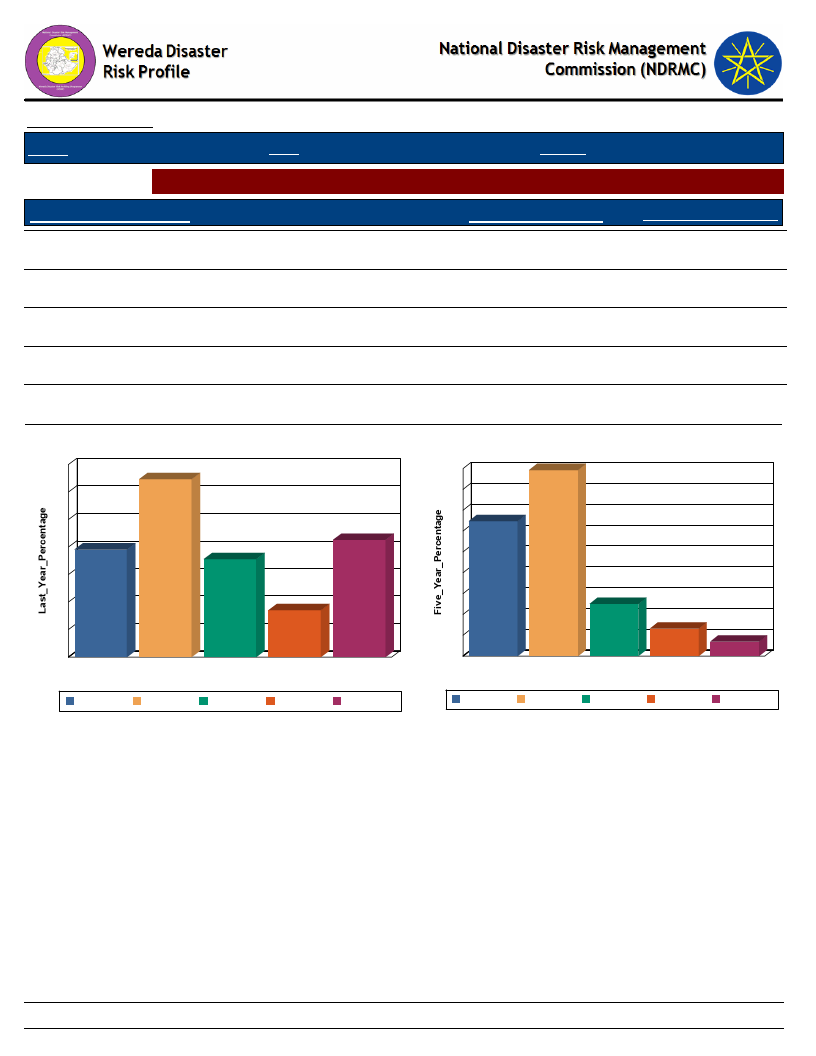
Data_Collected_Date
Region S.N.N.P
Zone WOLAYITA
Thursday, December 12, 2019
Wereda HUMBO
Selected Indictor: Hazards: Change in Crop Damages - Proportion of Total Crop Damage
Extent of Crop Damage (%)
0%
Last_Year_Percentage
19.56
Five_Year_Percentage
32.37
1 - 25 %
32.35
44.64
26 - 50 %
17.81
12.50
51 - 75 %
8.52
6.58
76 - 100 %
21.31
3.46
Extent of Crop Damage Last_Year
35
32
30
25
21
20
20
18
15
10
9
5
0
0%
0%
1 - 25 %
26 - 50 %
51 - 75 %
Extent of Crop Damage
1 - 25 %
26 - 50 %
51 - 75 %
76 - 100 %
76 - 100 %
Extent of Crop Damage Five Years Ago
45
45
40
35
32
30
25
20
15
13
10
7
5
3
0
0%
1 - 25 %
26 - 50 % 51 - 75 %
Extent of Crop Damage
76 - 100 %
0%
1 - 25 %
26 - 50 %
51 - 75 %
76 - 100 %
143
Page 1 of 1
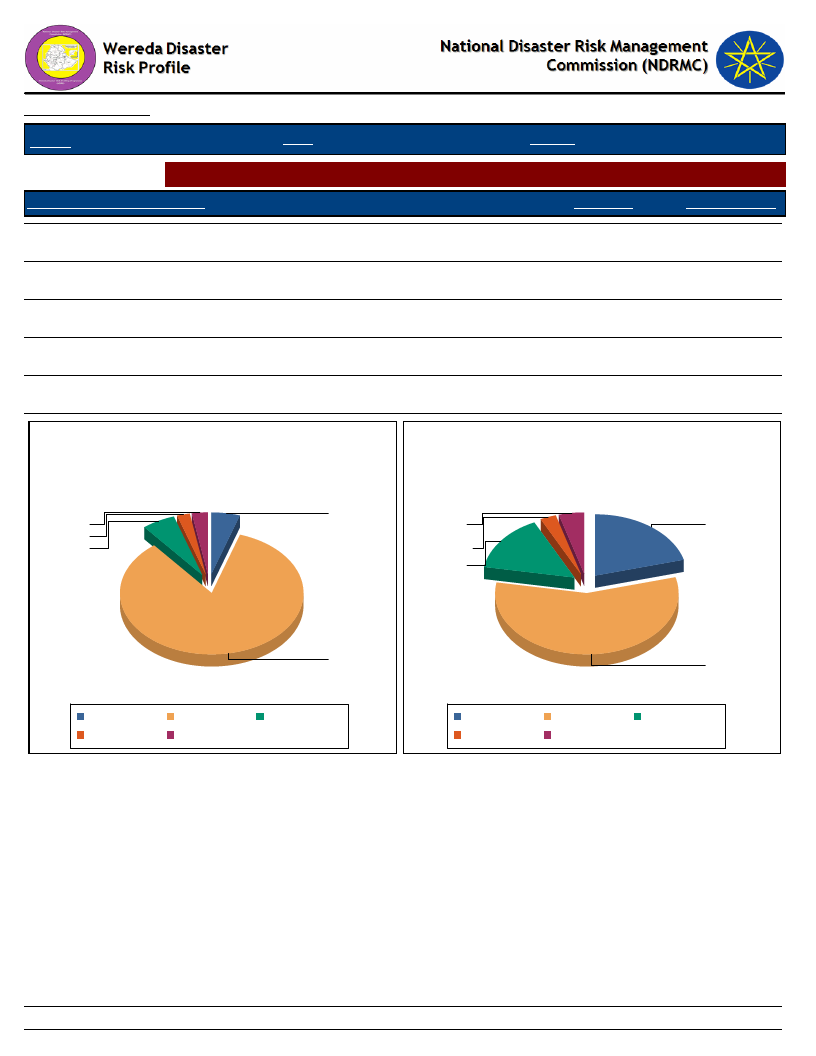
Data_Collected_Date
Thursday, December 12, 2019
Region S.N.N.P
Zone WOLAYITA
Wereda HUMBO
Selected Indictor: Hazards: Change in Crop Damages - Major reasons for crop damage
Major Reason of Crop Damage
Last_Year
Five_Year_Ago
A - Pests, Insects, Weeds
5.07
20.83
B - Drought
84.13
56.83
C - Flood
5.87
15.00
D - Frost/ Cold wave
2.13
3.00
E - Others (specify)
2.80
4.33
Major Reason of Crop Damage -
Last Year
5.1
2.8
2.1
5.9
Major Reason of Crop Damage -
Five Years Ago
E - Others
(specify)
D - Frost/ Cold
wave
C - Flood
A - Pests,
Insects,
Weeds
84.1
A - Pests, Insects,
Weeds
D - Frost/ Cold wave
B - Drought
E - Others (specify)
C - Flood
A - Pests, Insects,
Weeds
D - Frost/ Cold wave
B - Drought
E - Others (specify)
C - Flood
B-
Drought
144
Page 1 of 1
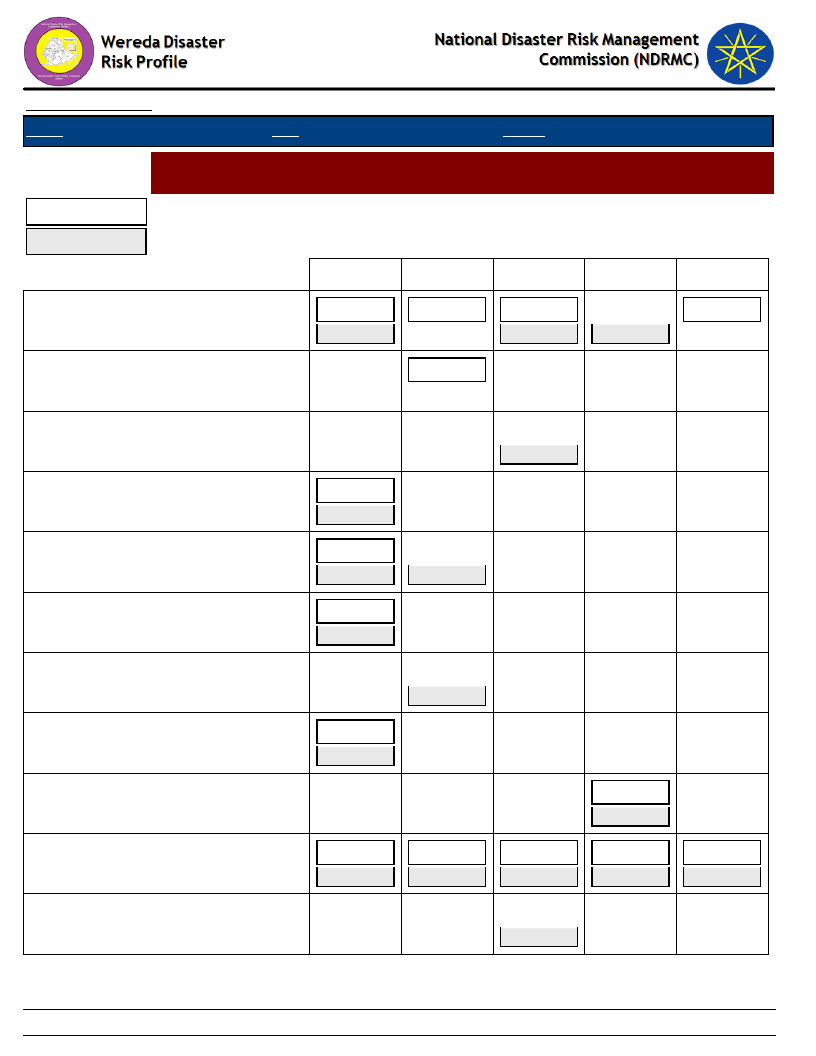
Data_Collected_Date
Region S.N.N.P
Zone WOLAYITA
Thursday, December 12, 2019
Wereda HUMBO
Selected Indictor:
Last Year
Five Years Ago
Hazards: Change in Crop Damages - Proportion of Damage for Major Crops
(percentage response by households)
0%
1-25%
26-50%
51-75%
76-100%
Barley
33.33
57.14
16.67
33.33
28.57
14.29
16.67
Beans
100.00
Chat
Coffee
Enset
Fruits
Hops
Lentils
Linseed
Maize
Millet
100.00
100.00
100.00
60.00
100.00
100.00
100.00
100.00
17.86
28.37
40.00
100.00
31.04
47.66
100.00
21.43
13.50
100.00
100.00
100.00
9.34
7.99
20.05
1.93
145
Page 1 of 3
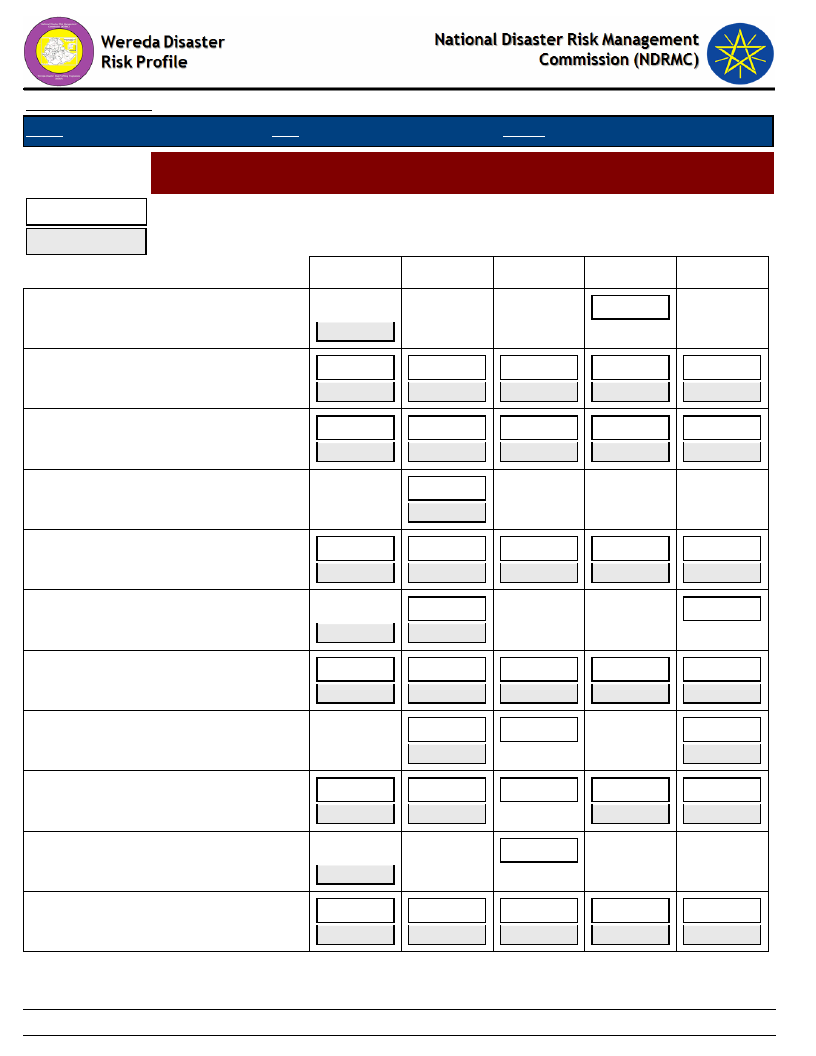
Data_Collected_Date
Region S.N.N.P
Zone WOLAYITA
Thursday, December 12, 2019
Wereda HUMBO
Selected Indictor:
Last Year
Five Years Ago
Hazards: Change in Crop Damages - Proportion of Damage for Major Crops
(percentage response by households)
0%
1-25%
26-50%
51-75%
76-100%
Neug
100.00
100.00
Other cash crop
15.38
22.00
25.00
38.00
32.69
30.00
11.54
8.00
15.38
2.00
Other grain (specify)
15.15
30.00
12.12
40.00
21.21
16.67
12.12
10.00
39.39
3.33
Other oilseed
100.00
100.00
Other pulses
23.66
31.18
13.44
9.14
21.51
37.43
39.18
8.77
8.19
5.85
Peas
12.50
75.00
87.50
12.50
Root & tubers
21.78
45.54
16.83
6.93
8.91
35.19
47.22
10.19
3.70
3.70
Sesame
25.00
25.00
12.50
62.50
75.00
Sorghum
24.24
24.24
6.06
50.00
45.45
3.03
42.42
2.27
2.27
Sunflower
100.00
100.00
Teff
16.30
32.61
10.87
7.61
32.61
32.91
43.04
15.19
2.53
5.06
146
Page 2 of 3
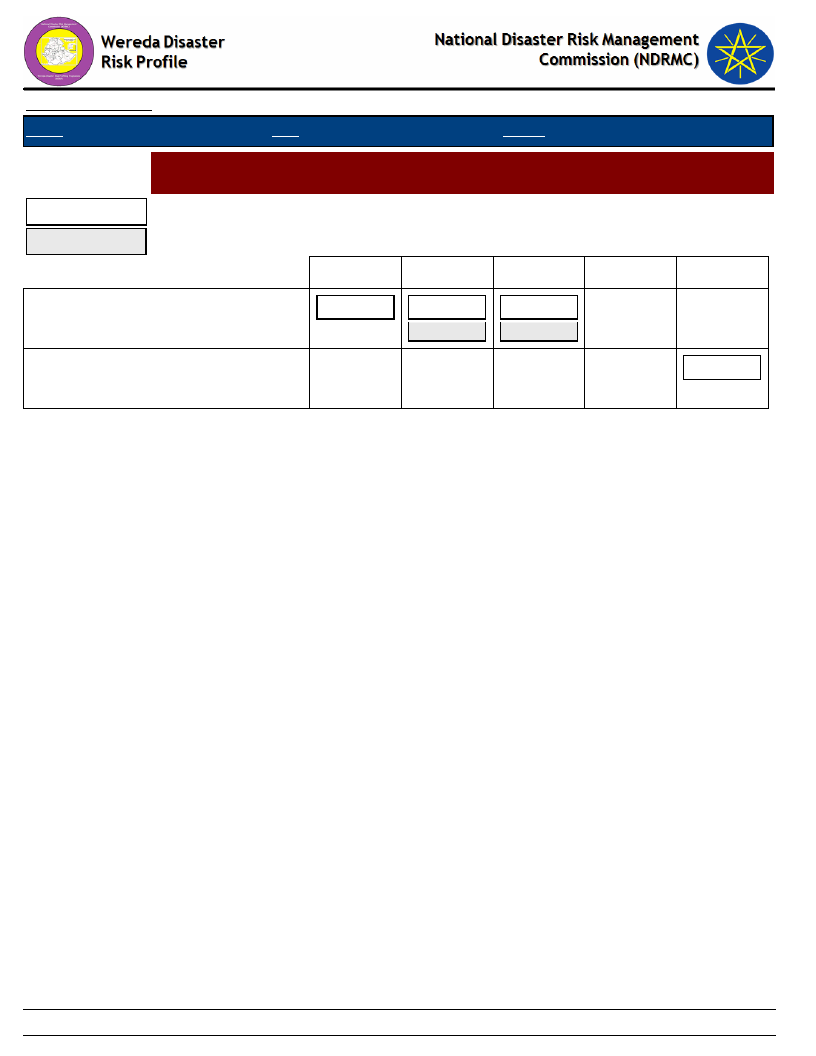
Data_Collected_Date
Region S.N.N.P
Zone WOLAYITA
Thursday, December 12, 2019
Wereda HUMBO
Selected Indictor:
Last Year
Five Years Ago
Hazards: Change in Crop Damages - Proportion of Damage for Major Crops
(percentage response by households)
0%
1-25%
26-50%
51-75%
76-100%
Vegetables
7.14
71.43
21.43
90.91
9.09
Wheat
100.00
147
Page 3 of 3
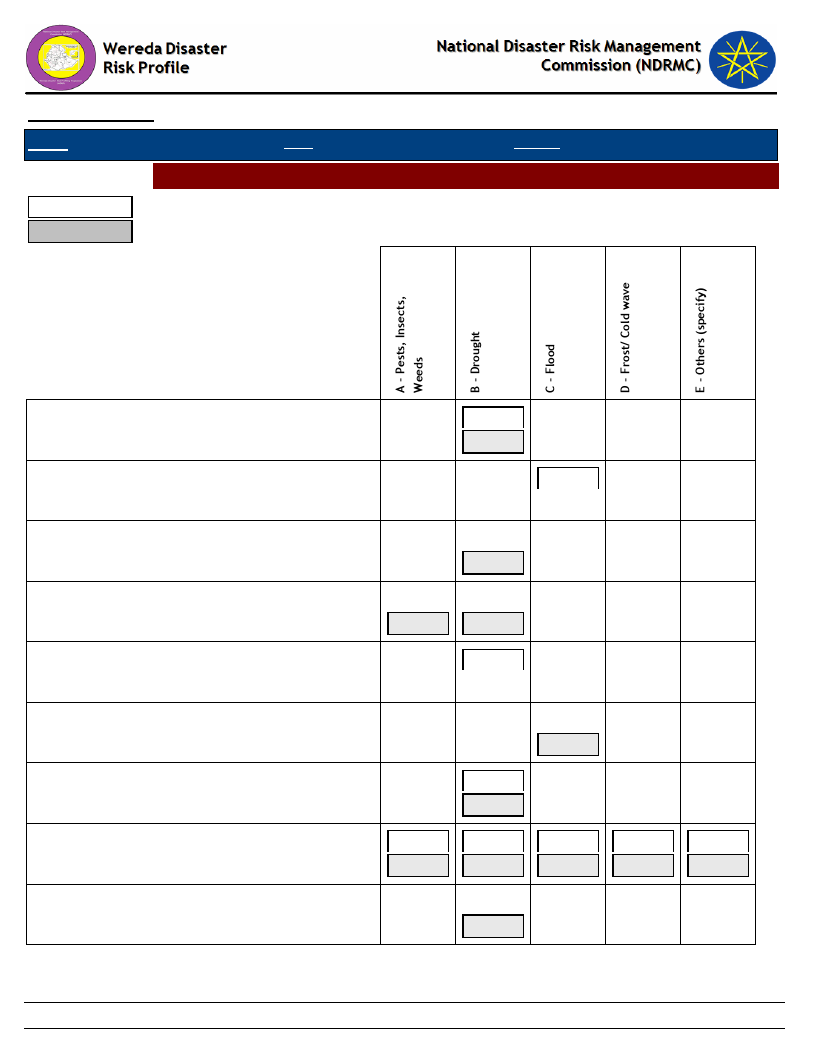
Data_Collected_Date
Region S.N.N.P
Zone WOLAYITA
Thursday, December 12, 2019
Wereda HUMBO
Hazards: Change in Crop Damages - Reasons for Damage of Major Crops
Last Year
Five Years Ago
Barley
Beans
Chat
Enset
Fruits
Hops
Linseed
Maize
Millet
100.00
100.00
100.00
100.00
66.67
33.33
100.00
100.00
100.00
100.00
4.33
86.33
4.67
0.33
4.33
21.65
56.30
13.78
1.97
6.30
100.00
148
Page 1 of 3
Data_Collected_Date
Region S.N.N.P
Zone WOLAYITA
Thursday, December 12, 2019
Wereda HUMBO
Hazards: Change in Crop Damages - Reasons for Damage of Major Crops
Last Year
Five Years Ago
Neug
Other cash crop
Other grain (specify)
Other oilseed
Other pulses
Peas
Root & tubers
Sesame
Sorghum
100.00
4.17
70.83
12.50
12.50
10.00
67.50
12.50
7.50
2.50
6.90
86.21
6.90
15.00
70.00
10.00
5.00
33.33
100.00
66.67
5.52
85.52
4.14
1.38
3.45
24.53
51.89
16.04
1.89
5.66
62.50
83.33
12.50
12.50
16.67
12.50
8.54
80.49
6.10
1.22
3.66
16.67
59.09
19.70
4.55
87.50
33.33
12.50
33.33
33.33
3.85
92.31
3.85
21.74
60.87
8.70
4.35
4.35
149
Page 2 of 3
Data_Collected_Date
Region S.N.N.P
Zone WOLAYITA
Thursday, December 12, 2019
Wereda HUMBO
Hazards: Change in Crop Damages - Reasons for Damage of Major Crops
Last Year
Five Years Ago
Sunflower
Teff
Vegetables
Wheat
100.00
90.79
3.95
5.26
20.75
60.38
15.09
1.89
1.89
38.46
20.00
15.38
30.00
46.15
50.00
100.00
150
Page 3 of 3
Wereda Disaster
Risk Profile
Data_Collected_Date
Region
S.N.N.P
Zone
WOLAYITA
National Disaster Risk Management
Commission (NDRMC)
Thursday, December 12, 2019
Wereda
HUMBO
Selected Indictor:
Kebele Name
ABAYA GUNUCHO
Agricultural Situation: Change in Crops Grown - Five major crops grown by proportion of total cultivated land
Major Crops
Main Season
Present
Cropped Area
Five_Years_Ago
Reason_For_Change
Vegetables
Meher
5
5
No change
Maize
Meher
50
50
No change
Sweet Potato
Tomato
Belg and
5
Meher
Belg
5
30
No change
5
No change
Onion
Belg
30
5
No change
ABELA AJAJA
Neug
Belg
10
10
Pepper
Teff
Belg and
10
5
Meher
Meher
15
5
Maize
Belg
55
65
Cheak pea
Meher
10
10
ABELA GEFETA
Maize
Belg
80
Decrease
High population pressure
Haricot Bean
Teff
Belg and
10
Meher
Meher
10
Decrease
Decrease
High population pressure
High population pressure
ANKA WECHA
Teff
Belg
5
5
No change
Potatoes
Belg
5
5
No change
151
Page 1 of 8
Wereda Disaster
Risk Profile
Data_Collected_Date
Region
S.N.N.P
Zone
WOLAYITA
National Disaster Risk Management
Commission (NDRMC)
Thursday, December 12, 2019
Wereda
HUMBO
Selected Indictor:
Kebele Name
ANKA WECHA
Agricultural Situation: Change in Crops Grown - Five major crops grown by proportion of total cultivated land
Major Crops
Main Season
Present
Cropped Area
Five_Years_Ago
Reason_For_Change
Beans
Belg
20
20
No change
Maize
Belg
70
70
No change
BOSA WANCHE
Maize
Belg
30
30
Other cash crop
Belg and
30
30
Meher
Teff
Meher
20
20
ABAYA CHOKARE
Grass
Maize
Belg and
20
Meher
Belg
70
20
80
Shifted to vegetable and legumes
Vegetable and
Belg
15
fruits
Legume
Meher
10
10
Shifted from maize
5
Shifted from legumes
Sorghum
Belg
5
5
DEMBA KOYISHA
Sweet Potato
Beans
Belg and
5
Meher
Meher
1
Decreased
Decreased
Population growth
Population growth
Haricot Bean
Maize
Belg and
25
Meher
Belg
77
Decreased
Decreased
Population growth
Population growth
152
Page 2 of 8

Wereda Disaster
Risk Profile
Data_Collected_Date
Region
S.N.N.P
Zone
WOLAYITA
National Disaster Risk Management
Commission (NDRMC)
Thursday, December 12, 2019
Wereda
HUMBO
Selected Indictor:
Kebele Name
DEMBA KOYISHA
Agricultural Situation: Change in Crops Grown - Five major crops grown by proportion of total cultivated land
Major Crops
Main Season
Present
Cropped Area
Five_Years_Ago
Reason_For_Change
Peas
Meher
2
Decreased
Population growth
ELA KEBELA
Teff
Meher
20
20
Maize
Belg
65
70
Legume
Peas
Belg and
10
10
Meher
Belg
5
0
HOBICHA DIGISO
Barley
Belg
5
5
No change
Wheat
Meher
5
5
No change
Root & tubers
Maize
Belg and
5
Meher
Belg
65
15
Shifted from maize
55
Shifted from root tubers
GALICHA KARA
Legume
Teff
Belg and
20
Meher
Meher
4
20
No change
4
Remain the same
Potatoes
Haricot Bean
Belg and
8
Meher
Belg
30
8
Remain the same
30
Remain the same
Maize
Belg
52
52
Remain the same
Enset
Belg
6
6
Remain the same
153
Page 3 of 8
Wereda Disaster
Risk Profile
Data_Collected_Date
Region
S.N.N.P
Zone
WOLAYITA
National Disaster Risk Management
Commission (NDRMC)
Thursday, December 12, 2019
Wereda
HUMBO
Selected Indictor:
Kebele Name
GUTUTO LARENA
Agricultural Situation: Change in Crops Grown - Five major crops grown by proportion of total cultivated land
Major Crops
Main Season
Present
Cropped Area
Five_Years_Ago
Reason_For_Change
Sorghum
Belg
4
Decreased
Population growth
Maize
Belg
65
Decreased
Population growth
Haricot Bean
Teff
Belg and
10
Meher
Meher
15
Decreased
Decreased
Population growth
Population growth
HOBICHA BADA
Sweet Potato
Barley
Belg and
6
Meher
Meher
5
Decreased
10
Population growth
Shifted to teff
Legume
Teff
Maize
Belg and
25
Meher
Belg and
10
Meher
All Season
45
20
Shifted from maize land
5
Shifted from barley
55
Shifting to short cycle crop
HOBICHA BONGOTA
Sirasir
Legume
Belg and
15
Meher
Meher
15
10
Shifted from maize
15
Maize
Belg
70
70
Sorghum
Belg
5
5
Teff
Meher
10
10
154
Page 4 of 8

Wereda Disaster
Risk Profile
Data_Collected_Date
Region
S.N.N.P
Zone
WOLAYITA
National Disaster Risk Management
Commission (NDRMC)
Thursday, December 12, 2019
Wereda
HUMBO
Selected Indictor:
Kebele Name
ABELA ZEGRE
Agricultural Situation: Change in Crops Grown - Five major crops grown by proportion of total cultivated land
Major Crops
Main Season
Present
Cropped Area
Five_Years_Ago
Reason_For_Change
Teff
Meher
15
Decreased
Haricot Bean
Maize
Belg and
15
Meher
Belg
70
Decreased
Decreased
High population growth
High population growth
KODO KANKO
Maize
Belg
65
Decrease
Population increase
Haricot Bean
Sweet Potato
Teff
Belg and
15
Meher
Belg and
10
Meher
Meher
10
Decrease
Decrease
Decrease
Population increase
Population increase
Population increase
KOYISHA GOLA
Pepper
Haricot Bean
Maize
Belg and
10
Meher
Belg and
10
Meher
Belg
80
Decreased
Population growth
KOYISHA OGODAMA
Maize
Belg
70
70
No change
Haricot Bean
Belg
20
20
No change
Teff
Meher
5
5
Potatoes
Belg and
5
5
Meher
155
Page 5 of 8
Wereda Disaster
Risk Profile
Data_Collected_Date
Region
S.N.N.P
Zone
WOLAYITA
National Disaster Risk Management
Commission (NDRMC)
Thursday, December 12, 2019
Wereda
HUMBO
Selected Indictor:
Kebele Name
KOYISHA WANGALA
Agricultural Situation: Change in Crops Grown - Five major crops grown by proportion of total cultivated land
Major Crops
Main Season
Present
Cropped Area
Five_Years_Ago
Reason_For_Change
Teff
Meher
5
Decrease
Crop damage
Potatoes
Haricot Bean
Belg and
10
Meher
Belg
10
Decrease
Decrease
Crop damage
Crop damage
Maize
Belg
65
Decrease
Shortage of rainfall
AMBE SHOYA
Enset
Maize
Belg and
10
Meher
Belg
70
Decrease
70
Crop damage
No change
Haricot Bean
Belg
15
15
No change
Teff
Belg
5
5
Potatoes
Belg
10
10
AMPO KOYISHA
Root & tubers
Belg
17
20
Teff
Meher
13
10
Maize
Belg
30
40
Legume
Belg
40
30
Release fertilizer and Minimized cost
SERE TAWURETA
Maize
Belg
75
75
No change
Teff
Belg
10
10
No change
156
Page 6 of 8

Wereda Disaster
Risk Profile
Data_Collected_Date
Region
S.N.N.P
Zone
WOLAYITA
National Disaster Risk Management
Commission (NDRMC)
Thursday, December 12, 2019
Wereda
HUMBO
Selected Indictor:
Kebele Name
SERE TAWURETA
Agricultural Situation: Change in Crops Grown - Five major crops grown by proportion of total cultivated land
Major Crops
Main Season
Present
Cropped Area
Five_Years_Ago
Reason_For_Change
Haricot Bean
Belg
10
10
No change
Potatoes
Belg
5
5
No change
SHOCHORA ABELA
Teff
Belg
10
10
No change
Potatoes
Belg
10
10
No change
Haricot Bean
Belg
20
20
No change
Maize
Belg
60
60
No change
SHOCHORA FESHO
Maize
Belg
60
60
Legume
Belg and
20
20
Meher
Root & tubers
Belg
6
6
Teff
Meher
9
9
SHOCHORA OGODAMA
Pepper
Haricot Bean
Maize
Belg and
60
Meher
Belg and
10
Meher
Belg
80
Decreased
Population growth
SHOCHORA OSE
Maize
Belg
75
Decreased
Population growth
Haricot Bean
Belg and
10
Meher
Decreased
Population growth
157
Page 7 of 8
Wereda Disaster
Risk Profile
Data_Collected_Date
National Disaster Risk Management
Commission (NDRMC)
Thursday, December 12, 2019
Region
S.N.N.P
Zone
WOLAYITA
Wereda
HUMBO
Selected Indictor:
Kebele Name
SHOCHORA OSE
Agricultural Situation: Change in Crops Grown - Five major crops grown by proportion of total cultivated land
Major Crops
Main Season
Present
Cropped Area
Five_Years_Ago
Reason_For_Change
Teff
Meher
15
Decreased
Population growth
158
Page 8 of 8

Data_Collected_Date
Thursday, December 12, 2019
Region S.N.N.P
Zone WOLAYITA
Wereda HUMBO
Selected Indictor:
Agricultural Situation: Access to Extension - Perception of the community on
Access to Agricultural extension Services
KebeleName
Current_Level
Change_In_Last_Decade
Comments
ABAYA GUNUCHO Good
ABELA AJAJA
Good
Increase
Existence of experienced
DAs
ABELA GEFETA
ANKA WECHA
BOSA WANCHE
GALICHA KARA
Good
Good
Good
Good
Increase
Increased
Increased
Increased
There is trained man
power
To increase extension
services
Skilled workers increased
in number.
GUTUTO LARENA
Good
HOBICHA
BONGOTA
HOBICHA BADA
Accessible
Good
ABELA ZEGRE
Good
KOYISHA GOLA
Good
KODO KANKO
KOYISHA
OGODAMA
AMBE SHOYA
Good
Good
Good
Increased
Increased
Increased
Increase
Increased
Increase
Increased
Increased
Increment of
development agents.
Increment of trained
workers.
Increasing of
development agents and
provide strong extension
services.
Improve development
agents and provide
extension
Increasing development
agents in the area
Provide extension
services
Support by government
KOYISHA
WANGALA
AMPO KOYISHA
Good
Good
Increase
Increased
Improved extension
services
159
Page 1 of 2
Data_Collected_Date
Thursday, December 12, 2019
Region S.N.N.P
Zone WOLAYITA
Wereda HUMBO
Selected Indictor:
Agricultural Situation: Access to Extension - Perception of the community on
Access to Agricultural extension Services
KebeleName
SHOCHORA ABELA
Current_Level
Good
DEMBA KOYISHA
Good
SERE TAWURETA
Good
ABAYA CHOKARE
Good access
Change_In_Last_Decade
Increased
Increased
Increased
Increased
Comments
Increase extension
services
Increase development
agents and awareness
creation through
extension works
Increase extension
services
Increment of DA in kebele
ELA KEBELA
Good
Increased
HOBICHA DIGISO
Good
Increased
Supplied by government
SHOCHORA OSE
Good
SHOCHORA
OGODAMA
Good
SHOCHORA FESHO Accessible
Increased
Increased
Increased
Increment of
development agents in
kebele
Increment of
development agents in
kebele
160
Page 2 of 2
Data_Collected_Date
Region S.N.N.P
Zone WOLAYITA
Wereda
Thursday, December 12, 2019
HUMBO
Selected Indicator
Economic Vulnerability: Crops Grown - Types of crops grown by households
Major Crop Type
Maize
Type of Crops Grown
Last Year
39.78
Type of Crops Grown
Five Years Ago
40.51
Other pulses
20.33
19.08
Root & tubers
11.04
12.05
Teff
10.05
8.82
Other cash crop
5.68
Sorghum
3.61
4.91
Other grain (specify)
3.61
3.35
Vegetables
1.53
1.23
Peas
0.87
0.89
Sesame
0.87
0.45
Barley
0.66
0.78
Other oilseed
0.44
0.33
Coffee
0.44
0.33
Enset
0.22
0.56
Fruits
0.22
0.11
Beans
0.11
Wheat
0.11
Lentils
0.11
0.22
Neug
0.11
0.22
Linseed
0.11
0.11
Sunflower
0.11
0.11
Chat
0.11
Hops
0.11
Millet
0.11
161
Page 1 of 2
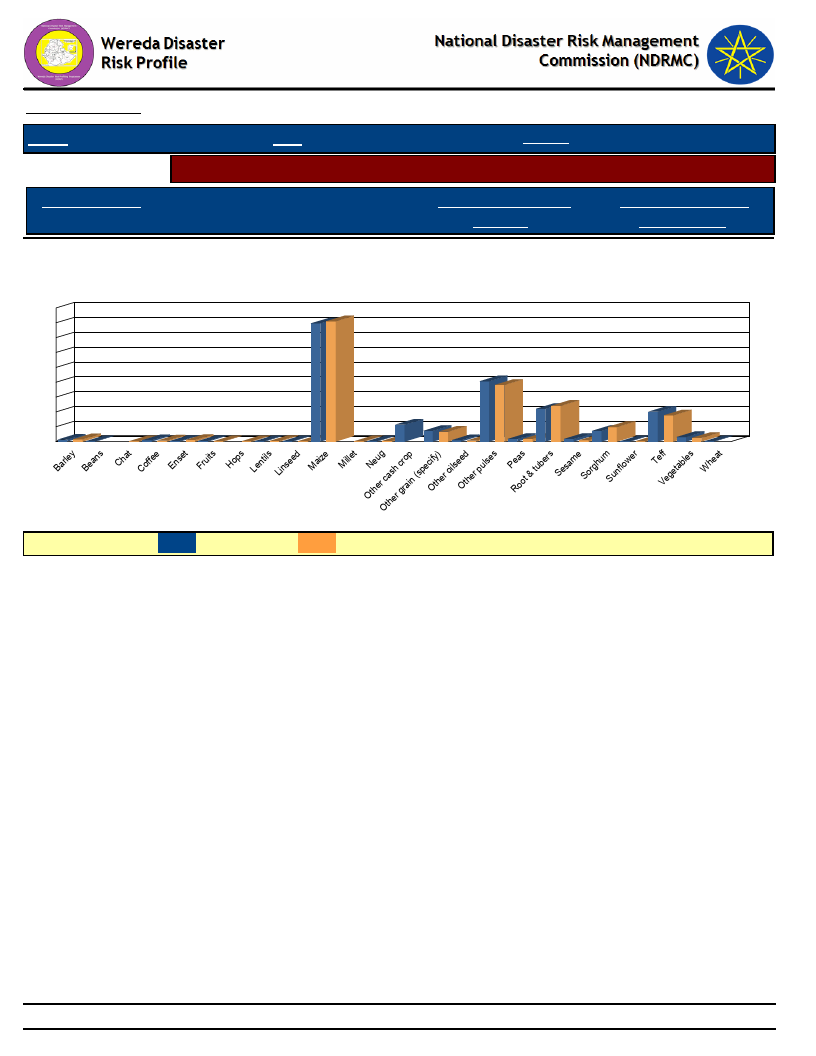
Data_Collected_Date
Region S.N.N.P
Selected Indicator
Major Crop Type
Zone WOLAYITA
Wereda
Thursday, December 12, 2019
HUMBO
Economic Vulnerability: Crops Grown - Types of crops grown by households
Type of Crops Grown
Last Year
Type of Crops Grown
Five Years Ago
Types of Crops Grown - Percent Responses of HHs for Last Year as compared to
Five Years Ago
45
40
35
30
25
20
15
10
5
1 10
0
40 41
00 00 10 0 00 00 0
6
00 0
20 19
43
00
11 12
10 9
11
45
10
00
2 10
LEGEND :
Last year
Five Years Ago
162
Page 2 of 2
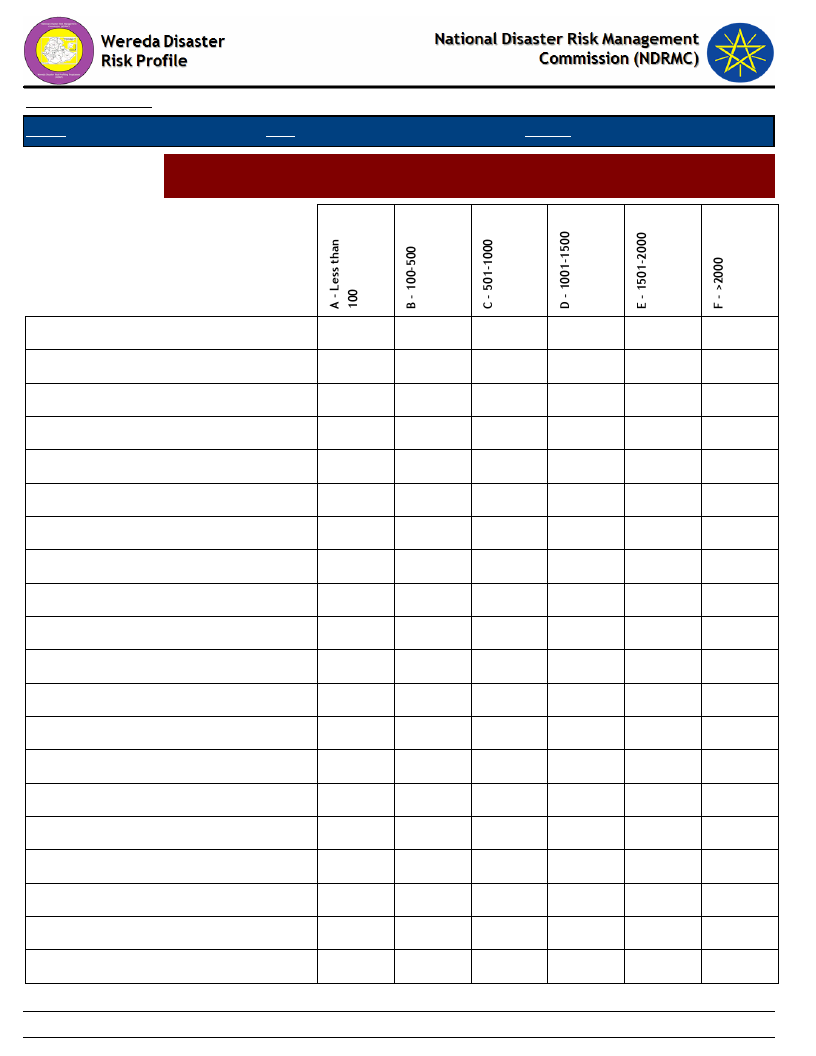
Data_Collected_Date
Region S.N.N.P
Zone WOLAYITA
Thursday, December 12, 2019
Wereda HUMBO
Selected Indictor:
Economic Vulnerability: Crops Grown - Proportion of households by amount of
yield of major crops (last year)
Barley
Beans
Chat
Coffee
Enset
Fruits
Hops
Lentils
Linseed
Maize
Millet
Neug
Other cash crop
Other grain (specify)
Other oilseed
Other pulses
Peas
Root & tubers
Sesame
Sorghum
66.67
33.33
100.00
50.00
50.00
50.00
50.00
50.00
50.00
100.00
100.00
35.44
40.93
13.74
2.47
3.85
3.57
100.00
65.38
23.08
7.69
75.76
15.15
3.03
25.00
75.00
59.68
36.02
3.76
25.00
75.00
15.84
56.44
19.80
3.96
100.00
63.64
33.33
3.03
163
1.92
1.92
6.06
0.54
2.97
0.99
Page 1 of 2
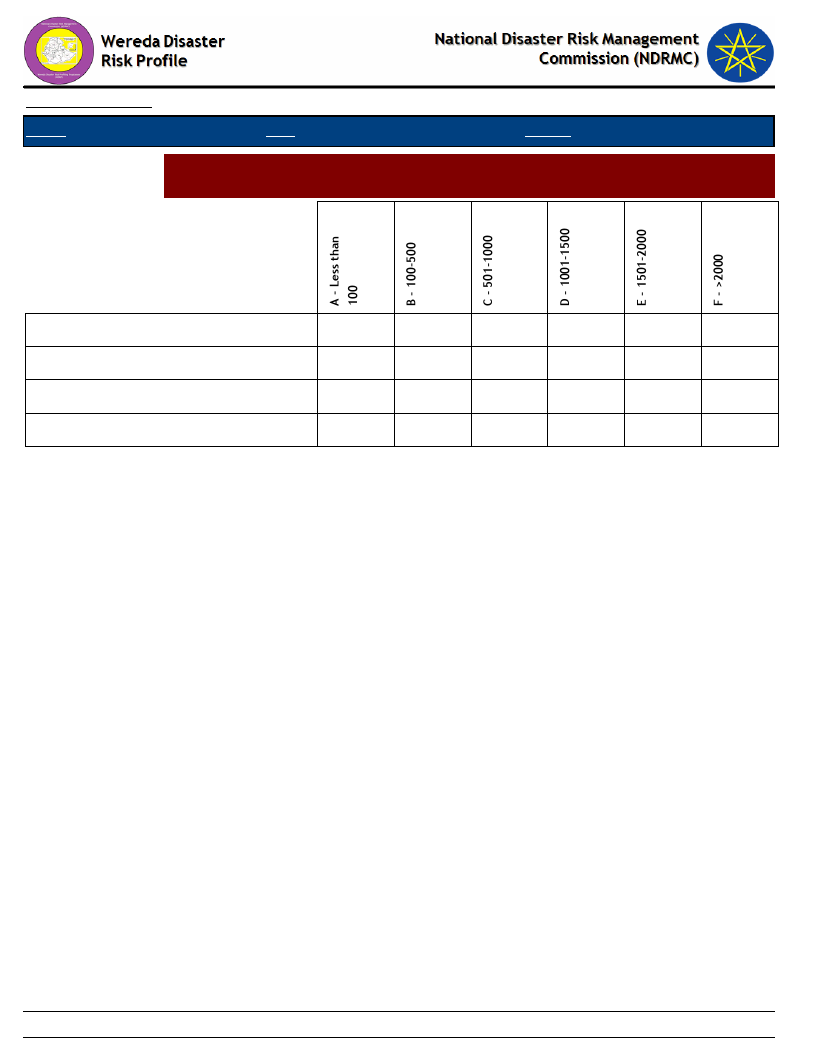
Data_Collected_Date
Region S.N.N.P
Zone WOLAYITA
Thursday, December 12, 2019
Wereda HUMBO
Selected Indictor:
Economic Vulnerability: Crops Grown - Proportion of households by amount of
yield of major crops (last year)
Sunflower
Teff
Vegetables
Wheat
100.00
60.87
35.87
3.26
14.29
7.14
28.57
7.14
21.43
21.43
100.00
164
Page 2 of 2
Data_Collected_Date
Region S.N.N.P
Zone WOLAYITA
Thursday, December 12, 2019
Wereda HUMBO
Selected Indictor:
Economic Vulnerability: Crops Grown - Proportion of households by amount of
yield of major crops (Five Years Ago)
Types of Major Crops
Category of Yield used to be obtained five years ago
Barley
Beans
Chat
Coffee
Enset
Fruits
Hops
Lentils
Linseed
Maize
Millet
Neug
Other cash crop
Other grain (specify)
Other oilseed
Other pulses
85.71
14.29
100.00
100.00
80.00
20.00
100.00
100.00
50.00
50.00
100.00
20.94
47.38
15.70
6.06
100.00
50.00
50.00
54.00
34.00
8.00
33.33
53.33
3.33
100.00
47.95
46.78
165
4.68
4.13
3.33
5.79
4.00
6.67
0.58
Page 1 of 2
Data_Collected_Date
Region S.N.N.P
Zone WOLAYITA
Thursday, December 12, 2019
Wereda HUMBO
Selected Indictor:
Economic Vulnerability: Crops Grown - Proportion of households by amount of
yield of major crops (Five Years Ago)
Types of Major Crops
Category of Yield used to be obtained five years ago
Peas
Root & tubers
Sesame
Sorghum
Sunflower
Teff
Vegetables
Wheat
37.50
62.50
15.74
55.56
23.15
4.63
100.00
31.82
63.64
4.55
100.00
41.77
50.63
6.33
9.09
45.45
18.18
0.93
1.27
27.27
166
Page 2 of 2
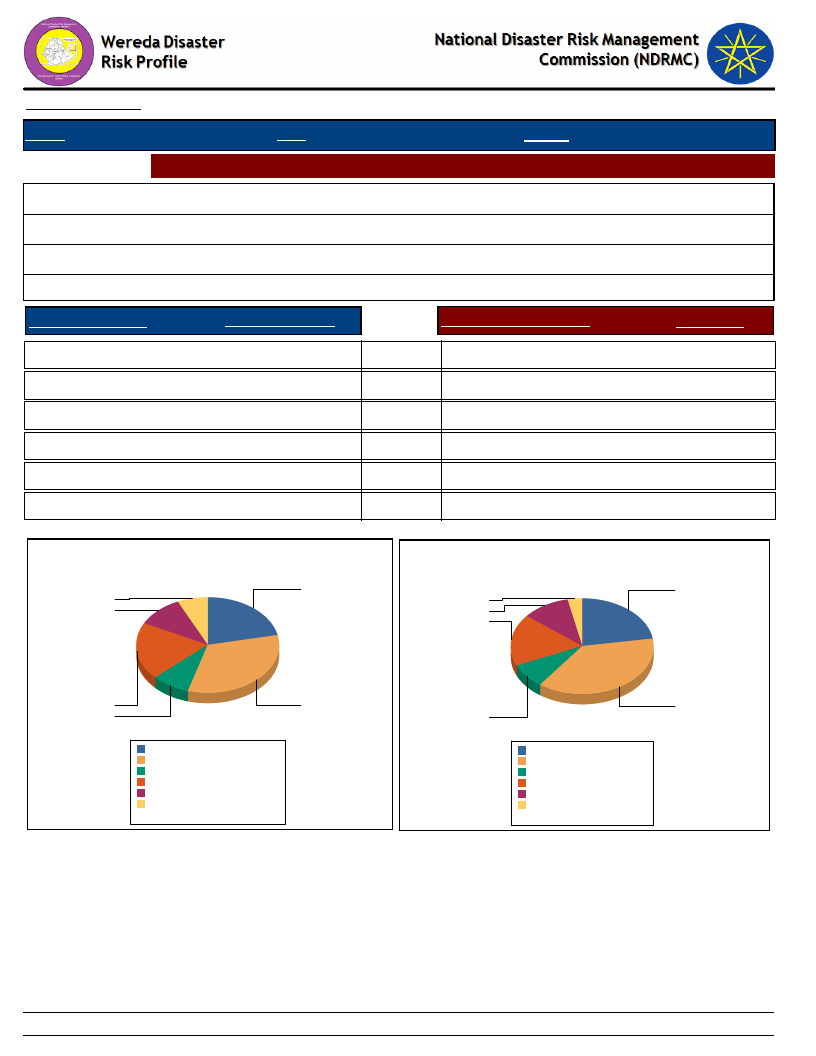
Data_Collected_Date
Thursday, December 12, 2019
Region S.N.N.P
Zone WOLAYITA
Wereda HUMBO
Selected Indictor: Economic Vulnerability: Land Ownership and Quality - Landownership of HHs
Households owning land (%)
Average landholding (in Hectares)s
Households cultivating land in last 12 months (%)
Average quantity of land cultivated (in hectares)
97.64
2.39
96.78
1.43
Range Land Holding
Percent_Response
Range of Cultivated Land
% Response
A - Less than 0.25 ha
22.0
B - 0.25 - 0.50 ha
33.0
C - 0.5 - 0.75 ha
9.0
D - 0.75 - 1 ha
20.0
E - 1 - 2 ha
10.0
F - More than 2 ha
7.0
IMPORTANT: ha = Hectars
Household Responses to Range Land Holding
A - Less than 0.25 ha
21.0
B - 0.25 - 0.50 ha
35.0
C - 0.5 - 0.75 ha
8.0
D - 0.75 - 1 ha
17.0
E - 1 - 2 ha
10.0
F - More than 2 ha
3.0
Household Responses to Range Cultivated Land
21.7
21.4
7.0
3.2
10.5
10.2
16.6
19.6
8.6
32.7
A - Less than 0.25 ha
B - 0.25 - 0.50 ha
C - 0.5 - 0.75 ha
D - 0.75 - 1 ha
E - 1 - 2 ha
F - More than 2 ha
21.7%
32.7%
8.6%
19.6%
10.5%
7.0%
Total:
100.0%
35.4
8.0
A - Less than 0.25 ha 21.4
B - 0.25 - 0.50 ha
35.4
C - 0.5 - 0.75 ha
8.0
D - 0.75 - 1 ha
16.6
E - 1 - 2 ha
10.2
F - More than 2 ha
3.2
Total:
94.9
167
Page 1 of 1
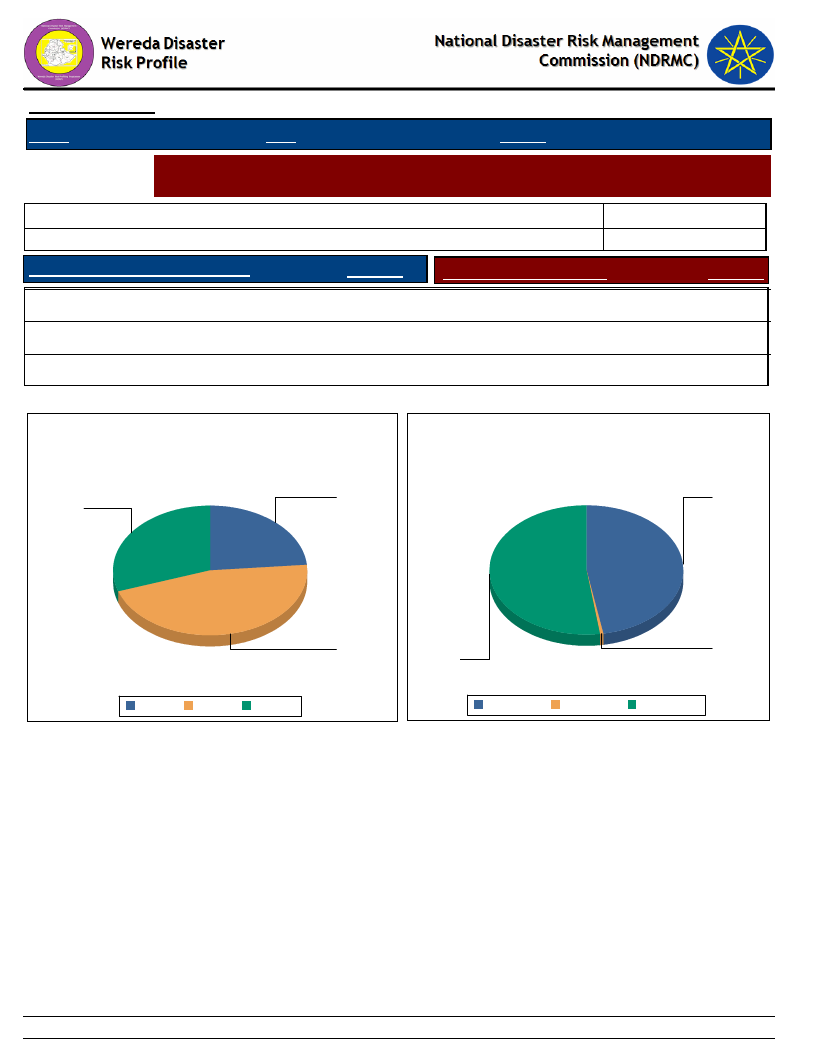
Data_Collected_Date
Thursday, December 12, 2019
Region S.N.N.P
Zone WOLAYITA
Wereda HUMBO
Selected Indictor:
Economic Vulnerability: Land Ownership and Quality - Farmers’ perception on the
quality of their agricultural land
Cropping_Intensity *
Households with enough land for farming
HHs with favourable location of farm
Response
Households with fertile soil
9.99
23.47
Response
Yes
30.21
Highly fertile
0.79
Partially
46.26
Fertile
47.09
No
23.53
Not fertile
52.12
* Cropping Intensity = (Gross Cropped Area / Net Cropped Area )x 100%
Household responses to the type of farm
location
Household responses tp the type of soil
fertility
24
47
30
46
No
Partially Yes
Gross Cropped Area = Irrigated Area + Unirrigated
Area
1
52
Fertile
Highly fertile Not fertile
Net Cropped Area = Total Cultivated Area in last
12 months
168
Page 1 of 1

Data_Collected_Date
Thursday, December 12, 2019
Region S.N.N.P
Selected Indictor:
KebeleName
ABAYA GUNUCHO
ABELA AJAJA
ABELA GEFETA
ANKA WECHA
BOSA WANCHE
GALICHA KARA
GUTUTO LARENA
HOBICHA
BONGOTA
HOBICHA BADA
ABELA ZEGRE
KOYISHA GOLA
KODO KANKO
KOYISHA
OGODAMA
AMBE SHOYA
KOYISHA
WANGALA
AMPO KOYISHA
SHOCHORA ABELA
DEMBA KOYISHA
SERE TAWURETA
ABAYA CHOKARE
ELA KEBELA
HOBICHA DIGISO
SHOCHORA OSE
Zone WOLAYITA
Wereda HUMBO
Agricultural Situation: Access to Inputs - Perception of the community on access
to improved agricultural inputs
Current_Level
Change_In_Last_Decade
Comments
Good
Good
Good
Good
Good
Good
Good
Accessible
Increase
Increase
Increased
Increased
Increased
Increased
Increased
Provided by government
Provided by the
government
Provided by the
government
Supplied by government.
Provided by government.
Good
Good
Good
Good
Good
Increased
Increase
Increased
Increase
Increased
Supplied by government.
Provided by government
aid by government
Provided by government
Aid by government
Good
Good
Increased
Increase
Aid by government
Provided by government
Good
Good
Good
Good
Good
Good
Good
Good
Increased
Increased
Increased
Increased
Increased
Increased
Increased
Increased
Government aid
Ggovernment aid
Government aid
It is provided by
government
Provided by government
Provided by government
169
Page 1 of 2
Data_Collected_Date
Thursday, December 12, 2019
Region S.N.N.P
Selected Indictor:
KebeleName
SHOCHORA
OGODAMA
SHOCHORA
FESHO
Zone WOLAYITA
Wereda HUMBO
Agricultural Situation: Access to Inputs - Perception of the community on access
to improved agricultural inputs
Current_Level
Good
Change_In_Last_Decade
Increased
Comments
Provided by government
Accessible
Increased
170
Page 2 of 2

Data_Collected_Date
Region S.N.N.P
Zone WOLAYITA
Thursday, December 12, 2019
Wereda HUMBO
Selected Indictor:
KebeleName
Agricultural Situation: Water for irrigation - Access to water for irrigation in the
community
Current_Level
Change_In_Last_Decade
Comments
ABAYA GUNUCHO
Decrease
ABELA AJAJA
ABELA GEFETA
ANKA WECHA
BOSA WANCHE
Medium
No
Poor
Medium
GALICHA KARA
GUTUTO LARENA
HOBICHA BONGOTA
HOBICHA BADA
ABELA ZEGRE
KOYISHA GOLA
KODO KANKO
KOYISHA OGODAMA
AMBE SHOYA
KOYISHA WANGALA
AMPO KOYISHA
SHOCHORA ABELA
DEMBA KOYISHA
SERE TAWURETA
ABAYA CHOKARE
ELA KEBELA
HOBICHA DIGISO
SHOCHORA OSE
SHOCHORA
OGODAMA
No
No
No access
Low
No
No
No
No
Weak
No
Good
No
Low
Weak
Irrigation access
Medium
No access
No
No
Decrease
Increased
No
Decreased
Increased
No
Remain the same
No
No
Decrease
No
Decreased
No
Increased
No
No
Weak
Minimized
Decreased
Remain the same
No
No
Unavailability of modern
irrigation system
Poor water access
To save the water banking
Improvement water harvesting
technology.
No water point.
Lack of stream river
No
Use bilate river
171
Page 1 of 2

Data_Collected_Date
Region S.N.N.P
Zone WOLAYITA
Thursday, December 12, 2019
Wereda HUMBO
Selected Indictor:
Agricultural Situation: Water for irrigation - Access to water for irrigation in the
community
KebeleName
Current_Level
Change_In_Last_Decade
Comments
SHOCHORA FESHO
No access to water
The same
172
Page 2 of 2
Data_Collected_Date
Thursday, December 12, 2019
Region S.N.N.P
Selected Indictor:
Kebele Name
Zone WOLAYITA
Wereda HUMBO
Agricultural Situation: Soil Fertility - Perception of the community on soil fertility
and its change over time
Current_Level
Change_In_Last_Decade
Comments
ABAYA GUNUCHO
Decrease
Decrease
Land degradation
ABELA AJAJA
Good
ABELA GEFETA
Low
Decrease
Soil erosion
ANKA WECHA
Poor
Decreased
Afforestation
BOSA WANCHE
GALICHA KARA
Medium
Decreased
Decrease
Because of increased soil
erosion.
GUTUTO LARENA
Low
HOBICHA
BONGOTA
HOBICHA BADA
Medium
Medium
ABELA ZEGRE
Low
KOYISHA GOLA
Low
KODO KANKO
Low
KOYISHA
OGODAMA
AMBE SHOYA
Decreased
Decreased
Decreased
Decreased
Declined
Decrease
Decreased
Decrease
Decreased
Decreased
Erosion, Poor utilization of
fertilizer.
Soil erosion and
deforestation
Leaching of top soil by
erosion.
Erosion, poor utilization of
fertilizer
Erosion, Poor utilization of
fertilizers
Erosion poor utilization of
fertilizer
By soil erosion
Loss of production
KOYISHA
WANGALA
AMPO KOYISHA
Decrease
Medium
Decrease
Decreased
SHOCHORA ABELA Decreased
Decreased
By soil erosion
DEMBA KOYISHA
Low
Decreased
Erosion, poor utilization of
fertilizers
173
Page 1 of 2
Data_Collected_Date
Thursday, December 12, 2019
Region S.N.N.P
Selected Indictor:
Kebele Name
Zone WOLAYITA
Wereda HUMBO
Agricultural Situation: Soil Fertility - Perception of the community on soil fertility
and its change over time
Current_Level
Change_In_Last_Decade
Comments
SERE TAWURETA
Decreased
Decreased
ABAYA CHOKARE
Fertile
Minimized
Deforestation
ELA KEBELA
Medium
Decreased
HOBICHA DIGISO
Medium
Decreased
Because of soil erosion
SHOCHORA OSE
Low
SHOCHORA
OGODAMA
SHOCHORA FESHO
Low
Not fertile
Decreased
Decreased
Increased
Erosion, Poor utilization of
fertilizer
Poor utilization of
fertilizers
174
Page 2 of 2
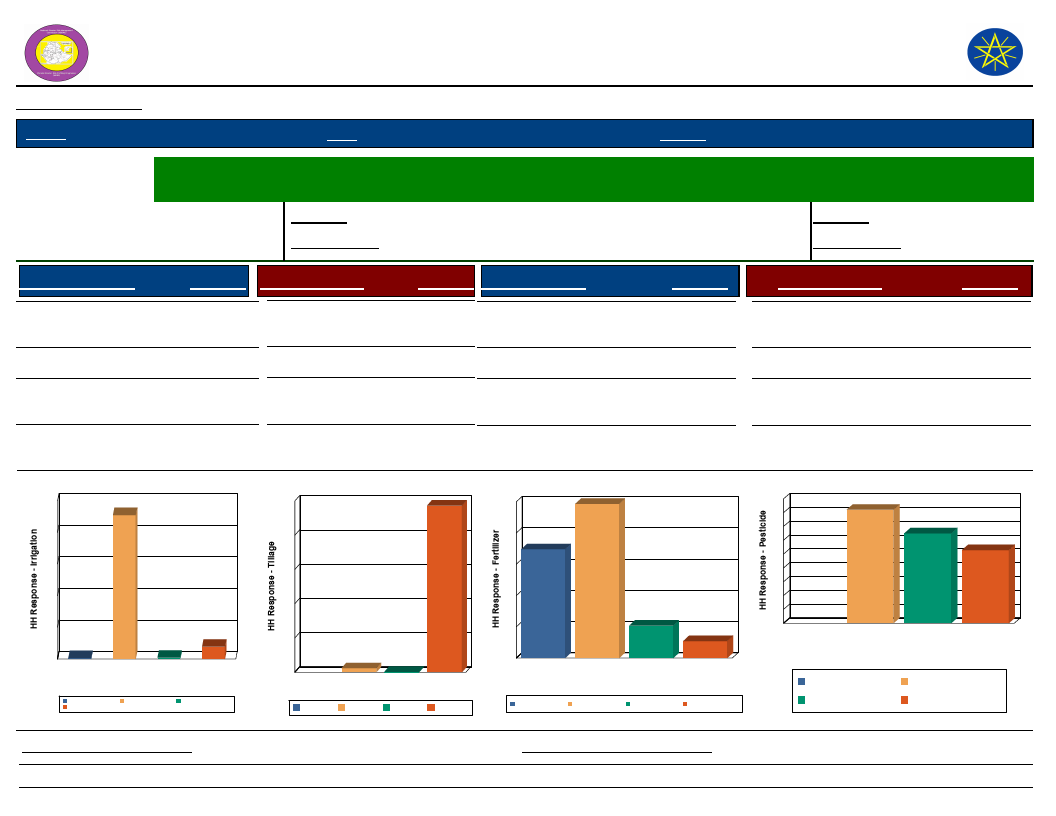
Wereda Disaster
Risk Profile
Data_Collected_Date
Region S.N.N.P
Zone WOLAYITA
National Disaster Risk Management
Commission (NDRMC)
Thursday, December 12, 2019
Wereda HUMBO
Selected Indictor:
Economic Vulnerability: Status of Agriculture - Methods of tillage, Irrigation and other agricultural input utilization
by households
Percentage of
Irrigated Area
Last Year
Five Years Ago
Percentage of households
with irrigated area
Last Year
Five Years Ago
0.66
31.32
Source of Irrigation
Response Method of Tillage
Response Type of Fertilizer
Response
Type of Pesticide
Response
River/Lake/Pond
Birkas (tanks)
7.71 Oxen
0.53 Manual
97.34 Chemical
2.39 Natural/Animal manure
49.32
10.41
Chemicals (insecticides,
fungicide, etc)
Natural methods
41.05
32.51
Other (specify)
0.80 None
No Irrigation
(Rain-fed)
90.96
Source of Irrigation
100
100
91
80
80
60
60
40
40
20
8
20
1
1
0
Birkas (tanks)
Other (specify)
No Irrigation (Rain-fed)
River/Lake/Pond
0
Source of Irrigation
Birkas (tanks)
River/Lake/Pond
No Irrigation (Rain-fed)
Other (specify)
0.27 Both Chemical and
Natural
None
34.79
5.48
Method of Tillage
97
2
0
Manual
None
Method of Tillage
Manual None
Oxen
Oxen
Type of Fertilizer
50
49
40
35
30
20
10
10
5
0
Both
Chemical and
Natural
Chemical Natural/Animal
manure
Type of Fertilizer
Both Chemical and
Natural
Chemical
Natural/Animal manure
None
None
None
26.45
Type of Pesticide
45
41
40
35
33
30
26
25
20
15
10
5
0
Chemicals
Natural
None
(insecticides,
methods
fungicide, etc)
Type of Pesticide
Natural methods
Chemicals (insecticides,
fungicide, etc)
None
Proportion_Improved_Seeds
90.20
Proportion_Agriculture_Service
175
91.84
Page 1 of 1
Data_Collected_Date
Region S.N.N.P
Zone WOLAYITA
Thursday, December 12, 2019
Wereda HUMBO
Selected Indictor:
Economic Vulnerability: Change in Agricultural Situation - Households perception
on changes of crop type, size of cultivated area and crop yields
Proportion of households reporting change in crops grown
Adequate fertilizer
48.66
%
1st
2nd
3rd
6.63
14.17
Adequate irrigation available
2.21
0.79
Adequate rainfall
13.81
2.36
1.61
Insufficient fertilizer
2.21
35.43
Insufficient irrigation available
2.76
Less rainfall
47.51
3.15
More drought resistant crop
2.21
8.66
More Market Availability
5.52
5.51
More pest resistant crop
1.66
More yielding crop
13.26
21.26
25.81
Proportion of households reporting change in size of area cultivated
28.46 %
Addition of area
1st
2nd
3rd
9.35
Adequate fertilizer
1.87
16.00
Adequate irrigation available
0.93
2.67
Adequate rainfall
14.95
11.43
Insufficient fertilizer
0.93
16.00
Insufficient irrigation available
4.67
1.33
176
Page 1 of 2
Data_Collected_Date
Region S.N.N.P
Zone WOLAYITA
Thursday, December 12, 2019
Wereda HUMBO
Selected Indictor:
Economic Vulnerability: Change in Agricultural Situation - Households perception
on changes of crop type, size of cultivated area and crop yields
1st
2nd
3rd
Insufficient rainfall
15.89
Landslides
15.89
17.33
Loss of area
22.67
More yielding crop
1.87
10.67
Other
1.87
Salinity problem
1.87
Water logging
4.00
Proportion of households reporting change in crop yield
Adequate fertilizer
Adequate irrigation available
Adequate rainfall
Better yielding crop
Improved variety of seeds
Insufficient fertilizer
Insufficient irrigation available
Insufficient rainfall
Other
90.69
%
1st
2nd
3rd
17.89
33.86
2.05
0.39
22.29
4.33
4.82
3.52
23.23
17.60
16.14
50.00
0.88
16.93
1.20
1.17
33.43
0.60
1.17
0.79
177
Page 2 of 2
Data_Collected_Date
Region S.N.N.P
Zone WOLAYITA
Thursday, December 12, 2019
Wereda HUMBO
Selected Indicator
Economic Vulnerability: Crops Grown - Number of crops grown by households
Number of Crops Grown
Crops Grown Last Year
Crops Grown Five Years Ago
One type
3.54
4.73
Two types
38.80
39.56
Three types
39.87
37.91
Four types
12.43
12.31
Five types
5.36
5.49
Avg Crops Grown Last Year
Avg Crops Grown Five Years Ago
2.44
2.38
Number of Crops Grown Last Year
40
40
39
35
30
25
20
15
12
10
5
5
4
0
Five types
Four types One type Three types
Number of Crops Grown
Two types
Five types
Two types
Four types
One type
Three types
Number of Crops Grown five years ago
40
40
38
35
30
25
20
15
12
10
5
5
5
0
Five types
Four types One type Three types Two types
Number of Crops Grown
Five types
Two types
Four types
One type
Three types
178
Page 1 of 1
WDRP Indicators
Livestock Production Characteristics
179
Data_Collected_Date
Thursday, December 12, 2019
Region S.N.N.P
Zone WOLAYITA
Wereda HUMBO
Selected Indictor:
Kebele Name
ABAYA GUNUCHO
ABELA AJAJA
Agricultural Situation: Status of Livestock Disease - Change in Livestock Disease
Status
Current_Level
Change_Over_Last_Decade
Comment
Good
High
Decreased
Improved vaccination and
treatment
ABELA GEFETA
ANKA WECHA
Trypanosomiasis, FMD,
Anthrax
Good
BOSA WANCHE
High
GALICHA KARA
Good
GUTUTO LARENA
HOBICHA
BONGOTA
HOBICHA BADA
Trypanosomiasis, Foot
mouth
Gendi, Ihera
High
ABELA ZEGRE
KOYISHA GOLA
KODO KANKO
KOYISHA
OGODAMA
AMBE SHOYA
Trypanosomiasis, Foot
and mouth disease,
Anthrax
Trypanosomiasis, foot
and mouth disease,
Anthrax
Foot mouth disease,
thrypanosomisis
Good
Foot and mouth disease
KOYISHA WANGALA Good
Decrease
Increased
Increased
Increased
Increased
Increased
Increased
Decrease
Decreased
Decrease
Decreased
Increased
Decrease
Vaccination and treatment
By using vaccination and
treatment
Long dry season and
breeding of tsetse fly.
Vaccination has been
improving
Medical treatment.
Tsetse fly biting, shortage
of fodder and water.
Vaccination
Vaccination
Vaccination treatment
Vaccination
Shortage of water and
grass
vaccination improvement
AMPO KOYISHA
Medium
Decreased
SHOCHORA ABELA
Good
Decreased
Vaccination
DEMBA KOYISHA
Increased
Decreased
180
Vaccination
Page 1 of 2
Data_Collected_Date
Thursday, December 12, 2019
Region S.N.N.P
Zone WOLAYITA
Wereda HUMBO
Selected Indictor:
Kebele Name
SERE TAWURETA
Agricultural Situation: Status of Livestock Disease - Change in Livestock Disease
Status
Current_Level
Change_Over_Last_Decade
Comment
Good
Increased
Vaccination
ABAYA CHOKARE
ELA KEBELA
Trypanosomiasis
High
Increased
Increased
Chemical spray work is
become minimized
HOBICHA DIGISO
SHOCHORA OSE
High
Trypanosomiasis
Increased
Decreased
Because of secondary
hazard occurrence
Vaccination increase
SHOCHORA
OGODAMA
SHOCHORA FESHO
Trypanosomiasis, Foot
and mouth disease,
Anthrax
Medium
Decreased
Decreased
Vaccination increase
181
Page 2 of 2
Data_Collected_Date
Thursday, December 12, 2019
Region S.N.N.P
Zone WOLAYITA
Wereda HUMBO
Selected Indictor: Livestock Diseases Prevalece
Type of livestock diseases affected households in the last five years (households reporting in %)
1st
2nd
3rd
African horse disease
1.05
1.76
0.74
Anthrax affecting cattle
6.32
31.09
18.82
Black leg
1.58
10.56
24.35
CBPP
4.74
Contagious Caprine PLeuropneumonia (CCPP)
0.79
2.58
DK
0.53
Faciolosis
0.26
0.37
Foot and mouth disease
9.21
39.59
22.51
Heart water
0.26
0.37
Internal & External Parasites (Tick, mange, helminthiasis, fasci
0.59
1.48
Liverfluke (Sheep and cattle)
1.47
1.85
Lumpy Skin Disease (LSD)
0.29
Lymphangitis
1.48
Newcasle disease (Chicken)
2.35
14.39
Pasteurellosis
0.74
Sheep pox
4.11
3.69
Trypanosomiasis
75.26
8.21
6.64
182
Page 1 of 1
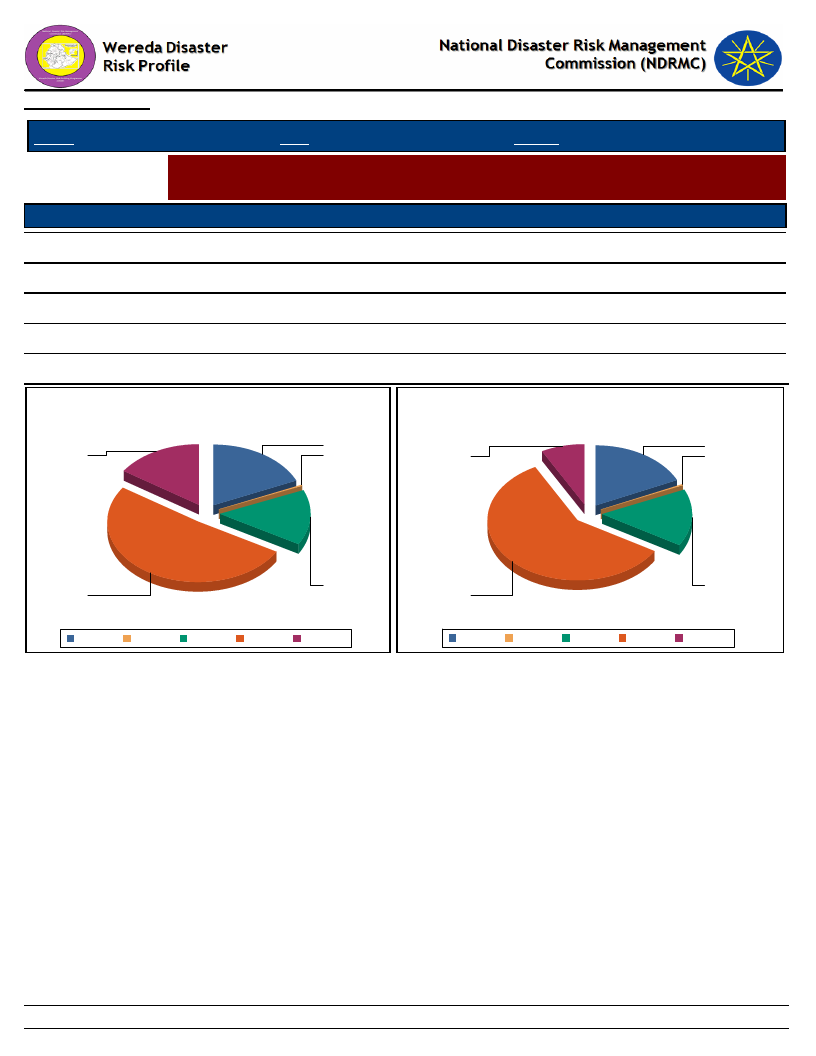
Data_Collected_Date
Thursday, December 12, 2019
Region S.N.N.P
Selected Indictor:
Level of Access
Excellent
Good
Adequate
Poor
Very poor
Zone WOLAYITA
Wereda HUMBO
Evaluation of Access to Veternary Services and Livestock Drugs
Households’ evaluation on access to drugs and veterinary services
Veternary Service
Livestock_Drugs
0.27
0.27
14.75
15.32
18.23
18.01
51.21
58.60
15.55
7.80
Level of Access to Veternary Services
Access Level of Livestock Drugs
18
18
16
0
8
0
15
51
Adequate Excellent
Good
Poor
Very poor
15
59
Adequate Excellent
Good
Poor
Very poor
183
Page 1 of 1
Data_Collected_Date
Thursday, December 12, 2019
Region S.N.N.P
Selected Indictor:
Zone WOLAYITA
Wereda HUMBO
Agricultural Situation: Water Availability for Livestock - Water availability for
livestock in the community
KebeleName
Current_Level
Change_In_Last_Decade
Comments
ABAYA GUNUCHO
ABELA AJAJA
ABELA GEFETA
ANKA WECHA
Decrease
Medium
Similar
Poor
BOSA WANCHE
Low
GALICHA KARA
GUTUTO LARENA
No
No enough water
HOBICHA
BONGOTA
HOBICHA BADA
No access
Low
ABELA ZEGRE
KOYISHA GOLA
KODO KANKO
KOYISHA
OGODAMA
AMBE SHOYA
KOYISHA
WANGALA
AMPO KOYISHA
SHOCHORA ABELA
DEMBA KOYISHA
The same
Remain the same
No
No
Weak
No
Good
No
Low
SERE TAWURETA
ABAYA CHOKARE
Decreased
Not good
Decrease
Decreased
Similar
Decreased
Increased
Decreased
Similar
Remain the same
Similar
Remain the same
Decrease
No
Decreased
No
Decreased
No
Decreased
Decreased
Similar
Lack of rain
No water supply
To improve awareness
about use of water system
Due to local pond
construction in addition to
river.
The river is far from some
areas.
No permanent water
supply.
Vaccination
Shortage of rivers water
No
Purchasing of additional
animals
There is only hot spring
184
Page 1 of 2
Data_Collected_Date
Thursday, December 12, 2019
Region S.N.N.P
Selected Indictor:
Zone WOLAYITA
Wereda HUMBO
Agricultural Situation: Water Availability for Livestock - Water availability for
livestock in the community
KebeleName
Current_Level
Change_In_Last_Decade
Comments
ELA KEBELA
HOBICHA DIGISO
SHOCHORA OSE
SHOCHORA
OGODAMA
SHOCHORA FESHO
Medium
Medium
Similar
Similar
Medium access
Decreased
Increased
Similar
Similar
Decreased
Pond water
185
Page 2 of 2

Data_Collected_Date
Thursday, December 12, 2019
Region S.N.N.P
Zone WOLAYITA
Wereda HUMBO
Selected Indictor:
Agricultural Situation: Livestock Diversity - Type of livestock and their economic
importance in the community
Kebele Name
ABAYA CHOKARE
Type of Livestock
Sheep
Avg_Number
2
Economic_Importance_Rank
For consumption and selling
Poultry
5
For egg and selling
Goats
5
For consumption and selling
ABAYA GUNUCHO
Cattle: Mature Female
2
For sell and milk
Cattle: Mature Male
1
For ploughing
Goats
12 For selling
Sheep
6
For selling
Poultry
8
For selling and consumption
ABELA AJAJA
Poultry
5
Goats
3
Donkeys
1
Cattle: Mature Male
1
Cattle: Mature Female
1
ABELA GEFETA
Cattle: Mature Female
1
For Milk
Cattle: Mature Male
1
For poughing
Sheep
3
For selling and meat
Goats
1
For selling and meat
Poultry
4
For selling and meat
ABELA ZEGRE
Poultry
4
For egg and selling
Sheep
3
For selling and meat
Goats
1
For selling and meat
AMBE SHOYA
Sheep
3
For sell and meat
Poultry
4
For sell and egg
Goats
2
For sell and meat
186
Page 1 of 4

Data_Collected_Date
Thursday, December 12, 2019
Region S.N.N.P
Zone WOLAYITA
Wereda HUMBO
Selected Indictor:
Agricultural Situation: Livestock Diversity - Type of livestock and their economic
importance in the community
Kebele Name
AMPO KOYISHA
Type of Livestock
Sheep
Avg_Number Economic_Importance_Rank
1
Donkeys
1
Goats
1
ANKA WECHA
Poultry
6
To give eggs, meat and for selling
Sheep
4
For selling and for meat consumption
Goats
3
For selling and for meat consumption
BOSA WANCHE
Sheep
1
Breeding and selling.
Goats
1
For breeding and selling.
Donkeys
1
Carrying of heavy load.
DEMBA KOYISHA
Sheep
1
For selling and meat
---------
0
Poultry
2
For selling and eggs
ELA KEBELA
Donkeys
1
Sheep
1
Goats
1
GALICHA KARA
Donkeys
1
For transportation
Poultry
6
For food and income source
Sheep
4
For income and food as source of meat
GUTUTO LARENA
Donkeys
1
For transportation
Sheep
1
For sell and meat
Poultry
4
For sell and egg
HOBICHA BADA
Donkeys
1
For carrying
Sheep
1
For selling
Poultry
4
For egg and For selling
187
Page 2 of 4
Data_Collected_Date
Thursday, December 12, 2019
Region S.N.N.P
Zone WOLAYITA
Wereda HUMBO
Selected Indictor:
Agricultural Situation: Livestock Diversity - Type of livestock and their economic
importance in the community
Kebele Name
HOBICHA BADA
Type of Livestock
Camels: Female
Avg_Number
1
Economic_Importance_Rank
For Plowing the land
HOBICHA BONGOTA
Goats
3
For selling
Sheep
1
For selling
Donkeys
1
For transportation
HOBICHA DIGISO
Goats
1
For selling and meat
Sheep
1
For selling and mea
Poultry
1
For selling and egg
KODO KANKO
Goats
1
For meat and sell
Poultry
4
For egg and sell
Sheep
1
For meat and sell
KOYISHA GOLA
Poultry
4
For selling and egg
Goats
1
For selling and meat
Sheep
3
For selling and meat
KOYISHA OGODAMA
Sheep
2
For selling and meat
Poultry
3
For selling and egg
Goats
1
For selling and meat
KOYISHA WANGALA
Poultry
5
For egg and meat
Goats
2
For sell and meat
Sheep
2
For sell and meat
SERE TAWURETA
Sheep
1
For selling and meat
Goats
2
For selling and meat
Poultry
3
For selling and eggs
SHOCHORA ABELA
Poultry
6
For selling and egg
Goats
1
For selling and meat
188
Page 3 of 4

Data_Collected_Date
Thursday, December 12, 2019
Region S.N.N.P
Zone WOLAYITA
Wereda HUMBO
Selected Indictor:
Agricultural Situation: Livestock Diversity - Type of livestock and their economic
importance in the community
Kebele Name
SHOCHORA ABELA
Type of Livestock
Sheep
Avg_Number
3
Economic_Importance_Rank
For selling and meat
SHOCHORA FESHO
Sheep
1
Donkeys
1
Goats
1
SHOCHORA
OGODAMA
Poultry
Sheep
4
For sell and egg
3
For sell and meat
Goats
1
For sell and meat
SHOCHORA OSE
Goats
1
For sell and meat
Poultry
2
For sell and egg
Sheep
1
For sell and meat
189
Page 4 of 4
Wereda Disaster
Risk Profile
Data_Collected_Date
National Disaster Risk Management
Commission (NDRMC)
Thursday, December 12, 2019
Region S.N.N.P
Zone WOLAYITA
Wereda HUMBO
Selected Indictor:
Economic Vulnerability: Livestock Ownership and Changes - Percentage of households by number and type of
livestock owned
A - None
B - 1 to 5
C - 6 to 10
D - 11 to 50
Bee keeping
95.29
2.88
0.52
Camels: Female
100.00
Camels: Male
100.00
Camels: Young Female
100.00
Camels: Young Male
99.21
0.79
Cattle: Female
54.71
41.62
0.79
0.26
Cattle: Male bulls
78.27
19.63
0.52
Cattle: Mature Female
33.77
63.35
1.05
0.26
Cattle: Mature Male
42.67
56.54
0.26
Cattle: under 1 year
45.03
52.36
0.79
Donkeys
66.75
30.89
Goats
56.02
40.05
2.62
0.26
Horses
98.69
0.52
190
Page 1 of 2
Wereda Disaster
Risk Profile
Data_Collected_Date
National Disaster Risk Management
Commission (NDRMC)
Thursday, December 12, 2019
Region S.N.N.P
Zone WOLAYITA
Wereda HUMBO
Selected Indictor:
Economic Vulnerability: Livestock Ownership and Changes - Percentage of households by number and type of
livestock owned
A - None
B - 1 to 5
C - 6 to 10
D - 11 to 50
Mules
98.95
Poultry
28.01
58.38
11.26
1.83
Sheep
70.68
26.70
1.05
191
Page 2 of 2
Data_Collected_Date
Region S.N.N.P
Zone WOLAYITA
Thursday, December 12, 2019
Wereda HUMBO
Selected Indicator
Economic Vulnerability: Livestock Ownership and Changes - Households
perception on changes in livestock number in the last five years (response in %)
Type of Livestock Owned
Changes Observed By Households
Bee keeping
A - Decreased
64.71
B - Remained the Same
23.53
C - Increased
11.76
Camels: Young Male
100.00
Cattle: Female
76.36
18.18
5.45
Cattle: Male bulls
71.95
24.39
3.66
Cattle: Mature Female
75.10
20.00
4.90
Cattle: Mature Male
69.86
28.23
1.91
Cattle: under 1 year
67.16
23.88
8.96
Donkeys
53.66
40.65
5.69
Goats
76.54
12.35
11.11
Horses
75.00
25.00
Mules
100.00
Poultry
62.30
18.25
19.44
Sheep
77.14
17.14
5.71
192
Page 1 of 3
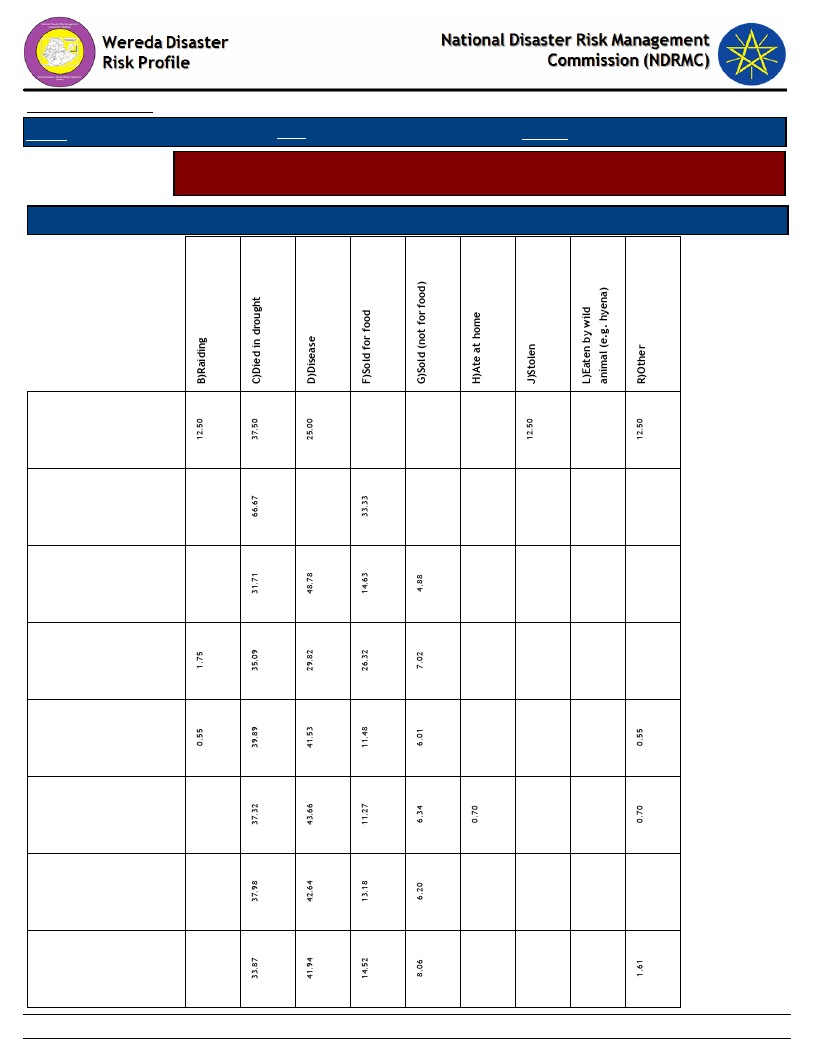
Data_Collected_Date
Region S.N.N.P
Zone WOLAYITA
Thursday, December 12, 2019
Wereda HUMBO
Selected Indicator
Economic Vulnerability: Livestock Ownership and Changes - Households
perception on changes in livestock number in the last five years (response in %)
Type of Livestock Owned
Reason for Decrease in Livestock Number
Bee keeping
Camels: Young
Male
Cattle: Female
Cattle: Male bulls
Cattle: Mature
Female
Cattle: Mature
Male
Cattle: under 1
year
Donkeys
193
Page 2 of 3
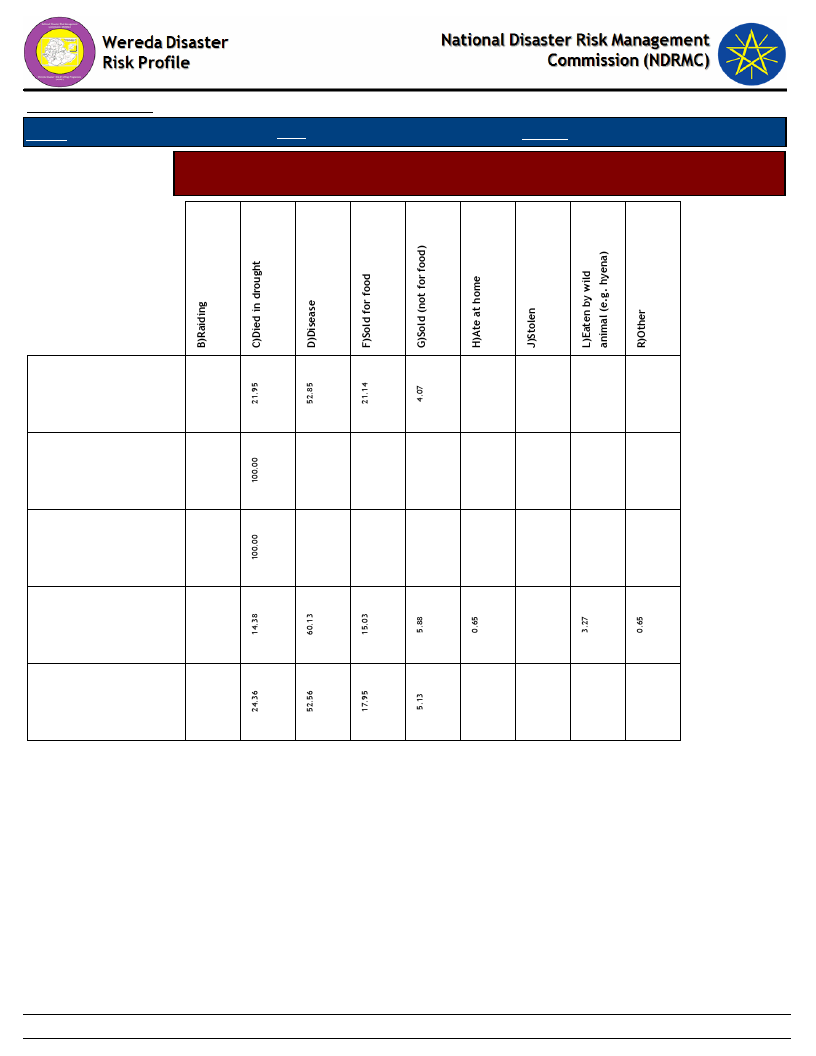
Data_Collected_Date
Region S.N.N.P
Zone WOLAYITA
Thursday, December 12, 2019
Wereda HUMBO
Selected Indicator
Economic Vulnerability: Livestock Ownership and Changes - Households
perception on changes in livestock number in the last five years (response in %)
Goats
Horses
Mules
Poultry
Sheep
194
Page 3 of 3
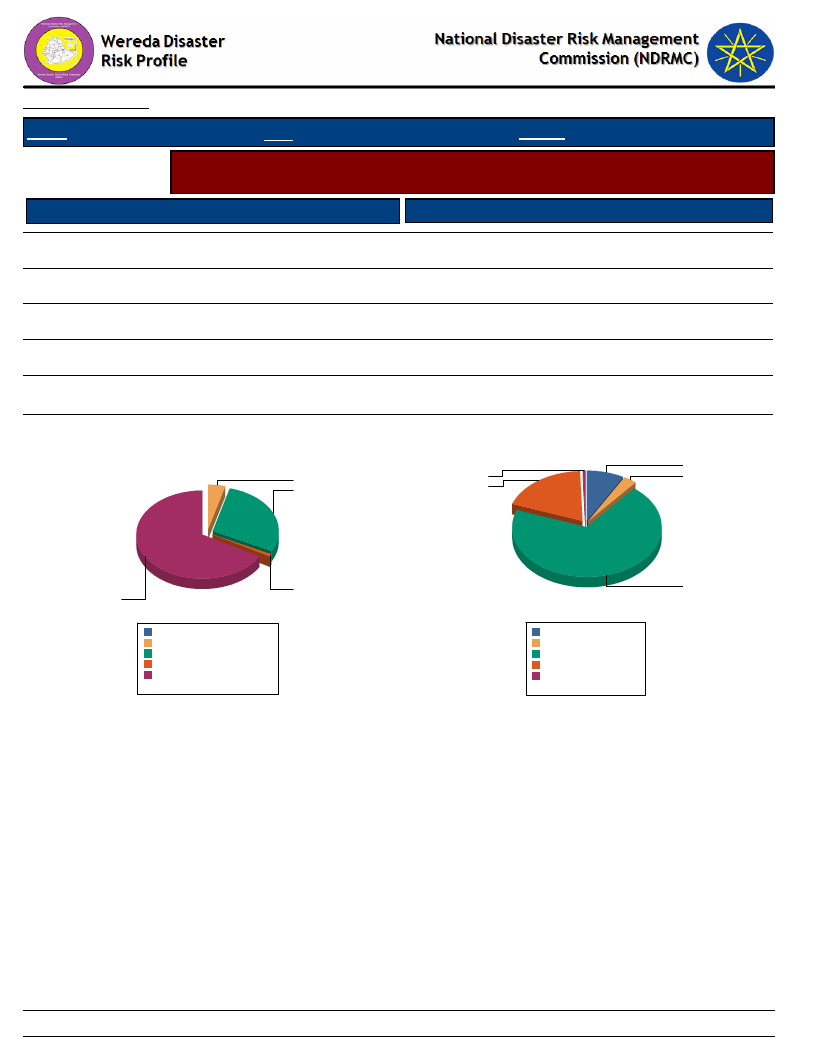
Data_Collected_Date
Thursday, December 12, 2019
Region S.N.N.P
Zone WOLAYITA
Wereda HUMBO
Selected Indicator
Agriculture (Livestock): Pasture Availability - Households perception on access
and quality of pasture
Access to Pasture
Response Percent
Quality of Pasture
Response Percent
Regularly available
0.80
B - Good
8.22
Occasionally
28.27
C - Adequate
2.74
Seldom available
66.67
D - Poor
70.14
Never available
4.27
E - Very poor
18.90
F - DK
0.55
Household responses to Access to Pasture for
Livestock
4.3
28.3
Household responses to Quality of Pasture
8.2
0.6
2.7
18.9
66.7
0.8
0.0%
Never available
4.3%
Occasionally
28.3%
Regularly available 0.8%
Seldom available 66.7%
Total:
100.0%
B - Good
8.2%
C - Adequate 2.7%
D - Poor
69.8%
E - Very poor 18.8%
F - DK
0.5%
Total:
100.0%
70.1
195
Page 1 of 1
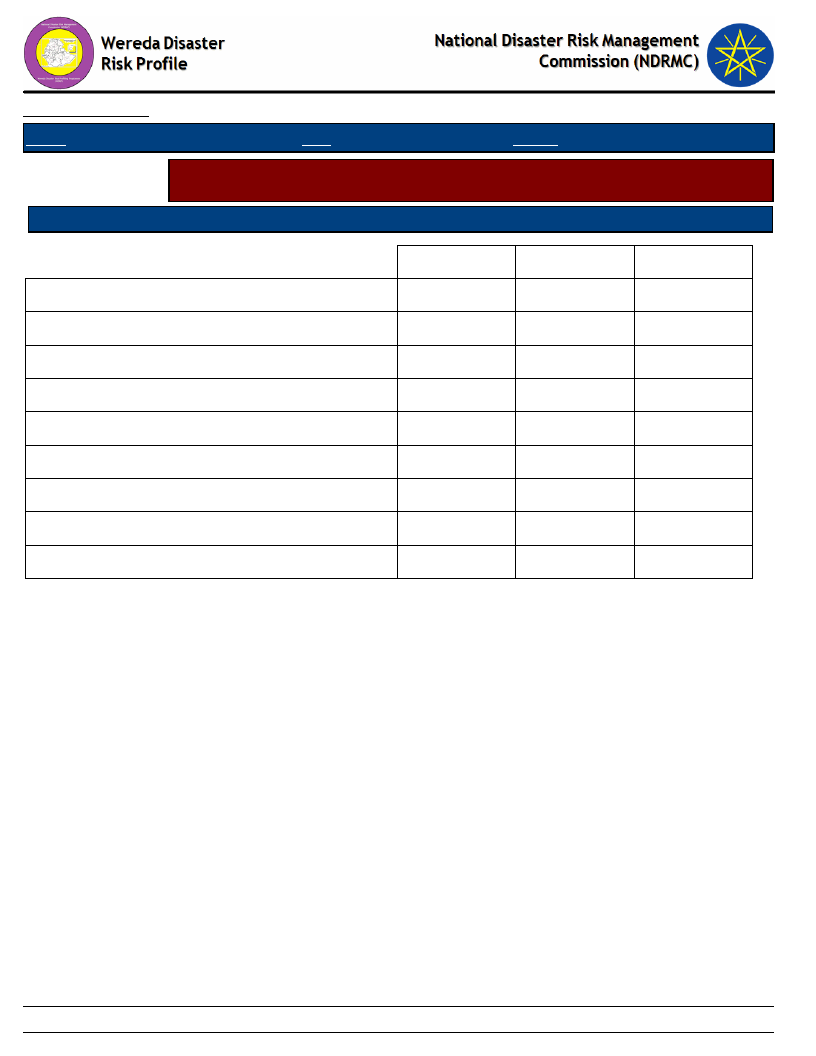
Data_Collected_Date
Region S.N.N.P
Zone WOLAYITA
Thursday, December 12, 2019
Wereda HUMBO
Selected Indicator
Agriculture (Livestock): Pasture Availability - Households perception on
problematic months for pasture availability
Problematic Months
Order of Severity
A - Sep (Meskerem)
B - Oct (Tikimt)
C - Nov (Hidar)
D - Dec (Tahsas)
E - Jan (Tir)
F - Feb (Yekatit)
G - Mar (Megabit)
H - Apr (Meazea)
I - May (Ginbot)
1st
0.27
1.62
37.74
22.91
28.57
7.28
1.62
2nd
0.27
0.27
0.27
2.70
64.59
28.92
2.70
0.27
3rd
0.82
0.82
28.42
8.74
37.43
21.58
2.19
196
Page 1 of 1
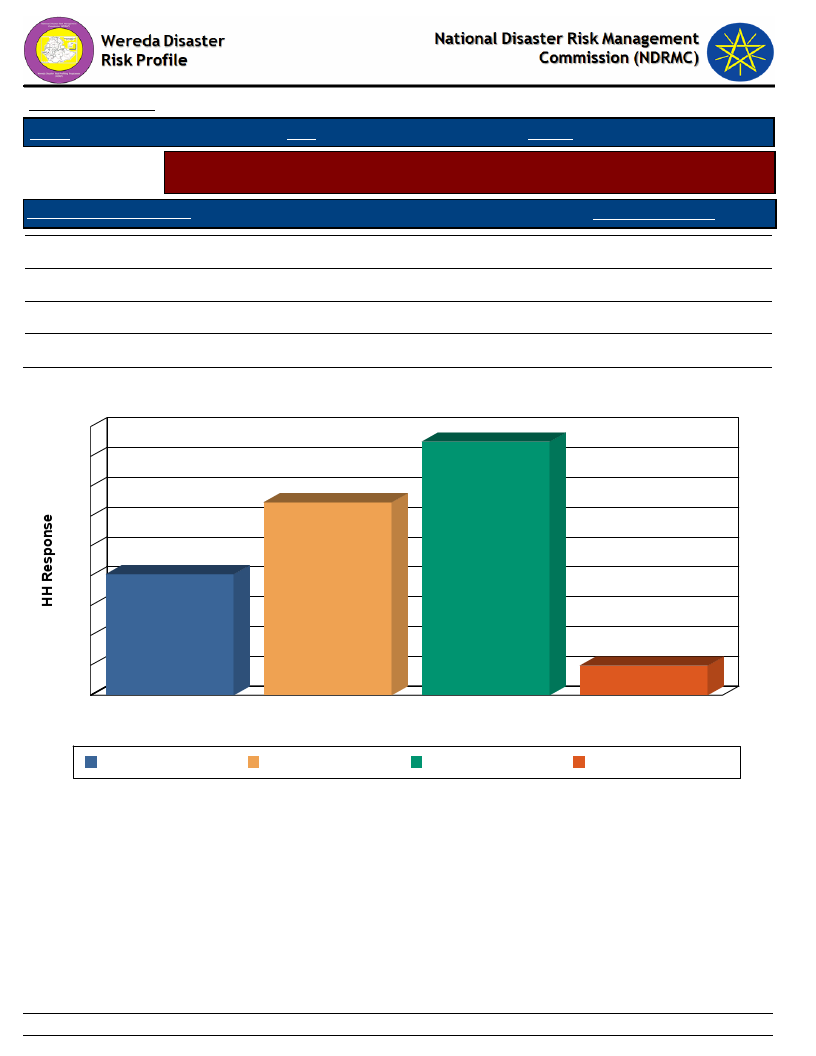
Data_Collected_Date
Region S.N.N.P
Zone WOLAYITA
Thursday, December 12, 2019
Wereda HUMBO
Selected Indicator
Agriculture (Livestock): Water Availability - Households response on water
availability for livestock
Access to Water - Livestock
Household Response
A - Regularly available
B - Occasionally
C - Seldom available
D - Never available
20.27
32.33
42.47
4.93
Household Access to Water for Livestock
45
42
40
35
32
30
25
20
20
15
10
5
5
0
A - Regularly available
B - Occasionally
C - Seldom available
Access to Water - Livestock
D - Never available
A - Regularly available B - Occasionally
C - Seldom available
D - Never available
197
Page 1 of 1
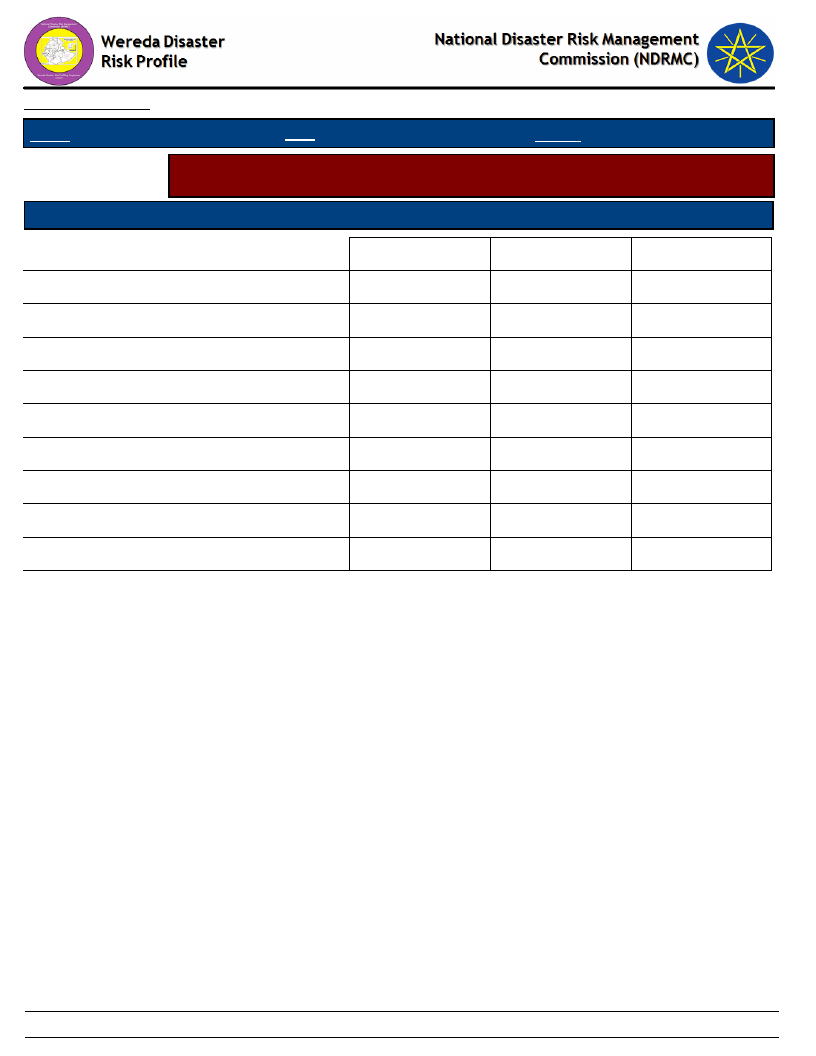
Data_Collected_Date
Region S.N.N.P
Zone WOLAYITA
Thursday, December 12, 2019
Wereda HUMBO
Selected Indicator
Agriculture (Livestock): Water Availability - Households perception on
problematic months for water availability for Livestock
Problematic Months
Order of Severity
B - Oct (Tikimt)
C - Nov (Hidar)
D - Dec (Tahsas)
E - Jan (Tir)
F - Feb (Yekatit)
G - Mar (Megabit)
H - Apr (Meazea)
I - May (Ginbot)
J - Jun (Sene)
1st
0.32
2.84
38.80
23.34
29.34
4.42
0.95
2nd
0.32
0.32
0.32
4.76
66.67
26.03
1.59
3rd
0.64
30.03
8.63
40.26
20.13
0.32
198
Page 1 of 1
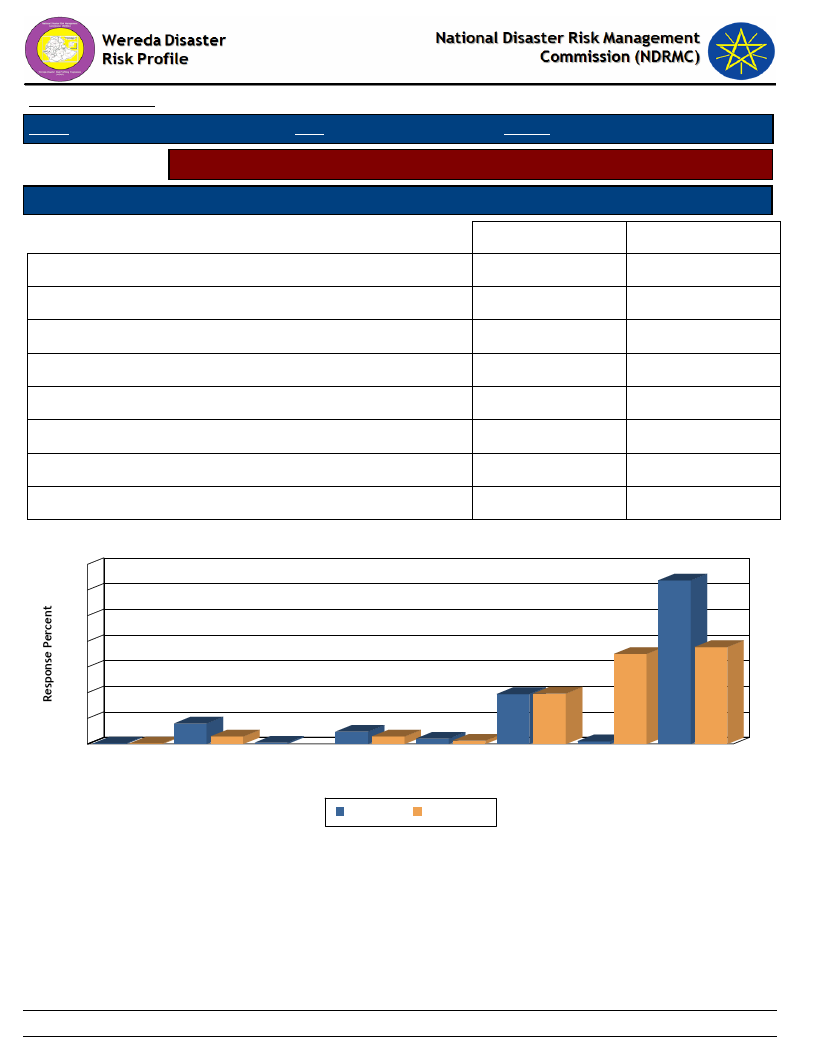
Data_Collected_Date
Region S.N.N.P
Zone WOLAYITA
Thursday, December 12, 2019
Wereda HUMBO
Selected Indicator
Sources of water for livestock (households response in %)
Type of Livestock Owned
Changes Observed By Households
Birka
Communal tap (Bono)
Open/Deep well
Piped water outside the house
Pond or lake (fenced)
Pond or lake (open access)
Rainwater harvesting
River, stream
Dry Season
0.27
8.00
0.53
4.80
2.13
19.47
1.07
63.73
Wet Season
0.27
2.93
2.93
1.33
19.68
35.11
37.77
Household Responses to Type of Water Source and Season for Livestock
70
60
50
40
30
20
10
0
0
0
Birka
19 20
8
3
1
5
3
2
1
Communal tap
(Bono)
Open/Deep well Piped water
Pond or lake
Pond or lake
outside the
(fenced)
(open access)
Type ohfouWseater Source & Season
35
1
Rainwater
harvesting
Dry Season
Wet Season
64
38
River, stream
199
Page 1 of 1
WDRP Indicators
Access to Market and Credit
200

Wereda Disaster
Risk Profile
Data_Collected_Date
National Disaster Risk Management
Commission (NDRMC)
Thursday, December 12, 2019
Region S.N.N.P
Zone WOLAYITA
Wereda HUMBO
Selected Indictor:
KebeleName
ABAYA GUNUCHO
ABELA AJAJA
Economic Vulnerability: Proportion of Produce Sold and Market - Proportion of crops and livestock sold from total
production and markets
Market_For_Crops
Market_For_Livestock_Produce
Percent
Livestock_Sold
Total_% Comments
Sold
Abaya
Abaya Gunucho/Gulit market
20
60
Gunucho/Gulit
market
Humbo Tebela
Humbo Tebela
30
25
ABELA GEFETA
Humbo
Humbo
12
25
ANKA WECHA
Humbo
Humbo
20
BOSA WANCHE
Shosha, Humbo
Humbo tebela and Sodo
30
tebela
GALICHA KARA
Humbo Market
Humbo Market
40
30
About 70% of production was
consumed the rest are sold to buy
other non-food items.
20
30
GUTUTO LARENA
Humbo
Humbo
15
HOBICHA BONGOTA
Local market only
Local market and woreda other
70
in Hobicha Bada
city market
areas
HOBICHA BADA
Bada
Bada
25
ABELA ZEGRE
Humbo
Humbo
15
201
25
About 20% of crop was soled to by
other non food items.
80
Low production and high demand
20
80% of the product was consumed
and only 20% was soled to buy
non-food items.
25
About 25% of crop was soled to
buy other non-food items.
Page 1 of 3

Wereda Disaster
Risk Profile
Data_Collected_Date
National Disaster Risk Management
Commission (NDRMC)
Thursday, December 12, 2019
Region S.N.N.P
Zone WOLAYITA
Wereda HUMBO
Selected Indictor:
Economic Vulnerability: Proportion of Produce Sold and Market - Proportion of crops and livestock sold from total
production and markets
KebeleName
Market_For_Crops
Market_For_Livestock_Produce
Percent
Livestock_Sold
Total_% Comments
Sold
KOYISHA GOLA
Humbo
Humbo
15
25
About 25% of crop was soled to
buy other non food items.
KODO KANKO
Humbo
Humbo
15
25
25% of crop selling to buy other
non food items
KOYISHA OGODAMA
Humbo
Humbo
30
20
About 80% of production was
consumed by household and the
rest are soled to buy other
non-food item
AMBE SHOYA
Humbo
Humbo
30
20
About 80% of production was
consumed for home use and the
rest used to buy other non food
items
KOYISHA WANGALA
Humbo
Humbo
40
45
55% of crop produced will for
home conception and the rest 45%
were for sell to buy other non
food items
AMPO KOYISHA
Tebela
Tebela
30
20
SHOCHORA ABELA
Humbo
DEMBA KOYISHA
Humbo
Humbo
Humbo
30
20
About 80% of production was
consumed by home and other to
buy other non food items
15
25
About 25% of crop was soled to
buy other non food items
202
Page 2 of 3
Wereda Disaster
Risk Profile
Data_Collected_Date
National Disaster Risk Management
Commission (NDRMC)
Thursday, December 12, 2019
Region S.N.N.P
Zone WOLAYITA
Wereda HUMBO
Selected Indictor:
KebeleName
SERE TAWURETA
ABAYA CHOKARE
ELA KEBELA
Economic Vulnerability: Proportion of Produce Sold and Market - Proportion of crops and livestock sold from total
production and markets
Market_For_Crops
Market_For_Livestock_Produce
Percent
Livestock_Sold
Total_% Comments
Sold
Humbo
Humbo
40
42
About 58% of production was
consumed and the remaining used
for buying of other non food items
Gurucho local
Humbo tebela and Gurucho
20
market
10
Low production
Humbo
Humbo
10
25
HOBICHA DIGISO
Local market
Local market
15
5
SHOCHORA OSE
Humbo
Humbo
15
SHOCHORA
Humbo
Humbo
15
OGODAMA
SHOCHORA FESHO
Local market and
Humbo Tebela Hamuse market
20
woreda main city
25
About 25% of crop was soled to
buy other non food items
25
About 25% of crop was sold to buy
other non-food items.
10
Low production because of
climate change
203
Page 3 of 3
Data_Collected_Date
Region S.N.N.P
Selected Indicator
Kebele Name
ABAYA GUNUCHO
ABELA AJAJA
ABELA GEFETA
ANKA WECHA
BOSA WANCHE
GALICHA KARA
GUTUTO LARENA
HOBICHA BONGOTA
HOBICHA BADA
ABELA ZEGRE
KOYISHA GOLA
KODO KANKO
KOYISHA OGODAMA
AMBE SHOYA
KOYISHA WANGALA
AMPO KOYISHA
SHOCHORA ABELA
DEMBA KOYISHA
SERE TAWURETA
ABAYA CHOKARE
ELA KEBELA
HOBICHA DIGISO
SHOCHORA OSE
SHOCHORA OGODAMA
Thursday, December 12, 2019
Zone WOLAYITA
Wereda HUMBO
Economic Vulnerability: Kebele Access to Markets - Access to market by Kebele
Market_Access_Comments
Lack of market network
Low market linkage due to lack of road accessibility
Due to seasonal problem the is low market network
Seasonal problems of price inflation on the holly day times.
Medium, Market is not too far from kebele, i.e. transportation cost is not very high, but
product is sold by low price.
Seasonal problem like problems in connection with high rainfall in kiremt season
Seasonal problem during producing time in which means price will decrease for a
livestock and crops.
Lack of road accessibility, high transportation cost, low market linkage
No market linkage, Minimum market size, Low price of products.
Seasonal problem during production time and price fluctuation for livestock and crop
assets.
Seasonal problem and price fluctuation on livestock and crops.
Following seasonal problems crop and livestock price will decreased
Seasonal problems result in prices fluctuation on the holly day time.
Seasonal problems - because of shortage of crop production and shortage of rain fall
Some seasonal problems due to shortage of water and price daily depreciate
Good market linkage
Seasonal problem:- Price fluctuation during holly day.
Seasonal problem during production time and it reduce the price of livestock and crops
Seasonal problem and the occurrence of price fluctuation on holly days.
No market linkage, because of lack of road construction
Medium, lack of road
Low market linkage, high transportation cost
Seasonal problem during production time and cause for low price of crop and livestock
s
Seasonal problem during production time and it cause low price of crop and livestock s
204
Page 1 of 2

Data_Collected_Date
Region S.N.N.P
Selected Indicator
Kebele Name
SHOCHORA FESHO
Zone WOLAYITA
Thursday, December 12, 2019
Wereda HUMBO
Economic Vulnerability: Kebele Access to Markets - Access to market by Kebele
Market_Access_Comments
Medium, because there is only one market near kebele.
205
Page 2 of 2
Data_Collected_Date
Region S.N.N.P
Zone WOLAYITA
Thursday, December 12, 2019
Wereda HUMBO
Selected Indicator
Economic Vulnerability: Formal & Informal Transfers - Percentage of
households reporting received formal transfers
Type of Formal Transfer
Food aid
HH Response Type of Informal Transfer
Formal
32.18 Remittances (from relative living elsewhere)
HH Response
0.26
Food-for-Work project
14.59 Zakaat
2.64
Cash-for-Work project
35.79 Other cash gift
2.90
Faffa
10.34 Cash loan (no interest)
4.49
Free cash
4.79 Food or grain gift
1.58
Seeds
15.47 Grain loan (no interest)
1.06
Credit support
5.35 Seed gift
4.75
Livestock
Seed loan
1.32
Tools
0.27 Free labour
3.43
Donations of cash or animals to disaster stricken
0.26
people
Free use of oxen or plough
0.79
Distribution of meat to neighbours after a slaughter
0.53
takes place
Cash or kind gift to married daughters when they
1.32
visit parents or relatives
Gift of livestock to newly-weds
0.53
Donation or loan of milking animals to a relative or
0.53
friend
Dowry given to bride’s parents
0.53
206
Page 1 of 2
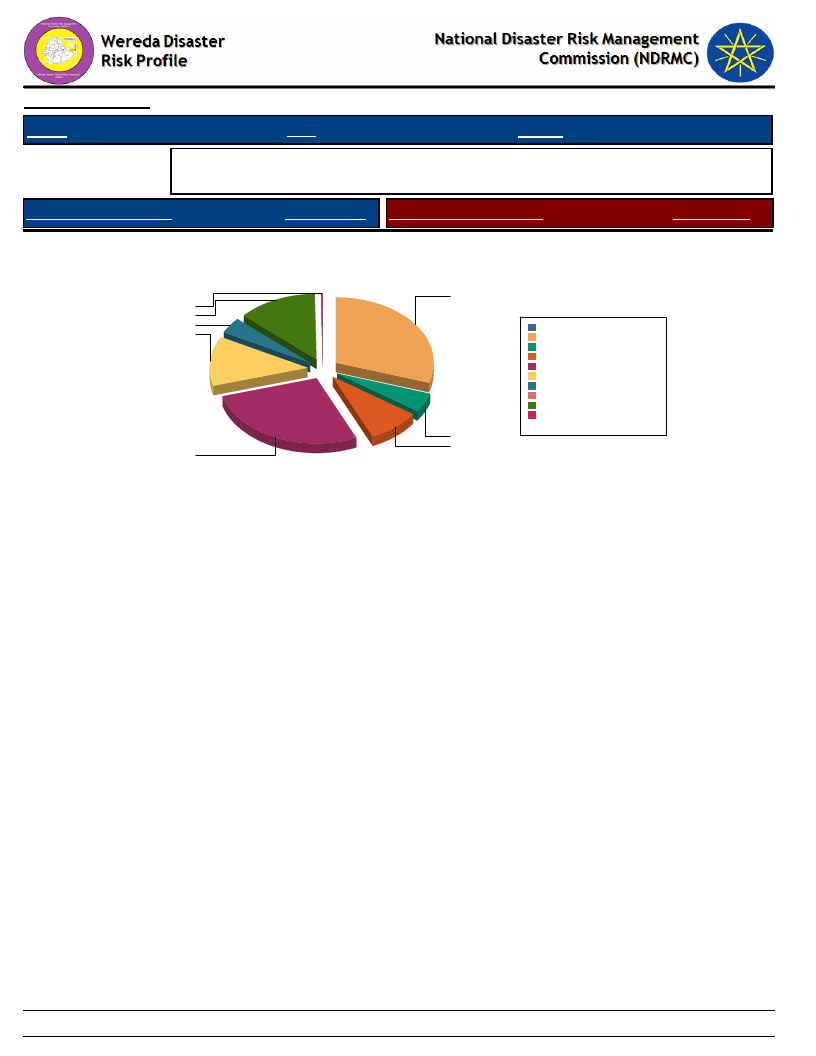
Data_Collected_Date
Region S.N.N.P
Zone WOLAYITA
Thursday, December 12, 2019
Wereda HUMBO
Selected Indicator
Economic Vulnerability: Formal & Informal Transfers - Percentage of
households reporting received formal transfers
Type of Formal Transfer
HH Response Type of Informal Transfer
Formal
Type of Formal Transfer Received By Households
HH Response
0.3
15.5
4.8
14.6
32.2
35.8
5.3
10.3
0.0%
Cash-for-Work project 30.1%
Credit support
4.5%
Faffa
8.7%
Food aid
27.1%
Food-for-Work project 12.3%
Free cash
4.0%
Livestock
0.0%
Seeds
13.0%
Tools
0.2%
Total:
100.0%
207
Page 2 of 2
Data_Collected_Date
Region S.N.N.P
Zone WOLAYITA
Thursday, December 12, 2019
Wereda HUMBO
Selected Indicator
Capacity: Access to Credit Facilities - Households access to credit facilities
Type of Access To Credit Facilities
Indicator_Value
Households who borrowed any money in the last one year (%)
Households who tried to borrow 1-2
Households who managed to get credit 1-2
Households who tried to borrow 5 & Above
Households who managed to get credit 5 & Above
Households with membership in any credit /micro finance society (%)
Households who tried to borrow 3-4
Households who managed to get credit 3-4
Average No. of HHs Tried to get Credit
Average No. HHs Managed to get Credit
16.47
80.00
83.93
5.88
3.57
18.73
14.12
12.50
208
Page 1 of 1
Data_Collected_Date
Region S.N.N.P
Zone WOLAYITA
Thursday, December 12, 2019
Wereda HUMBO
Selected Indicator
Capacity: Access to Credit Facilities - Percentage of households by major
reasons of borrowing money
Type of Borrowing Reason
Degree of Importance of the Borrowing Reasons - HH Respones
Buy agricultural input
Buy food
Buy or rent land
Others (specify)
Pay for education
Pay for health care
Pay for social event
1st
Important
47.37
35.09
7.02
5.26
1.75
3.51
2nd
Important
22.45
34.69
4.08
2.04
14.29
12.24
10.20
3rd
Important
27.27
21.21
3.03
6.06
15.15
27.27
209
Page 1 of 1
Data_Collected_Date
Thursday, December 12, 2019
Region S.N.N.P
Zone WOLAYITA
Wereda HUMBO
Selected Indicator
Capacity: Access to Credit Facilities - Percentage of households by major
sources of credit
Major Sources of Credit for Households
Degree of Importance of the Credit Source
Bank/formal lending institution
1st
Important
90.74
2nd
Important
3rd
Important
Friends/relatives
3.70
100.00
Help associations (Edir)
50.00
Local shops / moneylenders
5.56
Neighbors
50.00
210
Page 1 of 1
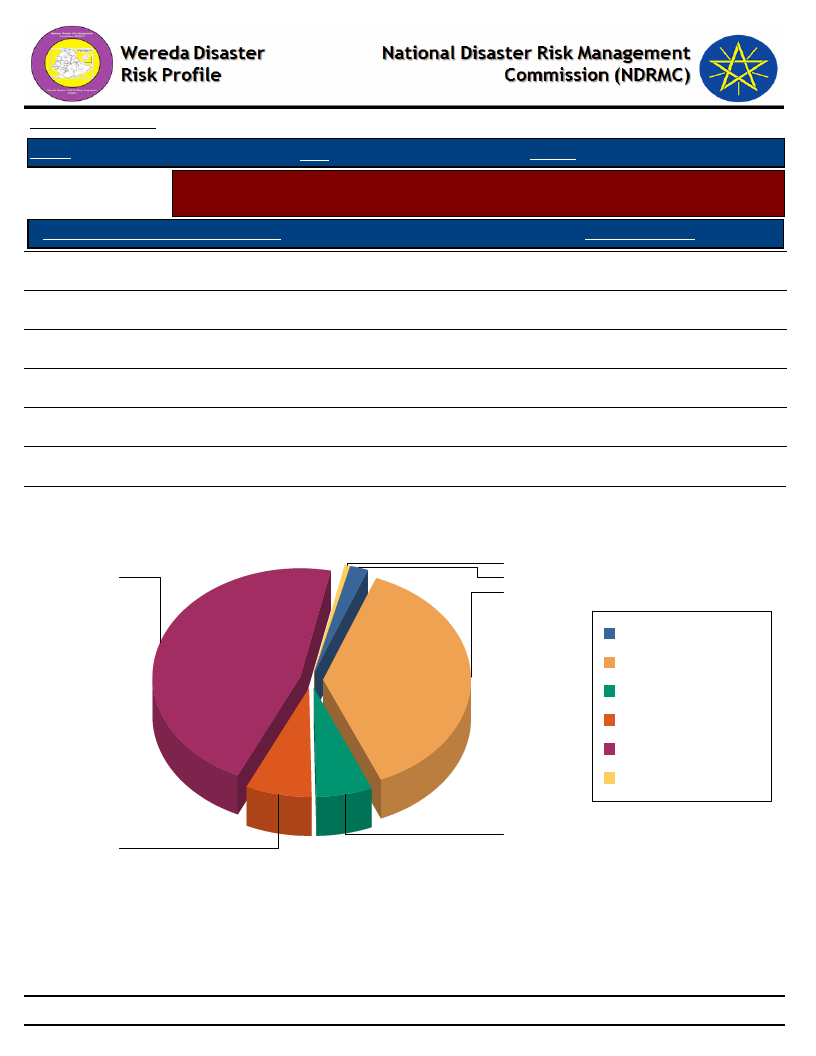
Data_Collected_Date
Thursday, December 12, 2019
Region S.N.N.P
Zone WOLAYITA
Wereda HUMBO
Selected Indicator
Capacity: Access to Credit Facilities - Percent of households with ability to raise
500 birr in one week
HH Ability To Raise 500 Br in One Week
Response_Percent
Yes, we would use our savings
47.22
Yes, with some help from others
0.62
Yes, by selling asset or livestock
7.41
DK
1.85
Yes, by borrowing money
6.17
Perhaps, but I doubt it
38.58
Households' Ability To Raise 500 Br in One Week
1
47
2
39
DK
Perhaps, but I doubt it
Yes, by borrowing
money
Yes, by selling asset or
livestock
Yes, we would use our
savings
Yes, with some help
from others
6
7
211
Page 1 of 1
WDRP Indicators
Health and Sanitation
Characteristics
212
Data_Collected_Date
Region S.N.N.P
Zone WOLAYITA
Thursday, December 12, 2019
Wereda HUMBO
Selected Indicator
Household Access to Health Facilities - Where do patients go for health care?
Constraints to adequate healthcare
Where do Patients Go for Healthcare
HH Response Constraints to Adequate Health Care
Response
Traditional healer
Other
Other public
Mission facility
Community health worker
Private hospital/clinic
Pharmacy
Other private
Did not get Health Care
Central Hospital
District/Municipal hospital/health
centre/ clinic
0.86
1.54
1.20
32.76
0.69
17.67
2.06
2.92
20.93
5.15
7.55
7.55
No money for treatment costs
100.00
213
Page 1 of 2
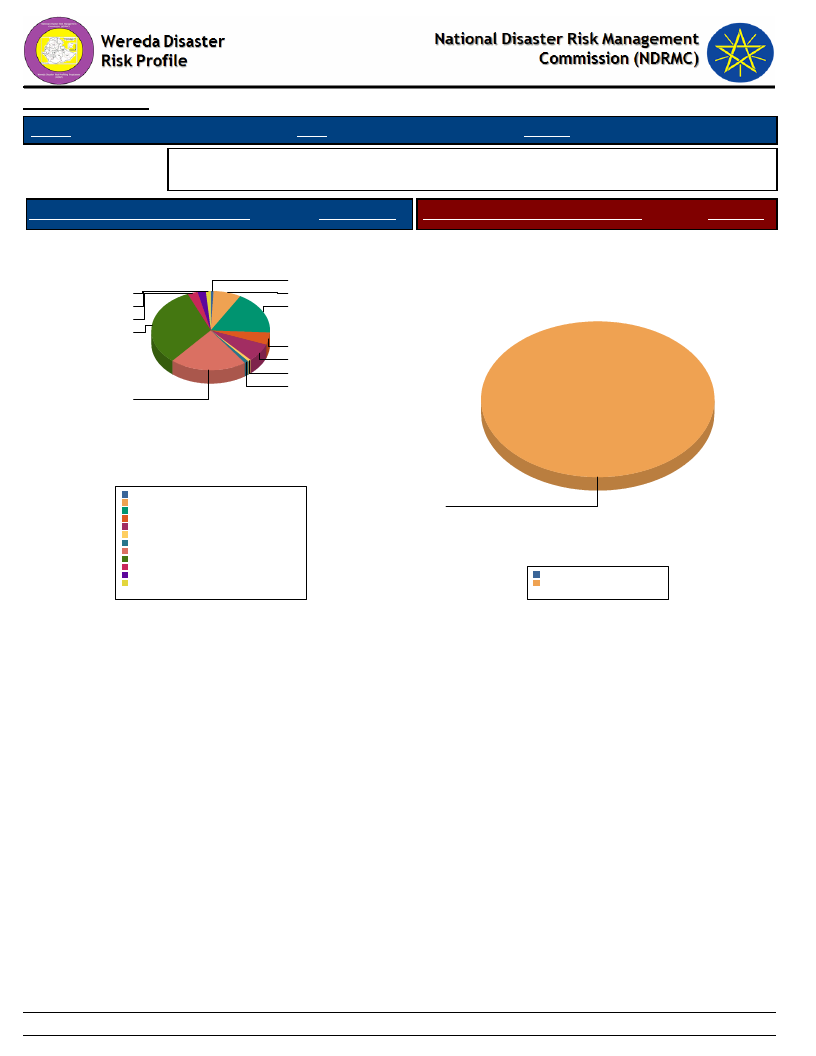
Data_Collected_Date
Region S.N.N.P
Zone WOLAYITA
Thursday, December 12, 2019
Wereda HUMBO
Selected Indicator
Household Access to Health Facilities - Where do patients go for health care?
Constraints to adequate healthcare
Where do Patients Go for Healthcare
HH Response Constraints to Adequate Health Care
Response
Where Do Patients go for Health care?
1
2
8
2
18
3
33
5
8
1
1
21
Constraints to Adequate Health Care
Central Hospital
Community health worker
Did not get Health Care
District/Municipal hospital/health centre/ clinic
Mission facility
Other
Other private
Other public
Pharmacy
Private hospital/clinic
Traditional healer
0.9%
7.5%
17.5%
5.1%
7.5%
0.7%
1.2%
20.7%
32.5%
2.9%
2.0%
1.5%
Total:
100.0%
100
0.0%
No money for treatment costs 100.0%
Total:
100.0%
214
Page 2 of 2

Data_Collected_Date
Region S.N.N.P
Zone WOLAYITA
Thursday, December 12, 2019
Wereda HUMBO
Selected Indicator
Hazards: Health problems and changes over the last decade
Kebele Name
Health_Problems
Changes_In_Last_Decade
ABAYA GUNUCHO
ABELA AJAJA
ABELA GEFETA
ANKA WECHA
BOSA WANCHE
GALICHA KARA
GUTUTO LARENA
HOBICHA
BONGOTA
HOBICHA BADA
ABELA ZEGRE
KOYISHA GOLA
KODO KANKO
KOYISHA
OGODAMA
AMBE SHOYA
KOYISHA
WANGALA
AMPO KOYISHA
SHOCHORA ABELA
DEMBA KOYISHA
Malaria caused by agro ecological setup of the area
Medium
Malaria, Typhoid, Diarrhea caused by lack of sanitation,
stagnant water
Malaria, communities use of dirty water.
Medium malaria and diahria. caused by breeding of
mosquito, although there is some prevention mechanism,
Illness.
Malaria caused by stagnant water and poor hygiene and
sanitation
Good status on Malaria, Typhoid fever, Diarrhea, caused
by Contaminated water
Lack of balanced diet, contaminated food and water
Medical treatment, Using of preventive mechanism
Mosquito, Water contamination, Poor sanitation
Good condition in malaria, typhoid fever and diarrhea
Caused By Mosquito, Water contamination, Poor
sanitation
Malaria, typhoid fever, diarrhea Caused By Mosquito,
poor sanitation
Good, but malaria caused by stagnant water and
mosquito, it leads to illness
Malaria caused by agro-ecological factors
Malaria caused by topographic nature
Malaria
Malaria caused by stagnant water and mosquito, Illness
Malaria, Typhoid caused by Mosquito, lack of sanitation
Increase
Improved
Decrease
Increased
Decreased
Increase
Decreased
Increased
Decreased
Decreased
Decreased
Decrease
Decreased
Increased
Decrease
Increased
Decreased
215
Page 1 of 2
Data_Collected_Date
Region S.N.N.P
Zone WOLAYITA
Thursday, December 12, 2019
Wereda HUMBO
Selected Indicator
Hazards: Health problems and changes over the last decade
Kebele Name
Health_Problems
Changes_In_Last_Decade
SERE TAWURETA
ABAYA CHOKARE
ELA KEBELA
HOBICHA DIGISO
SHOCHORA OSE
SHOCHORA
OGODAMA
SHOCHORA FESHO
Malaria caused by stagnant water and mosquito, It leads
to illness
Malaria, Jardia, Typhoid fever caused by water
contamination
The re is prevention and treatment mechanism .
Malaria, Typhoid fever, Diarrhea caused By mosquito,
contaminated water, lack of sanitation
Medium, Malaria, Typhoid fever, Diarrhea caused by
mosquito, water contamination, lack of sanitation
Good, Prevention, Sanitation, Medical treatment
Increased
Decreased
Improved
Increased
Decreased
Decreased
Improved
216
Page 2 of 2
Wereda Disaster
Risk Profile
Data_Collected_Date
National Disaster Risk Management
Commission (NDRMC)
Thursday, December 12, 2019
Region S.N.N.P
Zone WOLAYITA
Wereda HUMBO
Selected Indicator
Household Health Status - Households health condition and major health problems
Health Condition
HH Response Population Sickness
HH Response Children Sickness
HH Response
Good health
Ill for <3 months
Ill for more than three months
70.85
23.81
5.34
Chronic fever
Malaria
Diarrhea
Stomach pain
Asthma
Mental illness
Others
Tuberculosis
Pneumonia/ lung problem
Hyper tension
Eye problems
Back ache
HIV/AIDS
Headache
2.70
59.53
6.41
5.90
0.51
2.36
5.90
1.69
1.85
1.35
2.19
3.71
0.34
5.56
Chronic fever
Malaria
Diarrhea
Eye problems
Stomach pain
Mental illness
Others
Headache
4.67
74.77
10.28
0.93
0.93
0.93
5.61
1.87
217
Page 1 of 2
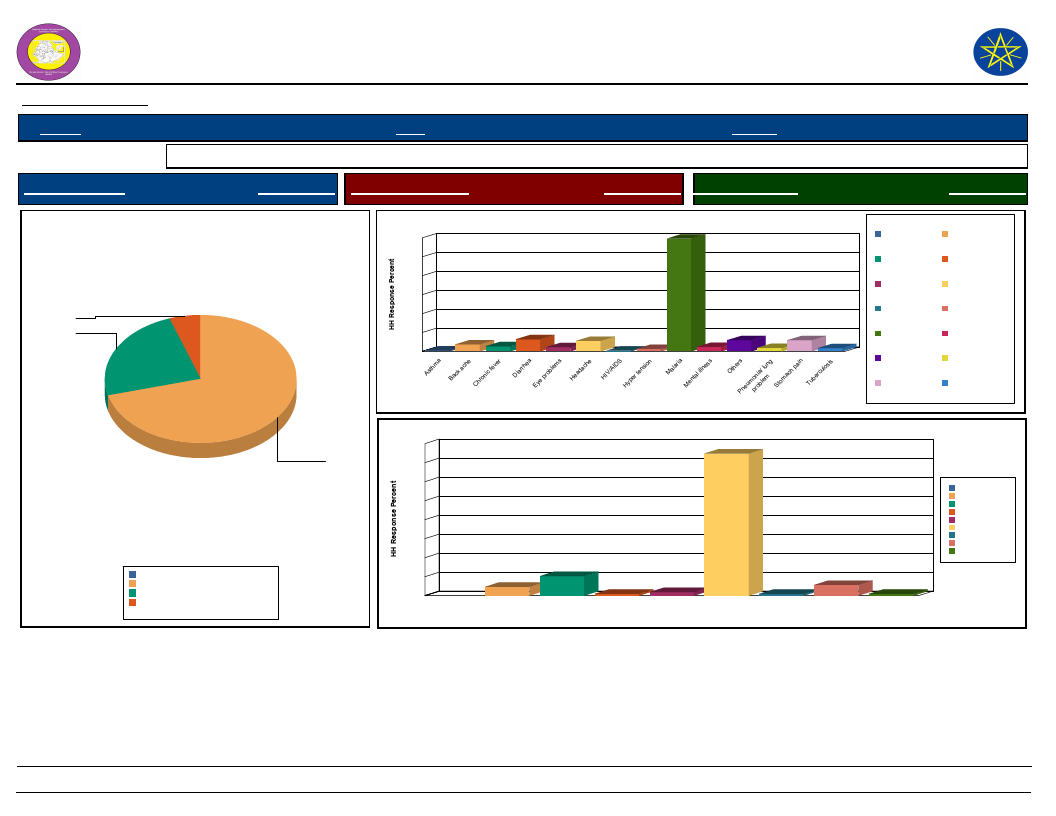
Wereda Disaster
Risk Profile
Data_Collected_Date
National Disaster Risk Management
Commission (NDRMC)
Thursday, December 12, 2019
Region S.N.N.P
Zone WOLAYITA
Wereda HUMBO
Selected Indicator
Household Health Status - Households health condition and major health problems
Health Condition
HH Response Population Sickness
HH Response Children Sickness
HH Response
Health Condition of the Community
5.3
23.8
70.8
Good health
Ill for <3 months
Ill for more than three months
0.0%
70.8%
23.8%
5.3%
Total:
100.0%
Population Sickness in the Community
60
60
50
40
30
20
10
4
3
1
0
a
Asthm
ache
Back
Chronic fever
6
6
2
0
1
2
Diarrhea
s
problem
Eye
Headache
HIV/AIDS Hyper tension
alaria
M
ental illness
M
Population Sickness
6
6
2
2
OtherPsneumopnroiab/lelumng
pain
ach
Stom
Tuberculosis
Asthma
Chronic fever
Eye problems
HIV/AIDS
Malaria
Others
Stomach pain
Children Sickness in the Community
80
75
70
60
50
40
30
20
10
10
5
1
2
0
6
1
1
Chronic fever
Diarrhea
Eye problems
Headache
Malaria
Mental illness
Others
Stomach pain
Children Sickness
Back ache
Diarrhea
Headache
Hyper tension
Mental illness
Pneumonia/ lung
problem
Tuberculosis
Chronic fever
Diarrhea
Eye problems
Headache
Malaria
Mental illness
Others
Stomach pain
218
Page 2 of 2
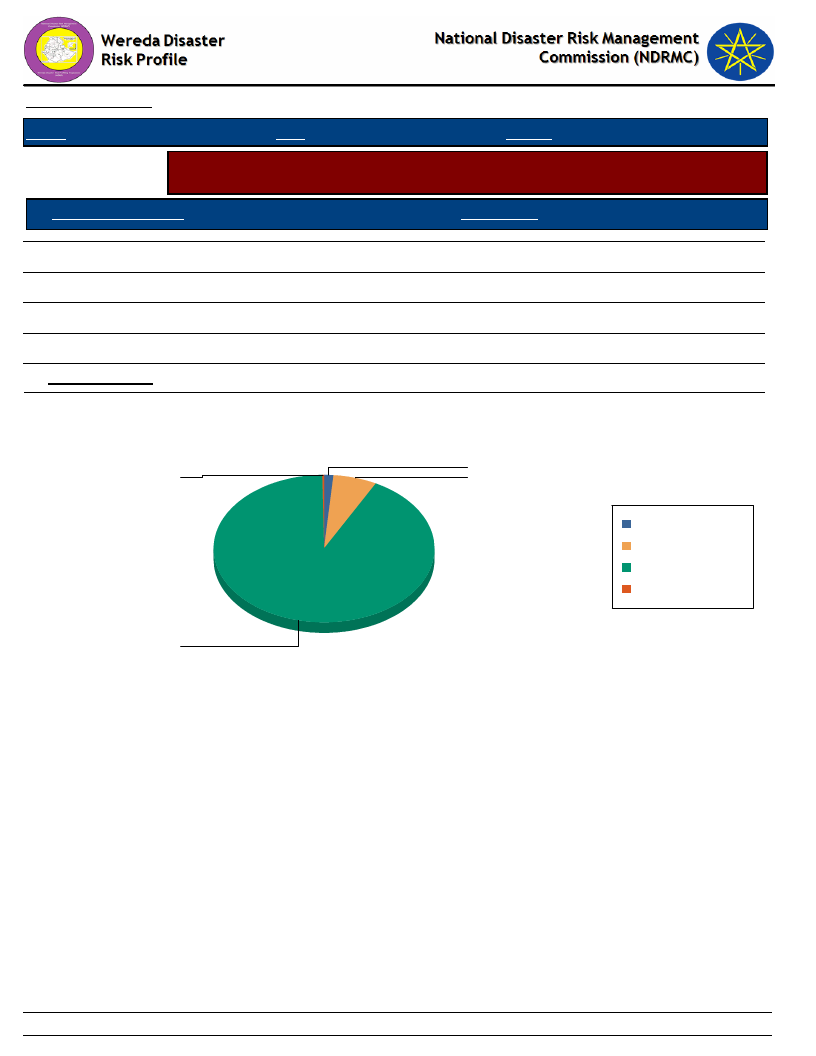
Data_Collected_Date
Thursday, December 12, 2019
Region S.N.N.P
Zone WOLAYITA
Wereda HUMBO
Selected Indicator
Household Access to Sanitation - Percentage of households with access to
different kind of toilet facilities
Type of Toilet Facility
HH Response
Modern water closet
Ventilated, build in latrine
Outdoors latrine/hole on plot
No facilities/Open Space
HH Sharing Toilet
1.31
0.26
91.86
6.56
8.66
Household Responses to the type of toilet facilities in the community
1.3
0.3
6.6
Modern water closet
No facilities/Open Space
Outdoors latrine/hole on
plot
Ventilated, build in
latrine
91.9
219
Page 1 of 1
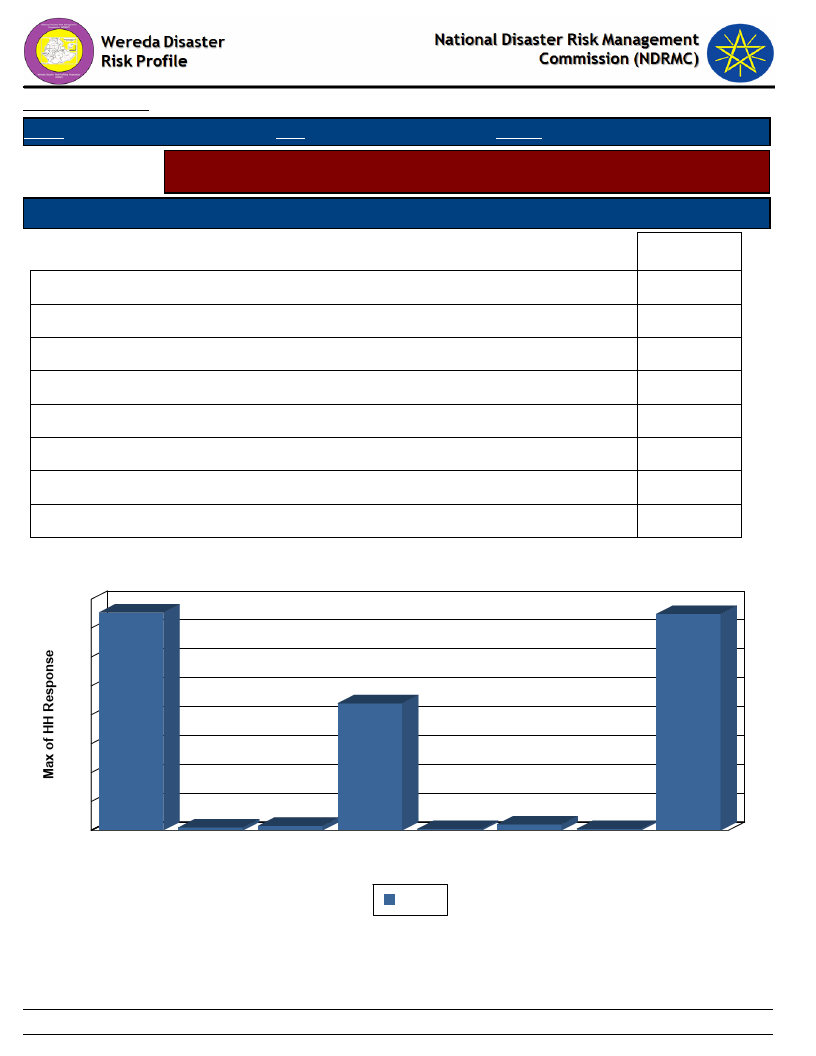
Data_Collected_Date
Region S.N.N.P
Zone WOLAYITA
Thursday, December 12, 2019
Wereda HUMBO
Selected Indicator
Household Access to Drinking Water - Sources of drinking water for households
(response in %)
Sources of drinking water for Households
Priority of the Water Source
Main
Communal tap (Bono)
Covered well or borehole
Open well
Piped water outside the house
Pond or lake (fenced)
Pond or lake (open access)
Rainwater harvesting
River, stream
37.70
0.52
0.79
21.99
0.26
1.05
0.26
37.43
Source of Drinking Water & Type of Source
40
38
37
35
30
25
22
20
15
10
5
1
0
Communal Covered well
tap (Bono) or borehole
1
Open well
0
1
0
Piped water Pond or lake Pond or lake Rainwater River, stream
outside the (fenced)
(open
harvesting
house
access)
Main
220
Page 1 of 1
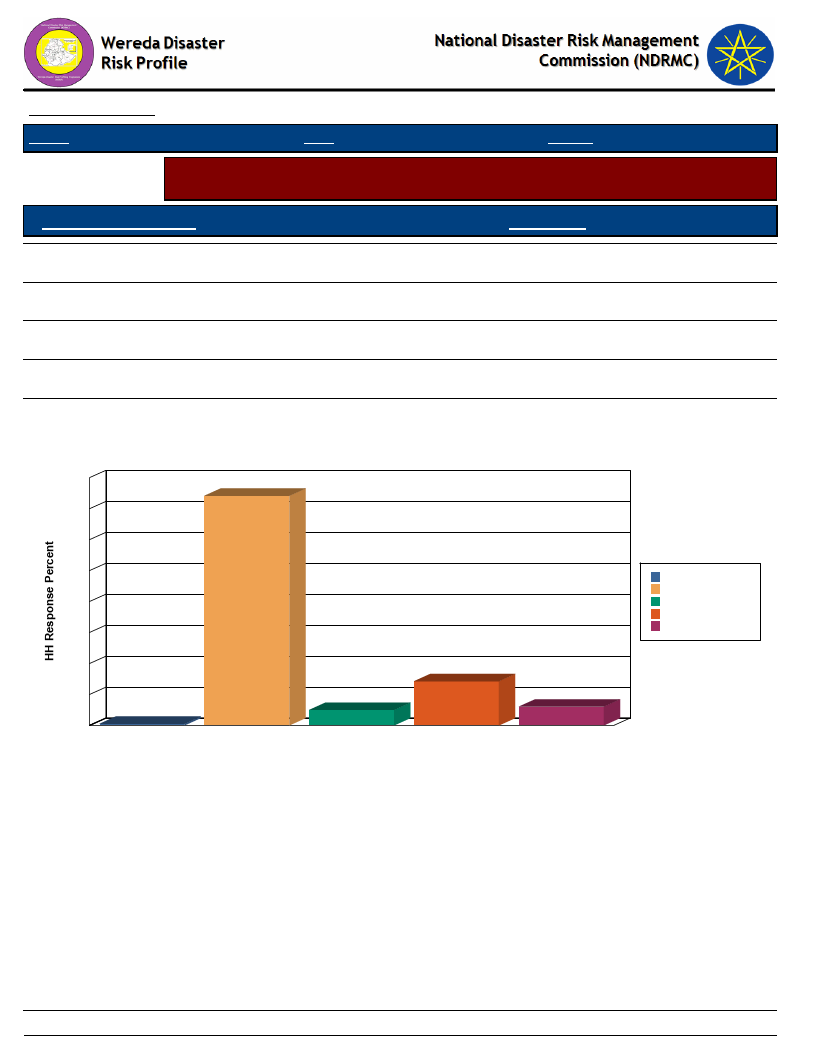
Data_Collected_Date
Region S.N.N.P
Zone WOLAYITA
Thursday, December 12, 2019
Wereda HUMBO
Selected Indicator
Household Access to Drinking Water - Households methods of treating drinking
water
Method of Treating Water
HH Response
Boil
0.53
Water Guard
6.07
Use filter
14.25
Other chemicals
5.01
None
74.14
80
70
60
50
40
30
20
10
1
0
Boil
Method of Treating Water by Households
74
14
5
None
Other chemicals
Use filter
Water Treatment Method
6
Water Guard
Boil
None
Other chemicals
Use filter
Water Guard
221
Page 1 of 1
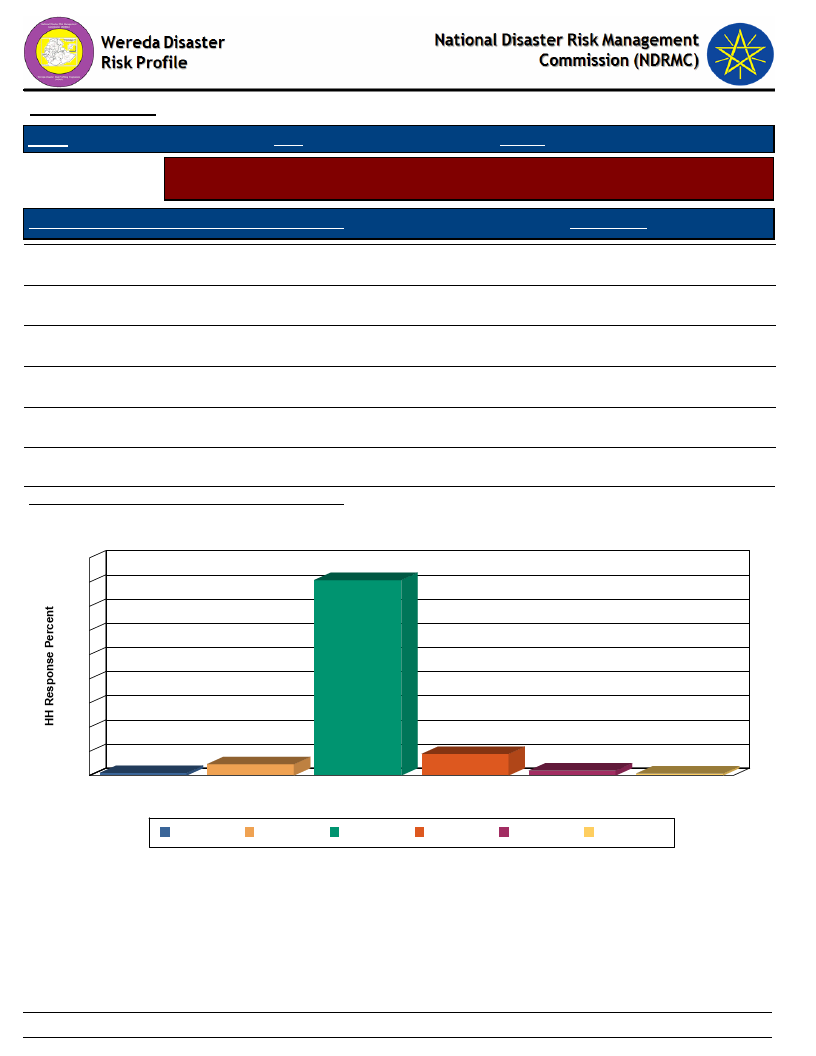
Data_Collected_Date
Thursday, December 12, 2019
Region S.N.N.P
Zone WOLAYITA
Wereda HUMBO
Selected Indicator
Household Access to Drinking Water - Number of times households fetch water
in a week
Number of Times Households Fetch Water in a Week
HH Response
Twice
0.79
Three times
2.09
Four times
4.71
Five times
1.05
Six times
8.90
Seven times
80.89
Average Number of Times HH Fetch Water Per Week
7.30
90
80
70
60
50
40
30
20
10
1
0
Five times
Number of Times HH Fetch Water in a Week
81
9
5
2
Four times
Seven times
Six times
Three times
Number of Times HH Fetch Water in a Week
1
Twice
Five times
Four times
Seven times Six times
Three times
Twice
222
Page 1 of 1
Data_Collected_Date
Thursday, December 12, 2019
Region S.N.N.P
Zone WOLAYITA
Wereda HUMBO
Selected Indicator
Household Access to Drinking Water - Time taken per day to fetch water for
households
Time Taken To Fetch Water
HH Response
Less than 30 min
79.84
30 min - 1 hr
10.73
1 hr and Above
Average Number of Times Taken To Fetch Water
9.42
35.46
Time Taken To Fetch Water for the HH
80
80
70
60
50
40
30
20
9
11
10
0
1 hr and Above
30 min - 1 hr
Less than 30 min
Time Taken To Fetch Water
1 hr and Above
30 min - 1 hr
Less than 30 min
223
Page 1 of 1
WDRP Indicators
Coping Mechanisms and
Preparedness
224

Wereda Disaster Risk
Profile
Data_Collected_Date
Region S.N.N.P
Zone WOLAYITA
National Disaster Risk Management
Commission (NDRMC)
Thursday, December 12, 2019
Wereda HUMBO
Selected Indicator
KebeleName
Capacity: Community Preparedness against Sudden Onset Disasters
Precaution_1
Comment_1
Precaution_2
Comment_2
Precaution_3
Comment_3
ABAYA GUNUCHO
BOSA WANCHE
Evacuation
Evacuation
GALICHA KARA
GUTUTO LARENA
DEMBA KOYISHA
HOBICHA BADA
HOBICHA
BONGOTA
ABELA ZEGRE
KOYISHA GOLA
KODO KANKO
KOYISHA
OGODAMA
Evacuation
Evacuation
Evacuation
Migrating to other
areas.
Evacuation
Evacuation
Evacuation
Evacuation
To escape from the
disaster effect
To save property
and life from
destruction.
To be away from the
impending disaster
To save life and
property
To save life and
property
To save life and
property.
To save life and
property.
In order to save life
and property
To protect life and
property.
Soil and water
conservation
Reporting to the
government
Evacuation
Conservation works
Because, hazard is
out of control for
the community.
To save life and
property damage
Biological and
physical works
Change the
tracing system
225
Page 1 of 3

Wereda Disaster Risk
Profile
Data_Collected_Date
Region S.N.N.P
Zone WOLAYITA
Selected Indicator
KebeleName
Capacity: Community Preparedness against Sudden Onset Disasters
Precaution_1
Comment_1
Precaution_2
AMBE SHOYA
Evacuation
KOYISHA WANGALA
Evacuation
AMPO KOYISHA
Help each other
To protect life and
property.
To protect life and
property
SHOCHORA ABELA
Evacuation
SERE TAWURETA
Evacuation
ABAYA CHOKARE
Evacuation
ELA KEBELA
Evacuation
HOBICHA DIGISO
Reporting to the
government
SHOCHORA OSE
Evacuation
SHOCHORA
OGODAMA
SHOCHORA FESHO
Evacuation
Use water drain and
canals
To protect property
and life
To protect life and
property
To save life and
property
To save life and
property
Disaster is out of
control for the
community
To save life and
property
To save life and
property
To prevent flood
Terracing
Asking the
government
support
Evacuation
226
National Disaster Risk Management
Commission (NDRMC)
Thursday, December 12, 2019
Wereda HUMBO
Comment_2
Precaution_3
Comment_3
To prevent soil
erosion
To cope severity of
disaster
Mulching works Reforestation
To save life and
property
Migration
To assess job
opportunity in
other areas
Page 2 of 3
Wereda Disaster Risk
Profile
Data_Collected_Date
Region S.N.N.P
Zone WOLAYITA
Selected Indicator
KebeleName
Capacity: Community Preparedness against Sudden Onset Disasters
Precaution_1
Comment_1
Precaution_2
ABELA AJAJA
Evacuation
ABELA GEFETA
ANKA WECHA
Evacuation
Evacuation
To escape from the
effect of disaster
To protect property
and life.
National Disaster Risk Management
Commission (NDRMC)
Thursday, December 12, 2019
Wereda HUMBO
Comment_2
Precaution_3
Comment_3
227
Page 3 of 3

Wereda Disaster
Risk Profile
Data_Collected_Date
Region S.N.N.P
Zone WOLAYITA
National Disaster Risk Management
Commission (NDRMC)
Thursday, December 12, 2019
Wereda HUMBO
Selected Indicator
Capacity: Community Preparedness against Increase in Disaster Intensity
KebeleName
Precaution_1
Comment_1
Precaution_2
Comment_2
Precaution_3
Comment_3
ABAYA GUNUCHO
ABELA AJAJA
ABELA GEFETA
ANKA WECHA
BOSA WANCHE
GALICHA KARA
Use and maintain
drainage basis
Strengthening
community
participation
Use water
harvesting
technologies
Forestation
Community based
watershed
management
A forestation
To shape the over
flow of rivers
To mitigate the
disaster effect
Develop methods to
change the
direction of Bilate
river to Abaya river
Introduce water
harvesting
technology
To catch up water
for future use at the
time of drought
The community
keep the soil
fertility.
To mitigate adverse
effects of multi
hazards.
Stocking production
Reforestation
Working additional
income generating
activities
To maintain climate
change
Soil and water
conservation
To decrease the over
flow of Bilate river
For irrigation
practice and being
clean water
accessible
To consume and sell
at the time of
disaster
To gain efficient rain
fall.
For recovery of lost
property.
To mitigate the
effect of the given
potential hazard
Terracing
Improving use
of irrigation,
Migration
To control soil
erosion.
To produce
vegetable and
other crops to
maximize
yields, to assess
other job
opportunity.
228
Page 1 of 4
Wereda Disaster
Risk Profile
Data_Collected_Date
Region S.N.N.P
Zone WOLAYITA
National Disaster Risk Management
Commission (NDRMC)
Thursday, December 12, 2019
Wereda HUMBO
Selected Indicator
Capacity: Community Preparedness against Increase in Disaster Intensity
KebeleName
Precaution_1
Comment_1
Precaution_2
Comment_2
Precaution_3
Comment_3
GUTUTO LARENA
DEMBA KOYISHA
HOBICHA BADA
HOBICHA
BONGOTA
ABELA ZEGRE
KOYISHA GOLA
KODO KANKO
KOYISHA
OGODAMA
Water harvesting
Use water
harvesting
Strengthening of
participatory
watershed
management
Water harvesting
Water harvesting
Water harvesting
A forestation
In order to produce
vegetable and short
time cycle crop
To produce
vegetable and short
cycle crops.
It is very important
to mitigate the
adverse effects of
multi-hazards.
Saving
Saving of the
resources.
Strengthening and
maintaining soil and
water conservation
activities
For consumption and
sell during bad
condition
To consume and for
sell during disaster.
To minimize time of
occurrence and
magnitude of
hazards.
Improving of
working habit
like daily labor
and petty trade
To generate
income for
recovery of
increased
disasters.
To produce
vegetable and short
cycle crops.
To produce
vegetable and short
cycle crop
To produce
vegetables and
short cycle crop
To maintain the
climate condition
Saving and wise use
of resources
For sell during bad
situation.
Saving of the
resources
Saving of property
Water harvesting
technology
To consume and to
sell during the bad
situation.
For consumption in
the worst time and
sell
To produce vegetable
and other crops.
Terracing
To protect soil
fertility
229
Page 2 of 4

Wereda Disaster
Risk Profile
National Disaster Risk Management
Commission (NDRMC)
Data_Collected_Date
Region S.N.N.P
Zone WOLAYITA
Wereda HUMBO
Thursday, December 12, 2019
Selected Indicator
Capacity: Community Preparedness against Increase in Disaster Intensity
KebeleName
Precaution_1
Comment_1
Precaution_2
Comment_2
Precaution_3
Comment_3
AMBE SHOYA
A forestation
KOYISHA WANGALA
Forestation,
AMPO KOYISHA
SHOCHORA ABELA
Strengthening of
soil and water
conservation
activities
A forestation
SERE TAWURETA
A forestation
ABAYA CHOKARE
Migration
ELA KEBELA
Soil and water
conservation
activities
To prevent from
land degradation
To control climate
change
Re forestations
Water harvesting
Irrigation
To maintain climate
Water harvesting
To maintain the
climate
Use of water
harvesting
technology
To assess better job
opportunity
Use of modern
irrigation system
Planting of drought
resistant crops
To improve Soil
fertility
To early maturation
before disaster
happened
Terracing
Tracing
Water
harvesting
structures
To produce
vegetables and
others
To produce vegetable
and other crops
Terracing
Terracing
To maximize crop
production
Daily
employment
Water
harvesting
structures,
Report to the
government
To protect soil
To protect soil
fertility
To protect the
soil fertility and
to prevent soil
erosion
To generate
additional
income
230
Page 3 of 4

Wereda Disaster
Risk Profile
National Disaster Risk Management
Commission (NDRMC)
Data_Collected_Date
Region S.N.N.P
Zone WOLAYITA
Wereda HUMBO
Thursday, December 12, 2019
Selected Indicator
Capacity: Community Preparedness against Increase in Disaster Intensity
KebeleName
Precaution_1
Comment_1
Precaution_2
Comment_2
Precaution_3
Comment_3
HOBICHA DIGISO
Strengthening of
soil and water
conservation
activities
SHOCHORA OSE
Use of water
harvesting system
SHOCHORA
OGODAMA
Use of water
harvesting system
SHOCHORA FESHO
Soil and water
conservation
activities
To prevent and
minimize adverse
effect of disaster
Daily labor work,
Petty trade
To produce
vegetable and short
cycle crops
To produce
vegetable and short
cycle crops
Saving of resources
Saving of the
resources
Construction of
water structures
To generate
additional income
For the future use in
bad situation
To prepare for the
future
To minimize the
impacts of drought
Medication and
vaccination,
Migration
To prevent and
minimize
diseases, To
assess better
job opportunity
Fodder
preparation
To minimize the
impacts of
drought
231
Page 4 of 4

Wereda Disaster
Risk Profile
Data_Collected_Date
Region S.N.N.P
Zone
WOLAYITA
Selected Indicator
Capacity: Community Preparedness against Disasters
Kebele Name
Precaution 1
Comment 1
Precaution 2
ABAYA GUNUCHO
ABELA AJAJA
ABELA GEFETA
Soil and water
conservation
Soil and water
conservation
activities
Planting short
cycle crop
ANKA WECHA
Control soil erosion
To reduce the effect
of flood
To harvest early to
minimize the disaster
effect
To rehabilitate the
areas or to maintain
soil conservation.
Planting drought
resistance crops
Vaccination and
treatment
Planting drought
resistant crops
Planting of
drought
resistant crop
BOSA WANCHE
Soil and water
conservation
activities
ABAYA CHOKARE
Small dam
construction
To minimize the
effects of most
disasters such as,
drought, flood, animal
disease, e.t.c.
To minimize overflow
of the river
Small scale
irrigation
Soil and water
conservation
DEMBA KOYISHA
Planting of short
cycle crops
They are early mature
crops
Planting drought
resistant crops
232
National Disaster Risk Management
Commission (NDRMC)
Thursday, December 12, 2019
Wereda HUMBO
Comment 2
To reduce
disaster effect
Precaution 3
Production of short
cycle crops
Comment 3
To address rainfall
shortage
To reduce the
effect of drought
Saving of assets
To use during the
time hardship
Due to capacity
of adaptability.
To maximize
yield during dry
season.
To prevent
negative effects
of flood
They are more
effective
Re-cultivation the
farm land for short
period cycle crops
Water harvesting
technology,
Vaccination and
medication
Irrigation use,
Shifting livestocks
to pasture
available areas
Protect asset
Early maturation
before the
occurrence of
disaster.
To cope from
scarcity of water,
Prevention and
treatment of
disease.
To maximize crop
production during
dry season, To
prevent animal
death
To use during the
disaster
Page 1 of 4

Wereda Disaster
Risk Profile
Data_Collected_Date
Region S.N.N.P
Zone
WOLAYITA
Selected Indicator
Capacity: Community Preparedness against Disasters
Kebele Name
Precaution 1
Comment 1
Precaution 2
ELA KEBELA
HOBICHA DIGISO
GALICHA KARA
Soil and water
conservation
activity
Soil and water
conservation
activity
Soil and water
conservation
GUTUTO LARENA
Planting of short
time crop cycle
HOBICHA BADA
Soil and water
conservation
HOBICHA
BONGOTA
ABELA ZEGRE
Soil and water
conservation
activities
Planting short
cycle crop
To minimize the
negative effects of
most disasters
To prevent the
negative effect of the
given disaster by
rehabilitation work
Early Mature
To minimize the
impact of flood and
other cascade disaster
Planting of
effective crops
Plant drought
resistant crop
Planting of
drought tolerant
crop
Fodder
preparation,
Water
harvesting, Pond
construction
Assessing of
grazing ands
For immediate disaster
response.
Planting drought
resistant crop
National Disaster Risk Management
Commission (NDRMC)
Thursday, December 12, 2019
Wereda HUMBO
Comment 2
Precaution 3
Comment 3
To fulfill the
food gap during
drought season
To improve the
yield
Medication and
Vaccination,
Sanitation
To prevent
diseases
It resist drought
To reduce
shortage of
water, pasture
and improve
animal health
Vaccination
To treat both
animal and human
disease
To cope drought
hazard.
Improve assets
For selling and to
cope the disaster.
233
Page 2 of 4

Wereda Disaster
Risk Profile
Data_Collected_Date
Region S.N.N.P
Zone
WOLAYITA
Selected Indicator
Capacity: Community Preparedness against Disasters
Kebele Name
Precaution 1
Comment 1
Precaution 2
KODO KANKO
KOYISHA GOLA
KOYISHA
OGODAMA
KOYISHA
WANGALA
Planting of short
cycle crop
Planting of short
cycle crop
Soil and water
conservation
Water and soil
conservation
AMBE SHOYA
Soil and water
conservation
Early mature to
disaster
Early mature to cope
disaster
To prevent soil
fertility
To rehabilitate the
areas and maintain
conservation
To rehabilitate the
area
Planting of
Drought
Resistant crop
Planting of
drought
resistant crops
Planting of
drought
resistant crop
Re-cultivate to
hand that farm
land for shunt
cycle crop
Planting of
drought
resistant crops
AMPO KOYISHA
Soil and water
conservation
activities
To mitigate and
prevent adverse effect
of flood and drought
hazards.
Use of Irrigation
234
National Disaster Risk Management
Commission (NDRMC)
Thursday, December 12, 2019
Wereda HUMBO
Comment 2
To cope with
facing drought
Precaution 3
Comment 3
Those have a
capacity to cope
the effect.
To cope drought
hazard
Re-cultivate the
farm land
Early maturation
before disaster
Early maturation
before disaster
occur
Planting of drought
resistant crop
Due to capacity
adaptation
Due to the
ability to resist
the impact
There is water
access for
irrigation. To
prevent negative
effects of
drought.
Re-cultivation of
the farm land
Fodder
preparation, Use of
improved seeds
Planting of short
cycle crops for
early mature to
cope the disaster
impacts.
To get more yield
and resist crop
pests.
Page 3 of 4

Wereda Disaster
Risk Profile
Data_Collected_Date
Region S.N.N.P
Zone
WOLAYITA
Selected Indicator
Capacity: Community Preparedness against Disasters
Kebele Name
Precaution 1
Comment 1
Precaution 2
SERE TAWURETA
Soil and water
conservation
SHOCHORA
ABELA
Soil and water
conservation
SHOCHORA
FESHO
Soil and water
conservation
activities
To rehabilitate the
area into normal
situation
Re-harvesting the
mountainous area to
conserve
To mitigate the effects
of flood
Planting of
drought
resistant crops
Planting of
drought
resistant crop
Selling of
domestic
animals
SHOCHORA
OGODAMA
Planting of short
cycle crop
SHOCHORA OSE
Planting of short
cycle crop
They are early mature
for disaster to cope
the effect.
They are early mature
for disaster.
Planting of
drought
resistant crops
Planting of
drought
resistant crops
National Disaster Risk Management
Commission (NDRMC)
Thursday, December 12, 2019
Wereda HUMBO
Comment 2
The are effective
Due to their
capacity to resist
the impact
To cope drought
They have a
capacity to resist
a drought effect.
They have a
capacity to resist
the impact of
drought.
Precaution 3
Planting of short
cycle crops
Re-cultivation of
farm land
Medical treatment,
Fodder preparation
Comment 3
They are early
mature to cope
disaster
Early maturation
before the disaster
To prevent human
disease, To store
grass for animal
feed
235
Page 4 of 4

Wereda Disaster
Risk Profile
Data_Collected_Date
Region S.N.N.P
Zone
WOLAYITA
Selected Indicator
Kebele Name
Hazard: Coping and recovering during last Disaster
ABAYA CHOKARE
Type of Disaster(s)
Coping_Strategy
Flood
Evacuation
Description
Medium status of recover, because of loss of crop, properties and assets
Recovery_Strategy
Out migration from the area, Daily labor works
Description
Community
Participation_Ways
Description
Medium status of recover, because of loss of crop, properties and assets
Plowing of land, Borrowing of money
Medium status of recover, because of loss of crop, properties and assets
Kebele Name
Type of Disaster(s)
Coping_Strategy
Description
Recovery_Strategy
Description
Community
Participation_Ways
Description
ABAYA GUNUCHO
Flood
Daily laborer
Some of them cope the disaster effect
Re cultivation of farm lands
Recovered from the disaster by planting short cycle crops
Borrowing money
It was effective
236
National Disaster Risk Management
Commission (NDRMC)
Thursday, December 12, 2019
Wereda HUMBO
Page 1 of 13

Wereda Disaster
Risk Profile
Data_Collected_Date
Region S.N.N.P
Zone
WOLAYITA
Selected Indicator
Kebele Name
Hazard: Coping and recovering during last Disaster
ABELA AJAJA
Type of Disaster(s)
Coping_Strategy
Flood
Description
Recovery_Strategy
Description
Community
Participation_Ways
Description
Kebele Name
Type of Disaster(s)
Coping_Strategy
Description
Recovery_Strategy
Description
Community
Participation_Ways
Description
ABELA GEFETA
Drought
Engage in daily labor work, selling wood
Cope the disaster in some extent
Building house hold asset using government support
Recovered from the disaster effect in some extent
Borrowing and lending money, Ox and other properties
Common practice
237
National Disaster Risk Management
Commission (NDRMC)
Thursday, December 12, 2019
Wereda HUMBO
Page 2 of 13
Wereda Disaster
Risk Profile
Data_Collected_Date
Region S.N.N.P
Zone
WOLAYITA
National Disaster Risk Management
Commission (NDRMC)
Thursday, December 12, 2019
Wereda HUMBO
Selected Indicator
Kebele Name
Hazard: Coping and recovering during last Disaster
ABELA ZEGRE
Type of Disaster(s)
Coping_Strategy
Drought
Daily labor work, Support by government, Selling of wood and grass
Description
Some of them have a capacity to cope, Most of them have problem to secure food
Recovery_Strategy
By building assets like, buying animals, Support by government.
Description
Community
Participation_Ways
Description
How ever their income was lost, they try to rehabilitee for the future.
By borrowing money and ox, Cultivation of land with in a group.
They are affected and well awared.
Kebele Name
Type of Disaster(s)
Coping_Strategy
Description
Recovery_Strategy
Description
Community
Participation_Ways
Description
AMBE SHOYA
Drought
Daily labor works, Selling of sheep and goats
Re-cultivation of the land, Use short cycle crops
Re-cultivate the land, Use short cycle crop
Early mature crops
The community help each other
To cope the impacts of disaster in cooperation.
238
Page 3 of 13

Wereda Disaster
Risk Profile
Data_Collected_Date
Region S.N.N.P
Zone
WOLAYITA
Selected Indicator
Kebele Name
Hazard: Coping and recovering during last Disaster
AMPO KOYISHA
Type of Disaster(s)
Coping_Strategy
Flood
Maintenance of water ways and cut-off drain, Restocking, Searching of fodder
Description
To minimize adverse effects of flood
Recovery_Strategy
Description
Community
Participation_Ways
Description
Borrowing of money and farming animals
National Disaster Risk Management
Commission (NDRMC)
Thursday, December 12, 2019
Wereda HUMBO
Kebele Name
Type of Disaster(s)
Coping_Strategy
Description
Recovery_Strategy
Description
Community
Participation_Ways
Description
ANKA WECHA
Drought
Evacuation, Place of change, Daily labor work
Some of them have a capacity to recover from the disaster to save their properties and life
To keep soil fertility
Most of them have used planting short cycle crop for recover for the future
The communities help each other
To cope from the disaster the cooperation was effective
239
Page 4 of 13

Wereda Disaster
Risk Profile
Data_Collected_Date
Region S.N.N.P
Zone
WOLAYITA
Selected Indicator
Kebele Name
Hazard: Coping and recovering during last Disaster
BOSA WANCHE
Type of Disaster(s)
Coping_Strategy
Flood
Evacuation, Diverting of flood way.
Description
Coped to some extent, but not total recover.
Recovery_Strategy
Restocking of crop, Livestock selling, Petty trade, Wood selling.
Description
Community
Participation_Ways
Description
Partial recover
Borrowing of farming animals and materials, Borrowing of some money.
Fill some gap fro few weeks, but not total recover.
Kebele Name
Type of Disaster(s)
Coping_Strategy
Description
Recovery_Strategy
Description
Community
Participation_Ways
Description
DEMBA KOYISHA
Drought
Daily labor, support by government
Some of them cope but most of them have problem to secure food
By building asset like buying animals
There income would increase to rehabilitate the future disaster
By borrowing money and ox , cultivation of land with each other
It is effective
240
National Disaster Risk Management
Commission (NDRMC)
Thursday, December 12, 2019
Wereda HUMBO
Page 5 of 13

Wereda Disaster
Risk Profile
Data_Collected_Date
Region S.N.N.P
Zone
WOLAYITA
Selected Indicator
Kebele Name
Hazard: Coping and recovering during last Disaster
ELA KEBELA
Type of Disaster(s)
Coping_Strategy
Animal disease
Restocking
Description
Recovery_Strategy
Petty trade, Borrowing of money, Buying of sheep and goats be half of cow
Description
Community
Participation_Ways
Description
Borrowing of money and farming animals, Co-growing of livestock
National Disaster Risk Management
Commission (NDRMC)
Thursday, December 12, 2019
Wereda HUMBO
Kebele Name
Type of Disaster(s)
Coping_Strategy
Description
Recovery_Strategy
Description
Community
Participation_Ways
Description
GALICHA KARA
Drought
Daily labor
Daily labor work on crop production activity were effective to cope with during the incident
Building rehabilitation measures and re cultivation of farmland
It plays great role in improving soil fertility
Through Borrowing and lending recourses
It is important measure to cope and recover before and after the disaster
241
Page 6 of 13

Wereda Disaster
Risk Profile
Data_Collected_Date
Region S.N.N.P
Zone
WOLAYITA
Selected Indicator
Kebele Name
Hazard: Coping and recovering during last Disaster
GUTUTO LARENA
Type of Disaster(s)
Coping_Strategy
Drought
Petty trade, labor work
Description
They are very important to cope up with the problems
Recovery_Strategy
By using modern farming technologies
Description
Community
Participation_Ways
Description
It is best option to recover from the crisis
Bowering money and ox each other, Working together
They have awareness
Kebele Name
Type of Disaster(s)
Coping_Strategy
Description
Recovery_Strategy
Description
Community
Participation_Ways
Description
HOBICHA BADA
Flood
Strengthening of other water sources, Evacuation plan, Restocking, migration
There is some capacity but not enough to recover
Petty trade, daily labor, Migration, restocking
There is some capacity but not enough to recover
Helping by food, Borrowing of farm animals, co-plowing
There is some capacity but not enough to recover
National Disaster Risk Management
Commission (NDRMC)
Thursday, December 12, 2019
Wereda HUMBO
242
Page 7 of 13

Wereda Disaster
Risk Profile
Data_Collected_Date
Region S.N.N.P
Zone
WOLAYITA
Selected Indicator
Kebele Name
Hazard: Coping and recovering during last Disaster
HOBICHA BONGOTA
National Disaster Risk Management
Commission (NDRMC)
Thursday, December 12, 2019
Wereda HUMBO
Type of Disaster(s)
Coping_Strategy
Animal Disease
Medical treatment, Provide fodder.
Description
Recovery_Strategy
Use other farming techniques, Collection of fodder, Bringing of breeding animals from other areas.
Description
Community
Participation_Ways
Description
Borrowing of farming animals
Kebele Name
Type of Disaster(s)
Coping_Strategy
Description
Recovery_Strategy
Description
Community
Participation_Ways
Description
HOBICHA DIGISO
Drought
Livestock selling, Shifting of livestock to pasture available area, Saving of food supplies, Restocking of crop
Not total recover
Daily labor work, Petty trade, Restocking of crop, Aid from government and NGOs
Not total recover
Borrowing of money and farming animals, Support of food for each other
Not total recover
243
Page 8 of 13

Wereda Disaster
Risk Profile
Data_Collected_Date
Region S.N.N.P
Zone
WOLAYITA
Selected Indicator
Kebele Name
Hazard: Coping and recovering during last Disaster
KODO KANKO
Type of Disaster(s)
Coping_Strategy
Drought
Labor work, Petty Trade
Description
To cover food gap
Recovery_Strategy
Livelihood diversification
Description
Community
Participation_Ways
Description
In order to rehabilitate
Borrowing money and ox, Using land together
They are effective and work together
Kebele Name
Type of Disaster(s)
Coping_Strategy
Description
Recovery_Strategy
Description
Community
Participation_Ways
Description
KOYISHA GOLA
Drought
Daily labor work, aid by government, Selling of woods and grass
Medium to cope
rebuilding assets, aid by government
They have some capacity to rehabilitate.
Borrowing money and ox cultivate of the land
They are well aware
244
National Disaster Risk Management
Commission (NDRMC)
Thursday, December 12, 2019
Wereda HUMBO
Page 9 of 13

Wereda Disaster
Risk Profile
Data_Collected_Date
Region S.N.N.P
Zone
WOLAYITA
Selected Indicator
Kebele Name
Hazard: Coping and recovering during last Disaster
KOYISHA OGODAMA
Type of Disaster(s)
Coping_Strategy
Drought
Daily labor works
Description
Some of them have some capacity to cope.
Recovery_Strategy
Re-cultivation of farm land
Description
Community
Participation_Ways
Description
Use of planting short cycle crops.
Support each other
To cope from disaster
Kebele Name
Type of Disaster(s)
Coping_Strategy
Description
Recovery_Strategy
Description
Community
Participation_Ways
Description
KOYISHA WANGALA
Drought
Labor work
To recover any food and non food gap
Reforestation, Forestation
To build continues soil fertilities,
Helping each other
They are effective in cooperation to cope with disaster
245
National Disaster Risk Management
Commission (NDRMC)
Thursday, December 12, 2019
Wereda HUMBO
Page 10 of 13

Wereda Disaster
Risk Profile
Data_Collected_Date
Region S.N.N.P
Zone
WOLAYITA
Selected Indicator
Kebele Name
Hazard: Coping and recovering during last Disaster
SERE TAWURETA
Type of Disaster(s)
Coping_Strategy
Drought
Daily labor, Place of change
Description
Some of them can cope the disaster
Recovery_Strategy
By saving asset, Re-cultivating
Description
Community
Participation_Ways
Description
Planting short cycle crops
Supporting each other
Cooperation make the effective to cope disaster
Kebele Name
Type of Disaster(s)
Coping_Strategy
Description
Recovery_Strategy
Description
Community
Participation_Ways
Description
SHOCHORA ABELA
Drought
Daily labor work
Some of them have a capacity to cope.
Re-cultivation of farm land
Planting short cycle crop for recovery
The communities support each other
Cooperation to cope the impacts of disaster
246
National Disaster Risk Management
Commission (NDRMC)
Thursday, December 12, 2019
Wereda HUMBO
Page 11 of 13

Wereda Disaster
Risk Profile
Data_Collected_Date
Region S.N.N.P
Zone
WOLAYITA
Selected Indicator
Kebele Name
Hazard: Coping and recovering during last Disaster
SHOCHORA FESHO
Type of Disaster(s)
Coping_Strategy
Flood
Small dam construction, Cut off drain construction and water way
Description
To prevent run off
Recovery_Strategy
Sowing of crop, Soil and water conservation
Description
Community
Participation_Ways
Description
Buying of assets to recover, Borrowing of money and other working materials
National Disaster Risk Management
Commission (NDRMC)
Thursday, December 12, 2019
Wereda HUMBO
Kebele Name
Type of Disaster(s)
Coping_Strategy
Description
Recovery_Strategy
Description
Community
Participation_Ways
Description
SHOCHORA OGODAMA
Drought
Daily labor work, Support by government, Selling of wood and grass
Some of them have a capacity to cope but, others are in problem to secure food.
Rebuilding of assets, Support by government
To rehabilitate for the future
Borrowing of money, Cultivation of land
They are well awared.
247
Page 12 of 13
Wereda Disaster
Risk Profile
Data_Collected_Date
Region S.N.N.P
Zone
WOLAYITA
Selected Indicator
Kebele Name
Hazard: Coping and recovering during last Disaster
SHOCHORA OSE
Type of Disaster(s)
Coping_Strategy
Drought
Daily labor work, Support by government
Description
Some of the have a capacity to come, but others are in problem to secure food.
Recovery_Strategy
Re building of assets, Support by government
Description
Community
Participation_Ways
Description
To rehabilitate for the future
Borrowing money and farming animals, Cultivation of land
They are well awared
National Disaster Risk Management
Commission (NDRMC)
Thursday, December 12, 2019
Wereda HUMBO
248
Page 13 of 13

Data_Collected_Date
Region S.N.N.P
Zone WOLAYITA
Selected Indicator
Capacity: Type Community Participation
Kebele Name
Levels_Comm_Participation
ABAYA GUNUCHO
ABELA AJAJA
ABELA GEFETA
ANKA WECHA
BOSA WANCHE
GALICHA KARA
GUTUTO LARENA
HOBICHA
BONGOTA
HOBICHA BADA
ABELA ZEGRE
KOYISHA GOLA
KODO KANKO
KOYISHA
OGODAMA
AMBE SHOYA
KOYISHA
WANGALA
AMPO KOYISHA
SHOCHORA ABELA
DEMBA KOYISHA
SERE TAWURETA
ABAYA CHOKARE
Weak
Medium
Strong coordination
Medium
Good
Weak
Strong cooperation regarding all activities
Good situation
Good
Strong
Strong cooperation in all activities
Strong cooperation regarding all activities
Weak
Weak
Week
Good
Weak
Strong cooperation in all activities
Weak
Good
249
Thursday, December 12, 2019
Wereda HUMBO
Changes_In_Last_Decade
Increase
Improved
Increase
Decreased
Increased
Increase
Now, It is better.
Better
Increased
Increased
increase
Increased
Increased
Increase
Increased
Increased
Increased
Increased
Better
Page 1 of 2

Data_Collected_Date
Region S.N.N.P
Zone WOLAYITA
Selected Indicator
Capacity: Type Community Participation
Kebele Name
Levels_Comm_Participation
ELA KEBELA
HOBICHA DIGISO
SHOCHORA OSE
SHOCHORA
OGODAMA
SHOCHORA FESHO
Good
Medium
Strong cooperation in all activates
Strong cooperation in different activities
Medium
Thursday, December 12, 2019
Wereda HUMBO
Changes_In_Last_Decade
Declined
Decreased
Increased
Increased
Increased
250
Page 2 of 2
Data_Collected_Date
Region S.N.N.P
Zone WOLAYITA
Thursday, December 12, 2019
Wereda HUMBO
Selected Indicator
Capacity: Recovery from Losses from Disasters - Percentage of Households who
have managed to recover from losses of disasters
Percentage of households who have managed to recover from losses of disasters
Comments
51.90 %
251
Page 1 of 1

Wereda Disaster
Risk Profile
National Disaster Risk Management
Commission (NDRMC)
Data_Collected_Date
Region S.N.N.P
Zone WOLAYITA
Wereda HUMBO
Thursday, December 12, 2019
Selected Indicator
Capacity: Coping Strategies Adopted by Households - Main coping strategies adopted by households to recover
from respective losses
Type of Coping Strategy Adopted
Type of Loss
Begging for money or for food
Borrowing of food or cash
(including purchasing food on
credit)
Collection of wild food
Consumption rather than sale
of crop surplus
252
Page 1 of 5

Wereda Disaster
Risk Profile
National Disaster Risk Management
Commission (NDRMC)
Data_Collected_Date
Region S.N.N.P
Zone WOLAYITA
Wereda HUMBO
Thursday, December 12, 2019
Selected Indicator
Capacity: Coping Strategies Adopted by Households - Main coping strategies adopted by households to recover
from respective losses
Type of Coping Strategy Adopted
Type of Loss
Increased working hours
Limit portion size at meals
Long-term / permanent
migration (including distress
migration of whole families)
Others -
253
Page 2 of 5

Wereda Disaster
Risk Profile
National Disaster Risk Management
Commission (NDRMC)
Data_Collected_Date
Region S.N.N.P
Zone WOLAYITA
Wereda HUMBO
Thursday, December 12, 2019
Selected Indicator
Capacity: Coping Strategies Adopted by Households - Main coping strategies adopted by households to recover
from respective losses
Type of Coping Strategy Adopted
Type of Loss
Reduce number of meals eaten
in a day
Reduced expenditure on health
and education (including taking
children out of school)
Reduced expenditure on
non-essential items (beer,
cigarettes, clothes, meat, etc.)
Reduced expenditure on
productive inputs (fertilizer,
seeds, livestock drugs, etc.)
254
Page 3 of 5
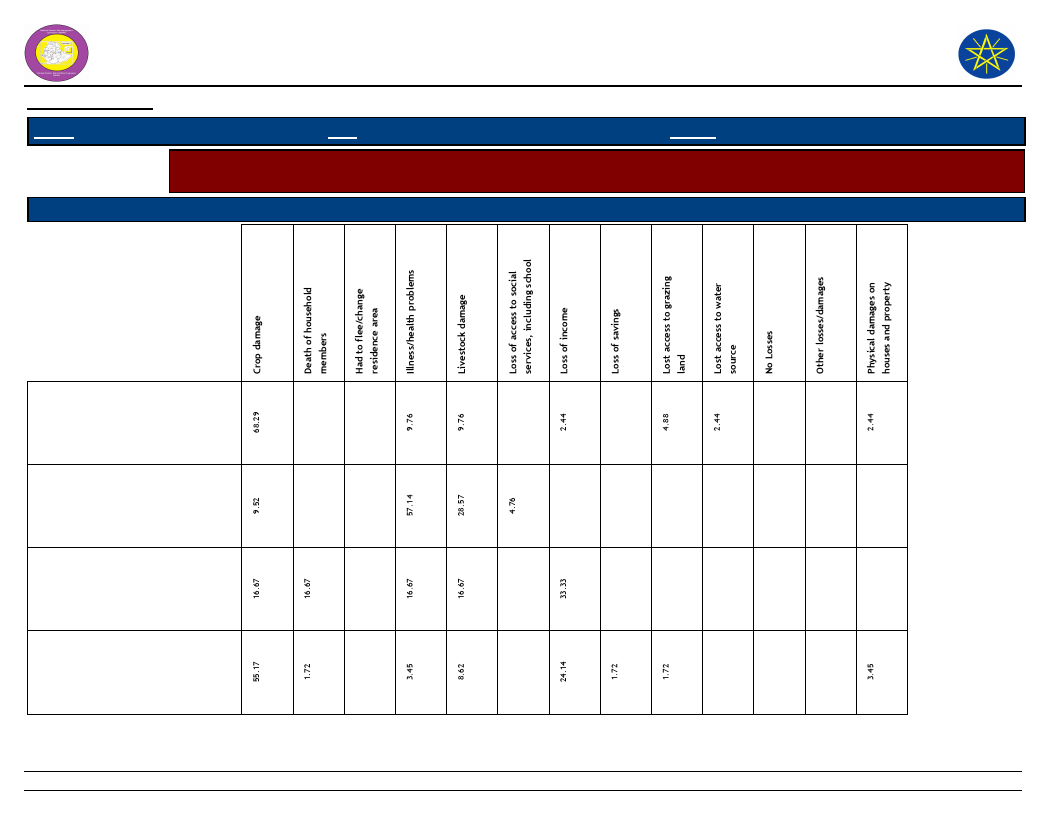
Wereda Disaster
Risk Profile
National Disaster Risk Management
Commission (NDRMC)
Data_Collected_Date
Region S.N.N.P
Zone WOLAYITA
Wereda HUMBO
Thursday, December 12, 2019
Selected Indicator
Capacity: Coping Strategies Adopted by Households - Main coping strategies adopted by households to recover
from respective losses
Type of Coping Strategy Adopted
Type of Loss
Rely on less preferred and less
expensive food
Sale of non-productive assets
(Jewelry, clothing, etc.)
Sale of productive assets (land,
farm implements, vehicle, etc.)
Seek alternative or additional
jobs
255
Page 4 of 5
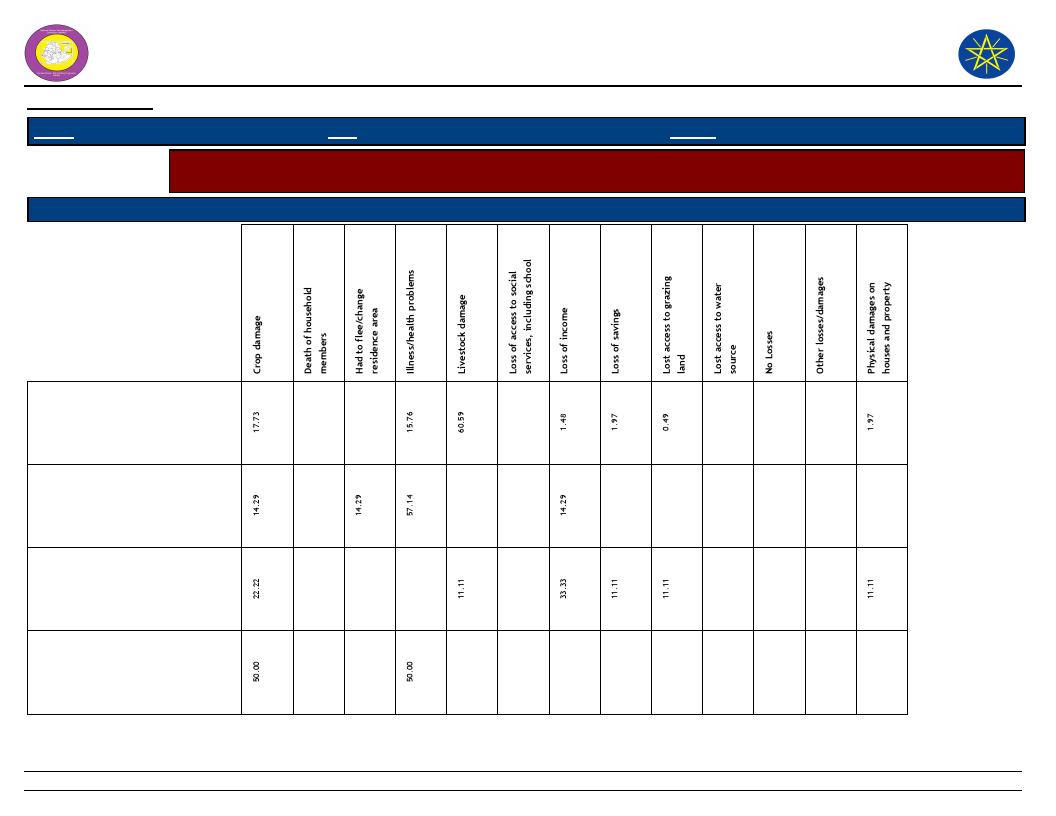
Wereda Disaster
Risk Profile
National Disaster Risk Management
Commission (NDRMC)
Data_Collected_Date
Region S.N.N.P
Zone WOLAYITA
Wereda HUMBO
Thursday, December 12, 2019
Selected Indicator
Capacity: Coping Strategies Adopted by Households - Main coping strategies adopted by households to recover
from respective losses
Type of Coping Strategy Adopted
Type of Loss
Sell more livestock than usual
Sending children of household
for work
Short-term / seasonal labor
migration
Skip entire day without eating
256
Page 5 of 5
Data_Collected_Date
Thursday, December 12, 2019
Region S.N.N.P
Zone WOLAYITA
Wereda HUMBO
Selected Indicator
Capacity: Coping Strategies Adopted by Households - Percentage of households
by frequency of main coping strategies adopted
Type of Coping Strategy Adopted
Frequency of Adoption
Begging for money or for food
Borrowing of food or cash (including purchasing
food on credit)
Collection of wild food
Consumption rather than sale of crop surplus
Increased working hours
Limit portion size at meals
Long-term / permanent migration (including
distress migration of whole families)
Others -
Reduce number of meals eaten in a day
Reduced expenditure on health and education
(including taking children out of school)
Reduced expenditure on non-essential items
(beer, cigarettes, clothes, meat, etc.)
Reduced expenditure on productive inputs
(fertilizer, seeds, livestock drugs, etc.)
100.00
1.32
18.42
36.84
43.42
58.33
8.33
25.00
8.33
1.02
4.57
37.06
51.27
6.09
5.00
15.00
40.00
40.00
4.00
12.00
52.00
32.00
100.00
5.56
5.56
22.22
66.67
7.69
23.08
15.38
53.85
50.00
50.00
6.82
9.09
25.00
54.55
4.55
40.00
60.00
257
Page 1 of 2
Data_Collected_Date
Thursday, December 12, 2019
Region S.N.N.P
Zone WOLAYITA
Wereda HUMBO
Selected Indicator
Capacity: Coping Strategies Adopted by Households - Percentage of households
by frequency of main coping strategies adopted
Type of Coping Strategy Adopted
Frequency of Adoption
Rely on less preferred and less expensive food
Sale of non-productive assets (Jewelry, clothing,
etc.)
Sale of productive assets (land, farm implements,
vehicle, etc.)
Seek alternative or additional jobs
Sell more livestock than usual
Sending children of household for work
Short-term / seasonal labor migration
Skip entire day without eating
7.32
21.95
43.90
26.83
50.00
45.00
5.00
16.67
83.33
3.51
21.05
31.58
42.11
1.75
10.78
54.41
32.84
1.96
57.14
42.86
12.50
37.50
50.00
50.00
50.00
258
Page 2 of 2

Wereda Disaster
Risk Profile
Data_Collected_Date
National Disaster Risk Management
Commission (NDRMC)
Thursday, December 12, 2019
Region S.N.N.P
Zone WOLAYITA
Wereda HUMBO
Selected Indicator
Kebele Name
ABAYA GUNUCHO
ABELA AJAJA
ABELA GEFETA
ANKA WECHA
BOSA WANCHE
Capacity: Alternative Livelihood Sources - Alternative livelihood sources suggested by the community
Work_Option_1
Comment_1
Work_Option_2
Comment_2
Work_Option_3
Daily laborer
Fuel wood sell
Existence of labor
works in the
neighboring towns
Selling sheep and
Goats
They have shoats
Charcoal sell
Petty trading
Migration
Petty trade
Daily labor work
Wood selling
To get cash income
Seeking for better job
opportunity.
Accessibility to get
resource.
Selling fire wood
Petty Trade
Petty trade
There is wood in the
area
In the areas low petty
trade and stop farm
activities.
Because, there is low
petty trade in the area.
Small scale
irrigation
GALICHA KARA
GUTUTO LARENA
DEMBA KOYISHA
HOBICHA BADA
Daily labor work
Daily labor
Petty trade
Daily labor
activities,
It is alternative
measure to get
income
Few people were
engaged in petty
trade
Better job
opportunity
Petty trade
Petty trade
Petty trade
Stop farm activity is the
alternative income
source
Easy way to recover for
them
low market activity in
the area
Charcoal sell
Comment_3
There is access
of water in
some part of
the area.
wood
availability
259
Page 1 of 3
Wereda Disaster
Risk Profile
Data_Collected_Date
National Disaster Risk Management
Commission (NDRMC)
Thursday, December 12, 2019
Region S.N.N.P
Zone WOLAYITA
Wereda HUMBO
Selected Indicator
Kebele Name
HOBICHA
BONGOTA
ABELA ZEGRE
KOYISHA GOLA
KODO KANKO
KOYISHA
OGODAMA
AMBE SHOYA
KOYISHA
WANGALA
AMPO KOYISHA
SHOCHORA ABELA
SERE TAWURETA
Capacity: Alternative Livelihood Sources - Alternative livelihood sources suggested by the community
Work_Option_1
Comment_1
Cutting of trees
for charcoal
production
Petty trade
Low petty trade
practice
Petty trade
Low petty trade
practice
Petty Trade
Less number of petty
trader people in the
area
Daily labor work
Seeking of better job
opportunity
Carpentry
It uses for the
community as a good
option, but not
enough.
Daily labor
better job
opportunity
Daily employment
works
Daily labor work
Better job
opportunity
Daily labor work
Better job
opportunity
Work_Option_2
Co-plowing with
neighbors
Selling grass and
wood
Selling grass and
wood
Labor work
Petty trade
Daily labor work
Petty trade
Petty trade
Petty trade
Petty trade
260
Comment_2
Work_Option_3
Daily labor
There is sufficient
resource in the area.
There is some amount of
resources.
Low petty trade
practice
For better job
opportunity
Petty trade
Their is low off farm
activities in the area
Low petty trade
practice and off-farm
activities.
Low petty trade
practice in the area
Saving of
resources
Comment_3
Some of the
community
Low petty
trade practice
Page 2 of 3
Wereda Disaster
Risk Profile
Data_Collected_Date
National Disaster Risk Management
Commission (NDRMC)
Thursday, December 12, 2019
Region S.N.N.P
Zone WOLAYITA
Wereda HUMBO
Selected Indicator
Kebele Name
ABAYA CHOKARE
Capacity: Alternative Livelihood Sources - Alternative livelihood sources suggested by the community
Work_Option_1
Comment_1
Work_Option_2
Comment_2
Work_Option_3
Daily employment
opportunity
Seeking of job
opportunities
Charcoal
production
Access of resources
Co-plowing with
neighbors
ELA KEBELA
Petty trade
Fuel wood selling,
Livestock trade
HOBICHA DIGISO
Daily labor work
SHOCHORA OSE
Petty trade
SHOCHORA
OGODAMA
SHOCHORA FESHO
Petty trade
Petty trade
For better job
opportunity
Low petty trade
practice in the area
Low petty trade
practice in the area
Daily
employment
work at woreda
main city
Petty trade
There is low petty trade
practice in the area.
Selling of grass
and wood
Daily
employment
There is some amount of
resources to individuals.
Comment_3
Presence of
economically
better farmers
with in kebele
261
Page 3 of 3
Data_Collected_Date
Region S.N.N.P
Zone WOLAYITA
Thursday, December 12, 2019
Wereda HUMBO
Selected Indicator
Type of Disaster
Capacity: Recovery from Losses from Disasters - Percentage of households
recovered from past disasters by type of Disasters
Recovered Percentage
Drought
44.05
Flood
16.71
Crop diseases
4.30
Livestock diseases
22.53
Human diseases
11.65
Conflicts
0.25
Economic / Price shock
0.25
Road Accident
0.25
262
Page 1 of 1
Data_Collected_Date
Region S.N.N.P
Zone WOLAYITA
Thursday, December 12, 2019
Wereda HUMBO
Selected Indicator:
Capacity: Recovery from Losses from Disasters - Proportion of households
recovered by type of Losses
Type of Loss
Percentage
Physical damages on houses and property
4.34
Crop damage
47.70
Livestock damage
24.74
Death of household members
1.28
Illness/health problems
11.48
Loss of access to social services, including school
0.26
Loss of income
6.12
Loss of savings
2.30
Lost access to grazing land
0.51
Lost access to water source
0.26
Had to flee/change residence area
0.77
Other losses/damages
0.26
263
Page 1 of 1
Data_Collected_Date
Region S.N.N.P
Zone WOLAYITA
Thursday, December 12, 2019
Wereda HUMBO
Selected Indicator
Capacity: Coping Options if More Resources Available - What coping strategy
could be adopted if more resource were available?
Coping Strategy To Be Adopted
Adaptation of economic activities to hazards season (e.g. cropping cycle, short term
crops, etc.)
Storage of food and other necessities
Response (%)
44.62
25.46
Physical protection of buildings and property
21.00
Changing residence area/migration
1.57
Others (specify)
6.04
None
1.31
264
Page 1 of 1

Data_Collected_Date
Thursday, December 12, 2019
Region S.N.N.P
Selected Indictor:
Zone WOLAYITA
Wereda HUMBO
Capacity: Coping Strategies Adopted by Households - Percentage of households by
major type of coping strategies adopted (at least once)
Coping Strategy Adopted
Main Strategy
Secondary Strategy
Reduced expenditure on non-essential items (beer, cigarettes,
clothes, meat, etc.)
Consumption rather than sale of crop surplus
6.04
25.71
9.62
11.74
Sell more livestock than usual
26.74
10.33
Borrowing of food or cash (including purchasing food on credit)
9.77
12.44
Sale of non-productive assets (Jewelry, clothing, etc.)
2.70
6.57
Sale of productive assets (land, farm implements, vehicle, etc.)
0.90
1.88
Sending children of household for work
0.90
1.41
Reduced expenditure on health and education (including taking
children out of school)
Reduced expenditure on productive inputs (fertilizer, seeds,
livestock drugs, etc.)
Short-term / seasonal labor migration
0.51
0.94
0.64
1.41
1.16
0.94
Long-term / permanent migration (including distress migration of
whole families)
Increased working hours
0.13
0.23
2.57
6.57
Seek alternative or additional jobs
7.46
8.22
Collection of wild food
1.54
0.23
Rely on less preferred and less expensive food
5.27
14.55
265
Page 1 of 2

Data_Collected_Date
Thursday, December 12, 2019
Region S.N.N.P
Selected Indictor:
Zone WOLAYITA
Wereda HUMBO
Capacity: Coping Strategies Adopted by Households - Percentage of households by
major type of coping strategies adopted (at least once)
Coping Strategy Adopted
Main Strategy
Secondary Strategy
Limit portion size at meals
3.34
8.22
Begging for money or for food
0.13
Reduce number of meals eaten in a day
1.67
0.70
Skip entire day without eating
0.26
3.05
Others -
2.57
0.23
Others -
0.47
266
Page 2 of 2
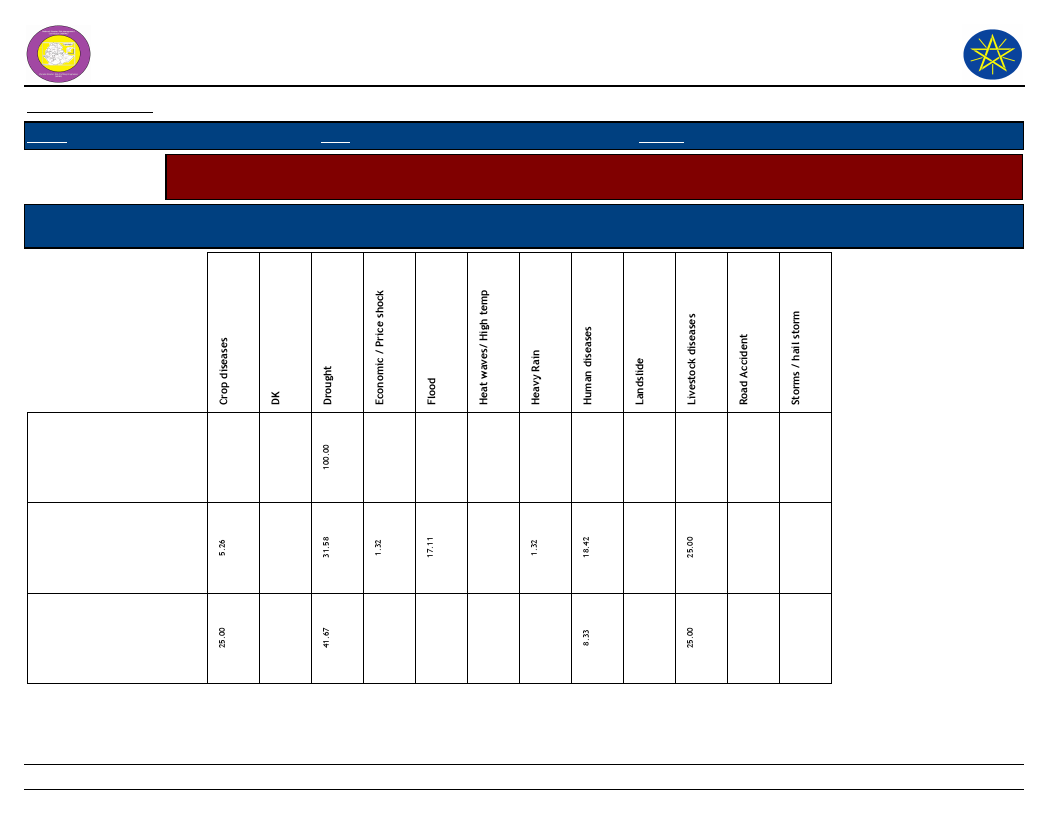
Wereda Disaster
Risk Profile
National Disaster Risk Management
Commission (NDRMC)
Data_Collected_Date
Thursday, December 12, 2019
Region S.N.N.P
Zone WOLAYITA
Wereda HUMBO
Selected Indicator
Capacity: Coping Strategies Adopted by Households - Main coping strategies adopted by households for respective
disasters
Coping Strtegies Adopted
Types of disaters for which HHs in the community adopt the listed
Coping Strtegies
Begging for money or for
food
Borrowing of food or cash
(including purchasing food
on credit)
Collection of wild food
267
Page 1 of 7

Wereda Disaster
Risk Profile
National Disaster Risk Management
Commission (NDRMC)
Data_Collected_Date
Thursday, December 12, 2019
Region S.N.N.P
Zone WOLAYITA
Wereda HUMBO
Selected Indicator
Capacity: Coping Strategies Adopted by Households - Main coping strategies adopted by households for respective
disasters
Coping Strtegies Adopted
Types of disaters for which HHs in the community adopt the listed
Coping Strtegies
Consumption rather than
sale of crop surplus
Increased working hours
Limit portion size at meals
268
Page 2 of 7
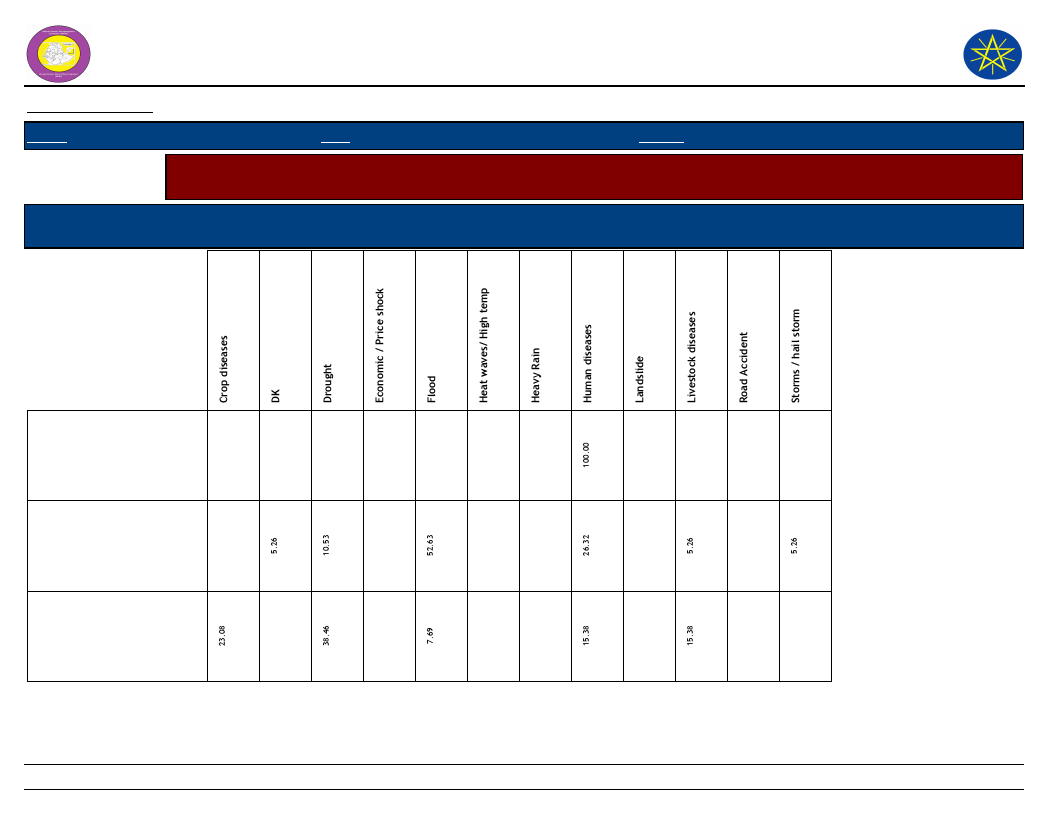
Wereda Disaster
Risk Profile
National Disaster Risk Management
Commission (NDRMC)
Data_Collected_Date
Thursday, December 12, 2019
Region S.N.N.P
Zone WOLAYITA
Wereda HUMBO
Selected Indicator
Capacity: Coping Strategies Adopted by Households - Main coping strategies adopted by households for respective
disasters
Coping Strtegies Adopted
Types of disaters for which HHs in the community adopt the listed
Coping Strtegies
Long-term / permanent
migration (including
distress migration of
whole families)
Others -
Reduce number of meals
eaten in a day
269
Page 3 of 7

Wereda Disaster
Risk Profile
National Disaster Risk Management
Commission (NDRMC)
Data_Collected_Date
Thursday, December 12, 2019
Region S.N.N.P
Zone WOLAYITA
Wereda HUMBO
Selected Indicator
Capacity: Coping Strategies Adopted by Households - Main coping strategies adopted by households for respective
disasters
Coping Strtegies Adopted
Types of disaters for which HHs in the community adopt the listed
Coping Strtegies
Reduced expenditure on
health and education
(including taking children
out of school)
Reduced expenditure on
non-essential items (beer,
cigarettes, clothes, meat,
etc.)
Reduced expenditure on
productive inputs
(fertilizer, seeds,
livestock drugs, etc.)
270
Page 4 of 7

Wereda Disaster
Risk Profile
National Disaster Risk Management
Commission (NDRMC)
Data_Collected_Date
Thursday, December 12, 2019
Region S.N.N.P
Zone WOLAYITA
Wereda HUMBO
Selected Indicator
Capacity: Coping Strategies Adopted by Households - Main coping strategies adopted by households for respective
disasters
Coping Strtegies Adopted
Types of disaters for which HHs in the community adopt the listed
Coping Strtegies
Rely on less preferred and
less expensive food
Sale of non-productive
assets (Jewelry, clothing,
etc.)
Sale of productive assets
(land, farm implements,
vehicle, etc.)
271
Page 5 of 7

Wereda Disaster
Risk Profile
National Disaster Risk Management
Commission (NDRMC)
Data_Collected_Date
Thursday, December 12, 2019
Region S.N.N.P
Zone WOLAYITA
Wereda HUMBO
Selected Indicator
Capacity: Coping Strategies Adopted by Households - Main coping strategies adopted by households for respective
disasters
Coping Strtegies Adopted
Types of disaters for which HHs in the community adopt the listed
Coping Strtegies
Seek alternative or
additional jobs
Sell more livestock than
usual
Sending children of
household for work
272
Page 6 of 7

Wereda Disaster
Risk Profile
National Disaster Risk Management
Commission (NDRMC)
Data_Collected_Date
Thursday, December 12, 2019
Region S.N.N.P
Zone WOLAYITA
Wereda HUMBO
Selected Indicator
Capacity: Coping Strategies Adopted by Households - Main coping strategies adopted by households for respective
disasters
Coping Strtegies Adopted
Types of disaters for which HHs in the community adopt the listed
Coping Strtegies
Short-term / seasonal
labor migration
Skip entire day without
eating
273
Page 7 of 7
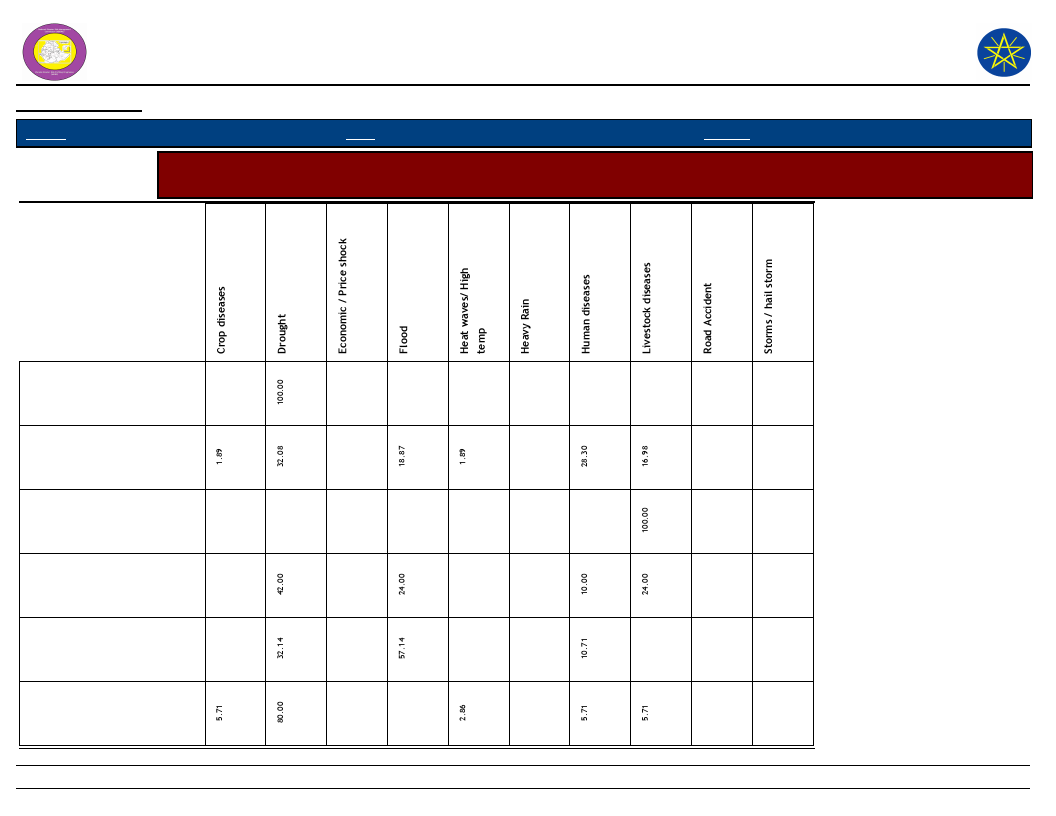
Wereda Disaster Risk
Profile
National Disaster Risk Management
Commission (NDRMC)
Data_Collected_Date
Region S.N.N.P
Zone
WOLAYITA
Wereda HUMBO
Thursday, December 12, 2019
Selected Indicator
Capacity: Coping Strategies Adopted by Households - Secondary coping strategies adopted by households for
respective disasters
Begging for money or for
food
Borrowing of food or cash
(including purchasing food
on credit)
Collection of wild food
Consumption rather than
sale of crop surplus
Increased working hours
Limit portion size at meals
274
Page 1 of 4

Wereda Disaster Risk
Profile
National Disaster Risk Management
Commission (NDRMC)
Data_Collected_Date
Region S.N.N.P
Zone
WOLAYITA
Wereda HUMBO
Thursday, December 12, 2019
Selected Indicator
Capacity: Coping Strategies Adopted by Households - Secondary coping strategies adopted by households for
respective disasters
Long-term / permanent
migration (including
distress migration of whole
Others -
Reduce number of meals
eaten in a day
Reduced expenditure on
health and education
(including taking children
Reduced expenditure on
non-essential items (beer,
cigarettes, clothes, meat,
Reduced expenditure on
productive inputs
(fertilizer, seeds, livestock
275
Page 2 of 4

Wereda Disaster Risk
Profile
National Disaster Risk Management
Commission (NDRMC)
Data_Collected_Date
Region S.N.N.P
Zone
WOLAYITA
Wereda HUMBO
Thursday, December 12, 2019
Selected Indicator
Capacity: Coping Strategies Adopted by Households - Secondary coping strategies adopted by households for
respective disasters
Rely on less preferred and
less expensive food
Restrict consumption by
adults in order for small
children to eat
Sale of non-productive
assets (Jewelry, clothing,
etc.)
Sale of productive assets
(land, farm implements,
vehicle, etc.)
Seek alternative or
additional jobs
Sell more livestock than
usual
276
Page 3 of 4

Wereda Disaster Risk
Profile
National Disaster Risk Management
Commission (NDRMC)
Data_Collected_Date
Region S.N.N.P
Zone
WOLAYITA
Wereda HUMBO
Thursday, December 12, 2019
Selected Indicator
Capacity: Coping Strategies Adopted by Households - Secondary coping strategies adopted by households for
respective disasters
Sending children of
household for work
Short-term / seasonal labor
migration
Skip entire day without
eating
277
Page 4 of 4
WDRP Indicators
Community
Perceptions and Suggestions
278
Wereda Disaster
Risk Profile
Data_Collected_Date
National Disaster Risk Management
Commission (NDRMC)
Thursday, December 12, 2019
Region S.N.N.P
Zone
WOLAYITA
Wereda HUMBO
Selected Indicator
Kebele Name
Interventions: Community Perception on Mediums to Influence DRM Actors - Community perception on the
effectiveness of institutional channels to use to influence DRM actors
Institution_1
Process_Description
Institution_2 Process_Description
Institution_3
Process_Description
ABAYA GUNUCHO
Kebele
administration
ABELA AJAJA
ABELA GEFETA
Kebele
administration
Kebele
administration
ANKA WECHA
Kebele
Administration
BOSA WANCHE
Kebele
Administration
Raise the problem
on the meeting
kebele leaders
The community raise
the issues to kebele
leaders
One to five groups,
development
member groups,
Kebele
administration
One to five group,
development group.
Wereda
administration
Woreda
administration
Woreda
administration
Woreda
Administration
Woreda
Administration
279
Report the problem
raised from the
community for
woreda officials
The kebele leader
report the problem
raised by the
community to woreda
officials
Food security task
forces crises
management
committee, Woreda
string committee,
Woreda
administration
Woreda food security
task force, Woreda
crisis management
committee, Woreda
steering committee,
Woreda
administration.
Page 1 of 6

Wereda Disaster
Risk Profile
Data_Collected_Date
National Disaster Risk Management
Commission (NDRMC)
Thursday, December 12, 2019
Region S.N.N.P
Zone
WOLAYITA
Wereda HUMBO
Selected Indicator
Kebele Name
Interventions: Community Perception on Mediums to Influence DRM Actors - Community perception on the
effectiveness of institutional channels to use to influence DRM actors
Institution_1
Process_Description
Institution_2 Process_Description
Institution_3
Process_Description
ABAYA CHOKARE
Kebele
administration
DEMBA KOYISHA
Kebele
administration
ELA KEBELA
HOBICHA DIGISO
Kebele
administration
Kebele
administration
One to five group,
development
members, kebele
crisis management
committee, Kebele
administration
Development
members, Crisis
management
committee, Kebele
administration
One to five group,
Development
members group,
Kebele crisis
management
committee, Kebele
administration
Woreda
administration
Woreda
administration
Woreda food security
task force, Crisis
management
committee, Woreda
food security steering
committee, Woreda
administration
Agricultural office,
Crisis management
committee, Woreda
administration
Woreda
administration
Woreda
administration
Woreda food security
task force, Crisis
management
committee, Woreda
food security steering
committee, Woreda
administration
280
Page 2 of 6
Wereda Disaster
Risk Profile
Data_Collected_Date
National Disaster Risk Management
Commission (NDRMC)
Thursday, December 12, 2019
Region S.N.N.P
Zone
WOLAYITA
Wereda HUMBO
Selected Indicator
Interventions: Community Perception on Mediums to Influence DRM Actors - Community perception on the
effectiveness of institutional channels to use to influence DRM actors
Kebele Name
GALICHA KARA
Institution_1
Kebele
Administration
GUTUTO LARENA
Kebele
Administrative
HOBICHA BADA
Kebele
administration
Process_Description
First the 1 to 5
group discussion is
done, then they
raise their issues to
kebele
administration
through community
leader
From 1 to 5
development leader,
Agriculture head
administration
One to five group,
Development
members group,
Crisis management,
Kebele
administration
Institution_2 Process_Description
Woreda
Administration
If the issue above the
kebele
administration, then
the issues discussed
by food security task
force then crises
management
committee then it
reports to woreda
administration
Woreda
administrative
Early warning,
disaster risk
management and
food security,
Agricultural head and
Administration
Woreda
administration
Food security task
force, Crisis
management
commitment, Woreda
food security steering
committee, Woreda
administration
Institution_3
Process_Description
281
Page 3 of 6

Wereda Disaster
Risk Profile
Data_Collected_Date
National Disaster Risk Management
Commission (NDRMC)
Thursday, December 12, 2019
Region S.N.N.P
Zone
WOLAYITA
Wereda HUMBO
Selected Indicator
Interventions: Community Perception on Mediums to Influence DRM Actors - Community perception on the
effectiveness of institutional channels to use to influence DRM actors
Kebele Name
HOBICHA
BONGOTA
ABELA ZEGRE
KODO KANKO
Institution_1
Kebele
Administration
Kebele
administration
Process_Description
One to five group,
development
member group,
crisis management
committee, Kebele
Administration
Development
members, Crisis
committee, Kebele
administration
Institution_2 Process_Description
Woreda
Administration
Woreda food security
task force, crisis
management
committee, Woreda
food security steering
committee, woreda
administration
Woreda
administration
Agriculture Office,
Crisis committee,
Woreda
administration
Institution_3
Process_Description
KOYISHA GOLA
KOYISHA
OGODAMA
Kebele
administration
Kebele
administration
Development
members, Crisis
committee, Kebele
administration
One to five group,
Development
members group,
crisis management
committee, Kebele
administration
Woreda
administration
Woreda
administration
Agricultural affair,
Crisis committee,
Woreda
administration
Food security task
force, Crisis
management
committee, Woreda
steering committee,
Woreda
administration
282
Page 4 of 6

Wereda Disaster
Risk Profile
Data_Collected_Date
National Disaster Risk Management
Commission (NDRMC)
Thursday, December 12, 2019
Region S.N.N.P
Zone
WOLAYITA
Wereda HUMBO
Selected Indicator
Kebele Name
Interventions: Community Perception on Mediums to Influence DRM Actors - Community perception on the
effectiveness of institutional channels to use to influence DRM actors
Institution_1
Process_Description
Institution_2 Process_Description
Institution_3
Process_Description
KOYISHA
WANGALA
Kebele
Administrative
AMBE SHOYA
Local authorities
AMPO KOYISHA
SERE TAWURETA
One to five group
members
Kebele
administration
SHOCHORA ABELA
Kebele
administration
The 1 to 5 group
members discuss-
management
committee- Kebele
administration
1 to 5 groups discuss
each other about
disaster
One to five groups,
Development
members, Crisis
management
committee, Kebele
administration
One to five group,
Development
members, Crisis
management
committee, Kebele
administration
Woreda
Administration
Kebele
administration
Kebele
administration
Woreda
administration
Woreda
administration
283
Food security task
focus- Management
committee- woreda
string
committee-woreda
administration
The kebele
administration discuss
on disaster issues
Food security task
forces, Crisis
management
committee, Woreda
steering committee,
Woreda
administration
Food security task
force, Crisis
management
committee, Woreda
steering committee,
Woreda
administration
Woreda
administration
Woreda
administration
The woreda
administration discuss
on disaster issues
Page 5 of 6

Wereda Disaster
Risk Profile
Data_Collected_Date
National Disaster Risk Management
Commission (NDRMC)
Thursday, December 12, 2019
Region S.N.N.P
Zone
WOLAYITA
Wereda HUMBO
Selected Indicator
Kebele Name
Interventions: Community Perception on Mediums to Influence DRM Actors - Community perception on the
effectiveness of institutional channels to use to influence DRM actors
Institution_1
Process_Description
Institution_2 Process_Description
Institution_3
Process_Description
SHOCHORA FESHO Community level
Kebele level
Woreda level
SHOCHORA
OGODAMA
Kebele
administration
SHOCHORA OSE
Kebele
administration
Development
members, Crisis
management
committee, Kebele
administration
Development
members, Crisis
management
committee, Kebele
administration
Woreda
administration
Agricultural office,
Crisis management
committee, Woreda
administration
Woreda
administration
Agricultural office,
Crisis management
committee, Woreda
administration
284
Page 6 of 6
Data_Collected_Date
Region S.N.N.P
Zone
WOLAYITA
Thursday, December 12, 2019
Wereda HUMBO
Selected Indicator
Interventions: Community Perception on their Knowledge used in DRM Process -
Perception of the community on how their knowledge influences the priorities
and measures of DRM actors
KebeleName
Community_Suggestions
ABAYA GUNUCHO
Discuss with the concerned bodys about the problem existing on.
ABELA AJAJA
ABELA GEFETA
Discussion with community representatives and the concerned bodies
ANKA WECHA
Based on community involvement and suggestions.
BOSA WANCHE
GALICHA KARA
It is based on community involvement and suggestion although there is limitation
sometimes from top to bottom.
Based on community involvement and suggestions
GUTUTO LARENA
Based on public suggestion
HOBICHA
BONGOTA
HOBICHA BADA
It is based on public involvement suggestion, but with some limitation
It is based on community involvement and suggestions, but it is not in full manner.
ABELA ZEGRE
Based on community suggestion
KOYISHA GOLA
Based on the suggestion of community
KODO KANKO
Based on community suggestion
KOYISHA
OGODAMA
AMBE SHOYA
KOYISHA
WANGALA
AMPO KOYISHA
Based on community involvement and suggestions.
Crops can not resist the harsh environment, Shortage of farm land, Poor technology
use, Based on community involvement and suggestion
Based on community involvement and suggestion
SHOCHORA ABELA
Based on communities involvement and suggestion
285
Page 1 of 2
Data_Collected_Date
Region S.N.N.P
Zone
WOLAYITA
Thursday, December 12, 2019
Wereda HUMBO
Selected Indicator
Interventions: Community Perception on their Knowledge used in DRM Process -
Perception of the community on how their knowledge influences the priorities
and measures of DRM actors
KebeleName
Community_Suggestions
DEMBA KOYISHA
Based on community suggestion
SERE TAWURETA
Based on community involvement and suggestion
ABAYA CHOKARE
It is based on community suggestions and involvements, but it is limited.
ELA KEBELA
HOBICHA DIGISO
It is based on community involvement and suggestion, but there is limitation.
SHOCHORA OSE
SHOCHORA
OGODAMA
SHOCHORA FESHO
It is based on community suggestion.
Community suggestion and knowledge, but it is limited
286
Page 2 of 2
Wereda Disaster Risk
Profile
National Disaster Risk Management
Commission (NDRMC)
Data_Collected_Date
Region
Zone
Wereda
Thursday, December 12, 2019
Selected Indicator
Interventions: Suggestions to improve preparedness - Interventions suggested by the community to development
actors to improve preparedness in the area
KebeleName
Measure 1
Comment 1
Measure 2
Comment 2
Measure 3
Comment 3
287
Page 1 of 1
Wereda Disaster Risk
Profile
National Disaster Risk Management
Commission (NDRMC)
Data_Collected_Date
Region S.N.N.P
Zone WOLAYITA
Wereda HUMBO
Thursday, December 12, 2019
Selected Indicator
Interventions: Suggestions to DRM Actors in the Area - Community suggested measures to DRM actors in the area
for effective DRM actions
Kebele Name
ABAYA
GUNUCHO
Measure 1
Build large dams
ABELA AJAJA
Soil and water
conservation
ABELA GEFETA
ANKA WECHA
Introduction of
modern early
warning system
Integrated
Agricultural
activities
BOSA WANCHE
Soil and water
conservation
activities
Comment 1
To prevent the
over flow of
Bilate river
Measure 2
Soil and water
conservation
Promote irrigation
system
Improve crop
production
Soil and water
conservation
To improve
agricultural
extension
services
expansion.
It is effective to
mitigate negative
effects of most
hazards such as,
flood, drought,
livestock
diseases, e.t.c.
Improve modern
agricultural technology
Improved road
construction
Comment 2
To reduce effect of
flood
Measure 3
Diversify the
tracing system
To prevent flood
effect
To increase
production.
Introduce water
harvesting
technology
Awareness
creation
Soil and water
Conservation
To improve
transportation, To
minimize adverse
effect of flood.
Fodder
preparation,
Clean water
Comment 3
Due to the
topographic
setup of the
kebele
To practice
modern farming
system
To conserve soil
and water and to
improve fertility.
To fulfill fodder
gap during
drought, To
improve human
health.
288
Page 1 of 4
Wereda Disaster Risk
Profile
National Disaster Risk Management
Commission (NDRMC)
Data_Collected_Date
Region S.N.N.P
Zone WOLAYITA
Wereda HUMBO
Thursday, December 12, 2019
Selected Indicator
Interventions: Suggestions to DRM Actors in the Area - Community suggested measures to DRM actors in the area
for effective DRM actions
Kebele Name
ABAYA
CHOKARE
Measure 1
Large dam
construction
DEMBA
KOYISHA
Use modern farming
system
Comment 1
To prevent
overflowed of
bilate river
To improve crop
production
Measure 2
Soil and water
conservation
Soil and water
conservation
ELA KEBELA
HOBICHA
DIGISO
Nursery site
establishment
school from grade 9
up to 10
Soil and water
conservation
activities,
Electricity
GALICHA KARA
Improve agricultural
technology
GUTUTO
LARENA
Using modern
farming system
To prevent
effects of
hazards, To
create different
income
generating
activity
To increase
production and
productivity
To improve crop
productivity
Artificial Insemination
Clean water
Soil and water
conservation
Soil and Water
conservation
Comment 2
To minimize
negative effects of
disasters
To prevent flood
For improved and
resistant variety
Measure 3
Modern irrigation
system
Awareness
creation
Road
construction,
Electricity
Comment 3
To maximize
crop yield
To practice
modern farming
system
To prevent human
disease
Digging of
underground
water
To solve shortage
of water
To mitigate/lessen
the effect of
disaster
To prevent soil
erosion
Water resource
development
Awareness
creation
To improve
access to water
in the area
In order to
practice modern
technology
289
Page 2 of 4
Wereda Disaster Risk
Profile
National Disaster Risk Management
Commission (NDRMC)
Data_Collected_Date
Region S.N.N.P
Zone WOLAYITA
Wereda HUMBO
Thursday, December 12, 2019
Selected Indicator
Interventions: Suggestions to DRM Actors in the Area - Community suggested measures to DRM actors in the area
for effective DRM actions
Kebele Name
HOBICHA BADA
Measure 1
Road Construction
with water ditch
Comment 1
To mitigate flood
impacts.
Measure 2
Food aid for children
HOBICHA
BONGOTA
ABELA ZEGRE
Soil and water
conservation, Road
construction
Use of modern
farming system
KODO KANKO
Using modern
farming system
KOYISHA GOLA
Modern farming
practices
KOYISHA
OGODAMA
Soil and water
conservation
KOYISHA
WANGALA
Soil and water
conservation
To improve crop
products
Expansion of safe
water, Education
center
Soil and water
conservation
To improve crop
production
Awareness creation
To improve crop
product
Awareness creation
To conserve and
improve soil
fertility
protecting soil
in order to keep
soil fertility
Modern agricultural
technology
Improving modern
agricultural activities
290
Comment 2
To fulfill food gap
for children.
Low income to
teach in the areas
To prevent flood
in order to
practice modern
farming system
To practice
modern farming
systems.
To increase
production
Measure 3
Soil and water
conservation,
Supply of
livestock
medicine
Supply of
medicine, Health
center
Awareness
creation
Comment 3
To prevent
hazards impact,
for livestock
disease
treatment
To practice
modern farming
system
Spring
development
To get clean
water
To increase
product and
productivity
Spring
development
To get clean
water
Page 3 of 4
Wereda Disaster Risk
Profile
National Disaster Risk Management
Commission (NDRMC)
Data_Collected_Date
Region S.N.N.P
Zone WOLAYITA
Wereda HUMBO
Thursday, December 12, 2019
Selected Indicator
Interventions: Suggestions to DRM Actors in the Area - Community suggested measures to DRM actors in the area
for effective DRM actions
Kebele Name
AMBE SHOYA
AMPO KOYISHA
SERE
TAWURETA
Measure 1
Soil and water
conservation
Soil and water
conservation
activities
Soil and water
conservation
SHOCHORA
ABELA
Soil and water
conservation
SHOCHORA
FESHO
Soil and water
conservation
activities
Comment 1
To keep soil
fertility in safe
To conserve soil
and to improve
soil fertility
To conserve soil
and to improve
soil fertility
To prevent flood
and drought
impacts
Measure 2
Save soil fertility
Construction of
moderns irrigation
canal
Use of modern
agricultural technology
Modern agricultural
technology
Technology extension
SHOCHORA
OGODAMA
Use modern farming
system
To improve crop
production
Soil and water
conservation
SHOCHORA OSE
Use modern farming
system
To improve crop
production
Awareness creation
Comment 2
Used to get more
product
To increase
production
To increase
production
To prevent flood
To practice
modern farming
system
Measure 3
Utilization of
fertilizers
Spring
development
Spring
development
Asking for aid
Awareness
creation
Comment 3
For more
production
To get clean
water
To get clean
water
When the impact
become out of
community
control
To practice
modern farming
system
291
Page 4 of 4
Wereda Disaster Risk
Profile
National Disaster Risk Management
Commission (NDRMC)
Data_Collected_Date
Region S.N.N.P
Zone WOLAYITA
Wereda HUMBO
Thursday, December 12, 2019
Selected Indicator
Economic Vulnerability: Community Suggestions to Improve Economic Situation - Community suggested measures
to improve the economic situation of the area
KebeleName
Measure 1
Comment 1
Measure 2
Comment 2
Measure 3 Comment 3
ABAYA GUNUCHO
Dam construction
around Bilate river
ABELA AJAJA
No
To prevent the over flow
of Bilae river
Improve market
network
To sell and buy
needy items as per
their interest
ABELA GEFETA
ANKA WECHA
Water and soil
conservation
Soil and water
conservation
BOSA WANCHE
Improved use of small
scale irrigation
GALICHA KARA
Soil and water
conservation
To prevent soil erosion
To control soil and water
erosion.
There is water access to
produce vegetables
during off seasons.
T o increase the
agricultural productivity
by reducing soil erosion
and related problems
A forestation
Water harvesting
system
Maximizing coffee
production
To improve
weather change
To conserve water
produce crops, To
improve
productivities by
production of
crops.
It is cash crop.
Water
harvesting
Petty trade
To store
water
Still, there is
low petty
trade in the
area.
292
Page 1 of 4

Wereda Disaster Risk
Profile
National Disaster Risk Management
Commission (NDRMC)
Data_Collected_Date
Region S.N.N.P
Zone WOLAYITA
Wereda HUMBO
Thursday, December 12, 2019
Selected Indicator
Economic Vulnerability: Community Suggestions to Improve Economic Situation - Community suggested measures
to improve the economic situation of the area
KebeleName
GUTUTO LARENA
Measure 1
A forestation
Comment 1
To cope up with climate
change.
Measure 2
Water and soil
conservation
Comment 2
To prevent soil
erosion.
Measure 3
Water
harvesting
Comment 3
To cope up
with rain fall
stress.
HOBICHA
BONGOTA
Good road construction
For market linkage
Electricity
For other job
opportunity
Pond
construction
For drought
seasons to
cultivate
vegetable
and for
animals
water supply
HOBICHA BADA
Use of improved
agricultural technology
To maximize crop yield.
Soil and water
conservation
activities
To minimize yield
loss due to the
impacts of
hazards.
Planting of
multi-purpose
trees
For multi
benefits.
ABELA ZEGRE
Water and soil
conservation
To prevent erosion
A forestation
To improve the
climate
Water
harvesting
To conserve
water and to
produce short
cycle crop.
KOYISHA GOLA
Water harvesting
To conserve water and to
produce short cycle crop
A forestation
To improve the
climate condition
KODO KANKO
Water harvesting
To produce short cycle
crop
A forestation
To improve
climate change
Soil and
Water
conservation
To protect
soil erosion
293
Page 2 of 4

Wereda Disaster Risk
Profile
National Disaster Risk Management
Commission (NDRMC)
Data_Collected_Date
Region S.N.N.P
Zone WOLAYITA
Wereda HUMBO
Thursday, December 12, 2019
Selected Indicator
Economic Vulnerability: Community Suggestions to Improve Economic Situation - Community suggested measures
to improve the economic situation of the area
KebeleName
Measure 1
Comment 1
Measure 2
Comment 2
Measure 3 Comment 3
KOYISHA
OGODAMA
AMBE SHOYA
Soil and water
conservation
Soil and water
conservation
KOYISHA
WANGALA
AMPO KOYISHA
SHOCHORA ABELA
DEMBA KOYISHA
Soil and water
conservation
Planting of multi
purpose trees
Soil and water
conservation activities
Water harvesting
SERE TAWURETA
Soil and water
conservation
To control erosion
To control erosion
To control soil erosion
To control soil erosion
To conserve water and to
produce short cycle crops
To control erosion
Water harvesting
Water harvesting
Water Harvesting
Pond Construction
Water harvesting
system
A forestation
Water harvesting
system
To conserve water
and to produce
crops
To conserve
water, to produce
crops and to
increase the
product
To conserve water
To conserve water
and produce crops
To improve the
climate
To conserve water
and to produce
crops.
Soil and
water
conservation
To prevent
erosion
294
Page 3 of 4
Wereda Disaster Risk
Profile
National Disaster Risk Management
Commission (NDRMC)
Data_Collected_Date
Region S.N.N.P
Zone WOLAYITA
Wereda HUMBO
Thursday, December 12, 2019
Selected Indicator
Economic Vulnerability: Community Suggestions to Improve Economic Situation - Community suggested measures
to improve the economic situation of the area
KebeleName
ABAYA CHOKARE
Measure 1
Dam construction along
the river
Comment 1
To prevent and mitigate
flood
Measure 2
Modern irrigation
canal
Comment 2
Because of water
access
Measure 3
Soil and
water
conservation
activities
Comment 3
To conserve
soil and
water
ELA KEBELA
Expansion of modern
agricultural technology
Soil and water
conservation
activity
Artificial
insemination
For improved
breeding
HOBICHA DIGISO
Learning
To elevate illiteracy
Petty trade
There is low petty
trade in the area.
Road
construction
To improve
market
linkage
SHOCHORA OSE
Water harvesting
To conserve water and to
produce short cycle crops
A forestation
To improve
climate condition
SHOCHORA
OGODAMA
Water and soil
conservation
To prevent erosion
Water harvesting
To conserve water
and to produce
short cycle crop
A forestation
To improve
climate
condition
SHOCHORA
FESHO
Planting of multi
purpose trees
Sowing of coffee
Soil and
water
conservation
activities
295
Page 4 of 4

Wereda Disaster
Risk Profile
Data_Collected_Date
Region S.N.N.P
Zone WOLAYITA
Selected Indicator
Community Awareness of Disaster Risk Management System and Actors
Kebele Name
ABAYA CHOKARE
Institution 1
Responsibility
Activity
Agricultural office
Improve agricultural extension
Extension of modern agricultural technology, provide inputs
Institution 2
Responsibility
Activity
Health Post
To prevent disease
Expansion of health extension services
Institution 3
Responsibility
Activity
Kebele Name
School
Teaching of the students
To improve quality of education
ABAYA GUNUCHO
Institution 1
Responsibility
Activity
Agriculture office
Increase productivity
Provide agricultural extension services
Institution 2
Responsibility
Activity
Health posts
Health promotion and disease prevention
Provide vaccination and treatment
Institution 3
Responsibility
Activity
Education offices
Promote literacy
Provide teaching and learning services
National Disaster Risk
Management Comission (NDRMC)
Thursday, December 12, 2019
Wereda HUMBO
296
Page 1 of 13
Wereda Disaster
Risk Profile
Data_Collected_Date
Region S.N.N.P
Zone WOLAYITA
Selected Indicator
Community Awareness of Disaster Risk Management System and Actors
Kebele Name
ABELA AJAJA
Institution 1
Responsibility
Activity
Agriculture office
Increase agricultural productivity
Expansion of modern agricultural technologies, supply of agricultural inputs
Institution 2
Responsibility
Activity
Health post
Secure human health
Institution 3
Responsibility
Education office
Teaching of students
Activity
Kebele Name
ABELA GEFETA
Institution 1
Responsibility
Activity
Agriculture office
Increase productivity
Provide agricultural inputs
Institution 2
Responsibility
Activity
Health Post
Disease prevention
Awareness creation on family planning
Institution 3
Responsibility
Activity
School
Promote literacy
Teaching the children
National Disaster Risk
Management Comission (NDRMC)
Thursday, December 12, 2019
Wereda HUMBO
297
Page 2 of 13
Wereda Disaster
Risk Profile
Data_Collected_Date
Region S.N.N.P
Zone WOLAYITA
Selected Indicator
Community Awareness of Disaster Risk Management System and Actors
Kebele Name
ABELA ZEGRE
Institution 1
Responsibility
Activity
Agricultural Office
To improve agricultural extension
Provide agricultural inputs and give extension service
Institution 2
Responsibility
Activity
Health Post
To prevent diseases
To help for family planning
Institution 3
Responsibility
Activity
Kebele Name
School
To improve quality of education
To improve quality of education
AMBE SHOYA
Institution 1
Responsibility
Activity
Agricultural Office
Give agricultural extension services
Agricultural extension services
Institution 2
Responsibility
Activity
Educational Office
Improve quality of education
Teaching on all schools properly
Institution 3
Responsibility
Activity
Health Post Office
Prevent disease
To prevent disease and family planning
National Disaster Risk
Management Comission (NDRMC)
Thursday, December 12, 2019
Wereda HUMBO
298
Page 3 of 13

Wereda Disaster
Risk Profile
Data_Collected_Date
Region S.N.N.P
Zone WOLAYITA
Selected Indicator
Community Awareness of Disaster Risk Management System and Actors
Kebele Name
AMPO KOYISHA
Institution 1
Responsibility
Activity
Agricultural Office
To improve agricultural extension
Improved agricultural technology
Institution 2
Responsibility
Activity
Health Post
To prevent diseases
Expansion of health extension services
Institution 3
Responsibility
Activity
Kebele Name
School
Teaching of students
To improve quality of education
ANKA WECHA
Institution 1
Responsibility
Activity
Agricultural Office
To improve agricultural services and extensions.
To keep land fertility
Institution 2
Responsibility
Activity
Health Post Office
To prevent diseases
To prevent diseases
Institution 3
Responsibility
Activity
Women Office
To save money
To save money
National Disaster Risk
Management Comission (NDRMC)
Thursday, December 12, 2019
Wereda HUMBO
299
Page 4 of 13

Wereda Disaster
Risk Profile
Data_Collected_Date
National Disaster Risk
Management Comission (NDRMC)
Thursday, December 12, 2019
Region S.N.N.P
Zone WOLAYITA
Selected Indicator
Community Awareness of Disaster Risk Management System and Actors
Kebele Name
BOSA WANCHE
Wereda HUMBO
Institution 1
Responsibility
Activity
Agricultural Office
To improve agricultural extension.
Expansion and improvement of modern agricultural activity, Supply of agricultural inputs, Soil and water conservation.
Institution 2
Responsibility
Activity
Health Office
Pursue of human health situation.
Expansion of health extension services.
Institution 3
Responsibility
Activity
Kebele Name
School
Teaching of students
To improve quality of education.
DEMBA KOYISHA
Institution 1
Responsibility
Activity
Agriculture Office
To improve agricultural extension
Providing inputs and giving of extension services
Institution 2
Responsibility
Activity
Health Office
To prevent diseases
Support family planning
Institution 3
Responsibility
Activity
School
Teaching of the students
Improve quality of education
300
Page 5 of 13

Wereda Disaster
Risk Profile
Data_Collected_Date
Region S.N.N.P
Zone WOLAYITA
Selected Indicator
Community Awareness of Disaster Risk Management System and Actors
Kebele Name
ELA KEBELA
Institution 1
Responsibility
Activity
Agriculture office
To improve agriculture sector
Give agricultural extension services
Institution 2
Responsibility
Activity
Health post
To promote community health
Prevent disease and family planning
Institution 3
Responsibility
Activity
Kebele Name
School
To improve quality of education
Teaching of students
GALICHA KARA
Institution 1
Responsibility
Activity
Agriculture extension office
To improve agricultural extension services
Capacity building and provide agricultural inputs
Institution 2
Responsibility
Activity
Health post
To improve health situation of the area
Awareness creation on Hygiene and sanitation
Institution 3
Responsibility
Activity
School
To improve access to education in the area
Teaching
National Disaster Risk
Management Comission (NDRMC)
Thursday, December 12, 2019
Wereda HUMBO
301
Page 6 of 13

Wereda Disaster
Risk Profile
Data_Collected_Date
Region S.N.N.P
Zone WOLAYITA
Selected Indicator
Community Awareness of Disaster Risk Management System and Actors
Kebele Name
GUTUTO LARENA
Institution 1
Responsibility
Activity
Agricultural office
Improve agricultural productive and productivity
Providing Agricultural inputs and extension services
Institution 2
Responsibility
Activity
Health Extension
To prevent disease
Awareness creation on health problems
Institution 3
Responsibility
Activity
Kebele Name
School
Providing education services
Teaching and learning process
HOBICHA BADA
Institution 1
Responsibility
Activity
Agricultural Office
To improve agricultural extension
Technology and agricultural inputs supply, water and soil conservation
Institution 2
Responsibility
Activity
Health Office
Pursue of human health situation
Prevention of disease, Training and treatment
Institution 3
Responsibility
Activity
School
Teaching of students
To improve quality of education
National Disaster Risk
Management Comission (NDRMC)
Thursday, December 12, 2019
Wereda HUMBO
302
Page 7 of 13

Wereda Disaster
Risk Profile
Data_Collected_Date
Region S.N.N.P
Zone WOLAYITA
Selected Indicator
Community Awareness of Disaster Risk Management System and Actors
Kebele Name
HOBICHA BONGOTA
Institution 1
Responsibility
Activity
Agriculture Office
Improvement of agricultural extensions
Expansion of modern agricultural technology
Institution 2
Responsibility
Activity
Health Office
Disease prevention
Expansion of health extension services
Institution 3
Responsibility
Activity
Kebele Name
School
To improve quality of education
Teaching of students
HOBICHA DIGISO
Institution 1
Responsibility
Activity
Agricultural Office
To improve agricultural extension
Expansion of modern agricultural technology
Institution 2
Responsibility
Activity
Health Post
Prevention of disease
Giving training, Distribution of mosquito net and medicine
Institution 3
Responsibility
Activity
School
Teaching of students
Improve quality of education
National Disaster Risk
Management Comission (NDRMC)
Thursday, December 12, 2019
Wereda HUMBO
303
Page 8 of 13

Wereda Disaster
Risk Profile
Data_Collected_Date
Region S.N.N.P
Zone WOLAYITA
Selected Indicator
Community Awareness of Disaster Risk Management System and Actors
Kebele Name
KODO KANKO
Institution 1
Responsibility
Activity
Agriculture office
Improve agriculture extension
Provide inputs
Institution 2
Responsibility
Activity
Health extension
Prevent disease
Family planning services
Institution 3
Responsibility
Activity
Kebele Name
School
Provide education
improve education quality
KOYISHA GOLA
Institution 1
Responsibility
Activity
Agriculture Office
To improve agricultural extension
Provide inputs and extension services
Institution 2
Responsibility
Activity
Health Extension
To prevent disease
To support family planning
Institution 3
Responsibility
Activity
School
To improve quality of education
To improve quality of education
National Disaster Risk
Management Comission (NDRMC)
Thursday, December 12, 2019
Wereda HUMBO
304
Page 9 of 13

Wereda Disaster
Risk Profile
Data_Collected_Date
Region S.N.N.P
Zone WOLAYITA
Selected Indicator
Community Awareness of Disaster Risk Management System and Actors
Kebele Name
KOYISHA OGODAMA
Institution 1
Responsibility
Activity
Agricultural Office
To improve agriculture extension
Provide inputs and give extension services
Institution 2
Responsibility
Activity
Health Post
To prevent diseases
Family planning, Nutrition, Sanitation
Institution 3
Responsibility
Activity
Kebele Name
School
Teaching
Improve quality of education
KOYISHA WANGALA
Institution 1
Responsibility
Activity
Agriculture
Improve agriculture activities
Giving agriculture extension services
Institution 2
Responsibility
Activity
Heath post
To protect disease
Providing heath extension family planning
Institution 3
Responsibility
Activity
School
To improve education
Teaching and learning process
National Disaster Risk
Management Comission (NDRMC)
Thursday, December 12, 2019
Wereda HUMBO
305
Page 10 of 13

Wereda Disaster
Risk Profile
Data_Collected_Date
Region S.N.N.P
Zone WOLAYITA
Selected Indicator
Community Awareness of Disaster Risk Management System and Actors
Kebele Name
SERE TAWURETA
Institution 1
Responsibility
Activity
Agriculture office
To improve agricultural extension
Provide agricultural extension services
Institution 2
Responsibility
Activity
Health Post Office
To control diseases
Prevent disease and support family planning
Institution 3
Responsibility
Activity
Kebele Name
Education Office
To improve quality of education
Teaching students
SHOCHORA ABELA
Institution 1
Responsibility
Activity
Agriculture Office
To improve agricultural extension services
Provide seed inputs and giving extension services
Institution 2
Responsibility
Activity
Health Post Office
To prevent diseases
Family planning, Nutrition, Sanitation
Institution 3
Responsibility
Activity
School
Teaching
Improve quality of education
National Disaster Risk
Management Comission (NDRMC)
Thursday, December 12, 2019
Wereda HUMBO
306
Page 11 of 13

Wereda Disaster
Risk Profile
Data_Collected_Date
Region S.N.N.P
Zone WOLAYITA
Selected Indicator
Community Awareness of Disaster Risk Management System and Actors
Kebele Name
SHOCHORA FESHO
Institution 1
Responsibility
Activity
Agricultural office
To improve agricultural extension services
Give agricultural extension support
Institution 2
Responsibility
Activity
Kebele administration
To administer the kebele community
Mobilize the community
Institution 3
Responsibility
Activity
Kebele Name
Health Post Office
To prevent disease
Support family planning
SHOCHORA OGODAMA
Institution 1
Responsibility
Activity
Agricultural office
To improve agricultural extension
Provide inputs and give extension services
Institution 2
Responsibility
Activity
Health office
To prevent disease
Support family planning
Institution 3
Responsibility
Activity
School
To improve quality of education
Teaching of students in quality
National Disaster Risk
Management Comission (NDRMC)
Thursday, December 12, 2019
Wereda HUMBO
307
Page 12 of 13
Wereda Disaster
Risk Profile
Data_Collected_Date
Region S.N.N.P
Zone WOLAYITA
Selected Indicator
Community Awareness of Disaster Risk Management System and Actors
Kebele Name
SHOCHORA OSE
Institution 1
Responsibility
Activity
Agricultural office
To improve agricultural extension
Providing of inputs and give extension services
Institution 2
Responsibility
Activity
Healthy Office
To prevent disease
Support family planning
Institution 3
Responsibility
Activity
School
To improve quality of education
Teaching of students in quality
National Disaster Risk
Management Comission (NDRMC)
Thursday, December 12, 2019
Wereda HUMBO
308
Page 13 of 13
Wereda Disaster
Risk Profile
National Disaster Risk Management
Commission (NDRMC)
Data_Collected_Date
Thursday, December 12, 2019
Region S.N.N.P
Zone WOLAYITA
Wereda HUMBO
Selected Indicator
Community Perception of DRM System and Actors - Perception of the community on the effectiveness of DRM
system in helping them to prevent, cope and recover from disasters
KebeleName
Prevention
Coping
Recovery
Overall_Effectiveness
ABAYA GUNUCHO
ABELA AJAJA
Not effective
Medium
Not effective
Medium
Not effective
Medium
Not effective due to lack of
budget to construct dams
on Bilate river
Lack of funding
ABELA GEFETA
Not effective
Not effective
Not effective
Lack of fund
ANKA WECHA
BOSA WANCHE
ABAYA CHOKARE
DEMBA KOYISHA
Not effective
Medium
Not effective
Not effective
Not effective
Medium
Not effective
Not effective
Not effective
Medium
Not effective
Not effective
Not effective, because of
lack of financial support.
Not full commitment of
responsible bodies, Lack of
funding.
Lack of fund to construct
large dam along the river
Lack of financial support
ELA KEBELA
HOBICHA DIGISO
GALICHA KARA
Medium
Medium
Not much effective
Medium
Medium
Not much effective
Medium
Medium
Not effective
Limitation of supervision,
Severity of disasters
Commitment limitation of
responsible bodies, Lack of
funding
Recurrent drought (Shortage
of rainfall ) effect
309
Page 1 of 3

Wereda Disaster
Risk Profile
National Disaster Risk Management
Commission (NDRMC)
Data_Collected_Date
Thursday, December 12, 2019
Region S.N.N.P
Zone WOLAYITA
Wereda HUMBO
Selected Indicator
Community Perception of DRM System and Actors - Perception of the community on the effectiveness of DRM
system in helping them to prevent, cope and recover from disasters
KebeleName
GUTUTO LARENA
HOBICHA BADA
Prevention
Not effective
Medium
HOBICHA BONGOTA
ABELA ZEGRE
KODO KANKO
Medium
Not effective
No effective
Coping
Not effective
Medium
Medium
Not effective
No effective
Recovery
Not effective
Medium
Medium
Not effective
No effective
Overall_Effectiveness
Lack of fund to help
affected people
It is not that much
effective, because
commitment limitation of
the responsible bodies and
low financial support.
Severity of disasters, Lack
of funding
Lack of fund to support the
affected groups.
Lack of fund to support
KOYISHA GOLA
Not effective
Not effective
Not effective
Lack of fund
KOYISHA OGODAMA
KOYISHA WANGALA
Not effective
Not effective
Not effective
Not effective
Not effective
Not effective
Not effective , because of
lack of financial support.
Shortage of rainfall
AMBE SHOYA
AMPO KOYISHA
Not effective
Medium
Not effective
Medium
Not effective
Medium
Not effective , because
shortage of farm land and
deficit of rainfall.
310
Page 2 of 3

Wereda Disaster
Risk Profile
National Disaster Risk Management
Commission (NDRMC)
Data_Collected_Date
Thursday, December 12, 2019
Region S.N.N.P
Zone WOLAYITA
Wereda HUMBO
Selected Indicator
Community Perception of DRM System and Actors - Perception of the community on the effectiveness of DRM
system in helping them to prevent, cope and recover from disasters
KebeleName
SERE TAWURETA
Prevention
Not effective
Coping
Not effective
Recovery
Not effective
SHOCHORA ABELA
SHOCHORA FESHO
SHOCHORA OGODAMA
Not effective
Not effective, but medium
Not effective
Not effective
Not effective, but medium
Not effective
Not effective
Not effective, but
medium
Not effective
Overall_Effectiveness
Not effective, because of
lack of financial support and
lack of awareness about
technology uses.
Not effective , because of
lack of financial support.
Lack of funding support
Lack of fund to support
SHOCHORA OSE
Not effective
Not effective
Not effective
Lack of fund to support
311
Page 3 of 3
Data_Collected_Date
Region S.N.N.P
Zone WOLAYITA
Thursday, December 12, 2019
Wereda HUMBO
Selected Indicator
Major Public Interventions Desired - Percentage of households by type of
intervention desired
Major public interventions desired by the community
Degree of Importance for the community
Agricultural inputs (fertilizer, improved seeds, etc.)
1st
2nd
3rd
0.00
0.00
1.22
Better job
16.80
18.69
11.38
Cash transfers/social assistance
1.07
8.41
4.88
Cash-for-work activities (not employment)
0.27
2.18
6.91
Enhance access to schools / School feeding for children
1.07
4.36
2.03
Food-for-work activities
6.67
9.35
22.36
Fuel subsidies
0.27
0.00
0.41
Medical assistance / access to health facilities
0.53
1.87
5.28
Micro-credit programmes
3.20
7.48
20.33
Rental subsidies
0.53
0.31
0.81
School fees for children
1.07
3.74
1.63
Subsidized food
1.87
9.03
3.66
Subsidized health care
1.60
12.46
8.94
Supplementary feeding for women and young children
1.07
11.21
5.69
Food aid
64.00
10.90
4.47
312
Page 1 of 1
WDRP Indicators
Other Community Characteristics
313
Wereda Disaster
Risk Profile
Data_Collected_Date
National Disaster Risk Management
Commission (NDRMC)
Thursday, December 12, 2019
Region S.N.N.P
Selected Indicator
Zone WOLAYITA
Capacity: Community Based Organizations in the Wereda
Name_Of_Organization
Kebele Name ABAYA CHOKARE
Youth association
Est._Year
Formal/Informal
2006
Formal
Women association
2004
Formal
Wereda HUMBO
Type of Members
Both
Women
Activity
Livestock activity
Credit and saving, Petty trade
Farmers association
Idir and Ekub
Kebele Name
Iqub
Idir
ABAYA GUNUCHO
2002
Long years
ago
2007
2006
Formal
Informal
Both
Both
Informal
Informal
Both
Both
Livestock activity
Social affairs
To save money
To save money for funeral
Omo Micho
Kebele Name ABELA AJAJA
Youth association
Farmer association
Women association
2004
2006
2000
2003
Formal
Formal
Formal
Formal
Both
Men and women
youth
Men and women
farmers
Women
To save money for different activities
Fattening, mining, crop production
Livestock rearing
Petty trade, fattening
Idir
Informal
Men and women
Iqub
Informal
Men and women
314
Page 1 of 8
Wereda Disaster
Risk Profile
Data_Collected_Date
National Disaster Risk Management
Commission (NDRMC)
Thursday, December 12, 2019
Region S.N.N.P
Zone WOLAYITA
Selected Indicator
Capacity: Community Based Organizations in the Wereda
Name_Of_Organization
Est._Year
Formal/Informal
Wereda HUMBO
Type of Members
Activity
Kebele Name
Edir
ABELA GEFETA
Youth association
1985
2004
Informal
Formal
Female and male
Female and male
To save money for funeral program
To create jobs
Women association
Farmers association
Kebele Name ABELA ZEGRE
Eder association
Women association
2004
1984
1984
2004
Formal
Formal
Informal
Formal
Female and male
Female and male
Both
Female
To strengthen women
To strength modern faring system
Social options.
Saving and group works
Farmers association
Youth association
Kebele Name AMBE SHOYA
Idir
Equb
Micro finances
Kebele Name AMPO KOYISHA
Farmers association
1984
2004
1992
1983
1959
1998
Formal
Formal
Informal
Informal
Formal
Formal
Both
Both
Both
Both
Both
Men
Modern farming practice
Saving and group works
To save money
To save money
To save money and development
Livestock husbandry
315
Page 2 of 8
Wereda Disaster
Risk Profile
Data_Collected_Date
National Disaster Risk Management
Commission (NDRMC)
Thursday, December 12, 2019
Region S.N.N.P
Zone WOLAYITA
Selected Indicator
Capacity: Community Based Organizations in the Wereda
Name_Of_Organization
Est._Year
Formal/Informal
Wereda HUMBO
Type of Members
Activity
Women association
Youth association
Farmers association
Kebele Name
Micro finances
ANKA WECHA
Women Association
Idir
Equb
Kebele Name
Edir and Ikub
BOSA WANCHE
Women association
Farmer association
Youth association
Kebele Name DEMBA KOYISHA
Self help groups
2002
2005
before 20
years ago
1999
2000
1992
1980
long years
ago
2000
2000
2008
1984
Formal
Formal
Informal
Women
Both
Both
Horticulture, Goat & Sheep production
Credit and Saving
Social affair
Formal
Formal
Informal
Informal
Informal
Formal
Formal
Formal
Informal
Both
Women s
Both
Both
Men and Women
Women
Men and Women
Men and Women
Both
To save money for the future
To save money for the future
To save money
To save money for the future
Social affair
Borrowing and saving, Livestock activity
Livestock activity
Livestock activity
Social services
316
Page 3 of 8
Wereda Disaster
Risk Profile
Data_Collected_Date
Region S.N.N.P
Zone WOLAYITA
Selected Indicator
Capacity: Community Based Organizations in the Wereda
Name_Of_Organization
Est._Year
Formal/Informal
National Disaster Risk Management
Commission (NDRMC)
Thursday, December 12, 2019
Wereda HUMBO
Type of Members
Activity
Youth association
Women association
Farmers association
Kebele Name ELA KEBELA
Farmers association
Women association
Kebele Name
Equp
GALICHA KARA
Idir
Farmer association
Women association
Kebele Name GUTUTO LARENA
Farmers Association
Youth Association
Women Association
2004
2004
1984
Long years
ago
1998
1982
1998
1992
1984
2006
2004
Formal
Formal
Formal
Formal
Formal
Both
Female
Both
Both
Women
Informal
Informal
Formal
Formal
Formal
Formal
Formal
Both sex
Both sex
Farmer
Women
Both
Both
Female
Saving and group works
Saving and group works
Practice modern farming system
Social affairs, saving and credit, animal
husbandry
Crop selling, Petty trade, for income
generation
For social related activity
For social related activity
Agricultural activity
To modern farming system
Saving system group working
Saving system group working
317
Page 4 of 8
Wereda Disaster
Risk Profile
Data_Collected_Date
Region S.N.N.P
Zone WOLAYITA
Selected Indicator
Capacity: Community Based Organizations in the Wereda
Name_Of_Organization
Est._Year
Formal/Informal
Elders Association
Kebele Name HOBICHA BADA
Farmers association
Youth association
Women association
Farmers association
1985
Long years
ago
2007
2007
2006
Informal
Informal
Formal
Formal
Formal
Kebele Name HOBICHA BONGOTA
Women association
Farmers association
Youth association
Edir and Ekub
Kebele Name HOBICHA DIGISO
Women association
2006
2006
2008
Long years
ago
2006
Formal
Formal
Formal
Informal
Formal
Youth association
2006
Formal
National Disaster Risk Management
Commission (NDRMC)
Thursday, December 12, 2019
Wereda HUMBO
Type of Members
Both
Both
Both
Women
Both
Women
Both
Both
Both
Activity
Social Negotiation works
For social affairs
Credit and Saving, Poultry production
Credit and Saving, Petty trade
Self help groups, farming activity, livestock
husbandry
Saving, petty trade, Livestock husbandry
Livestock husbandry, Saving Petty trade
Goat production and saving
Social affair
Women
Both
Petty trade, Livestock activities, Credit and
saving
Livestock activities
318
Page 5 of 8
Wereda Disaster
Risk Profile
Data_Collected_Date
Region S.N.N.P
Zone WOLAYITA
Selected Indicator
Capacity: Community Based Organizations in the Wereda
Name_Of_Organization
Est._Year
Formal/Informal
Farmers association
Edir and Ikub
Kebele Name KODO KANKO
Women Association
Farmers association
Youth Association
Elder group
Kebele Name KOYISHA GOLA
Eder association
Women association
Farmers association
Youth association
Kebele Name KOYISHA OGODAMA
Idir
Equb
2007
Long years
ago
2004
1984
2006
1985
1984
2004
1984
2004
1970
1972
Formal
Informal
Formal
Formal
Formal
Informal
Informal
Formal
Formal
Formal
Informal
Informal
National Disaster Risk Management
Commission (NDRMC)
Thursday, December 12, 2019
Wereda HUMBO
Type of Members
Both
Both
Activity
Livestock activities
For social affairs
Female
Both
Both
Both
Both
Female
Both
Both
Both
Both
Saving system group work
Practice modern farming system
Saving system group work
Social option
Social interaction works
Saving
Modern farming system
Saving
To save money & for social services
To save money
319
Page 6 of 8
Wereda Disaster
Risk Profile
Data_Collected_Date
National Disaster Risk Management
Commission (NDRMC)
Thursday, December 12, 2019
Region S.N.N.P
Zone WOLAYITA
Selected Indicator
Capacity: Community Based Organizations in the Wereda
Name_Of_Organization
Est._Year
Formal/Informal
Wereda HUMBO
Type of Members
Activity
Omo Micro Finance
Kebele Name KOYISHA WANGALA
Equb
Omomicho
Women association
Edir
Kebele Name
Ider
SERE TAWURETA
Equb
Omo Micro finance
Kebele Name SHOCHORA ABELA
Omo Micro finance
Equb
Idir
Kebele Name SHOCHORA FESHO
Farmers association
2001
2000
1997
2004
1998
1984
1982
1982
2001
1998
1992
1983
Informal
Informal
Informal
Informal
Informal
Informal
Informal
Formal
Formal
Informal
Informal
Informal
Both
both
both
Women
both
Both
Both
Both
Both
Both
Both
Farmers
For credit and saving
To save money top social services
To save money top social services
To save money top social services
To save money top social services
To save money and social services
To save money
To save money
Credit and saving
To save money
To save money
Development activity
320
Page 7 of 8
Wereda Disaster
Risk Profile
Data_Collected_Date
Region S.N.N.P
Zone WOLAYITA
Selected Indicator
Capacity: Community Based Organizations in the Wereda
Name_Of_Organization
Est._Year
Formal/Informal
Youth association
2006
Cooperatives
2006
Women association
2006
Kebele Name SHOCHORA OGODAMA
Women association
2004
Youth association
2004
Farmers association
1984
Edir and Ekub
Kebele Name
Edir
SHOCHORA OSE
1984
1984
Youth association
2004
Farmers association
1984
Women association
2004
Formal
Formal
Formal
Formal
Formal
Formal
Informal
Informal
Formal
Formal
Formal
National Disaster Risk Management
Commission (NDRMC)
Thursday, December 12, 2019
Wereda HUMBO
Type of Members
Youth
Both
Women
Women
Both
Both
Both
Both
Both
Both
Women
Activity
Crop and livestock production
Saving and crop production
Saving
Saving, Group works
Saving, Group works
Modern farming system
Social affair
For social affairs
Saving, Group work
Modern farming system
Saving, Group work
321
Page 8 of 8
Data_Collected_Date
Region
Zone
Wereda
Thursday, December 12, 2019
Selected Indicator
Supporting Agencies against Disasters - Percentage of households by supporting
institutions to handle or recover from disaster damages
Supporting Agencies Against Disasters
Response_Percentage
322
Page 1 of 1
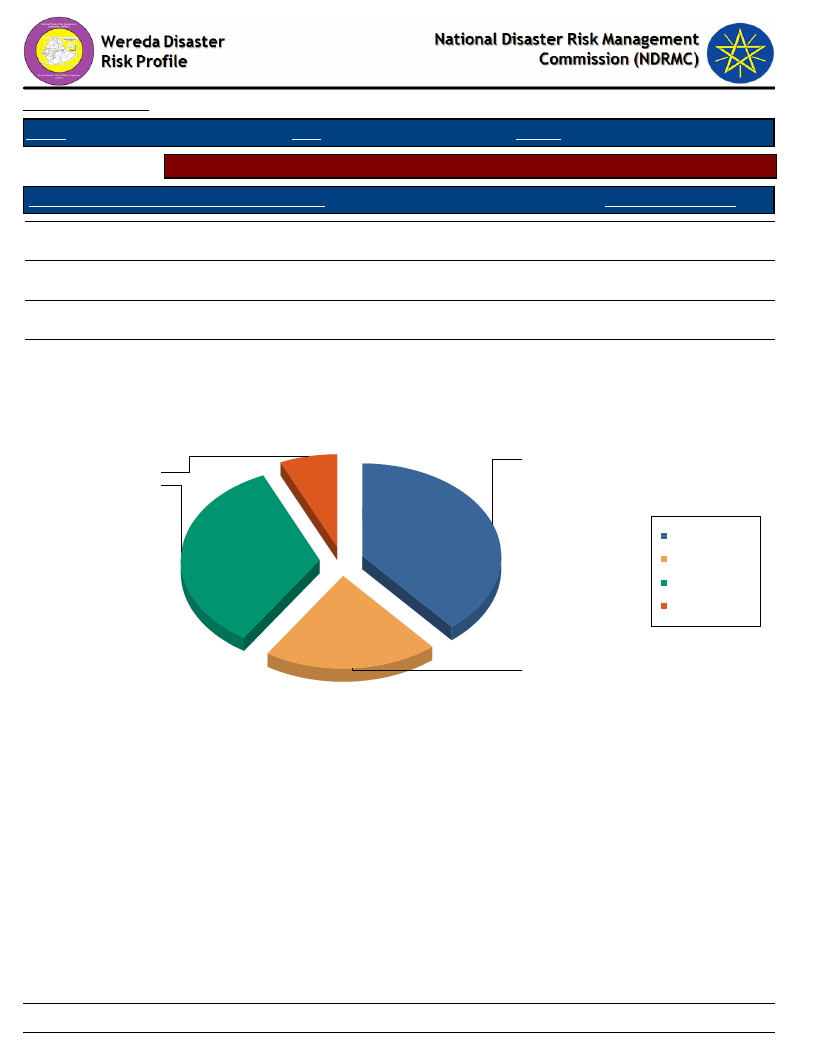
Data_Collected_Date
Region S.N.N.P
Zone WOLAYITA
Thursday, December 12, 2019
Wereda HUMBO
Selected Indicator
Types of support received by households during disasters
Type of Support Provided By Supporting Agencies
Response_Percentage
Emergency aid (food, water, shelter, etc.)
34.18
NA
6.63
Access to capital or loan for adaptation/protection measures
38.78
DK
20.41
Type of Support Provided By Supporting Agencies
39
7
34
Access to capital or loan
for adaptation/protection
measures
DK
Emergency aid (food,
water, shelter, etc.)
NA
20
323
Page 1 of 1

Wereda Disaster
Risk Profile
Data_Collected_Date
National Disaster Risk Management
Commission (NDRMC)
Thursday, December 12, 2019
Region S.N.N.P
Zone WOLAYITA
Wereda HUMBO
Selected Indicator
Government Actors in the Field of Disaster Risk Management - Government actors and their activities in the field
of Disaster Risk Managements
Government Institution
Wereda Administration Office
Activity
Description
Administrative work
Giving mandate to stakeholders, giving responsibilities for other sectors
Activity
Description
Assessment concerning hazards
How to prevent, prepared, response and adaptive measure is assessed
Activity
Description
Activity
Description
Government Institution
Wereda Agriculture Office
Activity
Description
Prevention
Water conservation activities, dam construction
Activity
Description
Preparedness
Awareness creation and early assessment
Activity
Description
Activity
Description
324
Page 1 of 3
Wereda Disaster
Risk Profile
Data_Collected_Date
National Disaster Risk Management
Commission (NDRMC)
Thursday, December 12, 2019
Region S.N.N.P
Zone WOLAYITA
Wereda HUMBO
Selected Indicator
Government Actors in the Field of Disaster Risk Management - Government actors and their activities in the field
of Disaster Risk Managements
Government Institution
Wereda Education Office
Activity
Description
Prevention
Teaching the communities on using alternative energy using
Activity
Description
Preparedness
Participating students on cleaning environment program
Activity
Response
Description
Activity
Description
Wise using of natural resource
Hygiene and sanitation
To teach the community about prevention
Government Institution
Wereda Health Office
Activity
Description
Prevention
Immunization environment control spray
Activity
Description
Preparedness
Awareness creation, using health developmental army
Activity
Description
Activity
Description
Response
Available treatment of health post, giving immunization diet terry up
325
Page 2 of 3

Wereda Disaster
Risk Profile
Data_Collected_Date
National Disaster Risk Management
Commission (NDRMC)
Thursday, December 12, 2019
Region S.N.N.P
Zone WOLAYITA
Wereda HUMBO
Selected Indicator
Government Actors in the Field of Disaster Risk Management - Government actors and their activities in the field
of Disaster Risk Managements
Government Institution
Wereda Police Station
Activity
Description
Pre-assessment works with crisis management committee
To study preparedness measures with woreda crisis management committee
Activity
Description
Awareness creation and warning about hazards
Warning at community level
Activity
Assessment after the occurrence of disaster
Description
Activity
Description
To assess the total expected loss by disaster
Immediate action and support during disaster
Helping of the community in all aspects through guarding, distribution of materials
Government Institution
Wereda Water Resource Development Office
Activity
Description
Prevention
Water conservation and dam construction
Activity
Description
Preparedness
Awareness creation and early warning assessment
Activity
Description
Activity
Description
Response
Preparing risk assessment report
326
Page 3 of 3
Data_Collected_Date
Thursday, December 12, 2019
Region S.N.N.P
Zone WOLAYITA
Wereda HUMBO
Selected
Indicator
Non-Government Actors in the Field of Disaster Risk Management - Non-government
actors and their activities in the field of Disaster Risk Management
Non Governmental Actors
in the Wereda
Activities
WFP
CSB and oil
IRC
Water treatment
IMC
Building clean water points
Concern World Wide (NGO)
NGOs
Water point building
Pure seed supply for hazard affected areas
Food supply for children
Concern World Wide(NGO)
Pure seed supply in hazard affected area
World Vision Ethiopia
Food supply and material transportation, risk assessment
Food supply, material transportation, risk assessment report
Food supply, material supply and shelter supply
Local Union
CDC
Food supply
Education material
Logistics for immunization
327
Page 1 of 1
Wereda Disaster Risk
Profile
Data_Collected_Date
National Disaster Risk Management
Commission (NDRMC)
December 12, 2019
Region S.N.N.P
Selected Indicator:
Zone
WOLAYITA
Interventions: Community Suggestions to Development Actors
Wereda HUMBO
Kebele Name
Type Of Disaster 1
Early Warning Indicator
ABAYA GUNUCHO
Flood
High rainfall, migration
Type Of Disaster 3
Early Warning Indicator
Animal disease
Shortage of grass and water
Preparedness Measure
Conduct soil and water conservation
Preparedness Measure
Type Of Disaster 2
Early Warning Indicator
Preparedness Measure
Drought
Less amount of rainfall, Market inflation
Engage in daily labor works
Type Of Disaster 4
Early Warning Indicator
Preparedness Measure
Kebele Name
Type Of Disaster 1
Early Warning Indicator
Preparedness Measure
Type Of Disaster 2
Early Warning Indicator
Preparedness Measure
ABELA AJAJA
Drought
Direction of wind, loss of vegetation, less rainfall
Planting of drought resistance crops
Flood
Heavy rainfall, wind direction
practice Soil and water conservation
Type Of Disaster 3
Early Warning Indicator
Preparedness Measure
Type Of Disaster 4
Early Warning Indicator
Preparedness Measure
328
Page 1 of 13

Region S.N.N.P
Selected Indicator:
Zone
WOLAYITA
Interventions: Community Suggestions to Development Actors
Wereda HUMBO
Kebele Name
Type Of Disaster 1
Early Warning Indicator
ABELA GEFETA
Drought
Wind direction, bird sound
Type Of Disaster 3
Early Warning Indicator
Preparedness Measure
Plant short cycle crop variety
Preparedness Measure
Type Of Disaster 2
Early Warning Indicator
Type Of Disaster 4
Early Warning Indicator
Preparedness Measure
Preparedness Measure
Kebele Name
Type Of Disaster 1
Early Warning Indicator
Preparedness Measure
Type Of Disaster 2
Early Warning Indicator
Preparedness Measure
ANKA WECHA
Drought
Shortage of rain fall
Planting of short cycle crops.
Crop Pest
Lack of rainfall
Providing of chemical vaccination.
Type Of Disaster 3
Early Warning Indicator
Preparedness Measure
Type Of Disaster 4
Early Warning Indicator
Preparedness Measure
Flood
Deforestation
Construction of soil and water activities.
329
Page 2 of 13

Region S.N.N.P
Selected Indicator:
Zone
WOLAYITA
Interventions: Community Suggestions to Development Actors
Wereda HUMBO
Kebele Name
Type Of Disaster 1
Early Warning Indicator
Preparedness Measure
Type Of Disaster 2
Early Warning Indicator
Preparedness Measure
Kebele Name
Type Of Disaster 1
Early Warning Indicator
Preparedness Measure
Type Of Disaster 2
Early Warning Indicator
Preparedness Measure
BOSA WANCHE
Drought
Wined direction, erratic rainfall
Sowing of drought resistant crops and trees,
Saving of food supplies and resources.
Flood
Heavy rainfall and run-off, Dark cloud, Direction
of wind.
Soil and water conservation activities
ABAYA CHOKARE
Flood
High rain fall, Wind direction, Increasing of river
size, Dark cloud
Dam construction, Soil and water conservation,
Guarding at night
Drought
Diminishing of spring water in size, Erratic
rainfall, Direction of wind
Saving of assets, Minimize expenditure
Type Of Disaster 3
Early Warning Indicator
Preparedness Measure
Type Of Disaster 4
Early Warning Indicator
Preparedness Measure
Livestock diseases
Breeding of tsetse fly, Long dry season,
Scarcity of water and pasture, Livestock
wCheeigmhitcalolsssp.ray, Shifting of grazing land,
Fodder preparation, Medicine preparation.
Human diseases
Breeding of mosquito
Using of mosquito net, Improving
environmental sanitation.
Type Of Disaster 3
Early Warning Indicator
Preparedness Measure
Type Of Disaster 4
Early Warning Indicator
Preparedness Measure
Livestock disease
High breeding of tsetse fly
Chemical spray, Fodder preparation
Human diseases
Diet loss, Mosquito breeding, Stagnant
water
Use of mosquito bed net, Chemical spray
330
Page 3 of 13

Region S.N.N.P
Selected Indicator:
Zone
WOLAYITA
Interventions: Community Suggestions to Development Actors
Wereda HUMBO
Kebele Name
Type Of Disaster 1
Early Warning Indicator
DEMBA KOYISHA
Drought
Star and wind direction
Type Of Disaster 3
Early Warning Indicator
Preparedness Measure
By using short cycle crop varieties
Preparedness Measure
Type Of Disaster 2
Early Warning Indicator
Type Of Disaster 4
Early Warning Indicator
Preparedness Measure
Preparedness Measure
Kebele Name
Type Of Disaster 1
Early Warning Indicator
Preparedness Measure
Type Of Disaster 2
Early Warning Indicator
Preparedness Measure
ELA KEBELA
Drought
Rain fall fluctuation
Animal disease
Type Of Disaster 3
Early Warning Indicator
Preparedness Measure
Type Of Disaster 4
Early Warning Indicator
Preparedness Measure
Crop disease
Flood
331
Page 4 of 13

Region S.N.N.P
Selected Indicator:
Zone
WOLAYITA
Interventions: Community Suggestions to Development Actors
Wereda HUMBO
Kebele Name
Type Of Disaster 1
Early Warning Indicator
Preparedness Measure
Type Of Disaster 2
Early Warning Indicator
Preparedness Measure
Kebele Name
Type Of Disaster 1
Early Warning Indicator
Preparedness Measure
HOBICHA DIGISO
Drought
Wind direction, Erratic rain fall, Loss of
vegetation cover
Sowing of drought resistant crops, Saving of food
supplies, Fodder preparation
Flood
High rainfall, Dark cloud, Direction of wind
Soil and water conservation activity
GALICHA KARA
Drought
Late onset and erratic rainfall
Save water and pasture for livestock
Type Of Disaster 3
Early Warning Indicator
Preparedness Measure
Type Of Disaster 4
Early Warning Indicator
Preparedness Measure
Livestock diseases
Breeding of tsetse fly, Loss of animal
weight, Scarcity of pasture land and water
Vaccination, Medical supply, Chemical
spray, Fodder preparation
Human disease
Diet loss and poor sanitation
Improve sanitation works, Improving of
diet, Medical supply
Type Of Disaster 3
Early Warning Indicator
Preparedness Measure
Flood
High rainfall
Soil and water conservation
Type Of Disaster 2
Early Warning Indicator
Preparedness Measure
Crop pest and disease
Fluctuation of rainfall
Use agro chemicals
Type Of Disaster 4
Early Warning Indicator
Preparedness Measure
332
Page 5 of 13

Region S.N.N.P
Selected Indicator:
Zone
WOLAYITA
Interventions: Community Suggestions to Development Actors
Wereda HUMBO
Kebele Name
Type Of Disaster 1
Early Warning Indicator
GUTUTO LARENA
Drought
Wind direction, star sine
Type Of Disaster 3
Early Warning Indicator
Preparedness Measure
Using short cycle crop, saving
Preparedness Measure
Type Of Disaster 2
Early Warning Indicator
Preparedness Measure
Flood
Heavy rain
Soil and water conservation
Type Of Disaster 4
Early Warning Indicator
Preparedness Measure
Kebele Name
Type Of Disaster 1
Early Warning Indicator
Preparedness Measure
Type Of Disaster 2
Early Warning Indicator
Preparedness Measure
HOBICHA BADA
Drought
Wind direction, Shortage of Rainfall, Aridity of
land and Long dry season
Planting of drought resistant trees and crops,
Saving of food supplies and resources.
Flood
Heavy rain fall and run-off, Dark cloud
Strengthening of water drains, Guarding at night
and give warn for the community.
Type Of Disaster 3
Early Warning Indicator
Preparedness Measure
Type Of Disaster 4
Early Warning Indicator
Preparedness Measure
Livestock Disease
Breeding of tsetse fly, Animal weight loss,
Scarcity of pasture land and water
Fodder preparation, Vaccination,
Destocking
Human Disease
Diet loss, High temperature, Mosquito
breeding, Poor Sanitation
Improve sanitation works, Diversify
livelihood activities
333
Page 6 of 13

Region S.N.N.P
Selected Indicator:
Zone
WOLAYITA
Interventions: Community Suggestions to Development Actors
Wereda HUMBO
Kebele Name
Type Of Disaster 1
Early Warning Indicator
Preparedness Measure
HOBICHA BONGOTA
Drought
Low rain fall, High temperature
Saving
Type Of Disaster 3
Early Warning Indicator
Preparedness Measure
Animal disease
Abortion of pregnant cow, Loss of fodder
Providing fodder from other area
Type Of Disaster 2
Early Warning Indicator
Preparedness Measure
Flood
High rain fall run-off
Soil and water conservation
Type Of Disaster 4
Early Warning Indicator
Preparedness Measure
Kebele Name
Type Of Disaster 1
Early Warning Indicator
Preparedness Measure
Type Of Disaster 2
Early Warning Indicator
Preparedness Measure
ABELA ZEGRE
Drought
Direction of star and wind, Bird sound
Planting short cycle crops
Type Of Disaster 3
Early Warning Indicator
Preparedness Measure
Type Of Disaster 4
Early Warning Indicator
Preparedness Measure
334
Page 7 of 13

Region S.N.N.P
Selected Indicator:
Zone
WOLAYITA
Interventions: Community Suggestions to Development Actors
Wereda HUMBO
Kebele Name
Type Of Disaster 1
Early Warning Indicator
KODO KANKO
Drought
Wind and star direction
Type Of Disaster 3
Early Warning Indicator
Preparedness Measure
Using short cycle crop and save property
Preparedness Measure
Type Of Disaster 2
Early Warning Indicator
Type Of Disaster 4
Early Warning Indicator
Preparedness Measure
Preparedness Measure
Kebele Name
Type Of Disaster 1
Early Warning Indicator
Preparedness Measure
Type Of Disaster 2
Early Warning Indicator
Preparedness Measure
KOYISHA GOLA
Drought
Direction of star, wind and birds sound
To use short cycle crop variety.
Type Of Disaster 3
Early Warning Indicator
Preparedness Measure
Type Of Disaster 4
Early Warning Indicator
Preparedness Measure
335
Page 8 of 13

Region S.N.N.P
Selected Indicator:
Zone
WOLAYITA
Interventions: Community Suggestions to Development Actors
Wereda HUMBO
Kebele Name
Type Of Disaster 1
Early Warning Indicator
Preparedness Measure
Type Of Disaster 2
Early Warning Indicator
Preparedness Measure
KOYISHA OGODAMA
Drought
Shortage of rainfall
Planting of short cycle crop
Flood
Heavy rainfall
Soil and water conservation
Type Of Disaster 3
Early Warning Indicator
Preparedness Measure
Type Of Disaster 4
Early Warning Indicator
Preparedness Measure
Grasshopper
Seasonal variation during crop planting
Planting of Pest resistant crop and spray
chemicals
Kebele Name
Type Of Disaster 1
Early Warning Indicator
Preparedness Measure
Type Of Disaster 2
Early Warning Indicator
Preparedness Measure
KOYISHA WANGALA
Drought
Shortage of rainfall
Saving water
Crop pest
Shortage of rainfall
Using chemical
Type Of Disaster 3
Early Warning Indicator
Preparedness Measure
Type Of Disaster 4
Early Warning Indicator
Preparedness Measure
Flood
Heavy rainfall(mountain area)
Soil and water conservation
336
Page 9 of 13

Region S.N.N.P
Selected Indicator:
Zone
WOLAYITA
Interventions: Community Suggestions to Development Actors
Wereda HUMBO
Kebele Name
Type Of Disaster 1
Early Warning Indicator
Preparedness Measure
AMBE SHOYA
Drought
Shortage of rainfall, Over production of caw kali
Saving for the future.
Type Of Disaster 3
Early Warning Indicator
Preparedness Measure
Crop pest
Shortage of rainfall
Save water banks
Type Of Disaster 2
Early Warning Indicator
Preparedness Measure
Flood
High mountainous, Poor water and soil
conservation
Soil and water conservation
Type Of Disaster 4
Early Warning Indicator
Preparedness Measure
Livestock diseases
Lack of water and grass
Keep grazing land for the future need
Kebele Name
Type Of Disaster 1
Early Warning Indicator
Preparedness Measure
Type Of Disaster 2
Early Warning Indicator
Preparedness Measure
AMPO KOYISHA
Drought
Direction of wind, Erratic rainfall
Sowing of drought resistant crops
Flood
Heavy rain, Dark cloud, Direction of wind
Soil and water conservation activities
Type Of Disaster 3
Early Warning Indicator
Preparedness Measure
Type Of Disaster 4
Early Warning Indicator
Preparedness Measure
Crop diseases
Use of Pesticides
Human diseases
Breeding of mosquito
Use of bed net, Sanitation works
337
Page 10 of 13
Region S.N.N.P
Selected Indicator:
Zone
WOLAYITA
Interventions: Community Suggestions to Development Actors
Wereda HUMBO
Kebele Name
Type Of Disaster 1
Early Warning Indicator
Preparedness Measure
SERE TAWURETA
Drought
Shortage of rain fall
Daily labor work
Type Of Disaster 3
Early Warning Indicator
Preparedness Measure
Crop diseases
Shortage of rainfall
Building of water banks
Type Of Disaster 2
Early Warning Indicator
Preparedness Measure
Livestock disease
Shortage of water and Lack of grass
Have grazing land for grass
Type Of Disaster 4
Early Warning Indicator
Preparedness Measure
Kebele Name
Type Of Disaster 1
Early Warning Indicator
Preparedness Measure
Type Of Disaster 2
Early Warning Indicator
Preparedness Measure
SHOCHORA ABELA
Drought
Shortage of rain fall
Planting of short cycle crops
Flood
Heavy rainfall
Construction of soil and water
Type Of Disaster 3
Early Warning Indicator
Preparedness Measure
Type Of Disaster 4
Early Warning Indicator
Preparedness Measure
Crop pest
Seasonal variation during crop plantation
time
Pest resistant crop and Spray chemicals
338
Page 11 of 13

Region S.N.N.P
Selected Indicator:
Zone
WOLAYITA
Interventions: Community Suggestions to Development Actors
Wereda HUMBO
Kebele Name
Type Of Disaster 1
Early Warning Indicator
Preparedness Measure
SHOCHORA FESHO
Drought
Shortage of rainfall, Loss of vegetation
Sowing of drought resistant crops, Saving
Type Of Disaster 3
Early Warning Indicator
Preparedness Measure
Livestock diseases
Shortage of rain fall and declining of
fodder
Fodder preparation, Medical treatment
Type Of Disaster 2
Early Warning Indicator
Preparedness Measure
Flood
High rainfall
Building of water ways
Type Of Disaster 4
Early Warning Indicator
Preparedness Measure
Kebele Name
Type Of Disaster 1
Early Warning Indicator
Preparedness Measure
Type Of Disaster 2
Early Warning Indicator
Preparedness Measure
SHOCHORA OGODAMA
Drought
Star and wind direction, Birds sound
Use of short cycle crops
Type Of Disaster 3
Early Warning Indicator
Preparedness Measure
Type Of Disaster 4
Early Warning Indicator
Preparedness Measure
339
Page 12 of 13

Region S.N.N.P
Selected Indicator:
Zone
WOLAYITA
Interventions: Community Suggestions to Development Actors
Wereda HUMBO
Kebele Name
Type Of Disaster 1
Early Warning Indicator
SHOCHORA OSE
Drought
Star and wind direction
Type Of Disaster 3
Early Warning Indicator
Preparedness Measure
Use of short cycle crops
Preparedness Measure
Type Of Disaster 2
Early Warning Indicator
Type Of Disaster 4
Early Warning Indicator
Preparedness Measure
Preparedness Measure
340
Page 13 of 13

Wereda Disaster Risk
Profile
Data_Collected_Date
Region S.N.N.P
Zone
WOLAYITA
National Disaster Risk Management
Commission (NDRMC)
Thursday, December 12, 2019
Wereda HUMBO
Selected Indicator
Wereda Strengths, weaknesses, opportunites and treats (SWOT) Analysis
Kebele Name
ABAYA GUNUCHO
ABELA AJAJA
Strength
- High social interaction
- Literacy
- High social interaction
ABELA GEFETA
ANKA WECHA
- High social interaction
- Literacy
- High social interaction
Weakness
- Lack of awareness
- Poor working habit
- Poor awareness
- Poor working habit
- Poor awareness
- Lack of awareness
- Social problem
BOSA WANCHE
- High Social interaction
- Use of modern
agricultural technology
- Presence of soil and
water
conservation activities
- Water access for small
scale irrigation
in some part of population
- Low awareness
- Illiteracy
- Manpower is not fully
participated.
Opportunity
- Road accessibility
- Dam construction
- Access to improved
agricultural input
- Road and dam construction
- Road construction
- Dam Construction
- Access to improved
agricultural inputs
such as, fertilizer, seeds,
pesticides.
- Access of agricultural
extension services.
- Access of health post.
- Scholl access from grade 1-8,
Irrigation dam
Threat
- Luck of funding
- poor financial support
- Lack of fund
- Lack of funding
- Lack of funding, new
disaster
- Lack of financial
institutions
- Increased severity of
disasters.
- Lack of funding, High
population density.
- Scarcity of land.
341
Page 1 of 6
Wereda Disaster Risk
Profile
Data_Collected_Date
Region S.N.N.P
Zone
WOLAYITA
National Disaster Risk Management
Commission (NDRMC)
Thursday, December 12, 2019
Wereda HUMBO
Selected Indicator
Wereda Strengths, weaknesses, opportunites and treats (SWOT) Analysis
Kebele Name
ABAYA CHOKARE
Strength
- High social interaction
- Use of small scale
irrigation
- Accessibility of water
for irrigation in some part
of the kebele
DEMBA KOYISHA
ELA KEBELA
- High social interaction
- Literacy
- High social interaction
Weakness
- poor working habit
- Low awareness
- Illiteracy,
Improper settlement of the
community
- In sufficient water shed
development
- Poor working habit
- Lack of awareness
regarding to disaster
- Low awareness
Opportunity
- Temporary shelter built for
victims
- Access of health post, School
access
- Access to improved
agricultural inputs
- Access to improved
agricultural extension services
- Road construction
Threat
- Increased severity of
disaster
- Absence of effective
dam along bilate river
- Lack of funding
- Lack of fund
- Access to improved
agricultural inputs
- Access to improved
agricultural
extension services
- Health post school from
grade 1 up to 8
- Increased severity of
disasters
- Lack of funding
342
Page 2 of 6

Wereda Disaster Risk
Profile
Data_Collected_Date
Region S.N.N.P
Zone
WOLAYITA
National Disaster Risk Management
Commission (NDRMC)
Thursday, December 12, 2019
Wereda HUMBO
Selected Indicator
Wereda Strengths, weaknesses, opportunites and treats (SWOT) Analysis
Kebele Name
HOBICHA DIGISO
Strength
- Soil and water
conservation activities
- Assessing of job
opportunity
for additional income
GALICHA KARA
GUTUTO LARENA
- High social interaction
- Literate
- Good saving habit
- High social interaction
- Literate people
Weakness
- Illiteracy
- Only depend on rainfall
- Low awareness
- Scarcity of land
- Lack of awareness
- Social problem
- Poor working habit
- Social problem,
Poor working habit
- Lack consensus
Opportunity
- Access to improved
agricultural inputs,
like, seeds, fertilizers,
pesticides
- Access to improved
agricultural extension
services
- Access to education
- Access to health extension
services
- Availability of NGOs
- Good support in soil and
water conservation activity
- Soil and water conservation
- Awareness creation
Threat
- Lack of funding
- Increment of severity of
disasters
- Severity of disaster
- Lack of funding
- Climate change
- Increased
- Lack of fund
343
Page 3 of 6

Wereda Disaster Risk
Profile
Data_Collected_Date
Region S.N.N.P
Zone
WOLAYITA
National Disaster Risk Management
Commission (NDRMC)
Thursday, December 12, 2019
Wereda HUMBO
Selected Indicator
Wereda Strengths, weaknesses, opportunites and treats (SWOT) Analysis
Kebele Name
HOBICHA BADA
Strength
- High social interaction
- Soil and water
conservation activity
- Assessing and creating
job opportunities
for income generation.
HOBICHA
BONGOTA
- High social interaction
ABELA ZEGRE
KODO KANKO
KOYISHA GOLA
- High social interaction
- Literacy
- High social interaction
- Literate people
- High social interaction
- Literacy
Weakness
- Depended on rain fed
agriculture.
- Unwise use of agricultural
inputs,
Low use of modern
technology.
- Illiteracy
- Lack of awareness
- Lack of awareness
- Poor working habit
- Lack of awareness
regarding to disaster
- poor working habit
- Low awareness
- Poor working habit
- Law awareness about
disaster
Opportunity
- Access to agricultural
extension services
through government and NGOS.
- Access to improved
agricultural inputs,
such as, seeds, fertilizers,
pesticides,
etc.
- Accessibility of health post
and health center.
- School access fro grade 1 up
to 10
- Drought tolerant SPP supply
- Improvements of seeds and
other supply
- Health post
- School
- Road construction, Dam
- access to road
- awareness creation
- Road construction, Dam
- Awareness creation
Threat
- Frequency and severity
of disasters.
- Poor road construction,
High population growth.
- Lack of funding.
- Severity of diseases
- Lack of funding
- Lack of fund
- lack of fund
- Lack of fund
344
Page 4 of 6

Wereda Disaster Risk
Profile
Data_Collected_Date
Region S.N.N.P
Zone
WOLAYITA
National Disaster Risk Management
Commission (NDRMC)
Thursday, December 12, 2019
Wereda HUMBO
Selected Indicator
Wereda Strengths, weaknesses, opportunites and treats (SWOT) Analysis
Kebele Name
KOYISHA
OGODAMA
KOYISHA
WANGALA
AMBE SHOYA
AMPO KOYISHA
Strength
- High social interaction
- Literacy
- High social interaction
- Literate people
- High social interaction
- Literacy
- Soil and water
conservation activities
Weakness
- Lack of awareness
- Poor working habit
- Lack of awareness
- Lack of awareness
- Poor working habit
- Illiteracy
- Lack of awareness
SERE TAWURETA
SHOCHORA
ABELA
SHOCHORA
FESHO
- High social interaction
- Literacy
- High social Interaction
- Literacy
- High social interaction,
- Initiation and give
attention to teach
their children
- Soil and water
conservation activities
- Water harvesting
technology
- Lack of awareness
- Poor working habit
- lack of awareness
- Poor working habit
- Poor working habit
- Poor use of improved
fertilizer
- Rainfall dependency
Opportunity
- Road construction
- Soil and water conservation
- Saving life
- Road construction
- Dam Construction
- Access to improved
agricultural inputs
- Access to improved
agricultural
extension services
- Access to health post
- Road construction
- Dam construction
- Road construction
- Access to agricultural
extension services
- Access to health post, Access
to school
- Good agro ecology of the
area
- Access to improved
agricultural inputs
Threat
- Lack of fund
- Lack of fund
- infrastructure problems
- Lack of fund
- Increased severity of
disasters
- Lack of fund
- Lack of fund
- New disaster
- Lack of fund
- Increased severity of
disasters
- Rainfall fluctuation
- Increment of
temperature
345
Page 5 of 6

Wereda Disaster Risk
Profile
Data_Collected_Date
Region S.N.N.P
Zone
WOLAYITA
National Disaster Risk Management
Commission (NDRMC)
Thursday, December 12, 2019
Wereda HUMBO
Selected Indicator
Wereda Strengths, weaknesses, opportunites and treats (SWOT) Analysis
Kebele Name
SHOCHORA
OGODAMA
SHOCHORA OSE
Strength
- High social interaction
- High social interaction
Weakness
- Poor working habit
- Lack of awareness about
disaster
- Poor working habit
- Lack of awareness about
disaster
Opportunity
- Road construction, Dam
- Awareness creation
- Road construction
- Awareness creation
Threat
- Lack of funding
- Lack of fund
346
Page 6 of 6