


NATIONAL
DISASTER RISK MANAGEMENT COMMISSION
(NDRMC)
WOREDA DISASTER RISK PROFILE (WDRP)
REGION: SNNP
ZONE: WEST OMO
WEREDA: SURMA
December, 2020
Addis Ababa

About the National Disaster Risk Management Commission (NDRMC)
The National Disaster Risk Management Commission (NDRMC) was reestablished in
December 2015 and recognized by an act of Council of Ministers (Regulation No.
363/2015) as an autonomous Federal Government office mandated to conduct
appropriate activities for the comprehensive implementation and realization of
the objectives of the National Disaster Risk Management Policy and Strategy and
to coordinate, monitor and provide appropriate support with respect to activities
carried out by the lead sector institutions.
Address: Kirkos Sub-city Behind Dembel City Center, Addis Ababa, Ethiopia.
P.O.Box: 5686
Tele: 0115524259/4272
Website: www.dppc.gov.et
© 2020 National Disaster Risk Management Commission. All rights reserved
Printed in Addis Ababa, Ethiopia.
Citation- This Document May be Cited as Follows:
National Disaster Risk Management Commission (2020),Surma Woreda Disaster Risk
Profile, Addis Ababa, Ethiopia.

PREFACE
Ethiopia is well aware of the impact that disasters can have on the
development goals that we are rigorously pursuing through our
Growth and Transformation Plan II. With this recognition we
started a paradigm shift a few years ago, largely triggered by the
revised National Policy and Strategy on Disaster Risk Management.
To make the DRM programme implementation in the country well-informed, a
comprehensive information management system is required. We have been
undertaking a comprehensive risk assessment exercise under which Disaster Risk
Profiles are being prepared for each district and at sub-district levels in the country.
This Wereda Disaster Risk Profile establishes an extensive database on disaster risk
elements that will help decision makers at all levels to be better informed at
community and Wereda level about the characteristics of potential hazards, their
potential exposure, vulnerabilities of communities, capacities and that can also be an
input for Wereda Disaster Risk Reduction Plans and area specific early warning tools.
Wereda Disaster Risk Profiles developed are publically available here for the use of all
development partners and government sectors at all levels. Also, other data sources
of NDRMC, such as Desinventar, Livelihood Baseline and the Early Warning information
will be integrated and harmonized with this Information Management System.
Finally, we need to acknowledge the support of partners who have funded this
programme and we also look for the support of donors and all development partners
in order to achieve the ambitious indicators of this risk information and providing
every district with the disaster risk profile and their respective risk-informed plans.
H.E. Ato Mitiku Kassa
Commissioner
National Disaster Risk Management Commission (NDRMC)
The Federal Democratic Republic of Ethiopia (FDRE)

PREFACE
Woreda Disaster Risk Profiling (WDRP) is a government owned
programme undertaken by the National Disaster Risk
Management Commission (NDRMC) in collaboration with
regional DRM offices and development partners to provide
baseline information for disaster risk management practices
and activities in the country. The programme is designed by
taking into account the experiences gained from the implementation of pervious
strategies and actions like the Hygo Framework for Action (2000-2015) and the Sendai
Framework for Disaster Risk Reduction (2015-2030).
WDRP is composed of diversified indicators including hazard related issues, crop and
livestock production, landholding and environmental issues, human and livestock
health issues, education and social issues at wereda and kebele level. It provides
basic and detailed indicators with both quantitative and qualitative information which
obtained from both primary and secondary data sources.
Moreover, two pages summary of profiles is also prepared to help users easily
understand WDRP results for each wereda without going into detail for all indicators.
In addition to this booklet, developed profiles are uploaded on WDRP website
(http://profile.ndrmc.gov.et) to be viewed by all users; we encourage all DRM actors
at all levels to use this profile as baseline information for all DRM initiatives.
This WDRP booklet was produced through exemplary collaboration of all concerned
bodies and I would like to give my deepest gratitude to all who directly or indirectly
contribute for the success of the programme particularly for data enumerators and
supervisors, data encoders and profile development teams, consultants and advisors,
partner ministries and all DRM stakeholders.
Abraham Abebe
Director
Disaster Risk Reduction and Rehabilitation Directorate (DRRRD)
National Disaster Risk Management Commission (NDRMC)
Contents
No. Indicator Name
Page
Preliminary Information
I.
Preface
II.
Wereda Location in Ethiopian Map
III.
Methodology
IV.
Summary Profile
Hazard Related Characteristics
1
1.
Biological Hazards of the Wereda
2
2.
Geological Hazards of the Wereda
3
3.
Hydro Metrological Hazards of the Wereda
4
4.
Socio Economic Hazards of the Wereda
5
5.
Technological Hazards of the Wereda
6
6.
Disaster Characteristics By Kebele
7
7.
Hazards: Conflict as an Issue
22
8.
Hazard Situation During Last Disaster - Characteristics of most recent disaster that
affected the community
24
9.
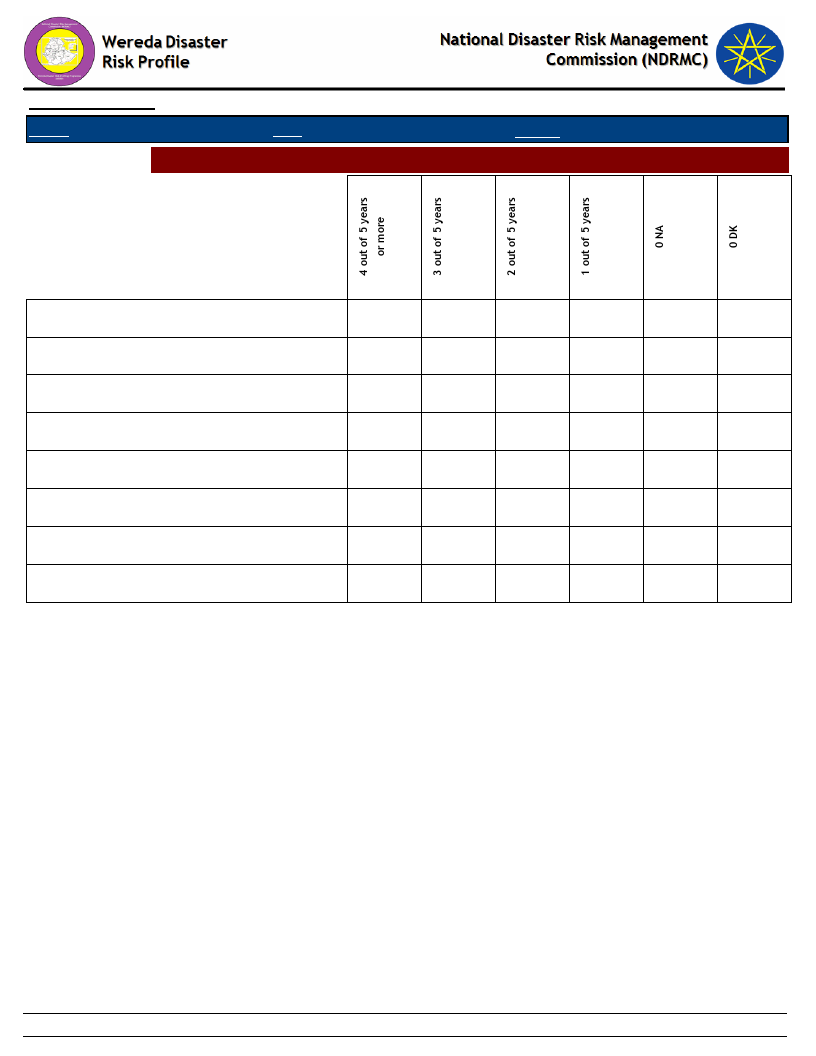
Frequency of Disaster Occurrence
27
10.
Household Exposure to Hazards
28
11.
Months of Occurrence of Frequent Disasters
29
Conflicts: Perception of households on conflict issues - Is conflict an issue in this
12.
community?
30
13.
Conflicts: Perception of households on conflict issues - Who do you turn to in case
of a conflict?
31
14.
Losses from Disasters - Losses from all disasters (household response in %)
32
No. Indicator Name
Page
15.
Losses from Disasters - Main Losses by Type of Disasters (household response in %) 33
16.
Losses from Disasters - Secondary Losses by Type of Disasters (household response
in %)
35
17.
Seasonal Calendar for Hazards, Activities and Income Level By Kebele
38
Infrastructure Access Characteristics
18.
Physical Vulnerability: Access to Roads & Urban Centres - Households access to
road and urban centre
51
Physical Vulnerability: Access to Electricity - Households’ access and utilization of
19.
electricity
52
20.
Physical Vulnerability: Type of Dwelling Units - Households’ type of dwelling houses 53
Socio Demographic Characteristics
21.
Economic Vulnerability: Level of Migration - Migration level and its characteristics
by Kebele
55
22.
Economic Vulnerability: Household Migration - Household migration and reason for 57
migration
23.
Economic Vulnerability: Household Migration - Disasters as a triggering factor for
migration (households response in %)
58
24.
Demography: Population Structure
59
25.
Demography: Population Trends and Ethnic Groups
61
Social Vulnerability: Household Demographic Characteristics - Demographic
26.
characteristics of households
62
Social Vulnerability: Level of Educational Attainment - Education status of
27.
household members
63
28.
Social Vulnerability: Gender Parity - Gender parity in education level (7+ years)
and household heading
64
Environmental Characteristics
Environmental Situation: Environmental Problems - Major environmental problems
29.
by Kebele
66
No. Indicator Name
Page
30.
Environmental Situation: General Land Quality - Perceptions of the community
on changes in the general quality of land over a decade
67
Environmental Situation: Changes in Landscape - Changes observed by the
31.
community on landscape and the problems due to the changes
69
32.
Environmental Situation: Land-Use other than crop production - Types of land use
other than crop production across Kebeles
71
33.
Environmental Situation: Deforestation - Observed changes over levels of
deforestation by the community and its problems
73
Environmental Situation: Natural Resources Availability - Natural resources
34.
available and changes observed by the community
74
Environmental Situation: Rainfall & Temperature - Observed changes on rainfall
35.
and temperature by the community over the last decade
84
36.
Environmental Situation: Reasons for Environmental Changes
86
Environmental Situation: Soil Erosion - Observed changes on levels of soil erosion
37.
by the community
88
Livelihood, Occupation and Source of food
Economic Vulnerability: Major Occupational Categories - Major categories of
38.
occupation and percent of population engaged in the occupation by Kebele
90
39.
Economic Vulnerability: Livelihoods - Households important sources of
livelihood (response in %)
93
Economic Vulnerability: Occupational Categories - Percent of population above 15
40.
years age by occupation categories
95
41.
Economic Vulnerability: Sources of Food - Households source for different food
items (response in %)
96
Crop Production
Hazards: Change in Crop Damages - Proportion of total crop damage (percentage
42.
response by households)
100
Hazards: Change in Crop Damages - Major reasons for crop damage (percentage
43.
response by households)
101
Hazards: Change in Crop Damages - Proportion of Damage for Major Crops
44.
(percentage response by households)
102
No. Indicator Name
Hazards: Change in Crop Damages - Reasons for Damage of Major Crops
45.
(percentage response by households)
Agricultural Situation: Change in Crops Grown - Five major crops grown by
46.
proportion of total cultivated land
47.
Agricultural Situation: Access to Extension - Perception of the community on
Access to Agricultural extension Services
Page
103
104
109
48.
Economic Vulnerability: Crops Grown - Types of crops grown by households
111
Economic Vulnerability: Crops Grown - Proportion of households by amount of yield
49.
of major crops (last year)
112
Economic Vulnerability: Crops Grown - Proportion of households by amount of yield
50.
of major crops (Five years ago)
113
51.
Economic Vulnerability: Land Ownership and Quality - Landownership of households 114
52.
Economic Vulnerability: Land Ownership and Quality - Farmers’ perception on the
quality of their agricultural land
115
53.
Agricultural Situation: Access to Inputs - Perception of the community on access
to improved agricultural inputs
116
54.
Agricultural Situation: Water for irrigation - Access to water for irrigation in the
community
117
Agricultural Situation: Soil Fertility - Perception of the community on soil fertility
55.
and its change over time
118
Economic Vulnerability: Status of Agriculture - Methods of tillage, Irrigation and
56.
other agricultural input utilization by households
120
57.
Economic Vulnerability: Change in Agricultural Situation - Households
perception on changes of crop type, size of cultivated area and crop yields
121
58.
Economic Vulnerability: Crops Grown - Number of crops grown by households
123
Livestock Production
Agricultural Situation: Status of Livestock Disease - Change In Livestock Disease
59.
Status By Kebele
125
Livestock Prevalent of Diseases & Veterinary Facility - Livestock Diseases
60.
Prevalence
127
No. Indicator Name
Page
Livestock Prevalent of Diseases & Veterinary Facility - Evaluation of Access to
61.
Veterinary Services and Livestock Drugs
128
62.
Agricultural Situation: Water Availability for Livestock - Water availability for
livestock in the community
129
Agricultural Situation: Livestock Diversity - Type of livestock and their economic
63.
importance in the community
131
Economic Vulnerability: Livestock Ownership and Changes - Percentage of
64.
households by number and type of livestock owned
135
Economic Vulnerability: Livestock Ownership and Changes - Households’ perception
65.
on changes in livestock number in the last five years (response in %)
137
66.
Economic Vulnerability: Livestock Ownership and Changes - Households
perception on changes in livestock number in the last five years (response in %)
140
Agriculture (Livestock): Pasture Availability - Households’ perception on access and
67.
quality of pasture
142
Agriculture (Livestock): Pasture Availability - Households’ perception on
68.
problematic months for pasture availability
143
Agriculture (Livestock): Water Availability - Households’ response on water
69.
availability for livestock
144
Agriculture (Livestock): Water Availability - Households’ perception on problematic
70.
months of water availability for livestock
145
Agriculture (Livestock): Water Availability - Sources of water for livestock
71.
(households response in %)
146
Access to Markets and Credit
Economic Vulnerability: Proportion of Produce Sold and Market - Proportion of
72.
crops and livestock sold from total production and markets
148
73.
Economic Vulnerability: Kebele Access to Markets - Access to market by Kebele
149
Economic Vulnerability: Formal & Informal Transfers - Percentage of households
74.
reporting received formal transfers
150
No. Indicator Name
Page
75.
Capacity: Access to Credit Facilities - Households access to credit facilities
152
Capacity: Access to Credit Facilities - Percentage of households by major reasons
76.
of borrowing money
153
Capacity: Access to Credit Facilities - Percentage of households by major sources
77.
of credit
154
Capacity: Access to Credit Facilities - Percent of households with ability to raise
78.
500 birr in one week
155
Health and Sanitation Characteristics
79.
Household Access to Health Facilities - Where do patients go for health care?
157
80.
Hazards: Health problems and changes over the last decade
158
81.
Household Health Status - Households’ health condition and major health problems 161
Household Access to Sanitation - Percentage of households with access to different
82.
kind of toilet facilities
163
Household Access to Drinking Water - Sources of drinking water for households
83.
(response in %)
164
Household Access to Drinking Water - Households’ methods of treating drinking
84.
water
165
Household Access to Drinking Water - Number of times households fetch water in a
85.
week
166
Household Access to Drinking Water - Time taken per day to fetch water for
86.
households
167
Coping Mechanisms and Preparedness Measures
87.
Capacity: Community Preparedness against Sudden Onset Disasters
169
88.
Capacity: Community Preparedness against Increase in Disaster Intensity
173
89.
Capacity: Community Preparedness against Disasters
176
90.
Hazard: Coping and recovering during last Disaster
179
91.
Capacity: Type Community Participation
189
No. Indicator Name
Page
Capacity: Recovery from Losses from Disasters - Percentage of Households who
92.
have managed to recover from losses of disasters
190
Capacity: Coping Strategies Adopted by Households - Main coping strategies
93.
adopted by households to recover from respective losses
191
94.
Capacity: Coping Strategies Adopted by Households - Percentage of households
by frequency of main coping strategies adopted
195
95.
Capacity: Alternative Livelihood Sources - Alternative livelihood sources suggested
by the community
197
96.
Capacity: Recovery from Losses from Disasters - Percentage of households
recovered from past disasters by type of Disasters
199
Capacity: Recovery from Losses from Disasters - Proportion of households
97.
recovered by type of Losses
200
Capacity: Coping Options if More Resources Available - What coping strategy could
98.
be adopted if more resource were available?
201
Capacity: Coping Strategies Adopted by Households - Percentage of households by
99.
major type of coping strategies adopted (at least once)
202
Capacity: Coping Strategies Adopted by Households - Main coping strategies
100.
adopted by households for respective disasters
204
Capacity: Coping Strategies Adopted by Households - Secondary coping strategies
101.
adopted by households for respective disasters
209
Community Perception and Suggestions
Interventions: Community Perception on Mediums to Influence DRM Actors -
102. Community perception on the effectiveness of institutional channels to use to
213
influence DRM actors
Interventions: Community Perception on their Knowledge used in DRM Process -
103. Perception of the community on how their knowledge influences the priorities and 217
measures of DRM actors
Interventions: Suggestions to DRM Actors in the Area - Community suggested
104.
measures to DRM actors in the area for effective DRM actions
218
No. Indicator Name
Page
Economic Vulnerability: Community Suggestions to Improve Economic Situation -
105.
Community suggested measures to improve the economic situation of the area
221
106. Community Awareness of Disaster Risk Management System and Actors
224
Community Perception of DRM System and Actors - Perception of the community on
107. the effectiveness of DRM system in helping them to prevent, cope and recover
234
from disasters
Major Public Interventions Desired - Percentage of households by type of
108.
intervention desired
236
Others
109. Capacity: Community Based Organizations
239
Supporting Agencies against Disasters - Percentage of households by supporting
110.
institutions to handle or recover from disaster damages
242
Type of Support Received From Supporting Agencies – Household responses of types
111.
of support received from supporting agencies
2432
112.
Government Actors in the Field of Disaster Risk Management - Government actors
and their activities in the field of Disaster Risk Managements
244
113.
Non-Government Actors in the Field of Disaster Risk Management - Non-government
actors and their activities in the field of Disaster Risk Management
247
114. Interventions: Community Suggestions to Development Actors
248
115. Wereda SWOT Analysis
258

METHODOLOGY
WDRP Content :
• Comprehensive information on disaster risk components
(Hazards, Vulnerability and Capacity)
• Multi-sectoral and multi-hazard information.
Research Approach:
• Mixed Approach
• Both quantitative and qualitative information
Data Sources:
• Primary Data:
Household Questionnaires: statistically significant number
(around 400 households).
Focus Groups Discussions: One per kebele
Key Informant Interviews: with major woreda level government
and non-government DRM actors
Problem Tree Analyses : to see the cause and effect of disasters
• Secondary Data:
collected relevant to WDRP indicators:
LIU, SERA Project, Risk baseline, other ministries…
Sampling Technique:
• Multistage cluster sampling
• Both Probability and Non-probability sampling
Methods of Analysis:
• Descriptive Statistics
• Textual Analysis
• Cispro and SPSS
• Automate WDRP software

WEREDA
SUMMARY DISASTER RISK PROFILE
INFORMATION
Wereda Disaster Risk Profiling Project: SNNP
Disaster Risk Profile: Surma Wereda
SUMMARY OF WEREDA PROFILE
Drought, livestock disease, Crop pest and diseases and
conflict are the major disaster in Surma wereda. Besides
water pollution, deforestation and pest are another major
environmental problem in the wereda.
In addition in adequate provision of infrastructure such as
access road and electricity, poor Irrigation facilities, in
adequate provision of veterinary service and livestock
drug, high population density, absence of cereal mill are
some of the factors that contribute towards household
vulnerability in the area.
Developing Infrastructure such as access road and
electricity, schools, Construction of adequate veterinary
and health facility, provision of medicine both for human
and livestock, provision of pest and disease resistance
crop verities and livestock breeds, developing irrigation
schemes and enhancing soil conservation measures are
some of the suggestion interventions in the Wereda.
LIVELIHOOD ZONE SUMMARY
Surma agro pastoral
Livelihood Zone
This lowland to dry midland zone is
sparsely populated by Surma
pastoral clans. They depend more
for their living on livestock than on
agricultural production, and have
managed to maintain a food secure
economy. Main Crops maize,
sorghum and root crops are
produced.. Livestock sales (cattle &
shoats) supplement crop income.
They sell some honey, and make
significant money from working in
neighbouring gold mining areas,
chiefly in Bero Woreda.
MAP: LOCATION OF THE WEREDA
MAJOR DISASTERS REPORTED IN WEREDA
Kebele
Disaster 1 Disaster 2
Disaster 3
Anjo
Banka
Bebusin
Bole Boket
Borka
Kotla Kora
Maja
Disho
Duku
Gume
Hartega
Drought
Drought
Drought
Conflict
Drought
Crop dis.
Crop dis.
Human dis.
Conflict
Drought
Conflict
Livestock dis.
Human diseases
Conflict
Drought
Crop diseases
Livestock disease
Conflict
Drought
Drought
Crop diseases
Livestock disease
Conflict
Conflict
Human diseases
Human diseases
Livestock dis.
Human diseases
Human diseases
Livestock dis.
Livestock dis.
Livestock dis.
Human diseases
Decha Gibe
Choye
Kenida
Koka
Kuruma
Moga
Ororomay
Regiya
Tuliget
Drought
Drought
Conflict
Conflict
Drought
Conflict
Drought
Drought
Livestock dis.
Malaria
Livestock dis.
Livestock disease
Livestock disease
Livestock disease
Crop diseases
Conflict
Conflict
Human diseases
Livestock disease
Conflicts
Human diseases
Human diseases
Crop diseases
Human diseases
Crop diseases
Crop diseases
Drought
LIU Info
Chronic
Hazards:
SAP LZ:
Livestock
disease,
Conflict and
malaria
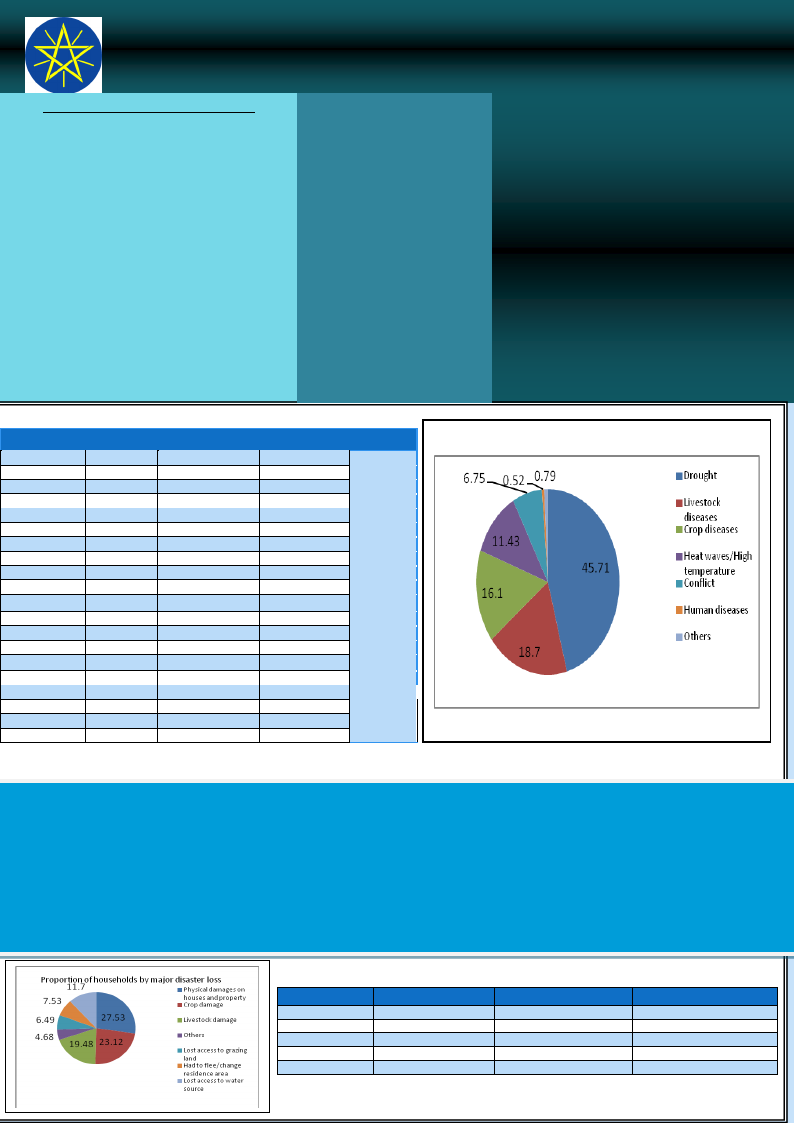
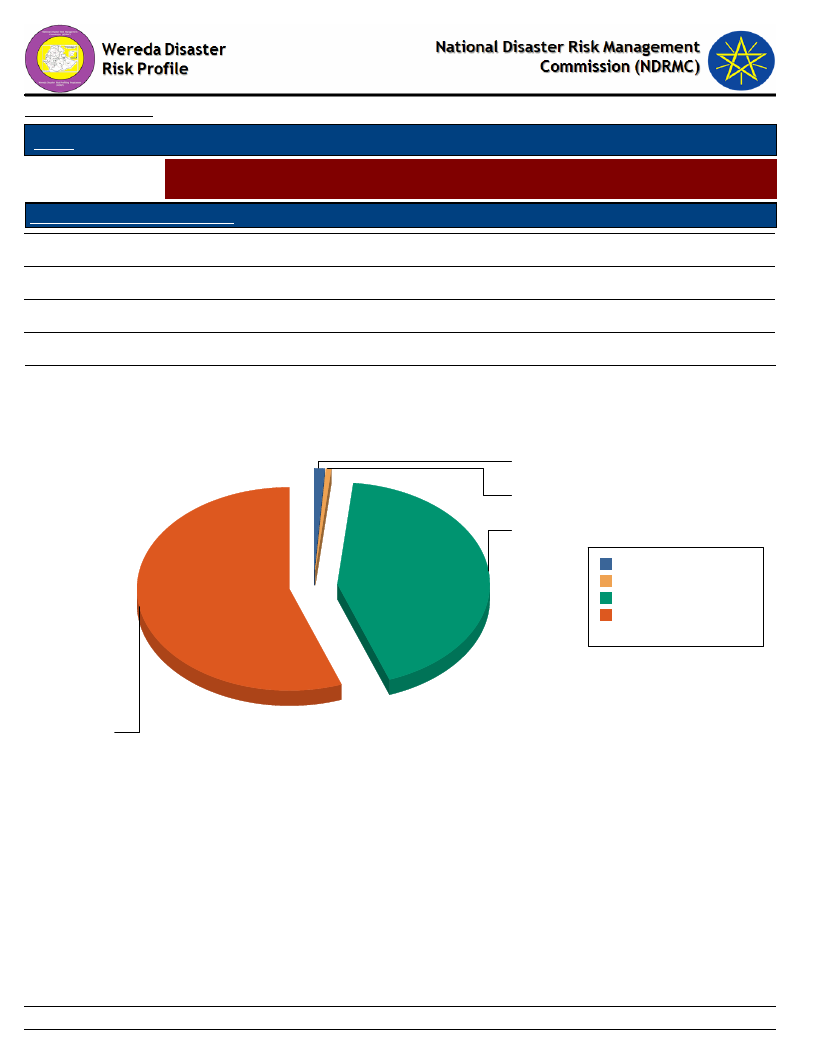
Proportion of households by major dfifsasters exposed in the five years
SHORT NARRATIVE ON MAJOR DISASTERS: Drought is the major disaster caused by climate change, deforestation, shortage of rain and improper
utilization of natural resource results in reduction in crop production and productivity, shortage of pasture for livestock, shortage of water for both human and
livestock, shortage of food and prevalence of different disease in the wereda. Weeds are the major crop pest and diseases results in crop damage, reduction in
crop production, loss of grass and loss of income. Livestock disease such as Trypanasomiasis, CCPP, Anthrax and FMD are the major disaster caused by Tsetse
fly, shortage of rain and lack of animal feed results in death of livestock, loss of livestock weight and loss of income. Further more Human disease such as
Malaria, chronic fever, headache and Diarrhea are the major disaster caused by water logging, mosquito fly and sanitation problem results the working force
out of work, death, increase cost for medical and loss of income of the household. In addition conflict is also a major disaster which damage people and
physically damaged houses and other properties in the wereda.
Disasters
Droughts
Crop diseases
Livestock diseases
Conflict
Human diseases
Loss 1
Crop damage
Crop damage
Livestock damage
Physical damage
Death of household
EFFECT OF DISASTERS
Loss 2
Lost access to water source
Livestock damage
Crop damage
Livestock damage
Loss of income
Loss 3
Loss of access to grazing land
Loss of income
Loss of income
Crop damage
Migration
Wereda Disaster Risk Profiling Programme: SNNP
Disaster Risk Profile: Surma Wereda
HOUSEHOLD AND COMMUNITY VULNERABILITY
VULNERABILITY
Mixed farming and honey production is the main source of livelihood
of the community in the area. However due to recurrent drought and
livestock diseases crop and livestock production and productivity
decreases hence the community vulnerable for food shortage.
Besides severity of drought, tribal conflict mainly affects the
communities’ social life, poor Irrigation facilities, livestock disease, in
adequate provision of veterinary service and livestock drug, high
population density, human diseases, poor sanitation facilities and lack
of awareness and training on various issues are some of the factors
that contribute towards household vulnerability in the area.
In addition in adequate provision of infrastructure such as access road
and electricity contribute towards household vulnerability in the area.
For instance 52.3% of the household have no access road and none of
the household with electricity connection. Furthermore Poor credit
facility and lack of strong social network in agricultural and other
social activities exposed the community for vulnerability in the
Woreda.
Accessibility:
Access to Drinking water: 67.8% of the household drink water from River or stream and others use communal tap, open access Pond or lake, and also 90%
of the household drinks the water without treatment.
Access to electricity: None of the household has access with electricity connection.
Access to extension services and improved services seeds: 68% of the household received agricultural extension services and also 90% of the
Household have used improved verities of seeds.
Access to Veterinary Services and Livestock drug: - 15% of the household have got good and adequate access for veterinary services and also 14% of the
household have got good and adequate accesses for livestock drug.
Access to Sanitation services: - 17% of them use outdoors latrine/hole on plot however 82% of the household have no toile facility at all.
Access to Road: - 52% of the household have no access road and 7% of the household have access paved, gravel and dirt or difficult for
car road (16%) which led to their houses and urban centre. For instance to reached the nearest paved road the household required on average 1 hour
and to the nearest urban centre it required on almost on average 2 hours.
Level of Awareness and Institutional Development
The proportion of literate population above 7 years old is 21%. These populations categorized by level of
education reported that 62.5% less than 1st grade, 35% primary and 2.5% secondary school completed.
With regard to the gender parity in education the proportion of female students are higher than male at
less than 1st grade and the proportion of male is higher than female at primary grade and secondary
school level. From the total number of households surveyed, 58% of them are female-headed
households.
Community based organization such as Irrigation association, sand associations and honey associations
are formal organization through which community help each other during agricultural and others social
activities. However the levels cooperation is decreasing compared with the last decade. Non
government organization such as Red Cross and PPCDP are also some of the actors in the wereda
support the community in DRM activities
InfoBits:
Population
: 24,595 (2007)
Sex ratio
: 1085 F/1000 M
Urban Population
: 913 (2007)
Mean Altitude
: 1008.31
Mean Slope
: 4.48%
Measles caseload
PLWHA on ART
:
Under-five children eligible
for supplementary feeding:
Sources: Various Secondary Sources
COMMUNITY CAPACITY TO COPE
Major coping strategies: Consumption rather than sale of crop surplus, Sell more livestock than usual and Reduced expenditure on non-essential items and
collection of wild foods are the major coping strategies adopted by the household in the event of hazard or disaster.
In the event of more resource available: Adaptation of economic activities to hazards season and Storage of food and other necessities is the major coping
strategies opted by the household during disaster risk.
In the wereda it is reported that 92% of the household have managed to recover from losses of disasters affected.
Access to credit: On the average 1.23 number of household tried to get credit and 2.1 number of household have managed to get credit
services.
During disaster 36% of the household are able to raise Birr 500.00 in one week through selling asset or livestock.
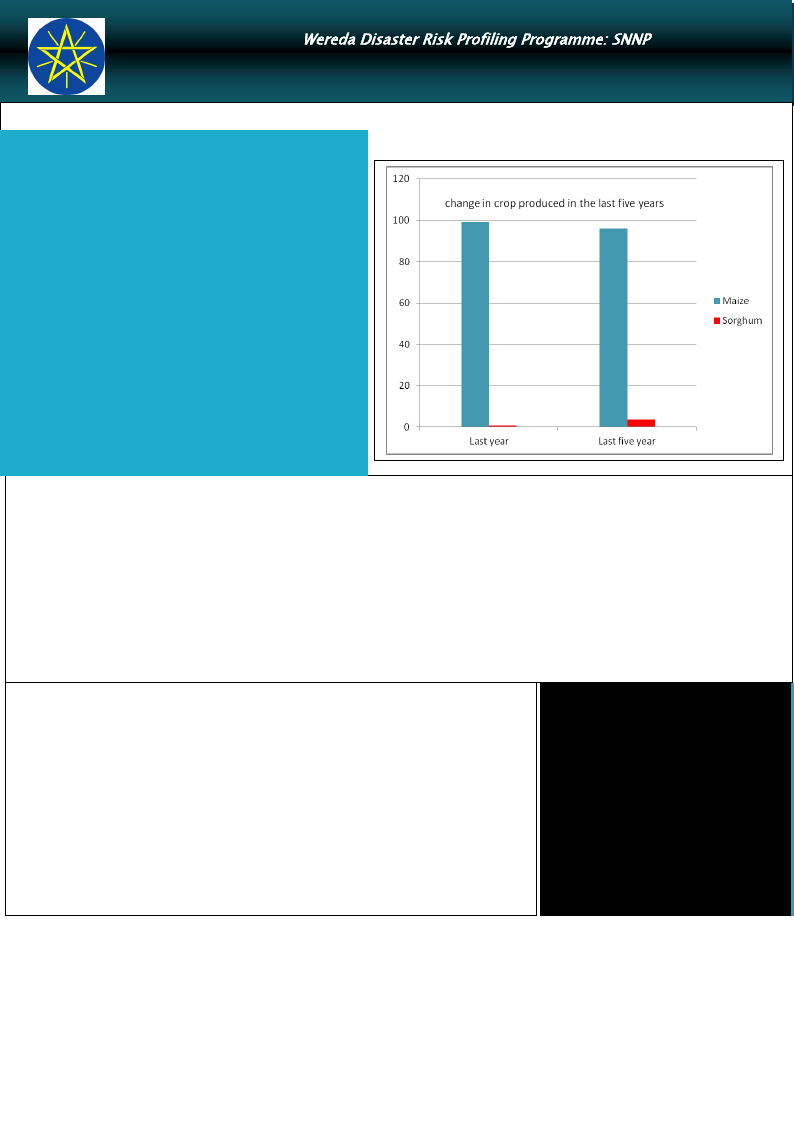
On the average 2.0 different types of crops such as Maize and Sorghum are grown by the household. Besides Livestock such as cattle, shoat and pack
animals are rearing. Poultry production and bee keeping are also another source of income that contributes to the household as a coping capacity against
disaster risk.
WDRP Indicators
Hazard Related Characteristics
1
Wereda Disaster
Risk Profile
National Disaster Risk Management
Commission (NDRMC)
Data_Collected_Date
Monday, February 25, 2019
Region S.N.N.P
Zone
BENCH MAJI
Wereda
SURIMA
Selected Indicator
Biological Hazards of the Wereda
Hazard_Name
Hazard_Sub_Type
Army warm
Cause_Of_Hazard
Crop pest and diseases
High temperature
Poor agronomic practices
Effects_Of_Hazard
Loss of yield production
Loss of income
Hazard_Sub_Type
Malaria
Typhoid
Water borne diseases
Hazard_Sub_Type
Anthrax
FMD
PPR
CCBP
CCPP
TRIP
Human diseases
Lack of safe water
Poor sanitation and hygiene
Livestock diseases
Lack of water and pasture
Poor livestock management
Weak vet. services
Death of people
Weakening of human labor
Migration
Death of livestock
Loss of income
Migration
Page 1 of 1
2
Wereda Disaster
Risk Profile
National Disaster Risk Management
Commission (NDRMC)
Data_Collected_Date
Monday, February 25, 2019
Region S.N.N.P
Zone
BENCH MAJI
Wereda
SURIMA
Selected Indicator
Geological Hazards of the Wereda
Hazard_Name
Hazard_Sub_Type
Not reported
Cause_Of_Hazard
Geological hazards
Effects_Of_Hazard
Page 1 of 1
3

Wereda Disaster
Risk Profile
National Disaster Risk Management
Commission (NDRMC)
Data_Collected_Date
Monday, February 25, 2019
Region S.N.N.P
Zone
BENCH MAJI
Wereda
SURIMA
Selected Indicator
Hydro Metrological Hazards of the Wereda
Hazard_Name
Hazard_Sub_Type
Drought
Flood
Cause_Of_Hazard
Hydro meteorological hazards
Erratic rainfall
Deforestation
Heavy rainfall
Topography
Effects_Of_Hazard
Loss of water, pasture and crop yield
Death of livestock
Student drop outs
Death of human beings and livestock
Soil erosion and land degradation
Destruction of infrastructures
Page 1 of 1
4

Wereda Disaster
Risk Profile
National Disaster Risk Management
Commission (NDRMC)
Data_Collected_Date
Monday, February 25, 2019
Region S.N.N.P
Zone
BENCH MAJI
Wereda
SURIMA
Selected Indicator
Socio Economic Hazards of the Wereda
Hazard_Name
Hazard_Sub_Type
Conflicts
Cause_Of_Hazard
Socioeconomic hazards
Resource competition
Border and clan conflicts
Effects_Of_Hazard
Livestock theft
Death of human beings
Migration and displacement
Page 1 of 1
5

Wereda Disaster
Risk Profile
National Disaster Risk Management
Commission (NDRMC)
Data_Collected_Date
Monday, February 25, 2019
Region S.N.N.P
Zone
BENCH MAJI
Wereda
SURIMA
Selected Indicator
Technological Hazards of the Wereda
Hazard_Name
Hazard_Sub_Type
Not reported
Cause_Of_Hazard
Technological hazards
Effects_Of_Hazard
Page 1 of 1
6

Wereda Disaster
Risk Profile
National Disaster Risk Management
Commission (NDRMC)
Data_Collected_Date
Monday, February 25, 2019
Region S.N.N.P
Zone BENCH MAJI
Wereda SURIMA
Selected Indictor:
Kebele Name
ANIJO
Disaster Characteristics By Kebele
Disaster_Type Common Period
Year
Worst_ Trends of
Occured Year Effects
Human
diseases
January
2007,
2008,
2009
2009
Increased
Root Causes
Lack of
personal
sanitation
Effects
Vulnerability
Human death
Eating of dead
animal, eating of un
prescribe animals
BANIKA
Livestock
diseases
January
Conflicts
January
Crop diseases June
Drought
January
Conflicts
January
2005,
2006,
2007,
2008
2005,
2006,
2007,
2008
2007,
2008
2006,
2007,
2008
2006,
2009
2005
Increased
Lack of
animal fodder
and Water
Animal death
Lack of capacity to
pay for animal
medicine
2008
Increased
Hanging of
animal from
Bume
Loss of
animal
population
Unbalance capacity
with Bume
2007
Decreased Climate
change
2007
Increased
Climate
change,
shortage of
rainfall
2008
Decreased
Finding of
resource,
hunting
animals
Decrease
crop and
crop
production (
yield )
Crop disease,
human and
animal
disease
Death and
loss of
animals
Lack of awareness
Lack of awareness,
zero tillage
agriculture and
practice extensive
farming
Depend on animal
product
Coping Strategy
Only attending
veterinary services,
drinking animal
soups
Traditional
treatment
Patrolling and kept
cattle
Traditional
medication
Eating of leaf roots
By conflicting each
other, moving
animals to nearest
kebele
7
Page 1 of 15

Wereda Disaster
Risk Profile
National Disaster Risk Management
Commission (NDRMC)
Data_Collected_Date
Monday, February 25, 2019
Region S.N.N.P
Zone BENCH MAJI
Wereda SURIMA
Selected Indictor:
Kebele Name
BANIKA
BEBUSIN
Disaster Characteristics By Kebele
Disaster_Type Common Period
Year
Worst_ Trends of
Occured Year Effects
Root Causes
Crop diseases July
2008,
2009
2009
Increased
Shortage of
rainfall, high
temperature
Human
July
diseases
2007,
2009
2009
Decreased Eating of died
animals meat
Livestock
diseases
March, May
2005,
2009
2007
Increased
Interning
from
surrounding
kebele
Conflicts
Drought
Conflicts
Human
diseases
January
January,
February,
March, April
December,
January,
February
March, April,
May
2006,
2009
2008
2007,250 2009
09,
Decreased
Increased
Finding of
resource,
hunting
animals
Lack of rain
fall
2009,
2009
Increased
Competition
of resource
2008,200 2008
9
Increased
Personal
hygiene
Effects
Vulnerability
Loss of crop
product
Lack of awareness
Death and
loss
productivity
Loss of
animal
product,
disease
translate to
human being
Death and
loss of
animals
Lack of awareness,
no have vaccination
Depend on animal
product
Depend on animal
product
Human
disease,
animal
disease
Theft,
Zero tillage
agriculture and
practicing extensive
farming
Human death Lack of awareness
Coping Strategy
Smoking indigenous
trees
Use traditional
medicine
Outbreak of animal
blood then can not
drink water for one
month
By conflicting each
other, moving
animals to nearest
kebele
Eating root and
vegetable
Organizing kebele
peace community
Traditional
treatment
8
Page 2 of 15

Wereda Disaster
Risk Profile
National Disaster Risk Management
Commission (NDRMC)
Data_Collected_Date
Monday, February 25, 2019
Region S.N.N.P
Zone BENCH MAJI
Wereda SURIMA
Selected Indictor:
Kebele Name
BOLE BOKT
Disaster Characteristics By Kebele
Disaster_Type Common Period
Year
Worst_ Trends of
Occured Year Effects
Conflicts
January
2004,
2005,
2006,
2007,
2008,
2009
2008
Increased
Drought
January
2007,
2008,
2009
2007
Increased
Root Causes
Increase the
amount of
cattle
resource,
both party
loves animals
High
temperature
and shortage
of rainfall
Effects
Human
death,
hanging of
animals
Human and
animal
disease,
poverty
Vulnerability
No Demilitarization
in this conflict zone
Practicing zero
tillage agriculture
which is subsistence
Livestock
diseases
April
Crop diseases April
2007,
2008,
2009
2009
Forest Fires
January,
February, March
2009
2007
2009
2007
Decreased
Lack of
attendant for
animal health
service
Decreased Lack of
rainfall
Decreased Uncontrolled
bush fire
Animal
death,
decrease
animal
production
Famine,
poverty,
decrease
crop and
crop
productivity
Destruction
of bee hives
Lack of awareness
Lack of awareness
Lack of capacity to
control
Coping Strategy
Patrolling
Eating of wild fire
fruits, gold
extraction, selling of
charcoal, fire wood,
fetching of water
and treasury in to
town
Using traditional
medicine
Chemical spraying
Protect the bush by
water and soil
9
Page 3 of 15

Wereda Disaster
Risk Profile
National Disaster Risk Management
Commission (NDRMC)
Data_Collected_Date
Monday, February 25, 2019
Region S.N.N.P
Zone BENCH MAJI
Wereda SURIMA
Selected Indictor:
Kebele Name
BORIKA
Disaster Characteristics By Kebele
Disaster_Type Common Period
Year
Worst_ Trends of
Occured Year Effects
Drought
January
2007,
2008,
2009
2009
Increased
Crop diseases December
2009
2009
Increased
Root Causes
Shortage of
rainfall
KOTLA KORA
Livestock
diseases
April
2009
2009
Decreased
Lack of
attendant for
animal health
service
Drought
January
Crop diseases July
Livestock
diseases
March, April,
May
2007,
2008,
2009
2008,
2009,
2010
2006,
2007,
2008,
2009
2009
Increased
Shortage of
rainfall
2009
Increased
Shortage of
rain fall
2007
Increased
Climate
change
Effects
Human and
animal
disease
Poverty ,
famine,
decrease our
income
Losses of
animal
production,
animal
disease and
death
Human and
animal
disease
Damage crop
products
Loss of
livestock
production,
loss of
income
Vulnerability
Lack of knowledge
Lack of awareness
Lack of awareness
Lack of knowledge
Poor awareness
Depending on
product
Coping Strategy
Assistance from
government
Using traditional
medicine, by shifting
pasture lands and
places
Assistance from
government
Smoking tree
Use traditional
treatment
10
Page 4 of 15
Wereda Disaster
Risk Profile
National Disaster Risk Management
Commission (NDRMC)
Data_Collected_Date
Monday, February 25, 2019
Region S.N.N.P
Zone BENCH MAJI
Wereda SURIMA
Selected Indictor:
Kebele Name
KOTLA KORA
MAJA
Disaster Characteristics By Kebele
Disaster_Type Common Period
Human
diseases
August
Year
Occured
2005,
2006,
2007,
2008,
2009,
2010
Worst_
Year
2007
Trends of
Effects
Decreased
Root Causes
Climate
change
Conflicts
January
2005,
2007,
2009,
2010
2007
Increased
Drought
January
2007,
2008,
2009
2007
Increased
Shortage of
rain fall,
climate
change
Crop diseases July
2005,200 2009
7,2009,
Increased
Climate
change
Conflicts
April
Human
diseases
October
2007,200 2008
9,2010
Decreased Theft of
animals
2007,200 2008
9
Increased
Climate
change
Effects
Loss of
production,
shortage of
for
treatment
Vulnerability
There is no
veterinary service
Loss of
resource,
death of
human
Out break
disease
Lack of awareness
Lack of awareness
Disease
falling of
crop
product,
poverty
Human death
and loss of
resource
Human
death,
decreased
Lack of knowledge
little agricultural
experience
Lack of awareness
No favorable health
center
Coping Strategy
Using traditional
treatment
Migrate to nearest
kebele
Saving money, using
mining
Increased working
time, use wild fruit,
kill by hand
They do not use any
mechanism
Use traditional
medicine
11
Page 5 of 15

Wereda Disaster
Risk Profile
National Disaster Risk Management
Commission (NDRMC)
Data_Collected_Date
Monday, February 25, 2019
Region S.N.N.P
Zone BENCH MAJI
Wereda SURIMA
Selected Indictor:
Kebele Name
MAJA
DISHO
Disaster Characteristics By Kebele
Disaster_Type Common Period
Animal
Disease
March, May
Year
Occured
2005,200
8
Worst_
Year
2007
Trends of
Effects
Increased
Root Causes
Climate
change
Drought
January
Human
diseases
Drought
April
January
2007,201 2008
0
2005,200
6,2007,2
008,2009
2007,200
8
2007
2007
Decreased
Shortage of
rain fall, poor
natural
resource use
Increased
Personal
hygiene, lack
of knowledge
Increased
Rain fall fed
agriculture
Animal
Disease
Conflicts
April
January
2006,200
7,2008,2
009
2006,200
7,2010
2007
2010
Increased Drought
Increased
Computing to
increase
resource with
bume
Effects
Vulnerability
Decreased
animal
productivity
Crop failure,
animal
disease
Depend on animal
product
Lack of awareness
Human
disease and
death
Human death
and animal
death
Animal
disease,
death
Human death
Lack of awareness,
lack of proper
health service
Zero tillage
agriculture
Lack of health
service
Unbalanced conflict
with bume
Coping Strategy
migrating animals
Going to mining
saving money
Traditional
treatment
Eating seeds and leaf
Organizing kebele
peace community
office for
reconciliation
12
Page 6 of 15

Wereda Disaster
Risk Profile
National Disaster Risk Management
Commission (NDRMC)
Data_Collected_Date
Monday, February 25, 2019
Region S.N.N.P
Zone BENCH MAJI
Wereda SURIMA
Selected Indictor:
Kebele Name
DUKU
Disaster Characteristics By Kebele
Disaster_Type Common Period
Conflicts
January
Year
Occured
2006 -
2009
Worst_
Year
2007
Trends of
Effects
Increased
Root Causes
Lack of
grazing land
GUME
Drought
January
Livestock
May
diseases
2007,
2008
2007
2007, 208 2008
Increased
Increased
Shortage of
rain fall,
instability of
the area
Lack of
veterinary
service
Crop diseases
Drought
March,
September,
October
January
Crop diseases September
2007,
2008,
2009
2006,200
7,2008,2
009,2010
2007
2007
Increased
Increased
Shortage of
food, poor
sanitation
Rain fall
dependent
agriculture
2009
2007
Decreased
13
Climate
change
Effects
Vulnerability
Death of
human,
migration or
escaping
from village,
psychological
failed
Death of
livestock, out
break disease
Loss of
livestock
production
and
productivity,
death of
livestock
Human
disease, loss
of income
Lack of awareness,
exposure to water
and livestock
pasture
Poor veterinary
service, in access
road for veterinary
service
No road to go to
health post
Animal and
human
disease
Hunger
Poor working
culture agriculture
dependent on rain
fall
Lack of awareness
Coping Strategy
Living in high/sloppy
mountain , migration
Saving money to buy
food
Traditional
treatment
Traditional
treatment
Eating wild root
Page 7 of 15

Wereda Disaster
Risk Profile
National Disaster Risk Management
Commission (NDRMC)
Data_Collected_Date
Monday, February 25, 2019
Region S.N.N.P
Zone BENCH MAJI
Wereda SURIMA
Selected Indictor:
Kebele Name
GUME
HARITEGA
Disaster Characteristics By Kebele
Disaster_Type Common Period
Year
Worst_ Trends of
Occured Year Effects
Root Causes
Animal
Disease
March, May
2006,200
7,2008,2
009,
2008
Decreased
Animal
disease, loss
of animal
disease
Fire problem
January
2004,200
5,
2006,200
7,2008,2
009,
2007
Increased
Uncontrolled
bush fire
Conflicts
January,
February, March
2007,200 2008
8,2009
Increased
Computing to
increase
animal
population
with surma
and Guma
Livestock
diseases
March, April
2008,200 2008
7
Increased Drought
Human
diseases
March,
September
2008,200 2007
9
Increased
Personal
hygiene
Crop diseases
May, September,
October,
November
2008,200 2009
9
Decreased Lack of rain
fall
Effects
Vulnerability
Animal and
human
disease
Lack of awareness
Destruction
of beehives
trees
Theft of
cattle
Unbalanced
capacity with Bume
Animal death
Human
disease,
human death
Decreased
crop
production
Lack of awareness
poor veterinary
medicine
Lack of awareness
Coping Strategy
Using traditional
treatment
Traditional way of
controlling the fire
Patrolling with gun
and make count
Give salt soil for
animal
Traditional way of
treating
Traditional medicine
14
Page 8 of 15

Wereda Disaster
Risk Profile
National Disaster Risk Management
Commission (NDRMC)
Data_Collected_Date
Monday, February 25, 2019
Region S.N.N.P
Zone BENCH MAJI
Wereda SURIMA
Selected Indictor:
Kebele Name
CHOYE
KENIDA
Disaster Characteristics By Kebele
Disaster_Type Common Period
Drought
January
Year
Occured
2004,
2005,
2006,
2007,
2008,
2009
Worst_
Year
2007
Trends of
Effects
Increased
Livestock
July
diseases
2007,
2008
2007
Increased
Conflicts
Conflicts
January,
February
February, March
2006,
2007,
2008,
2009,
2010
2005,200
9
2007
2007
Increased
Increased
Human
diseases
October
2007,200 2007
9
Increased
Root Causes
Shortage of
rain fall
Lack of
pasture,
water and
pasture land
Shortage of
resource,
over drink,
genocide
Theft of
cattle, and
honey
product
Climate
change
Effects
Human
disease
Vulnerability
Lack of awareness
Death of
livestock
Lack of
reconciliation
Death of
human, loss
of income
Lack of awareness
Human
death, loss of
resources
computation of
resource
Human death
No favorable health
center
Animal
Disease
March, May
2005,200 2008
8
Increased
Climate
change
Decrease the
number of
animal
Depend on animal
product
Coping Strategy
Minimize amount of
food
Promoting traditional
treatment
Migration, local
elders reconciliation
program
migration to the
nearest kebele like
Goma, Kebish
Use traditional
treatment to treat
the disease
migration with the
animals
15
Page 9 of 15

Wereda Disaster
Risk Profile
National Disaster Risk Management
Commission (NDRMC)
Data_Collected_Date
Monday, February 25, 2019
Region S.N.N.P
Zone BENCH MAJI
Wereda SURIMA
Selected Indictor:
Kebele Name
KENIDA
Disaster Characteristics By Kebele
Disaster_Type Common Period
Crop diseases July
Year
Occured
2008,200
9
Worst_
Year
2009
Trends of
Effects
Increased
Root Causes
Climate
change
Drought
January
2007,201 2008
0
Increased
Shortage of
rain fall, dry
spell
KOKA
Human
diseases
Conflicts
July
January
Crop diseases July
Livestock
diseases
March, May
2007,
2009,
2010
2005,
2007,
2009,
2010
2008,
2009
2005,
2009
2009
Decreased Eating died
animal meat
2009
2009
2008
Decreased
Finding
water,
thieving of
animals
Increased
Increased
Shortage of
rainfall, high
temperature
Interving
from
surrounding
country
Effects
Vulnerability
Falling of
crop
production
Crop disease,
human
disease,
Animal
disease
Death and
Less
productivity
Death and
loss of
animal
Lack of awareness
Lack of awareness
There is no
awareness, there is
no vaccination
Depend on animal
product
Loss of crop
product
Lack of awareness
Loss of
animal
product,
disease
translate to
human being
depend on animal
product
Coping Strategy
Use animal product
Going to mining and
saving money to buy
maize
Use traditional
medicine
By counter attack
each other and
moving animals to
other area
Smoking indigenous
trees
Out break of animal
blood then can not
drink water for one
month
16
Page 10 of 15

Wereda Disaster
Risk Profile
National Disaster Risk Management
Commission (NDRMC)
Data_Collected_Date
Monday, February 25, 2019
Region S.N.N.P
Zone BENCH MAJI
Wereda SURIMA
Selected Indictor:
Kebele Name
KURUMA
Disaster Characteristics By Kebele
Disaster_Type Common Period
Drought
January-May
Year
Occured
2004,200
5,2006,2
007,2008
,2009
Worst_
Year
2008
Trends of
Effects
Increased
Livestock
diseases
January-May
2007,200 2008
8
Increased
Root Causes
Shortage and
erratic rain
fall
Lack of
pasture and
water
MOGA
Crop diseases April and may
2009,201 2010
0
Increased
Environmenta
l change
Conflicts
Fire problem
Conflicts
January-May
March and April
December,
January
2004,200
5,2006,2
007,2008
,2009,
2007,200
8,2009
2008
2009
2006 -
2010
2010
Increased
Resource
competition
Decreased
Increased
Searching
new grazing
land for
animals
Shortage of
source
Effects
Vulnerability
Loss of crop,
livestock,
water and
pasture
Lack of awareness,
dependency on
rainfall
Death of
animal
Reduction of
yield and loss
of income
Theft of
animals,
human death
Lack of knowledge,
poor management
and lack of vet
services
Lack of knowledge,
poor agronomic
practices
No reconciliation
program
Damaging
house,
vegetables
and fruits
Death of
livestock,
loss of
income, loss
of resource
Recurrent drought
and lack of
awareness
They are depend on
animals product
Coping Strategy
Eating wild food leaf
and fruit
Vaccination and
treatment
By collecting pest,
cutting the affected
part of the crop
Patrolling and
protecting our
animals from Bume
and mediation
-
Migration
17
Page 11 of 15

Wereda Disaster
Risk Profile
National Disaster Risk Management
Commission (NDRMC)
Data_Collected_Date
Monday, February 25, 2019
Region S.N.N.P
Zone BENCH MAJI
Wereda SURIMA
Selected Indictor:
Kebele Name
MOGA
Disaster Characteristics By Kebele
Disaster_Type Common Period
Crop diseases July
Year
Occured
2006 -
2010
Worst_
Year
2009
Trends of
Effects
Increased
Human
diseases
January,
February
2007 -
2010
2009
Increased
Root Causes
Climate
change,
shortage of
rainfall
Shortage of
food
Livestock
diseases
March, April,
May
2005 -
2010
2009
Increased
Disease enter
from
surrounding
area
OROROMAY
Drought
Drought
March, April,
May
2007 -
2010
2010
Increased
Shortage of
rain fall
January
2006 -
2009
2007
Decreased
Shortage of
rain fall,
climate
change
Effects
Vulnerability
Loss of crop,
loss of
productivity
Lack of other
opportunity
Death of
human, loss
of
productivity
Loss of
livestock and
livestock
production,
disease
transmitted
to human
being
Death and
disease of
human, loss
of income
Disease out
break, loss of
livestock,
loss of
income
No veterinary
service
Lack of awareness,
economical depends
on livestock
production
Coping Strategy
Smoking some tree
species
Traditional
treatment
Traditional
treatment
Beating wild fruit,
extracting gold
Saving money, using
small scale
irrigation, mining
18
Page 12 of 15

Wereda Disaster
Risk Profile
National Disaster Risk Management
Commission (NDRMC)
Data_Collected_Date
Monday, February 25, 2019
Region S.N.N.P
Zone BENCH MAJI
Wereda SURIMA
Selected Indictor:
Kebele Name
OROROMAY
REGIYA
Disaster Characteristics By Kebele
Disaster_Type Common Period
Conflicts
September
Year
Occured
2005,
2008,
2009
Worst_
Year
2007
Trends of
Effects
Increased
Root Causes
Robbing
cattle,
shortage of
resource
Crop diseases July
2009
2009
Increased
Shortage of
rain fall,
climate
change
Livestock
diseases
March, May
Drought
January
2005,
2006,
2009
2006,
2008,
2008
20058
2007
Decreased
No
vaccination,
poor stalk of
fodder,
shortage of
water
Decreased
Shortage of
rain fall, poor
natural
resource,
climate
change
Effects
Death of
human,
reduction of
livestock
number
Shortage of
food, loss of
coproduction
, loss of
income
Livestock
disease, loss
of livestock
production,
death of
livestock
Death of
livestock,
death of
human,
disease out
break
Vulnerability
Depending on
livestock production
Lack of awareness
Lack of awareness,
depending on
livestock production
Lack of awareness,
economic
depending on
livestock production
and productivity,
expose to shortage
of water
Coping Strategy
Regular pasturing
and pastoralist
Traditional
treatment
Traditional
treatment
Saving money to buy
crop, mining, small
scale irrigation
19
Page 13 of 15

Wereda Disaster
Risk Profile
National Disaster Risk Management
Commission (NDRMC)
Data_Collected_Date
Monday, February 25, 2019
Region S.N.N.P
Zone BENCH MAJI
Wereda SURIMA
Selected Indictor:
Kebele Name
REGIYA
TULIGIT
Disaster Characteristics By Kebele
Disaster_Type Common Period
Conflicts
January
Year
Occured
2007,
2008,
2009,
2010
Worst_
Year
2007
Trends of
Effects
Increased
Root Causes
Lack of
pasture land,
livelihood
depend on
livestock
production
and
productivity
Crop diseases December
2009
2007
Decreased Climate
change
Livestock
diseases
March, May
Livestock
diseases
September
2005,
2006,
2007,
2008,
2009
2008
Decreased
Shortage of
pasture and
water, lack of
veterinary
service and
drug
2006 -
2010
2010
Increased
Expired date
and vaccine
20
Effects
Human
death,
reduction of
livestock
number
Drought,
shortage of
food and
water, loss
of crop
production,
loss of
income
Death of
livestock,
loss of
livestock
production,
loss of
income
Death of
livestock,
loss of
livestock
production
Vulnerability
Lack of
reconciliation
Lack of awareness,
poor agricultural
experience
Depending on
livestock production
Poor veterinary,
lack of awareness,
access in exiled
medicine
Coping Strategy
Medical and
traditional treatment
Using traditional
treatment
Medical and
traditional treatment
Page 14 of 15
Wereda Disaster
Risk Profile
National Disaster Risk Management
Commission (NDRMC)
Data_Collected_Date
Monday, February 25, 2019
Region S.N.N.P
Zone BENCH MAJI
Wereda SURIMA
Selected Indictor:
Kebele Name
TULIGIT
Disaster Characteristics By Kebele
Disaster_Type Common Period
Year
Worst_ Trends of
Occured Year Effects
Human
diseases
September
2008,
2009
2010
Increased
Root Causes
Rainy season
Drought
January
2007,
2008,
2009
2007
Decreased
Shortage of
rain fall,
fluctuation of
weather
condition,
climate
change
IMPORTANT: The years and months mentoned in this report are according to Ethiopian Calendar (EC).
Effects
Vulnerability
Death of
human, loss
of income
Displacing for
searching
wild fruits,
human and
livestock
death
Insufficient
protection inactive
medicine
rain feed small
agriculture, lack of
awareness, income
and depending in
livestock production
and productivity
Coping Strategy
Reduce number of
eating in a day
increased working
time, saving money,
sell more livestock
than usual
21
Page 15 of 15
Wereda Disaster
Risk Profile
Data_Collected_Date
Region S.N.N.P
Zone BENCH MAJI
Selected Indictor:
KebeleName
KURUMA
Hazards: Conflict as an Issue
Description_Of_Conflict
No
KOTLA KORA
High
MAJA
High
DUKU
Yes
CHOYE
MOGA
OROROMAY
REGIYA
TULIGIT
DISHO
No
High
No
No
High
Yes
KOKA
BORIKA
BOLE BOKT
BANIKA
High
No
No
Low
ANIJO
No
National Disaster Risk Management
Commission (NDRMC)
Monday, February 25, 2019
Wereda SURIMA
Change_In_Last_Decade
Main_Causes_Of_Conflict
Increased
Decreased
Increased
Increased
Resource competition
Theft of cattle and
resource
Grabbing land and water
resource
Robbing cattle
Increased
Increased
Increased
Resource competition
Competition over Grazing
land and water resource
Resource competition
Decreased
22
Mining of gold (resource
competition)
Page 1 of 2
Wereda Disaster
Risk Profile
Data_Collected_Date
Region S.N.N.P
Zone BENCH MAJI
Selected Indictor: Hazards: Conflict as an Issue
KebeleName
Description_Of_Conflict
BEBUSIN
Yes
KENIDA
High
GUME
No
HARITEGA
Yes
National Disaster Risk Management
Commission (NDRMC)
Monday, February 25, 2019
Wereda SURIMA
Change_In_Last_Decade
Increased
Increased
Increased
Main_Causes_Of_Conflict
Competition over land and
water resource
Competition over Natural
resources
Grazing land and water
resource competition
23
Page 2 of 2
Wereda Disaster Risk
Profile
Data_Collected_Date
National Disaster Risk Management
Commission (NDRMC)
Monday, February 25, 2019
Region S.N.N.P
Zone
BENCH MAJI
Wereda
SURIMA
Selected Indicator: Hazard Situation During Last Disaster - Characteristics of most recent disasters that affected the community
KebeleName
ANIJO
BANIKA
BEBUSIN
BOLE BOKT
BORIKA
KOTLA KORA
MAJA
Types of Disasters
Drought
Crop disease
Drought
Drought
Drought
Crop disease
Drought and conflict
Hazard_Description
In the worst year the loss of
community , crops are estimated at
13 ha and estimated animal loss are
52
Affect all the Banika village
community
It has been affecting frequently with
high loss of economy
Often happened
It has occurred recurrently and
affects the economy of the society
Mostly affect Baraga village
Mostly affected Namu gange village
Effect_Of_Disaster
Loss of water,
pasture, income and
migration
Loss of crop and
income
Loss of water,
pasture, income and
migration of the
community
Human and animal
disease
Most_Severly_Affected
Children, women and
elders
Children and women
Children and elder
Children and elders
Animal and human
disease
Children, women and
elders
Failure of crop
production
Children and women
Loss of crop product,
human death and
migration from
residence
Women , children and
elders
24
Reason
Low capacity to
withstand the
impact of disaster
They have low
capacity
Being poor in
financial and
physical capital
The result of
rainfall dependent
agriculture
Lack of strength
and financial
capital
They have no
strength and
capacity
Low capacity to
with stand the
impact of disaster
and they are
sensitive to impacts
Page 1 of 3
Wereda Disaster Risk
Profile
Data_Collected_Date
National Disaster Risk Management
Commission (NDRMC)
Monday, February 25, 2019
Region S.N.N.P
Zone
BENCH MAJI
Wereda
SURIMA
Selected Indicator: Hazard Situation During Last Disaster - Characteristics of most recent disasters that affected the community
KebeleName
DISHO
DUKU
GUME
HARITEGA
CHOYE
KENIDA
KOKA
Types of Disasters
Drought
Conflict
Drought
Drought
Drought
Conflict
Crop disease
Hazard_Description
It occurs frequently and affects the
whole community
Affect the whole community highly
Frequently happened
In the worst year the loses of
community crops are estimated 2
hectare and estimated animal losses
are 14
Frequently occurred
Mostly affected Lallamary village
Mostly affected Koka village
Effect_Of_Disaster
Human and animal
disease and loss of
water and pasture
Death of human,
migration and theft
of livestock
Most_Severly_Affected
Children and elder
Children, women and
elders
Loss of water,
pasture and income
Children and elder
Loss of crop,
livestock, pasture and
water
All community
Human and livestock
death and loss of
income
Children, women and
elders
Human death and loss
of livestock
Human death, loss
crop product
Women, children,
disables and elders
Women and child
25
Reason
They have low
financial and
physical capacity
They have low
capacity to
withstand the
impacts
Having poor
financial and
physical capacity
The community
dependent on the
rain fall in
agriculture
Because of having
low capacity to
cope up with the
situation
Sensitivity to clan
conflcits
They have low
strength and they
live around there
home
Page 2 of 3

Wereda Disaster Risk
Profile
Data_Collected_Date
National Disaster Risk Management
Commission (NDRMC)
Monday, February 25, 2019
Region S.N.N.P
Zone
BENCH MAJI
Wereda
SURIMA
Selected Indicator: Hazard Situation During Last Disaster - Characteristics of most recent disasters that affected the community
KebeleName
KURUMA
MOGA
OROROMAY
REGIYA
TULIGIT
Types of Disasters
Drought
Hazard_Description
Frequently happened
Conflict
Most of the community are affected
Conflict, crop disease
Affect all community in the with high
magnitude and severity
Drought
Drought
It was worst and high losses of
community
In the worst year high loss of
community
Effect_Of_Disaster
Crop and livestock
damage and loss of
water and pasture
Death of human, loss
of crop and livestock
production
Loss of crop and
livestock production,
shortage of income
Most_Severly_Affected
Elders, children and
women
Children, elders and
women
Children and women
Human and livestock
death, loss of income
Human and livestock
death
Children, women and
elders
Children, women and
elders
Reason
Lack economical
and physical
capacity
Low strength and
physical capacity
Low capacity
withstand impact,
they are sensitive
to disaster
Poor capacity and
immune strength
Low capacity to
cope, economically
very poor society
26
Page 3 of 3
Data_Collected_Date
Region S.N.N.P
Zone BENCH MAJI
Selected Indictor: Frequency of Disaster Occurrence
Wereda
Monday, February 25, 2019
SURIMA
Conflicts
Crop diseases
Drought
Forest Fires
Heat waves/ High temp
Human diseases
Livestock diseases
Road Accident
3.85
11.54
15.38
65.38
3.85
1.61
12.90
17.74
66.13
1.61
10.98
55.49
21.39
10.40
0.58
100.00
25.00
20.45
27.27
27.27
50.00
50.00
48.61
18.06
11.11
22.22
100.00
27
Page 1 of 1
Data_Collected_Date
Region S.N.N.P
Zone BENCH MAJI
Selected Indictor: Household Exposure to Hazards
Disaster Type
Drought
Livestock diseases
Crop diseases
Heat waves/ High temp
Conflicts
Human diseases
Forest Fires
Road Accident
Flood
Monday, February 25, 2019
Wereda SURIMA
General_Exposure
56.36
14.55
10.91
10.13
7.01
0.52
0.26
0.26
Last_Five_Years_Exposure
45.71
18.70
16.10
11.43
6.75
0.52
0.26
0.26
28
Page 1 of 1
Wereda Disaster
Risk Profile
Data_Collected_Date
Region S.N.N.P
Selected Indictor:
Zone BENCH MAJI
Months of Occurrence of Frequent Disasters
National Disaster Risk Management
Commission (NDRMC)
Monday, February 25, 2019
Wereda SURIMA
Conflicts
Crop diseases
Drought
Heat waves/ High temp
Human diseases
Livestock diseases
100.00
50.00
50.00
3.33
3.33
16.67
56.67
10.00
6.67
3.33
5.88
5.88
52.94
17.65
11.76
5.88
100.00
2.70
83.78
13.51
29
Page 1 of 1
Data_Collected_Date
Monday, February 25, 2019
Region S.N.N.P
Zone BENCH MAJI
Wereda SURIMA
Selected Indictor:
Conflicts: Perception of households on conflict issues - Is conflict an issue in this
community?
Is Conflict an Issue in Community?
Response_Percent
Yes
55.61
No
42.82
DK
1.04
NA
0.52
Is Conflict an Issue in Community?
DK
1.0
NA
0.5
No
42.8
DK
1.0 1.0%
NA
0.5 0.5%
No 42.8 42.8%
Yes 55.6 55.6%
Total: 100.0 100.0%
Yes
55.6
30
Page 1 of 1
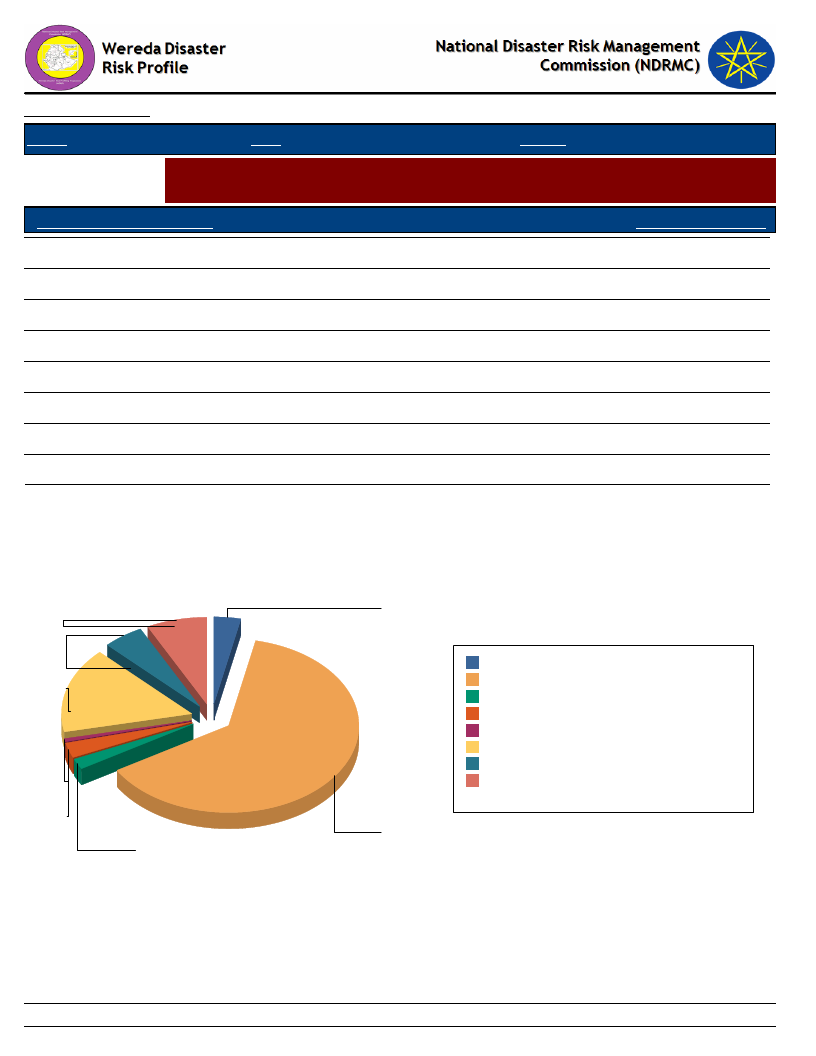
Data_Collected_Date
Region S.N.N.P
Zone BENCH MAJI
Monday, February 25, 2019
Wereda SURIMA
Selected Indictor:
Conflicts: Perception of households on conflict issues - Who To Turn To in case
of Conflict?
Who To Turn During Conflict?
Response_Percentage
Family members
1.86
Elders
63.26
Amakaris
3.26
Wereda administration
7.44
Police
15.81
Militia
2.79
Regional representatives
5.12
Other
0.47
Who To Turn During Conflict?
Wereda administration
7
Regional
representatives
5
Police
16
Other
0
Militia
3
Family members
2
Amakaris
3
Elders
63
Amakaris
Elders
Family members
Militia
Other
Police
Regional representatives
Wereda administration
Total:
3 3.3%
63 63.3%
2 1.9%
3 2.8%
0 0.5%
16 15.8%
5 5.1%
7 7.4%
100 100.0%
31
Page 1 of 1
Data_Collected_Date
Region S.N.N.P
Zone BENCH MAJI
Monday, February 25, 2019
Wereda SURIMA
Selected Indictor: Losses from Disasters - Losses from all disasters (household response in %)
Type of Loss
Physical damages on houses and property
Main_Loss_Percent
27.53
Secondary_Loss_Percent
1.68
Crop damage
23.12
7.07
Livestock damage
19.48
2.02
Death of household members
1.30
0.67
Illness/health problems
0.52
12.79
Loss of access to social services, including school
0.78
5.05
Loss of income
2.08
17.17
Loss of savings
0.00
1.01
Livestock were stolen
0.00
1.01
Lost access to grazing land
6.49
7.74
Lost access to water source
11.17
24.58
Had to flee/change residence area
7.53
18.18
Other losses/damages
0.00
1.01
32
Page 1 of 1
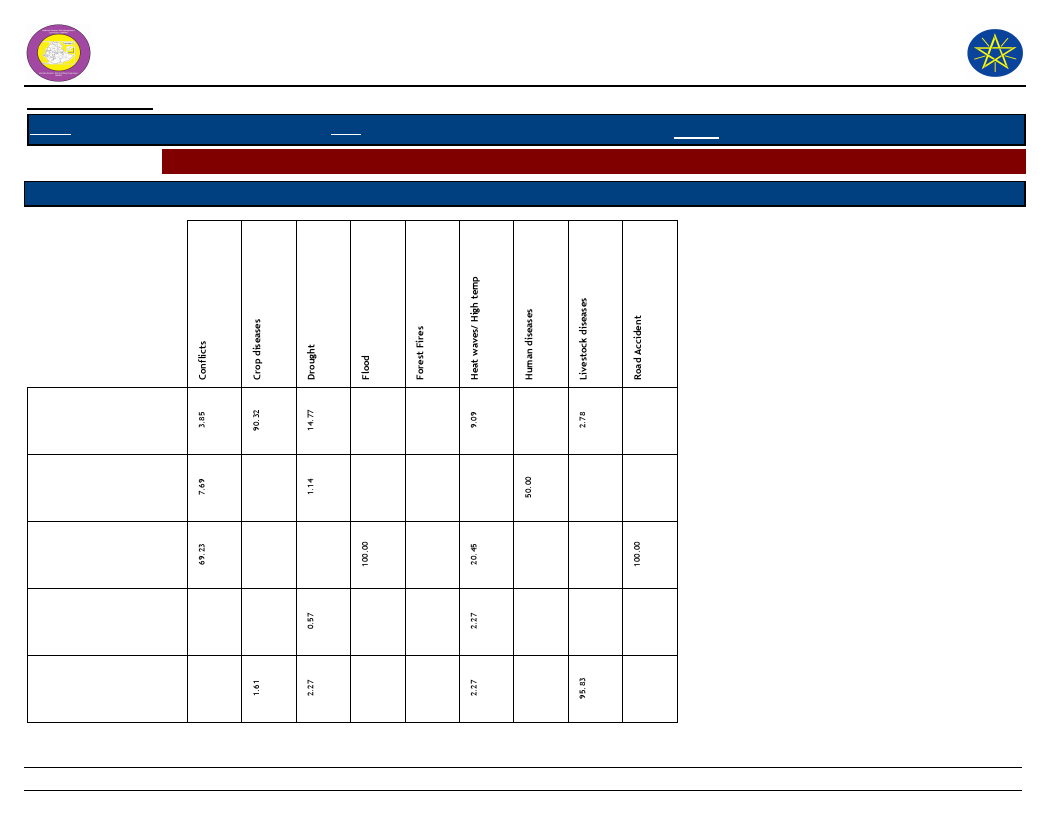
Wereda Disaster
Risk Profile
National Disaster Risk Management
Commission (NDRMC)
Data_Collected_Date
Region S.N.N.P
Zone BENCH MAJI
Wereda SURIMA
Monday, February 25, 2019
Selected Indictor: Losses from Disasters - Main Losses by Type of Disasters (household response in %)
Type of Loss
Type of Disasters which mainly caused Listed Losses
Crop damage
Death of household
members
Had to flee/change
residence area
Illness/health problems
Livestock damage
33
Page 1 of 2

Wereda Disaster
Risk Profile
National Disaster Risk Management
Commission (NDRMC)
Data_Collected_Date
Region S.N.N.P
Zone BENCH MAJI
Wereda SURIMA
Monday, February 25, 2019
Selected Indictor: Losses from Disasters - Main Losses by Type of Disasters (household response in %)
Type of Loss
Type of Disasters which mainly caused Listed Losses
Loss of access to social
services, including
school
Loss of income
Lost access to grazing
land
Lost access to water
source
Physical damages on
houses and property
34
Page 2 of 2
Wereda Disaster Risk
Profile
National Disaster Risk Management
Commission (NDRMC)
Data_Collected_Date
Region S.N.N.P
Zone BENCH MAJI
Wereda SURIMA
Monday, February 25, 2019
Selected Indictor: Losses from Disasters - Secondary Losses by Type of Disasters (household response in %)
Type of Loss
Type of Disasters which caused Listed Secondary Losses
Crop damage
Death of household
members
Had to flee/change
residence area
Illness/health problems
Livestock damage
4.55
7.79
100.00
8.11
8.33
0.65
100.00
13.04
9.09
25.97
16.22
100.00
25.00
15.58
5.41
2.78
2.27
1.95
2.70
2.78
35
Page 1 of 3

Wereda Disaster Risk
Profile
National Disaster Risk Management
Commission (NDRMC)
Data_Collected_Date
Region S.N.N.P
Zone BENCH MAJI
Wereda SURIMA
Monday, February 25, 2019
Selected Indictor: Losses from Disasters - Secondary Losses by Type of Disasters (household response in %)
Type of Loss
Type of Disasters which caused Listed Secondary Losses
Livestock were stolen
Loss of access to social
services, including school
Loss of income
Loss of savings
Lost access to grazing land
8.70
0.65
56.52
0.65
45.45
3.25
6.82
4.35
7.14
2.70
8.11
63.89
16.22
13.89
36
Page 2 of 3
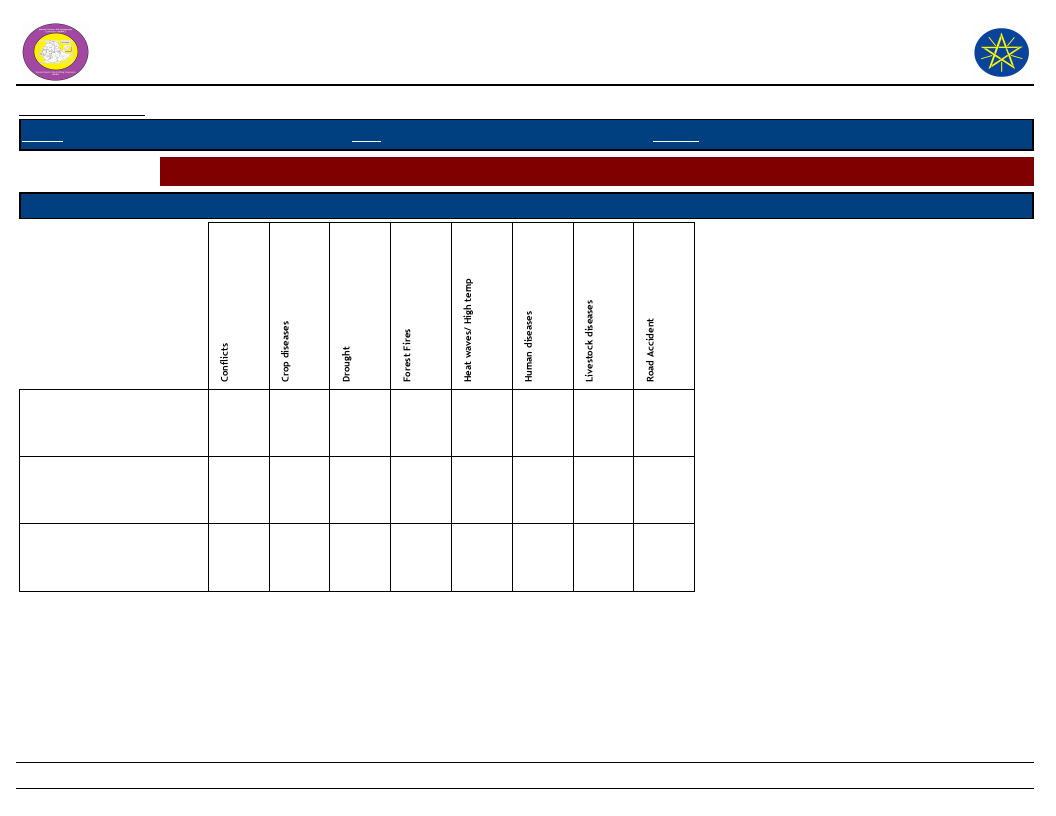
Wereda Disaster Risk
Profile
National Disaster Risk Management
Commission (NDRMC)
Data_Collected_Date
Region S.N.N.P
Zone BENCH MAJI
Wereda SURIMA
Monday, February 25, 2019
Selected Indictor: Losses from Disasters - Secondary Losses by Type of Disasters (household response in %)
Type of Loss
Type of Disasters which caused Listed Secondary Losses
Lost access to water source
17.39
4.55
33.77
40.54
Other losses/damages
2.27
1.30
Physical damages on houses
1.30
8.33
and property
37
Page 3 of 3
Wereda Disaster
Risk Profile
National Disaster Risk Management
Commission (NDRMC)
Data_Collected_Date
Monday, February 25, 2019
Region S.N.N.P
Zone BENCH MAJI
Wereda SURIMA
Selected Indictor: Seasonal Calendar for Hazards, Activities and Income Level By Kebele
Month of Hazard
Major_Problems /Disasters
Kebele Name
D - Dec (Tahsas)
ANIJO
Hazard Severity
Rank
Agricultural_Activities
---------
Income
Level Rank
---------
Kebele Name
D - Dec (Tahsas)
BANIKA
---------
Harvesting
---------
Kebele Name
D - Dec (Tahsas)
BEBUSIN
---------
Harvesting and mining
2nd
Kebele Name
D - Dec (Tahsas)
BOLE BOKT
---------
Harvesting
---------
Kebele Name
D - Dec (Tahsas)
BORIKA
---------
Harvesting
---------
Kebele Name
E - Jan (Tir)
F - Feb (Yekatit)
CHOYE
Drought, shortage of food, conflict
Drought, shortage of food
3
---------
Land preparation
Purchasing inputs
3rd
---------
NOTE: Hazard Severity Rank helps prioritize the more severe hazards that have occurred in the months of disaster occurrence, 3 being the worst and
1 the least severe hazards.
38
Page 1 of 12
Wereda Disaster
Risk Profile
Data_Collected_Date
National Disaster Risk Management
Commission (NDRMC)
Monday, February 25, 2019
Region S.N.N.P
Zone BENCH MAJI
Wereda SURIMA
Selected Indictor:
Month of Hazard
G - Mar (Megabit)
Seasonal Calendar for Hazards, Activities and Income Level By Kebele
Major_Problems /Disasters
Drought, shortage of pasture
Hazard Severity
Rank
---------
Agricultural_Activities
Livestock activities
Income
Level Rank
---------
H - Apr (Meazea)
Human disease/malaria
---------
Sowing, weeding, livestock activities
1st
I - May (Ginbot)
Human disease
---------
Honey production, weeding
---------
J - Jun (Sene)
Human disease
2
Harvesting
---------
K - Jul (Hamle)
Livestock disease
1
Harvesting
---------
L - Aug (Nehase)
---------
Land preparation
---------
A - Sep (Meskerem)
---------
Livestock production
---------
B - Oct (Tikimt)
---------
Sowing
2nd
C - Nov (Hidar)
---------
Livestock activities
---------
D - Dec (Tahsas)
Human disease/malaria
---------
Harvesting
---------
Kebele Name
E - Jan (Tir)
F - Feb (Yekatit)
DISHO
Drought, shortage of water
Drought
---------
---------
Sit clearing
Livestock
---------
---------
NOTE: Hazard Severity Rank helps prioritize the more severe hazards that have occurred in the months of disaster occurrence, 3 being the worst and
1 the least severe hazards.
39
Page 2 of 12

Wereda Disaster
Risk Profile
Data_Collected_Date
National Disaster Risk Management
Commission (NDRMC)
Monday, February 25, 2019
Region S.N.N.P
Zone BENCH MAJI
Wereda SURIMA
Selected Indictor:
Month of Hazard
G - Mar (Megabit)
Seasonal Calendar for Hazards, Activities and Income Level By Kebele
Major_Problems /Disasters
Drought
Hazard Severity
Rank
---------
Agricultural_Activities
Purchasing input
Income
Level Rank
---------
H - Apr (Meazea)
Malaria
---------
Sowing weeding livestock
---------
I - May (Ginbot)
Animal disease
---------
Honey mining weeding
---------
J - Jun (Sene)
Animal disease
---------
Harvesting
---------
K - Jul (Hamle)
---------
Land preparation
---------
L - Aug (Nehase)
---------
Livestock production
---------
A - Sep (Meskerem)
---------
Sowing
---------
B - Oct (Tikimt)
Malaria
---------
---------
C - Nov (Hidar)
---------
---------
D - Dec (Tahsas)
---------
Harvesting
---------
Kebele Name
E - Jan (Tir)
F - Feb (Yekatit)
DUKU
Drought, shortage of water, conflict
Drought, shortage of water
2
Land preparation
3
Livestock activities
3rd
---------
NOTE: Hazard Severity Rank helps prioritize the more severe hazards that have occurred in the months of disaster occurrence, 3 being the worst and
1 the least severe hazards.
40
Page 3 of 12
Wereda Disaster
Risk Profile
Data_Collected_Date
National Disaster Risk Management
Commission (NDRMC)
Monday, February 25, 2019
Region S.N.N.P
Zone BENCH MAJI
Wereda SURIMA
Selected Indictor:
Month of Hazard
G - Mar (Megabit)
Seasonal Calendar for Hazards, Activities and Income Level By Kebele
Major_Problems /Disasters
Shortage of food, human disease
Hazard Severity
Rank
---------
Agricultural_Activities
Purchasing input
Income
Level Rank
---------
H - Apr (Meazea)
Conflict livestock disease
---------
Sowing, weeding
---------
I - May (Ginbot)
Human disease/Malaria, livestock disease
---------
Livestock activities
1st
J - Jun (Sene)
Livestock disease
---------
Sowing
---------
K - Jul (Hamle)
Human disease
---------
Harvesting
3rd
L - Aug (Nehase)
Livestock disease
---------
Land preparation
---------
A - Sep (Meskerem)
Livestock disease
---------
Livestock activities
2nd
B - Oct (Tikimt)
Human disease/malaria
---------
Sowing
---------
C - Nov (Hidar)
Human disease/malaria
---------
Livestock activities
---------
D - Dec (Tahsas)
Shortage of wter, conflict
1
Harvesting
---------
Kebele Name
D - Dec (Tahsas)
GUME
---------
Harvesting
---------
Kebele Name HARITEGA
NOTE: Hazard Severity Rank helps prioritize the more severe hazards that have occurred in the months of disaster occurrence, 3 being the worst and
1 the least severe hazards.
41
Page 4 of 12
Wereda Disaster
Risk Profile
National Disaster Risk Management
Commission (NDRMC)
Data_Collected_Date
Monday, February 25, 2019
Region S.N.N.P
Zone BENCH MAJI
Wereda SURIMA
Selected Indictor:
Month of Hazard
D - Dec (Tahsas)
Seasonal Calendar for Hazards, Activities and Income Level By Kebele
Major_Problems /Disasters
Shortage of grazing land
Hazard Severity
Rank
---------
Agricultural_Activities
Harvesting
Income
Level Rank
---------
Kebele Name
D - Dec (Tahsas)
KENIDA
Conflict, Malaria
---------
Harvesting
---------
Kebele Name
D - Dec (Tahsas)
KOKA
Human disease, conflict, malaria
---------
Harvesting
---------
Kebele Name
E - Jan (Tir)
F - Feb (Yekatit)
G - Mar (Megabit)
H - Apr (Meazea)
I - May (Ginbot)
J - Jun (Sene)
K - Jul (Hamle)
KOTLA KORA
Crop disease, conflict, livestock disease
Crop disease, human disease
Conflict, human disease, livestock disease
Livestock disease, shortage of water
Drought, conflict, livestock disease
Livestock disease, human disease, crop disease
Crop disease, human disease, conflict
1
Land preparation and ploughing
2
Land preparation
3
Livestock activity
1
Sowing
1
Honey production, weeding
1
Harvesting
1
Land preparation
2nd
---------
---------
---------
1st
---------
---------
NOTE: Hazard Severity Rank helps prioritize the more severe hazards that have occurred in the months of disaster occurrence, 3 being the worst and
1 the least severe hazards.
42
Page 5 of 12

Wereda Disaster
Risk Profile
Data_Collected_Date
National Disaster Risk Management
Commission (NDRMC)
Monday, February 25, 2019
Region S.N.N.P
Zone BENCH MAJI
Wereda SURIMA
Selected Indictor:
Month of Hazard
L - Aug (Nehase)
Seasonal Calendar for Hazards, Activities and Income Level By Kebele
Major_Problems /Disasters
Conflict, human disease
Hazard Severity
Rank
1
Agricultural_Activities
Livestock activities
Income
Level Rank
---------
A - Sep (Meskerem)
Livestock disease, human disease, conflict
1
Sowing, weeding
3rd
B - Oct (Tikimt)
Crop disease, human disease, conflict
1
Livestock activities
---------
C - Nov (Hidar)
Conflict, human disease, crop disease
1
Mining
---------
D - Dec (Tahsas)
Drought, crop disease, conflict
1
Harvesting
---------
Kebele Name
E - Jan (Tir)
F - Feb (Yekatit)
G - Mar (Megabit)
H - Apr (Meazea)
I - May (Ginbot)
J - Jun (Sene)
K - Jul (Hamle)
KURUMA
Drought, fire, shortage of water
Drought, conflict
Drought, shortage of pasture
Malaria, hitching desert wound
Animal disease, crop disease
3
2
---------
1
---------
---------
---------
Site clearing, plough
Purchasing input, plough
Livestock
Sowing weeding livestock
Honey, weeding
Harvesting
Harvesting
3rd
---------
---------
---------
---------
---------
---------
NOTE: Hazard Severity Rank helps prioritize the more severe hazards that have occurred in the months of disaster occurrence, 3 being the worst and
1 the least severe hazards.
43
Page 6 of 12
Wereda Disaster
Risk Profile
Data_Collected_Date
National Disaster Risk Management
Commission (NDRMC)
Monday, February 25, 2019
Region S.N.N.P
Zone BENCH MAJI
Wereda SURIMA
Selected Indictor:
Month of Hazard
L - Aug (Nehase)
Seasonal Calendar for Hazards, Activities and Income Level By Kebele
Major_Problems /Disasters
Hazard Severity
Rank
---------
Agricultural_Activities
Land preparation
Income
Level Rank
---------
A - Sep (Meskerem)
---------
Livestock production
---------
B - Oct (Tikimt)
---------
Sowing weeding livestock
---------
C - Nov (Hidar)
---------
Livestock
---------
D - Dec (Tahsas)
---------
Harvesting
---------
Kebele Name
E - Jan (Tir)
F - Feb (Yekatit)
G - Mar (Megabit)
H - Apr (Meazea)
I - May (Ginbot)
J - Jun (Sene)
K - Jul (Hamle)
MAJA
Conflict, crop disease, animal disease
Malaria, animal disease, human disease
Animal disease, human disease
Drought, malaria, shortage of water
Animal disease, crop disease
Animal disease pneumonia
Crop disease, animal disease
2
---------
---------
---------
---------
---------
---------
Site clearing , mining
Plough, purchasing input
Livestock
Sowing, weeding
Honey, mining, weeding
Harvesting
Land preparation
3rd
---------
---------
---------
---------
1st
---------
NOTE: Hazard Severity Rank helps prioritize the more severe hazards that have occurred in the months of disaster occurrence, 3 being the worst and
1 the least severe hazards.
44
Page 7 of 12

Wereda Disaster
Risk Profile
Data_Collected_Date
National Disaster Risk Management
Commission (NDRMC)
Monday, February 25, 2019
Region S.N.N.P
Zone BENCH MAJI
Wereda SURIMA
Selected Indictor:
Month of Hazard
L - Aug (Nehase)
Seasonal Calendar for Hazards, Activities and Income Level By Kebele
Major_Problems /Disasters
Hazard Severity
Rank
---------
Agricultural_Activities
Livestock
Income
Level Rank
---------
A - Sep (Meskerem)
Desert wound
---------
Sowing, weeding
2nd
B - Oct (Tikimt)
Conflict, malaria, animal disease
---------
Mining
---------
C - Nov (Hidar)
Animal disease crop disease
---------
Livestock
---------
D - Dec (Tahsas)
Drought shortage of water
---------
Harvesting
---------
Kebele Name
E - Jan (Tir)
F - Feb (Yekatit)
G - Mar (Megabit)
H - Apr (Meazea)
I - May (Ginbot)
J - Jun (Sene)
K - Jul (Hamle)
MOGA
Human disease, conflict
Human disease, livestock disease
Conflict, shortage of food, livestock disease
Human disease, conflict
Human disease/malaria, conflict
Conflict, drought, livestock disease
Livestock disease, crop disease, conflict
3
---------
2
---------
---------
---------
---------
Land preparation
Purchasing input
Livestock activities
Sowing
Weeding, honey production
Harvesting
Land preparation
2nd
---------
---------
---------
---------
1st
---------
NOTE: Hazard Severity Rank helps prioritize the more severe hazards that have occurred in the months of disaster occurrence, 3 being the worst and
1 the least severe hazards.
45
Page 8 of 12

Wereda Disaster
Risk Profile
Data_Collected_Date
National Disaster Risk Management
Commission (NDRMC)
Monday, February 25, 2019
Region S.N.N.P
Zone BENCH MAJI
Wereda SURIMA
Selected Indictor:
Month of Hazard
L - Aug (Nehase)
Seasonal Calendar for Hazards, Activities and Income Level By Kebele
Major_Problems /Disasters
Human disease, livestock disease, conflict
Hazard Severity
Rank
---------
Agricultural_Activities
Livestock activities
Income
Level Rank
---------
A - Sep (Meskerem)
Crop disease, conflict, human disease/malaria
---------
Sowing, weeding
---------
B - Oct (Tikimt)
Conflict, human disease/malaria
---------
Livestock activities
---------
C - Nov (Hidar)
Crop disease, conflict, human disease/malaria
---------
Mining
3rd
D - Dec (Tahsas)
Conflict, human disease, livestock disease
1
Harvesting
---------
Kebele Name
E - Jan (Tir)
F - Feb (Yekatit)
G - Mar (Megabit)
H - Apr (Meazea)
I - May (Ginbot)
J - Jun (Sene)
K - Jul (Hamle)
OROROMAY
Drought, shortage of water
Drought, conflict
Drought, malaria
Livestock disease, crop disease, conflict
Livestock disease, human disease
Crop disease, livestock disease
Crop disease, livestock disease
3
2
---------
---------
---------
1
---------
Ploughing, land preparation
Purchasing input
Livestock activities
Sowing, weeding, livestock activities
Honey, mining, honey production
Harvesting
Harvesting
3rd
---------
---------
---------
---------
---------
1st
NOTE: Hazard Severity Rank helps prioritize the more severe hazards that have occurred in the months of disaster occurrence, 3 being the worst and
1 the least severe hazards.
46
Page 9 of 12

Wereda Disaster
Risk Profile
Data_Collected_Date
National Disaster Risk Management
Commission (NDRMC)
Monday, February 25, 2019
Region S.N.N.P
Zone BENCH MAJI
Wereda SURIMA
Selected Indictor:
Month of Hazard
L - Aug (Nehase)
Seasonal Calendar for Hazards, Activities and Income Level By Kebele
Major_Problems /Disasters
Human disease, crop disease
Hazard Severity
Rank
---------
Agricultural_Activities
Land preparation
Income
Level Rank
---------
A - Sep (Meskerem)
Drought, conflict
---------
Livestock activities
---------
B - Oct (Tikimt)
Livestock disease
---------
Sowing, weeding, livestock activities
2nd
C - Nov (Hidar)
Drought, conflict
---------
Livestock activities
---------
D - Dec (Tahsas)
---------
Harvesting
---------
Kebele Name
E - Jan (Tir)
F - Feb (Yekatit)
G - Mar (Megabit)
H - Apr (Meazea)
I - May (Ginbot)
J - Jun (Sene)
K - Jul (Hamle)
REGIYA
Drought, fire, shortage of water
Drought, shortage of food and water, conflict
Drought, lack of pasture
Human disease/malaria
Livestock disease, crop disease
Livestock disease, human disease, pneumonia
Crop disease, livestock disease
3
2
---------
1
---------
---------
---------
Land preparation, mining, ploughing, honey production
Purchasing input, ploughing
Livestock activities
Sowing, weeding, livestock activities
Honey, mining, weeding
Harvesting
Harvesting
3rd
---------
---------
---------
---------
---------
1st
NOTE: Hazard Severity Rank helps prioritize the more severe hazards that have occurred in the months of disaster occurrence, 3 being the worst and
1 the least severe hazards.
47
Page 10 of 12

Wereda Disaster
Risk Profile
Data_Collected_Date
National Disaster Risk Management
Commission (NDRMC)
Monday, February 25, 2019
Region S.N.N.P
Zone BENCH MAJI
Wereda SURIMA
Selected Indictor:
Month of Hazard
L - Aug (Nehase)
Seasonal Calendar for Hazards, Activities and Income Level By Kebele
Major_Problems /Disasters
Human disease
Hazard Severity
Rank
---------
Agricultural_Activities
Land preparation
Income
Level Rank
---------
A - Sep (Meskerem)
Human disease
---------
Livestock activities
---------
B - Oct (Tikimt)
Crop disease
---------
Sowing, weeding, livestock activities
2nd
C - Nov (Hidar)
Livestock disease
---------
Livestock activities
---------
D - Dec (Tahsas)
Drought, conflict
---------
Harvesting
---------
Kebele Name
E - Jan (Tir)
F - Feb (Yekatit)
G - Mar (Megabit)
H - Apr (Meazea)
I - May (Ginbot)
J - Jun (Sene)
K - Jul (Hamle)
TULIGIT
Drought, fire, conflict
Drought, conflict
Drought, shortage of pasture
Human disease/malaria
Livestock disease
3
---------
2
---------
---------
---------
---------
Honey production, land preparation
Ploughing
Livestock activities
Sowing
Weeding, mining
Harvesting mining
3rd
---------
2nd
---------
---------
---------
1st
NOTE: Hazard Severity Rank helps prioritize the more severe hazards that have occurred in the months of disaster occurrence, 3 being the worst and
1 the least severe hazards.
48
Page 11 of 12
Wereda Disaster
Risk Profile
Data_Collected_Date
National Disaster Risk Management
Commission (NDRMC)
Monday, February 25, 2019
Region S.N.N.P
Zone BENCH MAJI
Wereda SURIMA
Selected Indictor:
Month of Hazard
L - Aug (Nehase)
Seasonal Calendar for Hazards, Activities and Income Level By Kebele
Major_Problems /Disasters
Flood
Hazard Severity
Rank
---------
Agricultural_Activities
Land preparation
Income
Level Rank
---------
A - Sep (Meskerem)
Malaria, livestock disease
1
---------
B - Oct (Tikimt)
---------
---------
C - Nov (Hidar)
---------
---------
D - Dec (Tahsas)
---------
---------
NOTE: Hazard Severity Rank helps prioritize the more severe hazards that have occurred in the months of disaster occurrence, 3 being the worst and
1 the least severe hazards.
49
Page 12 of 12
WDRP Indicators
Infrastructure Access Characteristics
50
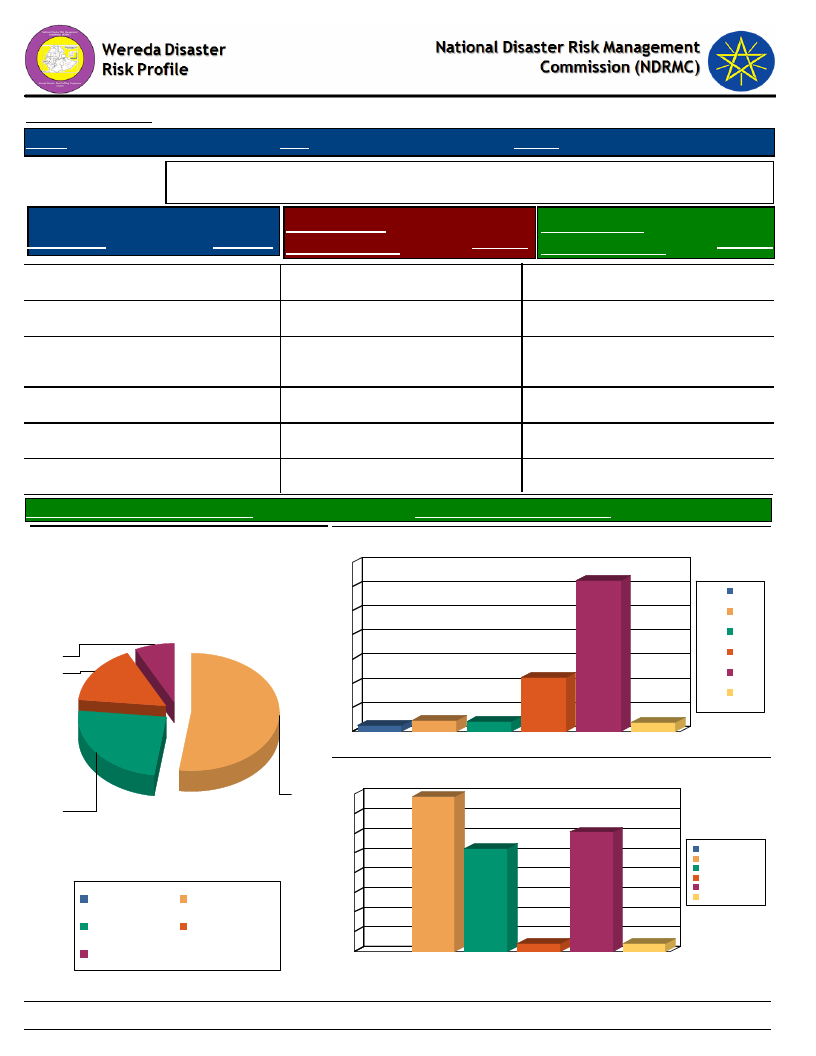
Data_Collected_Date
Region S.N.N.P
Zone BENCH MAJI
Monday, February 25, 2019
Wereda SURIMA
Selected Indicator
Type of Road
Yes, paved
Physical Vulnerability: Access to Roads & Urban Centres - Households access to
road and urban centre
Time to Nearest
Response Paved Road (Mins.)
Time To Nearest
Response Urban Center (Mins.)
7.25 Less than 30 min
62.69 Less than 1 hr
Response
30.31
Yes, gravel road
16.06 30 – 60 min
22.28 1 - 2 hrs
39.38
Yes, dirt road (difficult
for car)
No road
24.35 1 – 2 hrs
52.33 2 – 3 hrs
2.59 2 - 4 hrs
4.66 4 - 6 hrs
26.17
2.07
3 – 4 hrs
4.15 More than 6 hrs
2.07
More than 4 hrs
3.63
Avg Time To Nearest Urban Center(Mins.)
Type of Road
7
16
24
No road
Yes, dirt road (difficult
for car)
Yes, gravel road
Yes, paved
113.13
Avg_Time_To_Nearest_Paved_Road
50.75
Time to reach the nearest paved road from the HH
70
63
60
1 – 2 hrs
50
2 – 3 hrs
40
3 – 4 hrs
30
30 – 60 min
22
20
Less than 30 min
10
3
0
1 – 2 hrs
5
2 – 3 hrs
4
3 – 4 hrs
30 – 60 min
Less than 30
min
4
More than 4
hrs
More than 4 hrs
52
40
35
30
25
20
15
10
5
0
Time to reach nearest urban center from the HH
39
30
26
1 - 2 hrs
2 - 4 hrs
4 - 6 hrs
Less than 1 hr
More than 6 hrs
1 - 2 hrs
2 - 4 hrs
2
2
4 - 6 hrs
Less than 1 hr More than 6
hrs
51
Page 1 of 1
Data_Collected_Date
Region S.N.N.P
Zone BENCH MAJI
Monday, February 25, 2019
Wereda SURIMA
Selected Indicator
Physical Vulnerability: Access to Electricity - Households access and utilization
of electricity
Household_Located_In_Electricity
0.00
Household_Connected_To Electricity
0.00
52
Page 1 of 1
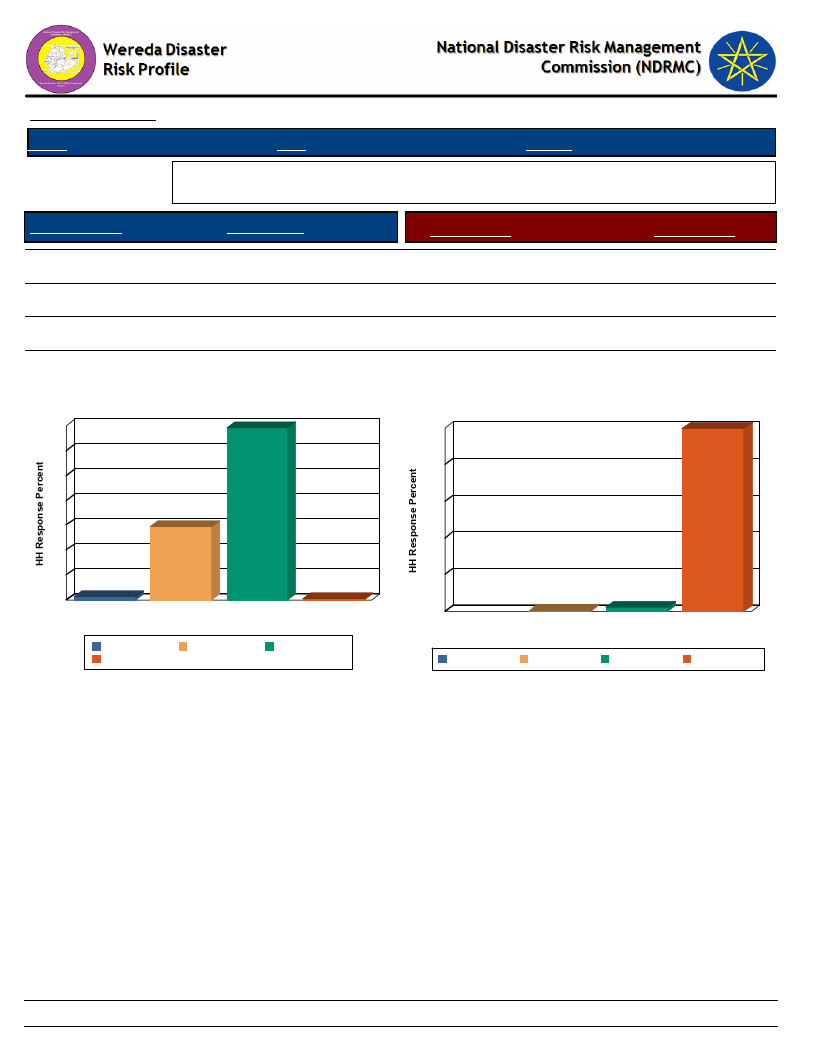
Data_Collected_Date
Region S.N.N.P
Zone BENCH MAJI
Monday, February 25, 2019
Wereda SURIMA
Selected Indicator
Floor Structure
Physical Vulnerability: Type of Dwelling Units - Households type of dwelling
houses
HH Response
Type of Floor
HH Response
Tin house
68.91
Concrete
0.26
Wood and mud
0.52
Non-Concrete
99.74
Mobile home
1.30
DK
2.12
Thatched
29.27
Floor Structure
70
69
100
60
80
50
40
60
30
29
40
20
10
20
1
1
0
Mobile hom e
Thatched
Tin house
W ood and m ud
0
Floor Structure
Mobile hom e
W ood and m ud
Thatched
Tin house
Type of Floor
100
0
2
C oncrete
DK
Type of Floor
C oncrete
DK
N on-C oncrete
N on-C oncrete
53
Page 1 of 1
WDRP Indicators
Socio Demographic Characteristics
54

Wereda Disaster
Risk Profile
National Disaster Risk Management
Commission (NDRMC)
Data_Collected_Date
Region S.N.N.P
Zone BENCH MAJI
Wereda SURIMA
Selected Indicator
Economic Vulnerability: Level of Migration - Migration level and its characteristics by Kebele
Kebele Name
KURUMA
KOTLA KORA
MAJA
Approx_No. Age_Group
50-100
Children, elder,
women
Sex
Both
No
migration
45
Youth and elder Both
Migration_Period
January
January
Migration Trend
Increased
---------
Increased
Migration_Reason
Searching for
pasture and water
for the animals
To search jobs
Monday, February 25, 2019
Destination
From Kurum to Kibish,
Maja to Banka
DUKU
CHOYE
100 - 150
All age group
Both
2000 - 2009
No
Increased
Increased
Economic hardship,
job opportunity and
loss of income
Duku, Adika, Arrow, Jeba
MOGA
REGIYA
300
All community
Both
December and
Increased
January
No
Increased
Economic hardship
Moga, Dima, Maja
TULIGIT
DISHO
30 - 50
All
No
Both
2010
Increased
Increased
Searching new
pastoral land,
escaping from flood,
conflict
NO
Haro, Banka, Gobi
No
KOKA
BOLE BOKT
8
All community
Both
July
No
Increased
---------
Crop disease ( loss
of crop product)
Koka to Banga kebele and
nearest kebele
55
Page 1 of 2
Wereda Disaster
Risk Profile
National Disaster Risk Management
Commission (NDRMC)
Data_Collected_Date
Region S.N.N.P
Zone BENCH MAJI
Wereda SURIMA
Selected Indicator
Economic Vulnerability: Level of Migration - Migration level and its characteristics by Kebele
Kebele Name
BANIKA
Approx_No.
No
Age_Group
Sex
Migration_Period
Migration Trend
Migration_Reason
---------
Monday, February 25, 2019
Destination
ANIJO
No
---------
No
No
BEBUSIN
No
Increased
KENIDA
GUME
150-250
No
All community
Both
January
Increased
Increased
Conflict
Kedolla to Tuligit,Anjo,
Maja
HARITEGA
80-12
Elders youth,
childr
Both
2008
Increased
Problem of security
especially by surma
From Hartaga to Jeba
kasiy kebele
56
Page 2 of 2
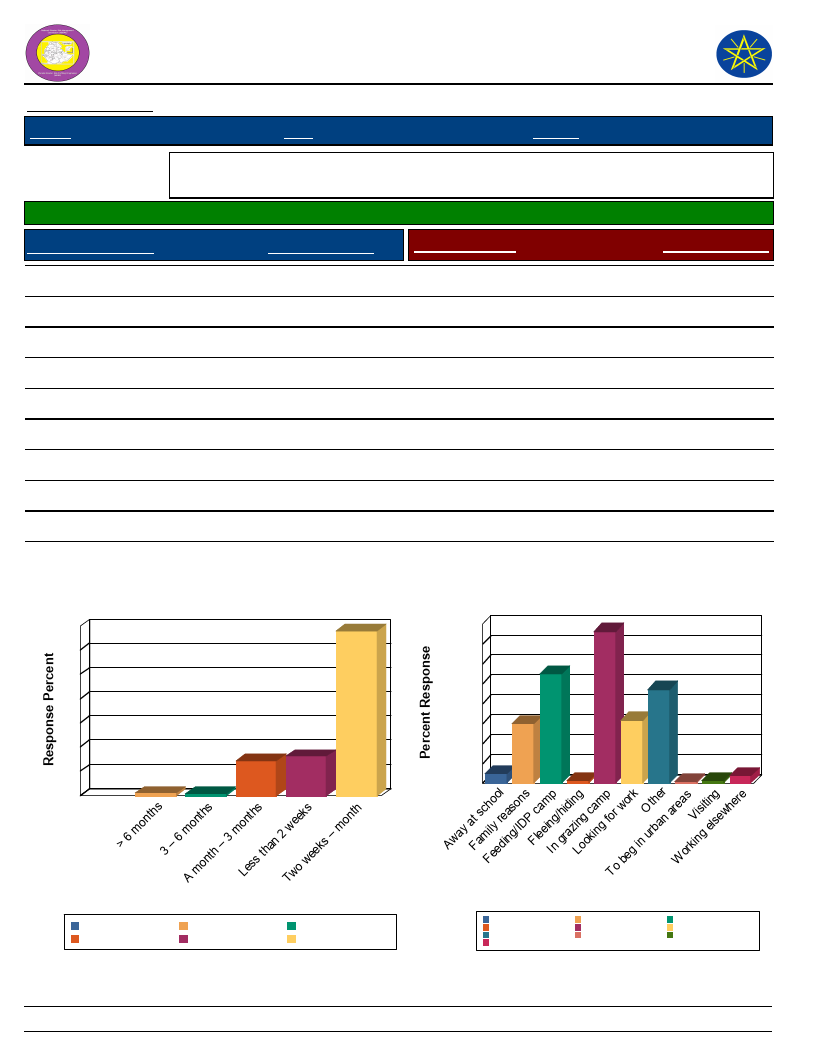
Wereda Disaster
Risk Profile
Data_Collected_Date
Region S.N.N.P
National Disaster Risk Management
Commission (NDRMC)
Monday, February 25, 2019
Zone BENCH MAJI
Wereda SURIMA
Selected Indicator
Economic Vulnerability: Household Migration - Household migration and
reason for migration
Households who migrated (%)
23.52
Duration of Migration
Response Percent
Migration Reason
Response Percent
Less than 2 weeks
Two weeks – month
A month – 3 months
3 – 6 months
> 6 months
16.12
67.99
14.25
0.70
0.93
Visiting
Family reasons
Looking for work
Working elsewhere
In grazing camp
Fleeing/hiding
Feeding/IDP camp
Away at school
To beg in urban areas
Other
0.47
11.86
12.56
1.40
30.47
0.47
21.86
1.86
0.23
18.84
Duration of Migration
70
68
60
50
40
30
20
14
16
10
1
1
0
Migration Reason
32
30
28
24
22
20
19
16
12
13
12
8
42
0
0
001
Duration of Migration
A m onth – 3 m onths
> 6 m onths
Less than 2 weeks
3 – 6 m onths
Two weeks – m onth
57
Migration Reason
Away at school
Fleeing/hiding
Other
Working elsewhere
Family reasons
In grazing camp
T o beg in urban areas
Feeding/IDP camp
Looking for work
Visiting
Page 1 of 1
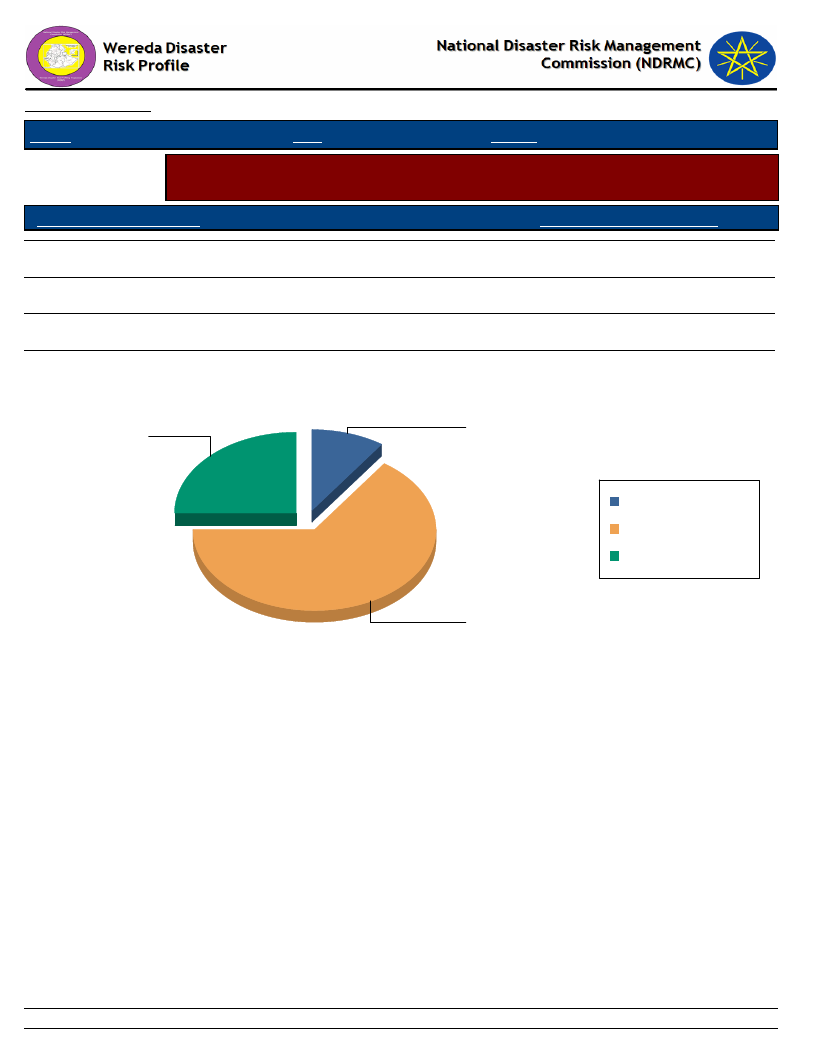
Data_Collected_Date
Region S.N.N.P
Zone BENCH MAJI
Wereda SURIMA
Monday, February 25, 2019
Selected Indicator
Economic Vulnerability: Household Migration - Disasters as a triggering factor
for migration (households response in %)
Is Migration Due to Hazard?
HH Response - Due To Hazard
No
72.41
Yes
27.59
Migration partly because of such impacts
10.63
Is Migration Due to Hazard?
Yes
27.6
Migration partly because of
such impacts
10.6
Migration partly because
of such impacts
No
Yes
No
72.4
58
Page 1 of 1
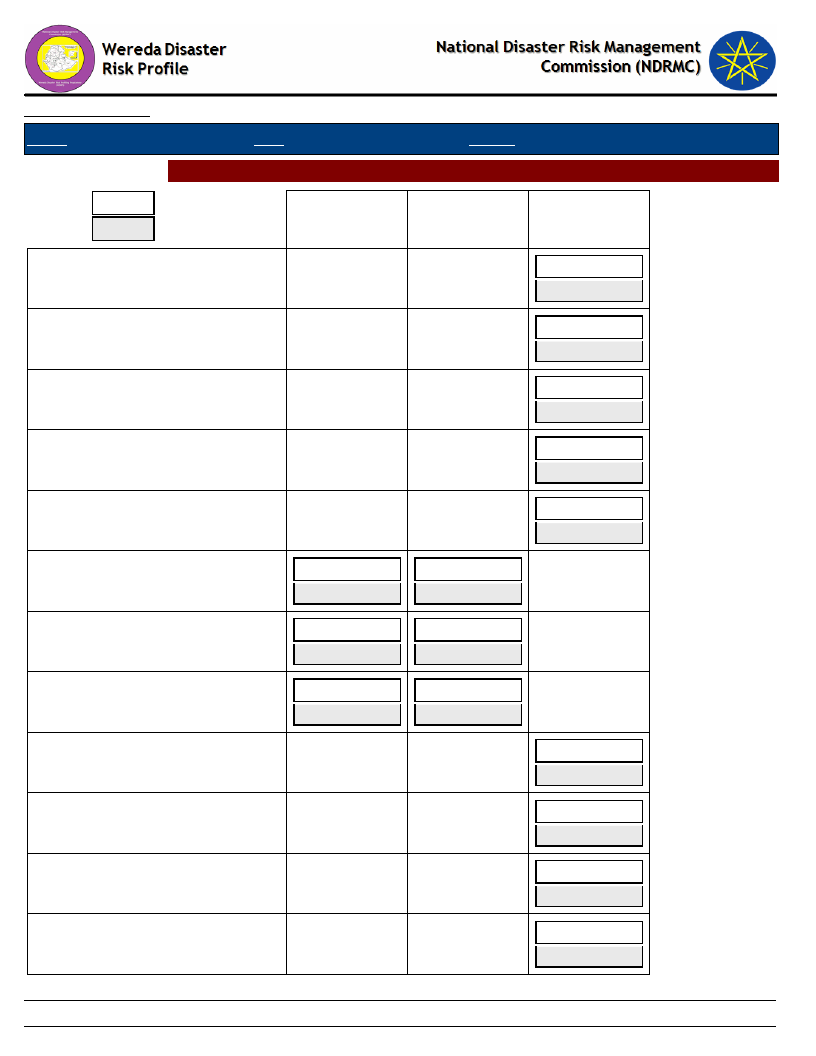
Data_Collected_Date
Region S.N.N.P
Zone BENCH MAJI
Selected Indictor: Demography: Population Structure
KEY:
Male
Female
A-Children
(0-12 yrs)
ANIJO
BANIKA
BEBUSIN
BOLE BOKT
BORIKA
CHOYE
45
54
DISHO
52
48
DUKU
50
50
GUME
HARITEGA
KENIDA
KOKA
Wereda SURIMA
Monday, February 25, 2019
B-Youth
(12-25 yrs)
45
55
47
53
50
50
D-Older
(Above 55
53
47
52
48
49
51
49
51
60
40
40
60
45
55
55
45
45
55
59
Page 1 of 2
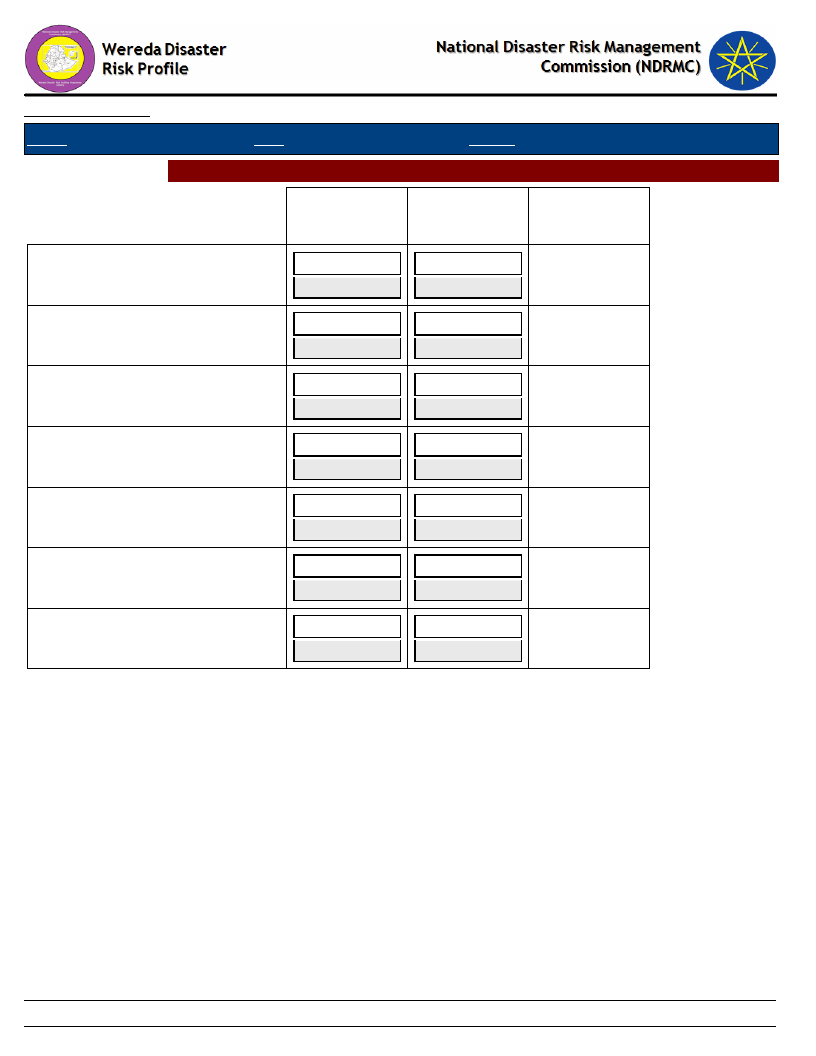
Data_Collected_Date
Region S.N.N.P
Zone BENCH MAJI
Selected Indictor: Demography: Population Structure
A-Children
(0-12 yrs)
KOTLA KORA
47
53
KURUMA
46
54
MAJA
51
49
MOGA
50
50
OROROMAY
43
57
REGIYA
48
52
TULIGIT
50
50
Wereda SURIMA
Monday, February 25, 2019
B-Youth
(12-25 yrs)
49
51
50
50
52
48
48
52
45
55
49
51
50
50
D-Older
(Above 55
60
Page 2 of 2
Data_Collected_Date
Region S.N.N.P
Zone BENCH MAJI
Monday, February 25, 2019
Wereda SURIMA
Selected Indicator
Demography: Population Trends and Ethnic Groups
Kebele Name
Population Change Trend
Population Change Reasons
Ethnic_Groups
KURUMA
KOTLA KORA
MAJA
DUKU
CHOYE
MOGA
OROROMAY
REGIYA
TULIGIT
DISHO
KOKA
BORIKA
BOLE BOKT
BANIKA
ANIJO
BEBUSIN
KENIDA
GUME
HARITEGA
Increased
Increased
Increased
Decreased
Increased
Decreased
Remains the same
Increased
Decreased
Increased
Increased
Increased
Increased
Increased
Increased
Increased
Increased
Increased
Increased
More children
More children
More children
Conflict, out migration
More children
Out migration
More children
Out migration
More children
More children
More children
More children
More children
Larger local families and more
children
More children
More children and in migration
More children
More children
Surma
Surma
Surma
Dizzi
Surma
Surma
Surma
Surma
Surma
Surma
Surma and Dizi
Suri ( Surma)
Surma
Surma and Dizi
Surma
Bume
Surma with buma
(south sudan )highly
Surma
Buma surma
61
Page 1 of 1
Data_Collected_Date
Monday, February 25, 2019
S.N.N.P
Region
Zone
BENCH MAJI
Wereda SURIMA
Selected Indicator
Social Vulnerability: Household Demographic Characteristics - Demographic
characteristics of households
Demographic Indicator
Indicator_Value Comments
Average household size
4.7
Sex ratio
1,064.0 Number of females per 1000 males
Child sex ratio (under 14 yrs)
1,022.0 Number of females per 1000 males
Adult sex ratio (18 & Above yrs)
1,287.0 Number of females per 1000 males
Dependency ratio ([(0-14)+(64+)] / (15-64)
0.9
yrs)
62
Page 1 of 1
Wereda Disaster
Risk Profile
Data_Collected_Date
National Disaster Risk Management
Commission (NDRMC)
Monday, February 25, 2019
Region S.N.N.P
Selected Indicator
General Awareness
Zone
BENCH MAJI
Wereda SURIMA
Social Vulnerability: Level of Educational Attainment - Education status of household members
Percentage Educational Level
Percentage
Read and understand text - Yes, easily
Read and understand text - Yes, with
difficulty
Can write letters - Yes, easily
Can write letters - Yes, with difficulty
General Literacy Rate
Proportion of literate population (7+) to total 7+
population
5.08
18.22
From Proportion of population (7+) - Less than 1st grade completed
Primary Education (Grade 1 - 6) Student
4.91
13.53
Secondary School Education (7 - 12) Student
From Proportion of population (15+) - Less than 1st grade
From Proportion of population (15+) - Primary (1-6)
From Proportion of population (15+) - Secondary (7-12)
Percentage
20.76
Adult Literacy Rate
Proportion of literate population (15+) to total 15+
population
62.54
34.88
2.58
77.62
18.82
3.56
Percentage
11.19
63
Page 1 of 1
Data_Collected_Date
Monday, February 25, 2019
Region S.N.N.P
Zone BENCH MAJI
Wereda SURIMA
Selected Indicator
Educational Level
Social Vulnerability: Gender Parity - Gender parity in education level (7+ years)
and household heading
Male_Percent
Female_Percent
From Proportion of population (7+) - Less than 1st grade
completed
From Proportion of population (7+) - Technical / vocational
certificate or diploma
From Proportion of population (7+) - University diploma
43.71
0.00
0.00
56.29
0.00
0.00
From Proportion of population (7+) - Pursuing University degree
0.00
0.00
From Proportion of population (7+) - University degree or higher
0.00
0.00
Primary Education (Grade 1 - 6) Student
55.37
44.63
Secondary School Education (7 - 12) Student
82.50
17.50
Male Head of HH
41.39
Female Head of HH
58.61
64
Page 1 of 1
WDRP Indicators
Environmental Characteristics
65

Data_Collected_Date
Region S.N.N.P
Zone BENCH MAJI
Monday, February 25, 2019
Wereda SURIMA
Selected Indicator
Environmental Situation: Environmental Problems - Major environmental
problems by Kebele
KebeleName
Problem_1
Problem_2
Problem_3
Problem4
KURUMA
Deforestation
Pests
KOTLA KORA
Air population
Pests
MAJA
Pest
Deforestation
MOGA
Air pollution
Pest
OROROMAY
Air pollution
Pest
REGIYA
Pests
Deforestation
KOKA
Air pollution
Pests
BANIKA
Air pollution
Pests
ANIJO
Pest
Deforestation
KENIDA
Pest
GUME
Pest
66
Page 1 of 1
Data_Collected_Date
Region S.N.N.P
Zone BENCH MAJI
Monday, February 25, 2019
Wereda SURIMA
Selected Indicator
Environmental Situation: General Land Quality - Perceptions of the community
on changes in the general quality of land over a decade
KebeleName
Current_Situation
Change_Last_Decade
Comment
KURUMA
Medium
The same
Attention for agriculture
KOTLA KORA
MAJA
DUKU
Medium
Medium
Medium
The same
The same
The same
Because little attention
for agriculture
Little attention for
agriculture
CHOYE
Medium
The same
Attention for agriculture
MOGA
Medium
Attention for agriculture
OROROMAY
Medium
The same
Attention for agriculture
REGIYA
TULIGIT
Medium
Good
The same
The same
The same because a little
bit attention for
agriculture
Attention for agriculture
DISHO
Medium
The same
A little bit attention
KOKA
BORIKA
BOLE BOKT
Medium
Medium
Medium
The same
The same
The same
Because a little bit
attention for agriculture
A little agricultural
practices
The same
BANIKA
ANIJO
BEBUSIN
Medium
Good
Medium
The same
The same
The same
Because a little bit
attention for agriculture
A little attention for
agriculture
A little bit attention
KENIDA
Medium
The same
Because a little bit
attention for agriculture
67
Page 1 of 2

Data_Collected_Date
Region S.N.N.P
Zone BENCH MAJI
Monday, February 25, 2019
Wereda SURIMA
Selected Indicator
Environmental Situation: General Land Quality - Perceptions of the community
on changes in the general quality of land over a decade
KebeleName
Current_Situation
Change_Last_Decade
Comment
GUME
HARITEGA
Medium
Medium
The same
The same
The same because a little
bit attention for
agriculture
Little bit attention
68
Page 2 of 2
Data_Collected_Date
Monday, February 25, 2019
S.N.N.P
Region
Selected Indicator
Zone BENCH MAJI
Wereda SURIMA
Environmental Situation: Changes in Landscape - Changes observed by the
community on landscape and the problems due to the changes
KebeleName
Changes_Observed
Problems_Due_To_Changes
KURUMA
Vegetation cover is
increased
Balancing nature in order to safe place to live
KOTLA KORA
Degraded
High temperature and population growth
MAJA
CHOYE
Crop production is
decreased, gold extraction
is decreased
Vegetation cover decreased
High temperature and high population
High temperature
MOGA
OROROMAY
REGIYA
TULIGIT
Crop production is
decreased
Crop production is
decreased and gold
extraction is increased
Vegetation cover is
increased gold extraction
increased, increased
agricultural practices
The same
Consecutive temperature and high population
Consecutive temp and high population
High temperature, high competition with gold
resource
No change
DISHO
Vegetation cover increased
High temperature
KOKA
BORIKA
Crop production is
decreased, gold extraction
is decreased
High agricultural practices
High temperature, high population used it
High temperature, famine
BOLE BOKT
BANIKA
ANIJO
Increase agriculture
production
Crop production is
decreased, gold extension
is decreased
The same
No problem
High temperature, high population used it
No change
69
Page 1 of 2

Data_Collected_Date
Monday, February 25, 2019
S.N.N.P
Region
Selected Indicator
Zone BENCH MAJI
Wereda SURIMA
Environmental Situation: Changes in Landscape - Changes observed by the
community on landscape and the problems due to the changes
KebeleName
Changes_Observed
Problems_Due_To_Changes
BEBUSIN
The same
No problem
KENIDA
GUME
HARITEGA
Crop production is
decreased, gold extraction
is decreased
Vegetation cover is
increased, gold extraction
decreased, increased
agricultural practices
Vegetable cover is
increased
High temperature
High temperature
70
Page 2 of 2

Wereda Disaster Risk
Profile
Data_Collected_Date
Region S.N.N.P
Zone BENCH MAJI
National Disaster Risk Management
Commission (NDRMC)
Monday, February 25, 2019
Wereda SURIMA
Selected Indicator
Kebele Name
Environmental Situation: Land-Use other than crop production - Types of land use other than crop production
across Kebeles
Landuse_1
Comments_1
Landuse_2
Comments_2
Landuse_3
Comments_3
KURUMA
Forest land
185
Pasture land
1416
Cultivated land
40
KOTLA KORA
Forest land
63
Grass land
48
Cultivated land
39
MAJA
Frost land
480
Grass land
360
Cultivated land
63
DUKU
Forest land
122
Grazing land
1240
Cultivated land
50
CHOYE
Forest land
450
Pasture land
45
Cultivated land
37
MOGA
Forest land
300
Pasture land
129
Cultivated land
41
OROROMAY
Forest land
200
Pasture land
1200
Cultivated land
65
REGIYA
Forest land
525
Pasture land
1120
Cultivated land
37
TULIGIT
Grazing land
1250
DISHO
Forest land
600
Pasture land
1150
Cultivated land
28
KOKA
BORIKA
Forest land
38
Forest land
185
Grass land ( pasture
46
land)
Pasture land
476
Cultivated land
44
Swampy area
38
BOLE BOKT
Forest land
320
Grazing land
1475
Cultivated land
50
BANIKA
Forest land
68 ha
Grass land ( pasture
land)
40 ha
Cultivated land
38 ha
71
Page 1 of 2
Wereda Disaster Risk
Profile
Data_Collected_Date
Region S.N.N.P
Zone BENCH MAJI
National Disaster Risk Management
Commission (NDRMC)
Monday, February 25, 2019
Wereda SURIMA
Selected Indicator
Kebele Name
Environmental Situation: Land-Use other than crop production - Types of land use other than crop production
across Kebeles
Landuse_1
Comments_1
Landuse_2
Comments_2
Landuse_3
Comments_3
ANIJO
Grazing land
1650 ha
Cultivated land
24 ha
BEBUSIN
Forest land
420
Pasture land
1530
Cultivated land
26
KENIDA
Forest land
36
Grass land
68
Cultivated land
63
GUME
Forest land
301
Grazing land
500
Cultivated land
47
HARITEGA
Forest land
420
Pasture land
1560
Cultivated land
34
72
Page 2 of 2

Data_Collected_Date
Region S.N.N.P
Zone BENCH MAJI
Monday, February 25, 2019
Wereda SURIMA
Selected Indicator
KebeleName
Environmental Situation: Deforestation - Observed changes over levels of
deforestation by the community and its problems
Changes_Observed
Problems_Due_To_Changes
KURUMA
Decreased
KOTLA KORA
The same
MAJA
The same
DUKU
Increased
Desertification
CHOYE
Decreased
MOGA
The same
OROROMAY
The same
REGIYA
Decreased
TULIGIT
Increased
Drought and high temperature
DISHO
Decreased
KOKA
The same
BORIKA
Decreased
BOLE BOKT
Decreased
Practicing plantation and conservation of forests
BANIKA
The same
ANIJO
Increased
High temperature and forest fire
BEBUSIN
Increased
High temperature and forest fire
KENIDA
The same
GUME
Decreased
HARITEGA
Decreased
73
Page 1 of 1
Wereda Disaster
Risk Profile
National Disaster Risk Management
Commission (NDRMC)
Data_Collected_Date
Region S.N.N.P
Zone BENCH MAJI
Wereda SURIMA
Monday, February 25, 2019
Selected Indicator
KebeleName
Environmental Situation: Natural Resources Availability - Natural resources available and changes observed by
the community
ANIJO
Resources_1
Water
Resources_3
Observed_Change_1
Decreased
Observed_Change_3
Problems_Changes_1
Lack of potable water
Problems_Changes_3
Resources_2
Observed_Change_2
Problems_Changes_2
Forest
Decreased
High temperature
Resources_4
Observed_Change_4
Problems_Changes_4
KebeleName
BANIKA
Resources_1
Land
Observed_Change_1
The same
Problems_Changes_1
Resources_3
Observed_Change_3
Problems_Changes_3
Mining
Decreased
Conflicts to use minerals
Resources_2
Observed_Change_2
Problems_Changes_2
Water
Decreased
Shortage of water and human diseases
Resources_4
Observed_Change_4
Problems_Changes_4
KebeleName
BEBUSIN
74
Page 1 of 10

Wereda Disaster
Risk Profile
National Disaster Risk Management
Commission (NDRMC)
Data_Collected_Date
Region S.N.N.P
Zone BENCH MAJI
Wereda SURIMA
Monday, February 25, 2019
Selected Indicator
Resources_1
Observed_Change_1
Problems_Changes_1
Environmental Situation: Natural Resources Availability - Natural resources available and changes observed by
the community
Water
Resources_3
Land
Decreased
Observed_Change_3
The same
Lack of safe potable water
Problems_Changes_3
Resources_2
Observed_Change_2
Problems_Changes_2
Wood land
Decreased
Shortage of fuel wood
Resources_4
Observed_Change_4
Problems_Changes_4
KebeleName
BOLE BOKT
Resources_1
Land
Observed_Change_1
The same
Problems_Changes_1
Resources_3
Observed_Change_3
Problems_Changes_3
Wood
Decrease
Desertification
Resources_2
Observed_Change_2
Problems_Changes_2
Water
Decrease
Lack of water for human and animal
Resources_4
Observed_Change_4
Problems_Changes_4
Mining
Decrease
Conflicts and human death
KebeleName
BORIKA
75
Page 2 of 10
Wereda Disaster
Risk Profile
National Disaster Risk Management
Commission (NDRMC)
Data_Collected_Date
Region S.N.N.P
Zone BENCH MAJI
Wereda SURIMA
Monday, February 25, 2019
Selected Indicator
Resources_1
Observed_Change_1
Problems_Changes_1
Environmental Situation: Natural Resources Availability - Natural resources available and changes observed by
the community
Land
Resources_3
Woods
The same
Observed_Change_3
Decreased
Problems_Changes_3
Lack of fire wood)
Resources_2
Water
Resources_4
Mining
Observed_Change_2
Problems_Changes_2
Decreased
Shortage of potable water
Observed_Change_4
Problems_Changes_4
Decreased
Conflicts
KebeleName
CHOYE
Resources_1
Water
Observed_Change_1
Decreased
Problems_Changes_1
Resources_2
Shortage of drinking water for livestock
and human
Wood
Resources_3
Observed_Change_3
Problems_Changes_3
Resources_4
Land
The same
Observed_Change_2
Problems_Changes_2
Decreased
Lack of income
Observed_Change_4
Problems_Changes_4
KebeleName
DISHO
76
Page 3 of 10

Wereda Disaster
Risk Profile
National Disaster Risk Management
Commission (NDRMC)
Data_Collected_Date
Region S.N.N.P
Zone BENCH MAJI
Wereda SURIMA
Monday, February 25, 2019
Selected Indicator
Resources_1
Observed_Change_1
Problems_Changes_1
Environmental Situation: Natural Resources Availability - Natural resources available and changes observed by
the community
Water
Resources_3
Land
Decreased
Observed_Change_3
The same
Lack of water for human and animals
Problems_Changes_3
No answer
Resources_2
Observed_Change_2
Problems_Changes_2
Wood
Decreased
The source of energy is depend o wood
Resources_4
Observed_Change_4
Problems_Changes_4
KebeleName
DUKU
Resources_1
Water
Observed_Change_1
Decreased
Problems_Changes_1
Lack of water for livestock and humans
Resources_3
Observed_Change_3
Problems_Changes_3
Land
The same
Resources_2
Observed_Change_2
Problems_Changes_2
Wood
Decreased
Lack of wood for house construction
Resources_4
Observed_Change_4
Problems_Changes_4
KebeleName
GUME
77
Page 4 of 10

Wereda Disaster
Risk Profile
National Disaster Risk Management
Commission (NDRMC)
Data_Collected_Date
Region S.N.N.P
Zone BENCH MAJI
Wereda SURIMA
Monday, February 25, 2019
Selected Indicator
Resources_1
Observed_Change_1
Problems_Changes_1
Environmental Situation: Natural Resources Availability - Natural resources available and changes observed by
the community
Land
Resources_3
Woods
The same
Observed_Change_3
Decreased
Problems_Changes_3
Lack of wood for timber and fuel
Resources_2
Observed_Change_2
Problems_Changes_2
Water
Decrease
Shortage of safe water
Resources_4
Observed_Change_4
Problems_Changes_4
Mining
Decrease
Conflicts and land degradation
KebeleName
HARITEGA
Resources_1
Water
Observed_Change_1
Decreased
Problems_Changes_1
Lack of potable water
Resources_3
Observed_Change_3
Problems_Changes_3
Land
The same
Resources_2
Observed_Change_2
Problems_Changes_2
Wood
Decreased
Lack of income from wood sale
Resources_4
Observed_Change_4
Problems_Changes_4
KebeleName
KENIDA
78
Page 5 of 10

Wereda Disaster
Risk Profile
National Disaster Risk Management
Commission (NDRMC)
Data_Collected_Date
Region S.N.N.P
Zone BENCH MAJI
Wereda SURIMA
Monday, February 25, 2019
Selected Indicator
Resources_1
Observed_Change_1
Problems_Changes_1
Environmental Situation: Natural Resources Availability - Natural resources available and changes observed by
the community
Land
Resources_3
Wood
The same
Observed_Change_3
The same
Problems_Changes_3
Resources_2
Observed_Change_2
Problems_Changes_2
Water
decreased
Lack of drinking water
Resources_4
Observed_Change_4
Problems_Changes_4
KebeleName
KOKA
Resources_1
Land
Observed_Change_1
The same
Problems_Changes_1
Resources_3
Observed_Change_3
Problems_Changes_3
Mining
Decreased
Resource competition leads to conflicts
Resources_2
Observed_Change_2
Problems_Changes_2
Water
Decreased
Lack of water for animal and human
Resources_4
Observed_Change_4
Problems_Changes_4
KebeleName
KOTLA KORA
79
Page 6 of 10

Wereda Disaster
Risk Profile
National Disaster Risk Management
Commission (NDRMC)
Data_Collected_Date
Region S.N.N.P
Zone BENCH MAJI
Wereda SURIMA
Monday, February 25, 2019
Selected Indicator
Resources_1
Observed_Change_1
Problems_Changes_1
Environmental Situation: Natural Resources Availability - Natural resources available and changes observed by
the community
Land
Resources_3
Mining
The same
Observed_Change_3
Decreased
Problems_Changes_3
Lack of income for the community
Resources_2
Observed_Change_2
Problems_Changes_2
Water
Decreased
Lack of water for human and livestock
Resources_4
Observed_Change_4
Problems_Changes_4
KebeleName
KURUMA
Resources_1
Mining
Observed_Change_1
Decreased
Problems_Changes_1
Resource conflicts
Resources_3
Observed_Change_3
Problems_Changes_3
Woods
Decreased
Lack of income from woods
Resources_2
Observed_Change_2
Problems_Changes_2
Land
The same
Resources_4
Observed_Change_4
Problems_Changes_4
KebeleName
MAJA
80
Page 7 of 10

Wereda Disaster
Risk Profile
National Disaster Risk Management
Commission (NDRMC)
Data_Collected_Date
Region S.N.N.P
Zone BENCH MAJI
Wereda SURIMA
Monday, February 25, 2019
Selected Indicator
Resources_1
Observed_Change_1
Problems_Changes_1
Environmental Situation: Natural Resources Availability - Natural resources available and changes observed by
the community
Land
Resources_3
Wood
The same
Observed_Change_3
No change
Problems_Changes_3
Resources_2
Observed_Change_2
Problems_Changes_2
Water
Decreased
Lack of water for livestock and human
Resources_4
Observed_Change_4
Problems_Changes_4
KebeleName
MOGA
Resources_1
Land
Observed_Change_1
The same
Problems_Changes_1
Resources_3
Observed_Change_3
Problems_Changes_3
Mining
Decreased
Lack of income and land degradation
Resources_2
Observed_Change_2
Problems_Changes_2
Water
Decreased
Shortage of water for livestock and human
Resources_4
Observed_Change_4
Problems_Changes_4
KebeleName
OROROMAY
81
Page 8 of 10

Wereda Disaster
Risk Profile
National Disaster Risk Management
Commission (NDRMC)
Data_Collected_Date
Region S.N.N.P
Zone BENCH MAJI
Wereda SURIMA
Monday, February 25, 2019
Selected Indicator
Resources_1
Observed_Change_1
Problems_Changes_1
Environmental Situation: Natural Resources Availability - Natural resources available and changes observed by
the community
Land
Resources_3
Mining
The same
Observed_Change_3
Decreased
Problems_Changes_3
Decreased income
Resources_2
Observed_Change_2
Problems_Changes_2
Water
Decreased
Shortage of Drinking water
Resources_4
Observed_Change_4
Problems_Changes_4
KebeleName
REGIYA
Resources_1
Water
Observed_Change_1
Decreased
Problems_Changes_1
Lack of water for drinking
Resources_3
Observed_Change_3
Problems_Changes_3
Land
The same
Resources_2
Observed_Change_2
Problems_Changes_2
Woods
Decreased
Lack of income
Resources_4
Observed_Change_4
Problems_Changes_4
Mining
Decreased
Conflicts and income deterioration
KebeleName
TULIGIT
82
Page 9 of 10
Wereda Disaster
Risk Profile
National Disaster Risk Management
Commission (NDRMC)
Data_Collected_Date
Region S.N.N.P
Zone BENCH MAJI
Wereda SURIMA
Monday, February 25, 2019
Selected Indicator
Resources_1
Observed_Change_1
Problems_Changes_1
Environmental Situation: Natural Resources Availability - Natural resources available and changes observed by
the community
Water
Resources_3
Increased
Observed_Change_3
-
Problems_Changes_3
Resources_2
Observed_Change_2
Problems_Changes_2
Forest
Decreased
Climate change
Resources_4
Observed_Change_4
Problems_Changes_4
83
Page 10 of 10
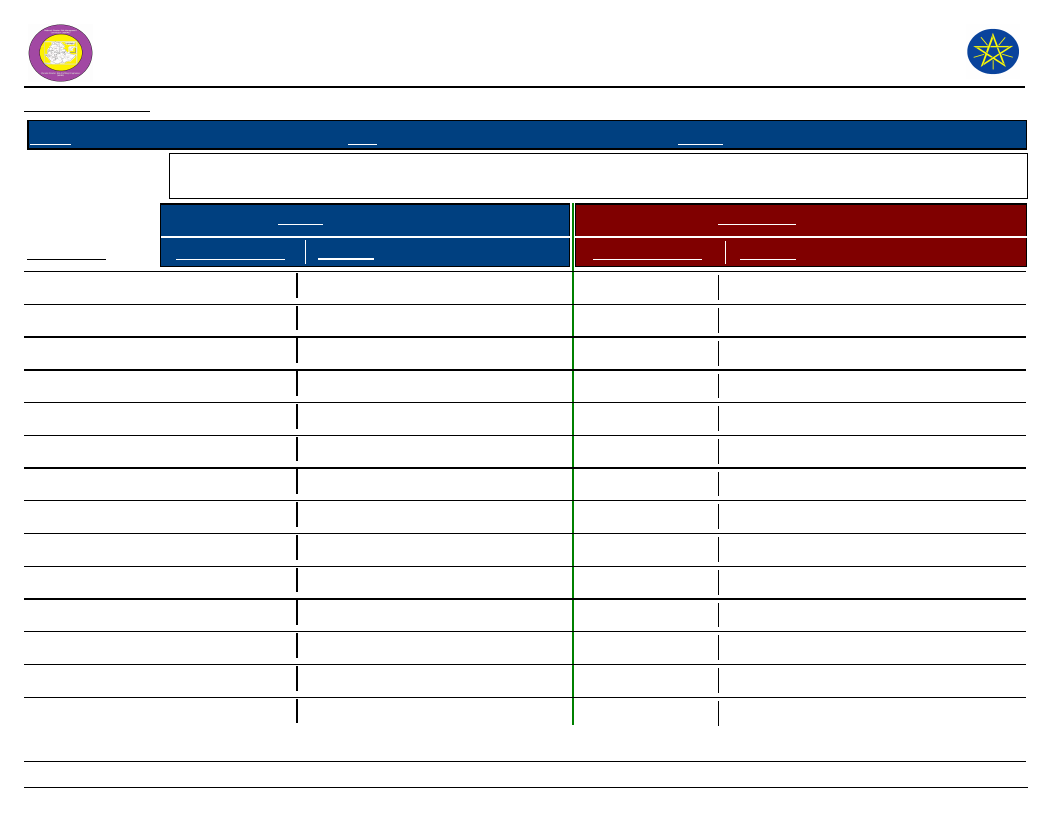
Wereda Disaster
Risk Profile
National Disaster Risk Management
Commission (NDRMC)
Data_Collected_Date
Region S.N.N.P
Selected Indicator
Zone BENCH MAJI
Wereda SURIMA
Environmental Situation: Rainfall & Temperature - Observed changes on rainfall and temperature by the
community over the last decade
Rainfall
Temperature
Monday, February 25, 2019
Kebele Name
Changes Observed Problems
Changes Observed
Problems
KURUMA
KOTLA KORA
MAJA
DUKU
CHOYE
MOGA
OROROMAY
REGIYA
TULIGIT
DISHO
KOKA
BORIKA
BOLE BOKT
BANIKA
Decreased
Decreased
Decreased
Decreased
Decreased
Decreased
Decreased
Decreased
Decreased
Decreased
Decreased
Decreased
Decrease
Decreased
Drought and desertification
Consecutive temperature
Drought and desertifcation
Climate change
Reduce productivity
Increasing temperature
Drought and desertification
Reduce productivity
Climate change
Reduce production
Shortage of pasture and water
Reduce productivities
Climate change
Shortage of water and pasture
Increased
Increased
Increased
Increased
Increased
Increased
Increased
Increased
Increased
Increased
Increased
Increased
Increase
Increased
Human, livestock and crop diseases
Human, livestock and crop diseases
Human, livestock and crop diseases
Human, livestock and crop diseases
Human, livestock and crop diseases
Human, livestock and crop diseases
Emergence of fire
Outbreak disease
Human and livestock diseases
Human diseases
Human and livestock diseases
Human and livestock diseases
Human and livestock diseases
Outbreaks of diseases
84
Page 1 of 2
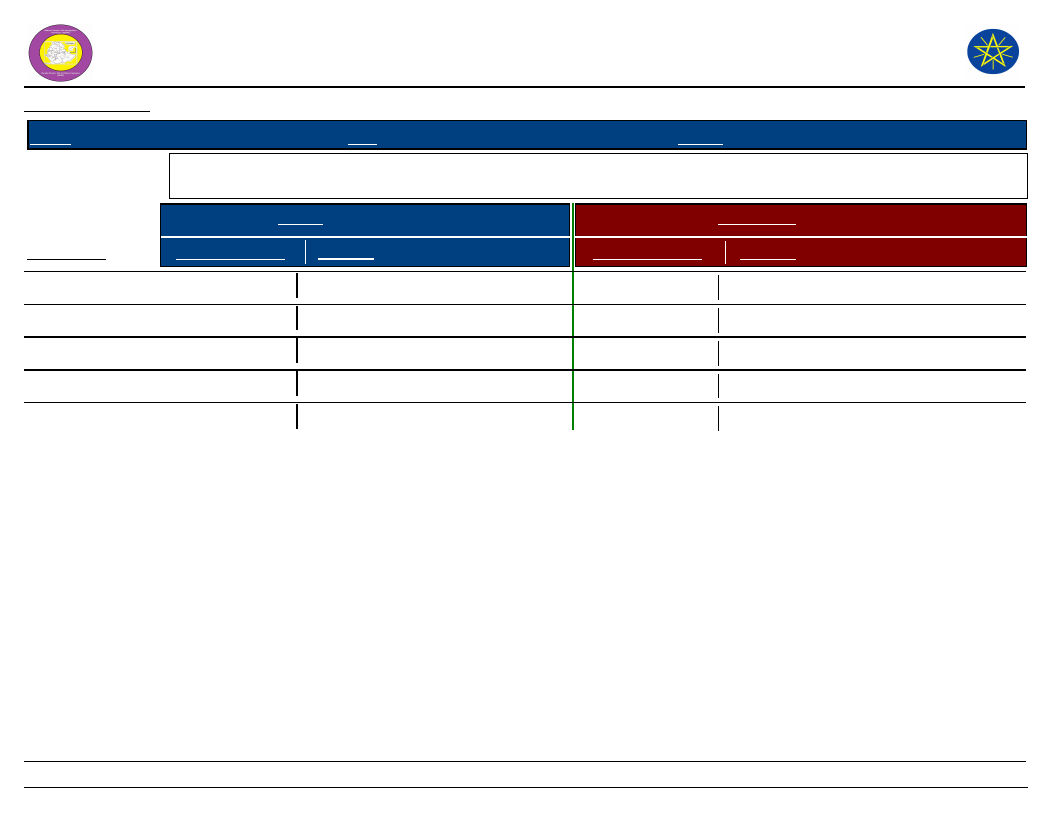
Wereda Disaster
Risk Profile
National Disaster Risk Management
Commission (NDRMC)
Data_Collected_Date
Region S.N.N.P
Selected Indicator
Zone BENCH MAJI
Wereda SURIMA
Environmental Situation: Rainfall & Temperature - Observed changes on rainfall and temperature by the
community over the last decade
Rainfall
Temperature
Monday, February 25, 2019
Kebele Name
Changes Observed Problems
Changes Observed
Problems
ANIJO
BEBUSIN
KENIDA
GUME
HARITEGA
Decrease
Decreased
Decreased
Decreased
Decreased
Climate change
Climate change
Drought
Reduce productivity
Reduce production
Increase
Increased
Increased
Increased
Increased
Outbreaks of diseases
Outbreaks of diseases
Human and livestock diseases
Human, livestock and crop diseases
Human, livestock and crop diseases
85
Page 2 of 2

Data_Collected_Date
Region S.N.N.P
Zone BENCH MAJI
Monday, February 25, 2019
Wereda SURIMA
Selected Indicator
KebeleName
Environmental Situation: Reasons for Environmental Changes
Reason_For_Environmental_Changes
KURUMA
KOTLA KORA
MAJA
DUKU
CHOYE
MOGA
OROROMAY
REGIYA
TULIGIT
DISHO
KOKA
BORIKA
BOLE BOKT
BANIKA
In the previous year the culture of agriculture is very low but right now
we get improved seed agriculture input from government and NGO so it
increase
High temperature, land degradation, high population, wild pests, forest
wire
High temperature, land degradation, high population, wild pests, forest
wire
Climate change, High temperature, land degradation, high population,
wild pests, forest wire
High temperature, land degradation, high population, wild pests, forest
wire
High temperature, land degradation, high population, wild pests, forest
wire
High temperature, land degradation, high population, wild pests, forest
wire
Deforestation, High temperature, land degradation, high population, wild
pests, forest wire
High temperature, land degradation, high population, wild pests, forest
wire
High temperature, land degradation, high population, wild pests, forest
wire
High temperature, land degradation, high population, wild pests, forest
wire
High temperature, land degradation, high population, wild pests, forest
wire
Climate change, High temperature, land degradation, high population,
wild pests, forest wire
High temperature, land degradation, high population, wild pests, forest
wire
86
Page 1 of 2
Data_Collected_Date
Region S.N.N.P
Zone BENCH MAJI
Monday, February 25, 2019
Wereda SURIMA
Selected Indicator
KebeleName
ANIJO
BEBUSIN
KENIDA
HARITEGA
Environmental Situation: Reasons for Environmental Changes
Reason_For_Environmental_Changes
High temperature, land degradation, high population, wild pests, forest
wire
Climate change, High temperature, land degradation, high population,
wild pests, forest wire
High temperature, land degradation, high population, wild pests, forest
wire
High temperature, land degradation, high population, wild pests, forest
wire
87
Page 2 of 2
Data_Collected_Date
Region S.N.N.P
Zone BENCH MAJI
Monday, February 25, 2019
Wereda SURIMA
Selected Indicator
KebeleName
KURUMA
Environmental Situation: Soil Erosion - Observed changes on levels of soil
erosion by the community
Changes_Observed
Problems_Observed
The same
-
KOTLA KORA
The same
-
MAJA
The same
-
DUKU
The same
-
CHOYE
The same
-
MOGA
The same
-
OROROMAY
The same
-
REGIYA
The same
-
TULIGIT
Increased
Run off soil and land degrdation
DISHO
The same
-
KOKA
The same
-
BORIKA
The same
-
BOLE BOKT
The same
-
BANIKA
The same
-
ANIJO
Increased
Reduction of production and land degradation
BEBUSIN
The same
-
KENIDA
The same
-
GUME
The same
-
HARITEGA
The same
-
88
Page 1 of 1
WDRP Indicators
Livelihood, Occupation and Source
of Food Characteristics
89

Wereda Disaster
Risk Profile
Data_Collected_Date
National Disaster Risk Management
Commission (NDRMC)
Monday, February 25, 2019
Region S.N.N.P
Zone
BENCH MAJI
Wereda SURIMA
Selected Indicator
Economic Vulnerability: Major Occupational Categories - Major categories of occupation and percent of
population engaged in the occupation by Kebele
Occupational Categories and Percent of Population engaged within these occupational categories
Percent (%) of Population
KebeleName
Occupation 1
Population Occupation 2
Population Occupation 3
Population Occupation 4
Population
KURUMA
KOTLA KORA
Animal protection - To
sell milk and meat
protection
Crop production
58
Honey production -
Generation of income
60
Mining
15
Crop production - To
sell crop and crop
production
10
Livestock production
8
Mining and gold
19
extraction -
Generation of income
20
Honey production
10
MAJA
DUKU
CHOYE
Animal production -
To sell meat and milk
Livestock production
Livestock production
60
Crop production - To sell
crop production
44
Crop production
70
Honey production
10
Honey production -
To sell honey
production
40
Selling of coffee and
chat
10
Crop production
10
Mining - To sell Gold
20
10
Selling vegetables
6
5
Mining
15
MOGA
Livestock production
55
Mining
20
Honey production
15
Crop production
10
OROROMAY
Honey production
10
Mining gold
15
Livestock production
65
Crop production
10
REGIYA
TULIGIT
Livestock production
60
Honey production
13
Crop production
7
Mining, gold
20
extraction
Livestock production
Mining
Honey production
-
DISHO
Animal production -
To sell milk and meat
65
Honey production - To
12
sell
90
Mining - To sell gold
and extra gold
17
Crop production - To
6
sell crop and crop
production
Page 1 of 3

Wereda Disaster
Risk Profile
Data_Collected_Date
National Disaster Risk Management
Commission (NDRMC)
Monday, February 25, 2019
Region S.N.N.P
Zone
BENCH MAJI
Wereda SURIMA
Selected Indicator
Economic Vulnerability: Major Occupational Categories - Major categories of occupation and percent of
population engaged in the occupation by Kebele
Occupational Categories and Percent of Population engaged within these occupational categories
Percent (%) of Population
KebeleName
Occupation 1
Population Occupation 2
Population Occupation 3
Population Occupation 4
Population
KOKA
BORIKA
Animal production - To
sell meat and milk
Crop production
60
Crop production - To sell
crop production
Gold extraction
15
Honey production - To
10
Mining - To sell Gold
15
sell honey product
Honey production
BOLE BOKT
BANIKA
ANIJO
BEBUSIN
KENIDA
GUME
Animal production - To
54
Honey production - To get
14
Gold extraction - To
32
increase meat and milk
good life opportunity
get income
product
Crop production - To
sell crop product
15
Animal production - To
sell meat and milk
65
Honey production - To
10
Mining - To sell gold
10
sell honey
Animal production - To
develop milk and meat
production
58
Crop production - To
avoid food shortage
12
Honey production - To
5
Mining - To generate
25
generate income
income
Animal production -
60
Crop production - To sell
15
Mining - To sell gold
25
To sell milk and meat
crop production
Animal production -
To sell meat and milk
60
Crop production - To sell
crop product
10
Honey production -
10
Mining (gold
20
To sell honey product
extraction ) - To sell
gold
Animal production -
To increase milk and
meat production
48
Honey production - To
get good life productivity
23
Crop production - To
23
Mining/ Gold
26
increase yield
extraction/ - To get
productivity
income
91
Page 2 of 3
Wereda Disaster
Risk Profile
Data_Collected_Date
National Disaster Risk Management
Commission (NDRMC)
Monday, February 25, 2019
Region S.N.N.P
Zone
BENCH MAJI
Wereda SURIMA
Selected Indicator
Economic Vulnerability: Major Occupational Categories - Major categories of occupation and percent of
population engaged in the occupation by Kebele
Occupational Categories and Percent of Population engaged within these occupational categories
Percent (%) of Population
KebeleName
HARITEGA
Occupation 1
Animal production -
To sell milk and meat
Population Occupation 2
88
Crop production - To sell
crop
Population Occupation 3
12
Population Occupation 4
Population
92
Page 3 of 3

Data_Collected_Date
Region S.N.N.P
Zone BENCH MAJI
Monday, February 25, 2019
Wereda SURIMA
Selected Indicator
Economic Vulnerability: Livelihoods - Households important sources of
livelihood (response in %)
Type of Livelihood Activity
Order of Importnce
Basket-making, Mat-making
1st
2nd
3rd
0.00
0.00
0.26
Buying and selling livestock (cattle, sheep, goats, camels)
24.09
12.69
6.53
Others
4.40
4.40
3.92
Rearing & selling animals (camels, cattle, sheep, goats)
26.94
4.92
3.66
Sale_Of_Natural_Products - Animal feed (grass, fodder, forage,
salty sand, etc.)
Sale_Of_Natural_Products - Charcoal
0.00
0.26
0.78
5.70
4.92
10.18
Sale_Of_Natural_Products - Construction materials (sand, grass,
wooden poles, etc.)
Sale_Of_Natural_Products - Firewood
0.00
0.00
0.26
0.52
6.74
11.23
Sale_Of_Natural_Products - Incense, frankincense, and natural
gum
Sale_Of_Natural_Products - Precious stones (gold, gem-stones)
0.00
26.17
0.26
25.13
2.87
12.27
Sale_Of_Natural_Products - Water
0.52
0.26
2.61
Sale_Of_Natural_Products - Wild fruits
0.00
0.00
0.52
Selling Cereal food crops (sorghum, maize, wheat, barley)
4.92
9.07
15.14
93
Page 1 of 2
Data_Collected_Date
Region S.N.N.P
Zone BENCH MAJI
Monday, February 25, 2019
Wereda SURIMA
Selected Indicator
Economic Vulnerability: Livelihoods - Households important sources of
livelihood (response in %)
Type of Livelihood Activity
Order of Importnce
1st
2nd
3rd
Selling Chat / Khat
0.00
0.00
0.26
Selling dairy products (milk, butter, ghee, cheese)
6.22
22.54
13.32
Selling eggs (from own chickens) Beekeeping (selling honey
bees-wax, or bee-hives)
Selling Fruits (mango, papaya, banana, orange, lemon, etc.)
0.00
5.18
4.18
0.00
0.00
1.57
Selling hides and skins (from goats, sheep, cattle)
0.00
0.26
0.26
Selling meat (from own livestock)
0.26
0.26
0.26
Selling Oil seeds (sesame, sunflower)
0.26
0.00
0.00
Selling Root crops (Irish potato, sweet potato)
0.00
1.55
8.88
Selling Vegetables (onion, tomato, cabbage, pumpkin, etc.)
0.00
0.26
0.26
Selling wool (from sheep)
0.00
0.00
0.52
Water-carrier, Porter
0.00
1.30
0.26
94
Page 2 of 2

Data_Collected_Date
Region S.N.N.P
Zone BENCH MAJI
Monday, February 25, 2019
Wereda SURIMA
Selected Indicator
Economic Vulnerability: Occupational Categories - Percent of population
above 15 years age by occupation categories
Type of Livelihood Activity
Main Occupation
Secondary Occupation
B)Student
C)Unemployed & seeking work
D)Neither studying nor working nor seeking work
E)Retired/ Old
F)Cultivator
G)Agricultural labourer
H)Livestock rearing
I)Non-agricultural labour
J)Craftsman
K)Shopkeeper and Petty trade
L)Home-maker (housewife)
M)Salaried
P)Others (specify)
Q)None
R)Herder
S)Herder
1st Occupation
15.64
2.35
0.45
0.11
23.35
2.46
41.23
1.79
1.01
2.79
0.11
8.72
2nd Occupation
0.98
0.56
0.28
40.28
2.38
14.55
3.78
0.70
2.24
11.19
0.14
8.81
14.13
95
Page 1 of 1

Wereda Disaster Risk
Profile
National Disaster Risk Management
Commission (NDRMC)
Data_Collected_Date
Region S.N.N.P
Zone BENCH MAJI
Wereda SURIMA
Monday, February 25, 2019
Selected Indictor: Economic Vulnerability: Sources of Food - Households source for different food items (response in %)
Source of Food
Types of Food Item
A)Own
cultivation/production
B)Casual labor
C)Borrowed
D)Gifts from
friends/neighbors
E)Purchases from main
shop
96
Page 1 of 3
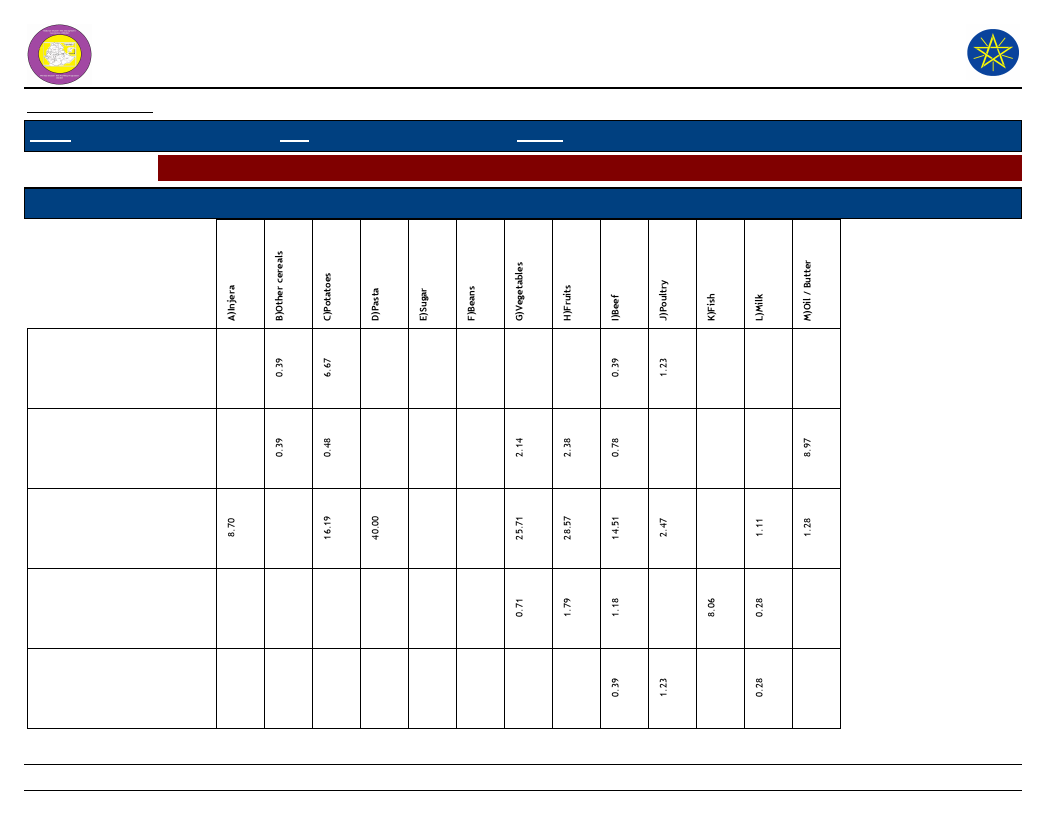
Wereda Disaster Risk
Profile
National Disaster Risk Management
Commission (NDRMC)
Data_Collected_Date
Region S.N.N.P
Zone BENCH MAJI
Wereda SURIMA
Monday, February 25, 2019
Selected Indictor: Economic Vulnerability: Sources of Food - Households source for different food items (response in %)
Source of Food
Types of Food Item
F)Free meals/Food
assistance
G)Purchase from
roadside vendor/tuck
shop
H)Purchase subsidized
food from Kebele shop
I)Gathering catching
J)Begging
97
Page 2 of 3
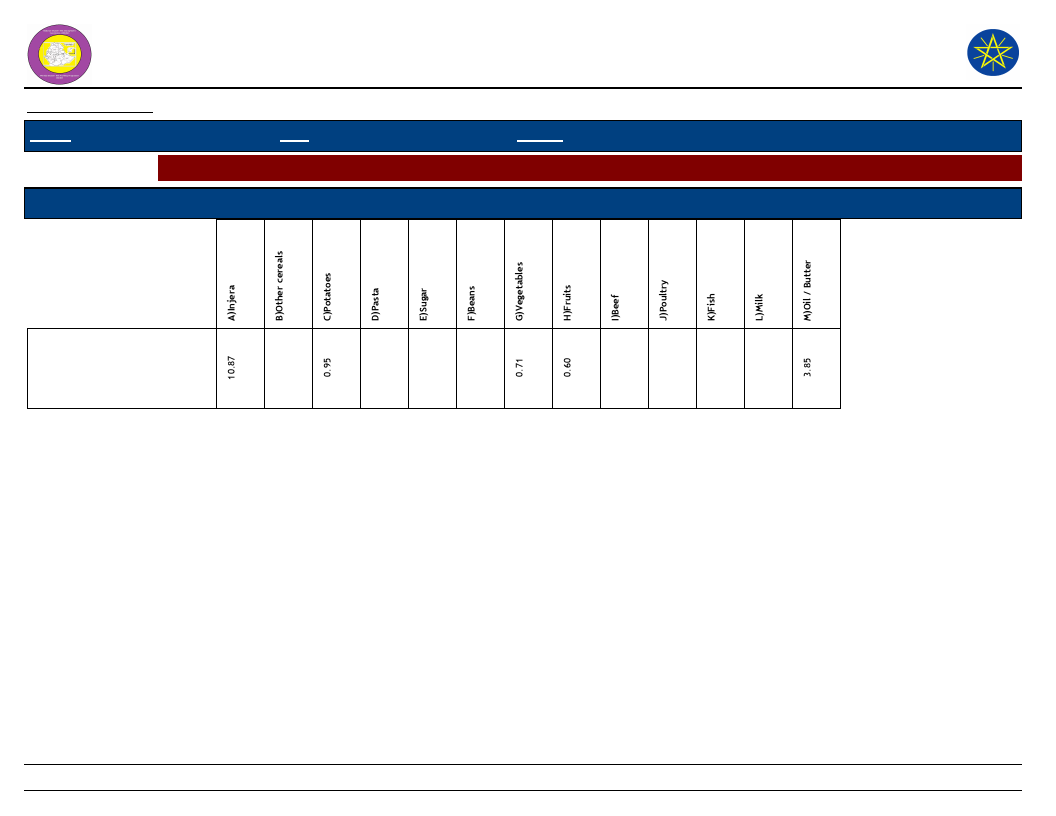
Wereda Disaster Risk
Profile
National Disaster Risk Management
Commission (NDRMC)
Data_Collected_Date
Region S.N.N.P
Zone BENCH MAJI
Wereda SURIMA
Monday, February 25, 2019
Selected Indictor: Economic Vulnerability: Sources of Food - Households source for different food items (response in %)
Source of Food
Types of Food Item
K)Other
98
Page 3 of 3
WDRP Indicators
Crop Production Characteristics
99
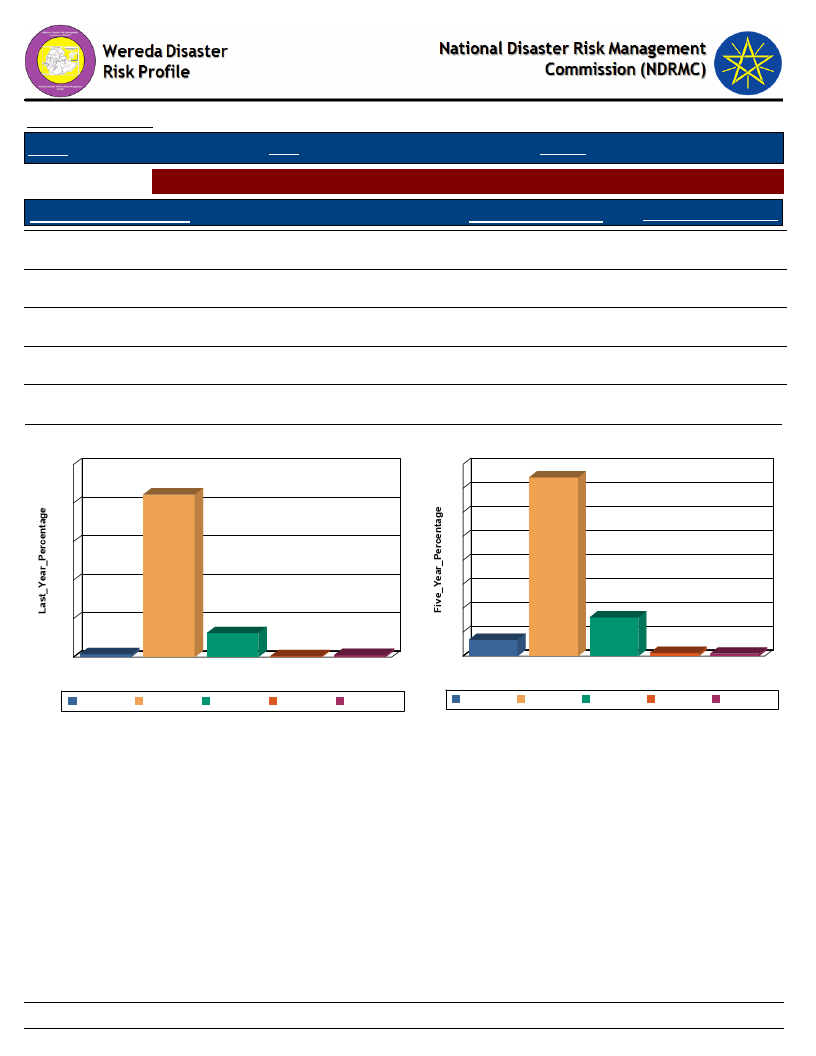
Data_Collected_Date
Region S.N.N.P
Zone BENCH MAJI
Monday, February 25, 2019
Wereda SURIMA
Selected Indictor: Hazards: Change in Crop Damages - Proportion of Total Crop Damage
Extent of Crop Damage (%)
0%
Last_Year_Percentage
1.56
Five_Year_Percentage
6.75
1 - 25 %
84.42
74.55
26 - 50 %
12.47
16.10
51 - 75 %
0.52
1.30
76 - 100 %
1.04
1.04
Extent of Crop Damage Last_Year
100
84
80
60
40
20
2
0
0%
0%
12
1
1 - 25 %
26 - 50 %
51 - 75 %
Extent of Crop Damage
1
76 - 100 %
1 - 25 %
26 - 50 %
51 - 75 %
76 - 100 %
Extent of Crop Damage Five Years Ago
80
75
70
60
50
40
30
20
10
7
0
0%
0%
16
1
1 - 25 %
26 - 50 % 51 - 75 %
Extent of Crop Damage
1
76 - 100 %
1 - 25 %
26 - 50 %
51 - 75 %
76 - 100 %
100
Page 1 of 1
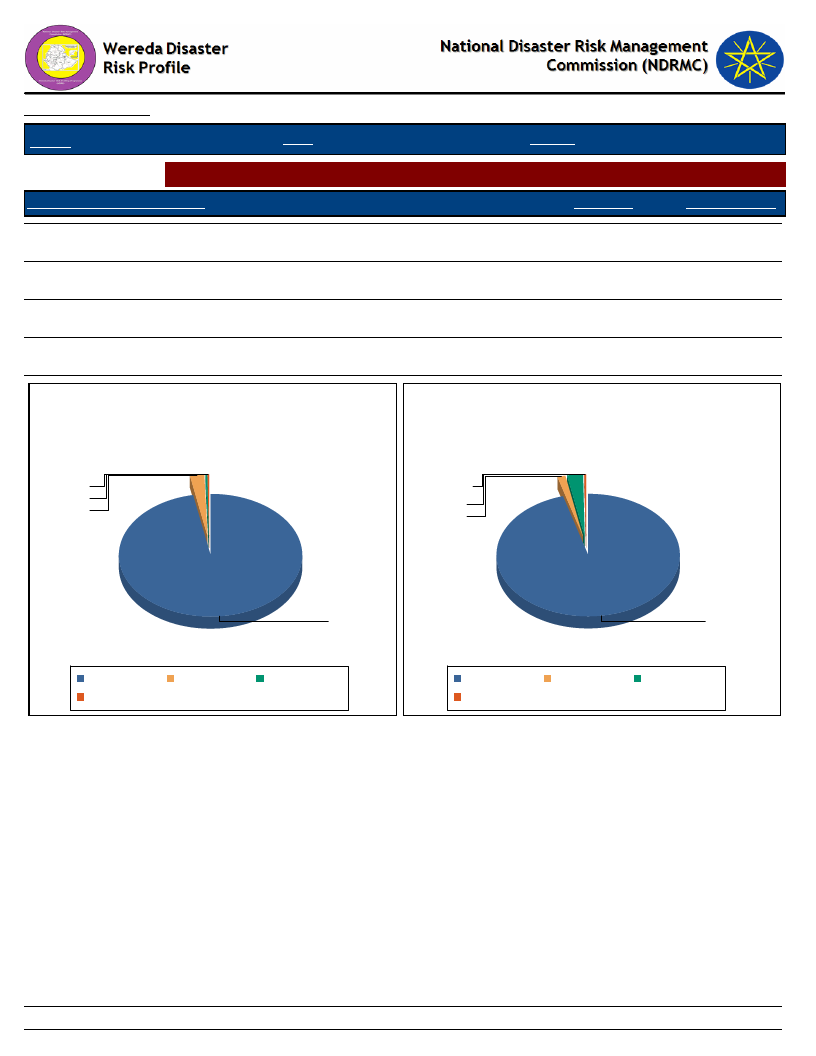
Data_Collected_Date
Monday, February 25, 2019
Region S.N.N.P
Zone BENCH MAJI
Wereda SURIMA
Selected Indictor: Hazards: Change in Crop Damages - Major reasons for crop damage
Major Reason of Crop Damage
Last_Year
Five_Year_Ago
A - Pests, Insects, Weeds
96.85
95.57
B - Drought
2.62
1.39
C - Flood
0.26
2.77
D - Frost/ Cold wave
0.26
0.28
Major Reason of Crop Damage -
Last Year
Major Reason of Crop Damage -
Five Years Ago
D - Frost/ Cold
0.3
wave
0.3
C - Flood
2.6
B - Drought
A - Pests, Insects,
Weeds
D - Frost/ Cold wave
B - Drought
96.8
C - Flood
A - Pests, Insects,
Weeds
D - Frost/ Cold wave
B - Drought
C - Flood
A - Pests,
Insects,
Weeds
101
Page 1 of 1
Data_Collected_Date
Region S.N.N.P
Zone BENCH MAJI
Wereda SURIMA
Monday, February 25, 2019
Selected
Indictor:
Last Year
Five Years Ago
Hazards: Change in Crop Damages - Proportion of Damage for Major Crops
(percentage response by households)
0%
1-25%
26-50%
51-75%
76-100%
Fruits
100.00
Maize
1.57
84.55
12.30
0.52
1.05
6.78
74.80
15.99
1.36
0.81
Root & tubers
100.00
Sorghum
66.67
33.33
78.57
14.29
7.14
102
Page 1 of 1
Data_Collected_Date
Region S.N.N.P
Zone BENCH MAJI
Monday, February 25, 2019
Wereda SURIMA
Hazards: Change in Crop Damages - Reasons for Damage of Major Crops
Last Year
Five Years Ago
Fruits
Maize
Root & tubers
Sorghum
100.00
96.83
2.65
0.26
0.26
96.23
0.87
2.61
0.29
100.00
100.00
85.71
14.29
103
Page 1 of 1
Wereda Disaster
Risk Profile
Data_Collected_Date
National Disaster Risk Management
Commission (NDRMC)
Monday, February 25, 2019
Region
S.N.N.P
Zone
BENCH MAJI
Wereda
SURIMA
Selected Indictor:
Kebele Name
ANIJO
BANIKA
BEBUSIN
BOLE BOKT
BORIKA
Agricultural Situation: Change in Crops Grown - Five major crops grown by proportion of total cultivated land
Major Crops
Main Season
Present
Cropped Area
Five_Years_Ago
Reason_For_Change
Sorghum
Belg and
8
Meher
Increase
Fertility of soil
Legume
Belg and
2
Meher
Increase
Fertility of soil
Maize
Belg and
14
Meher
Increase
Fertility of soil
Maize
Belg and
22
Meher
Increased
Maximizing land
Sorghum
Belg and
16
Meher
Increased
Minimizing land
Sorghum
Belg and
11
Meher
Increased
Modern technology
Maize
Belg and
15
Meher
Increased
Modern technology
Maize
Belg and
22
Meher
Increase
Applying improved seeds
Sorghum
Belg and
19
Meher
Increase
Applying improved seeds
Casava
Belg and
9
Meher
Increase
Applying improved seeds
Sorghum
Belg and
11
Meher
Increase
Fertility of soil
Maize
Belg and
22
Meher
Increase
Fertility of soil
104
Page 1 of 5

Wereda Disaster
Risk Profile
Data_Collected_Date
National Disaster Risk Management
Commission (NDRMC)
Monday, February 25, 2019
Region
S.N.N.P
Zone
BENCH MAJI
Wereda
SURIMA
Selected Indictor:
Kebele Name
KOTLA KORA
MAJA
DISHO
DUKU
Agricultural Situation: Change in Crops Grown - Five major crops grown by proportion of total cultivated land
Major Crops
Main Season
Present
Cropped Area
Five_Years_Ago
Reason_For_Change
Sorghum
Belg and
10
Meher
Increased
Maize
Belg and
29
Meher
Increased
Uses of Improved seed
Maize
Belg and
32
Meher
Increased
Used improved seed
Sorghum
Belg and
23
Meher
Increased
Used improved seed
Legume
Belg and
13
Meher
Increased
Used improve seed
Sorghum
Belg and
12
Meher
Increase
Because of modern technology
Maize
Belg and
18
Meher
Increased
Vegetables
Belg and
2
Meher
Increased
Fertilizer application
Wheat
Belg and
6
Meher
Increased
Fertilizer application
Beans
Belg and
7
Meher
Increased
Fertilizer application
Sorghum
Belg and
14
Meher
Increased
Fertilizer application
Maize
Belg and
18
Meher
Increased
Application of Fertilizer
105
Page 2 of 5

Wereda Disaster
Risk Profile
Data_Collected_Date
National Disaster Risk Management
Commission (NDRMC)
Monday, February 25, 2019
Region
S.N.N.P
Zone
BENCH MAJI
Wereda
SURIMA
Selected Indictor:
Kebele Name
GUME
HARITEGA
CHOYE
KENIDA
KOKA
Agricultural Situation: Change in Crops Grown - Five major crops grown by proportion of total cultivated land
Major Crops
Main Season
Present
Cropped Area
Five_Years_Ago
Reason_For_Change
Sorghum
Belg and
18.5
Meher
Increased
Appling improved seed
Maize
Belg and
26.5
Meher
Increased
Appling improved seed
Maize
Belg and
17
Meher
Increase
Modern technology
Sorghum
Belg and
14
Meher
Increase
Modern technology
Sorghum
Belg and
17
Meher
Increased
Fertility of soil
Maize
Belg and
20
Meher
Incrased
Fertility of soil
Maize
Belg and
26
Meher
Increased
Use more farm land
Legume
Belg and
8
Meher
Increased
Root & tubers
Belg and
11
Meher
Increased
Sorghum
Belg and
18
Meher
Increased
Use more farm land
Sorghum
Belg and
15
Meher
Increased
Used improved seed
Maize
Belg and
29
Meher
Increased
Used improved seed
106
Page 3 of 5

Wereda Disaster
Risk Profile
Data_Collected_Date
National Disaster Risk Management
Commission (NDRMC)
Monday, February 25, 2019
Region
S.N.N.P
Zone
BENCH MAJI
Wereda
SURIMA
Selected Indictor:
Kebele Name
KURUMA
MOGA
OROROMAY
REGIYA
TULIGIT
Agricultural Situation: Change in Crops Grown - Five major crops grown by proportion of total cultivated land
Major Crops
Main Season
Present
Cropped Area
Five_Years_Ago
Reason_For_Change
Sorghum
Belg and
20.5
Meher
Increased
Fertility of soil
Maize
Belg and
19.5
Meher
Increased
Fertility of soil
Sorghum
Belg and
12
Meher
Increased
Maize
Belg and
29
Meher
Increased
Maize
Belg and
27
Meher
Increasing
Sorghum
Belg and
26
Meher
Increasing
Legume
Belg and
12
Meher
Increasing
Sorghum
Belg and
17
Meher
Increased
Maize
Belg and
22
Meher
Increased
Maize
Belg and
12
10
Meher
Sorghum
Belg and
15
11
Meher
Root & tubers
Belg and
42
42
Meher
107
Page 4 of 5
Wereda Disaster
Risk Profile
Data_Collected_Date
National Disaster Risk Management
Commission (NDRMC)
Monday, February 25, 2019
Region
S.N.N.P
Zone
BENCH MAJI
Wereda
SURIMA
Selected Indictor:
Kebele Name
TULIGIT
Agricultural Situation: Change in Crops Grown - Five major crops grown by proportion of total cultivated land
Major Crops
Main Season
Present
Cropped Area
Five_Years_Ago
Reason_For_Change
Fruits
Belg and
5
5
Meher
Vegetables
Belg and
Meher
108
Page 5 of 5
Data_Collected_Date
Monday, February 25, 2019
Region S.N.N.P
Zone BENCH MAJI
Wereda SURIMA
Selected Indictor:
Agricultural Situation: Access to Extension - Perception of the community on
Access to Agricultural extension Services
KebeleName
Current_Level
Change_In_Last_Decade
Comments
KURUMA
KOTLA KORA
MAJA
DUKU
CHOYE
MOGA
OROROMAY
Good
Low
Good
Good
Good
Decreased
Decreased
Increased
Low there is low exchange
Increased
Increased
Increased
The same
The same
Gives attention by the
government
There is low attention by
government and NGO
Gives attention by the
government
Give attention by the
government
Gives attention by the
government
There is no attention of
NGOs and government
There is no NGOs
REGIYA
TULIGIT
DISHO
KOKA
Good
Good
Good
Good
Increased
Increased
Increased
Increased
Gives attention by the
government
Increased extension and
service
Gives attention by the
government
Gives attention by NGO s
BORIKA
Good
Increased
BOLE BOKT
BANIKA
Good
Low
Increase
The same
Gives attention the
government
There is no any institution
ANIJO
BEBUSIN
Good
Good
Increase
Increased
Increasing extension
services
Gives attention by the
government
109
Page 1 of 2
Data_Collected_Date
Monday, February 25, 2019
Region S.N.N.P
Zone BENCH MAJI
Wereda SURIMA
Selected Indictor:
Agricultural Situation: Access to Extension - Perception of the community on
Access to Agricultural extension Services
KebeleName
Current_Level
Change_In_Last_Decade
Comments
KENIDA
GUME
HARITEGA
Good
Good increase
Good
Increased
Increase
Increased
Gives attention by the
government
Give attention the
government
Give attention by the
government
110
Page 2 of 2
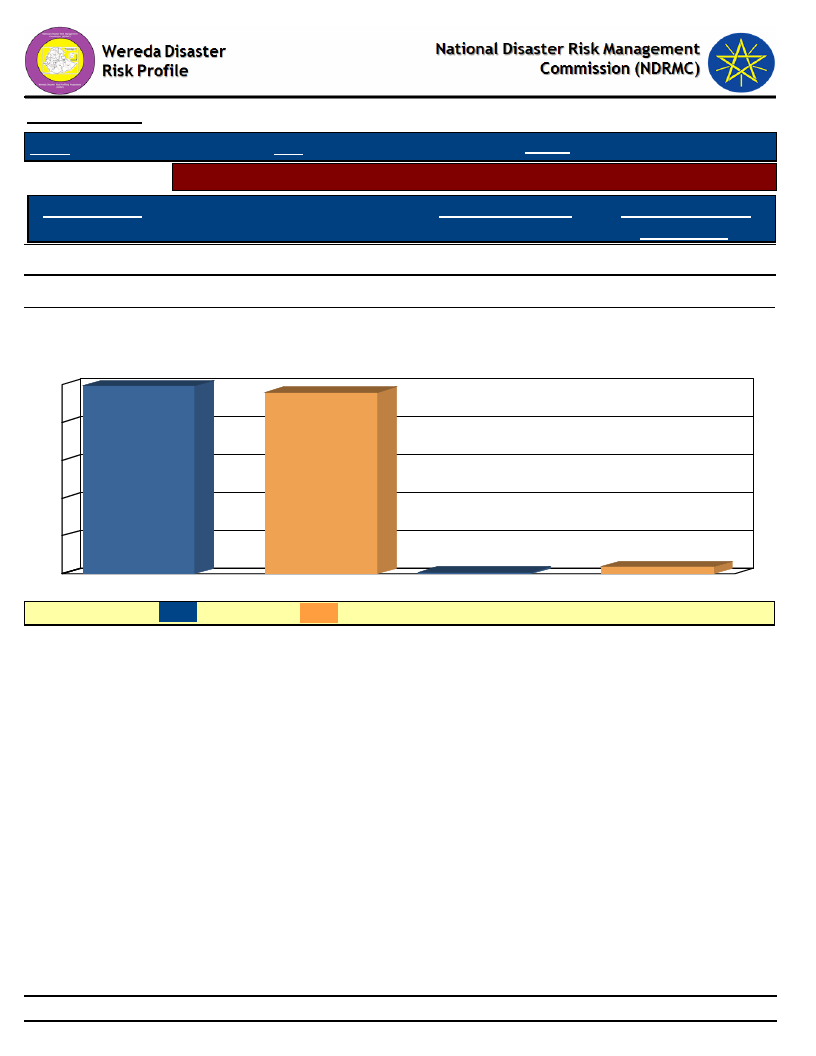
Data_Collected_Date
Region S.N.N.P
Selected Indicator
Major Crop Type
Maize
Sorghum
Zone BENCH MAJI
Wereda
Monday, February 25, 2019
SURIMA
Economic Vulnerability: Crops Grown - Types of crops grown by households
Type of Crops Grown
Last Year
99.22
Type of Crops Grown
Five Years Ago
95.84
0.78
3.64
Types of Crops Grown - Percent Responses of HHs for Last Year as compared to
Five Years Ago
99
100
96
80
60
40
20
0
LEGEND :
Maize
Last year
1
4
Sorghum
Five Years Ago
111
Page 1 of 1
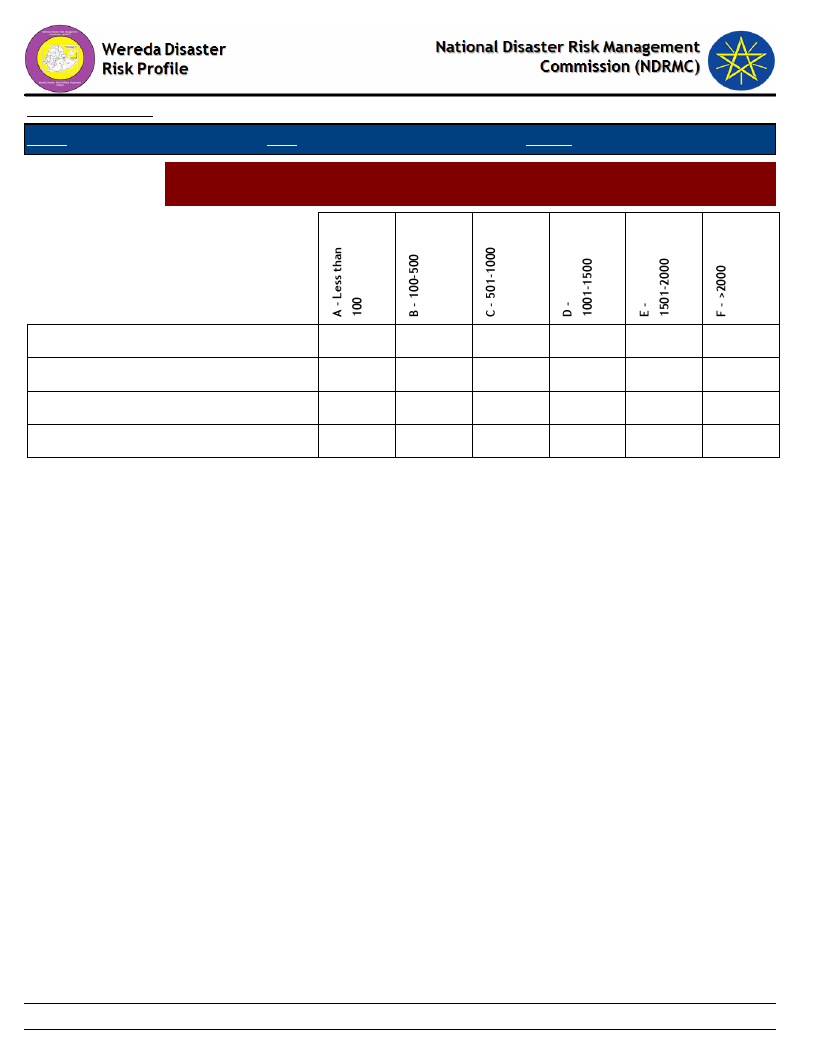
Data_Collected_Date
Region S.N.N.P
Zone BENCH MAJI
Monday, February 25, 2019
Wereda SURIMA
Selected Indictor:
Economic Vulnerability: Crops Grown - Proportion of households by amount of
yield of major crops (last year)
Fruits
Maize
Root & tubers
Sorghum
2.09
28.27
42.15
8.90
17.02
1.57
33.33
66.67
112
Page 1 of 1
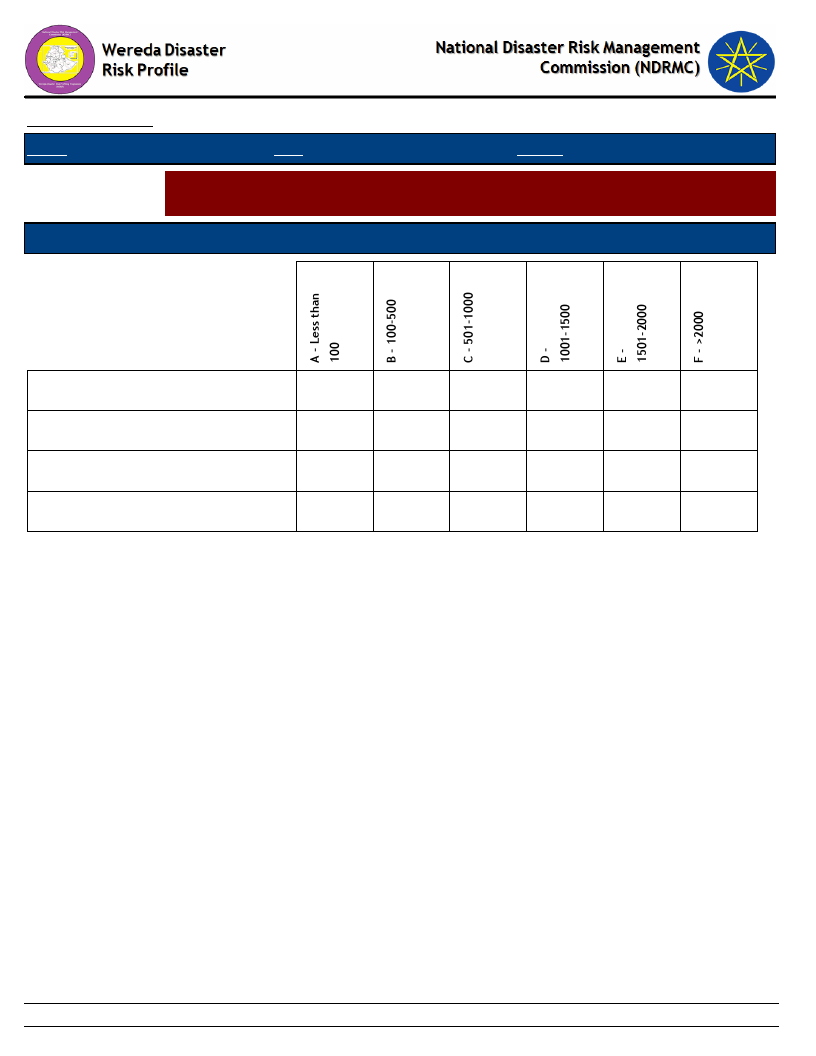
Data_Collected_Date
Region S.N.N.P
Zone BENCH MAJI
Wereda
Monday, February 25, 2019
SURIMA
Selected Indictor:
Economic Vulnerability: Crops Grown - Proportion of households by amount of
yield of major crops (Five Years Ago)
Types of Major Crops
Category of Yield used to be obtained five years ago
Fruits
Maize
Root & tubers
Sorghum
100.00
3.25
39.02
32.25
5.69
17.07
2.71
100.00
7.14
42.86
35.71
7.14
7.14
113
Page 1 of 1
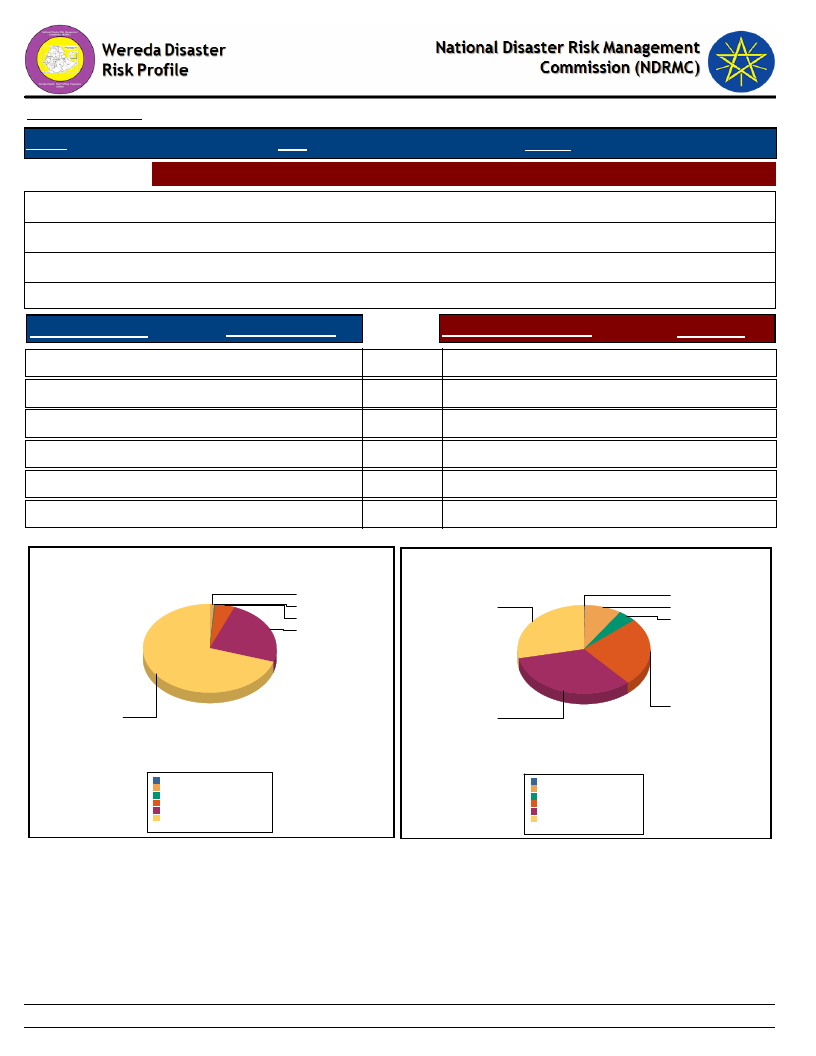
Data_Collected_Date
Monday, February 25, 2019
Region S.N.N.P
Zone BENCH MAJI
Wereda SURIMA
Selected
Economic Vulnerability: Land Ownership and Quality - Landownership of HHs
Indictor:
Households owning land (%)
99.22
Average landholding (in Hectares)s
3.34
Households cultivating land in last 12 months (%)
95.84
Average quantity of land cultivated (in hectares)
1.66
Range Land Holding
Percent_Response
Range of Cultivated Land
% Response
A - Less than 0.25 ha
0.0
B - 0.25 - 0.50 ha
1.0
C - 0.5 - 0.75 ha
0.0
D - 0.75 - 1 ha
5.0
E - 1 - 2 ha
24.0
F - More than 2 ha
71.0
IMPORTANT: ha = Hectars
Household Responses to Range Land Holding
1.1
0.3
5.0
23.8
A - Less than 0.25 ha
0.0
B - 0.25 - 0.50 ha
9.0
C - 0.5 - 0.75 ha
4.0
D - 0.75 - 1 ha
25.0
E - 1 - 2 ha
33.0
F - More than 2 ha
29.0
Household Responses to Range Cultivated Land
0.3
28.5
8.9
4.5
70.7
A - Less than 0.25 ha
B - 0.25 - 0.50 ha
C - 0.5 - 0.75 ha
D - 0.75 - 1 ha
E - 1 - 2 ha
F - More than 2 ha
T otal:
0.0%
1.0%
0.3%
4.9%
23.6%
70.1%
100.0%
25.4
33.3
A - Less than 0.25 ha
B - 0.25 - 0.50 ha
C - 0.5 - 0.75 ha
D - 0.75 - 1 ha
E - 1 - 2 ha
F - More than 2 ha
T otal:
0.3
8.9
4.5
25.4
33.3
28.5
100.8
114
Page 1 of 1
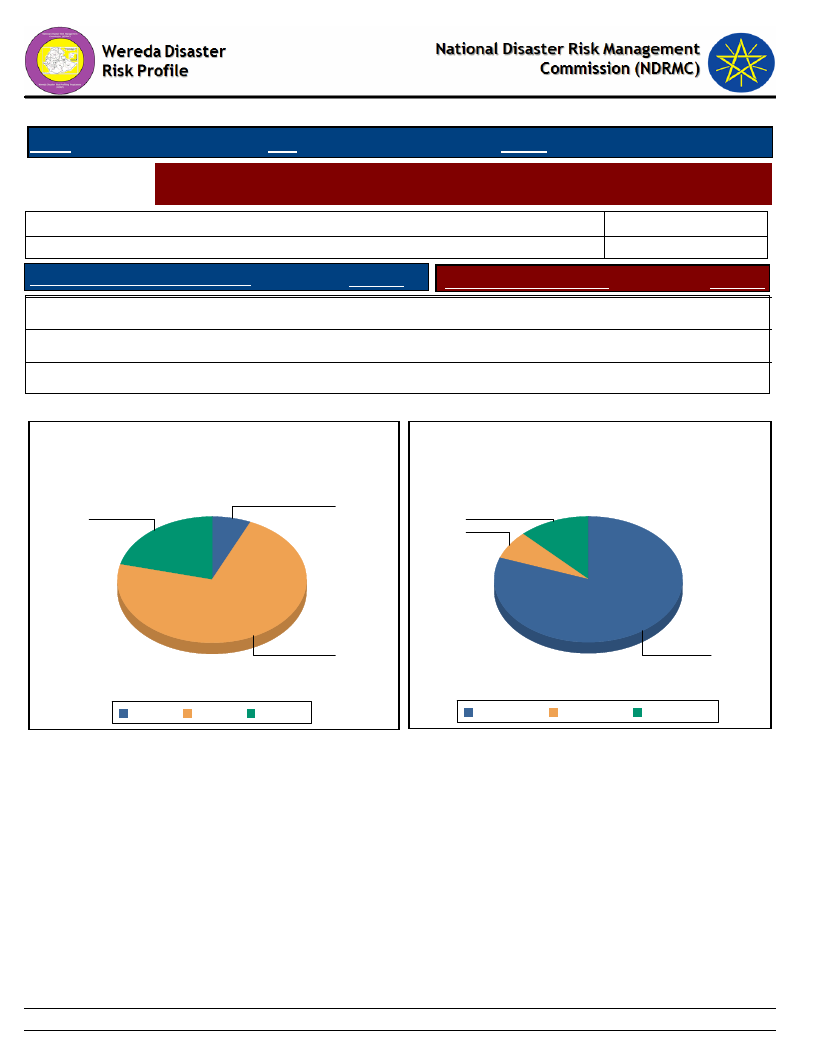
Data_Collected_Date
Region S.N.N.P
Zone BENCH MAJI
Monday, February 25, 2019
Wereda SURIMA
Selected
Indictor:
Economic Vulnerability: Land Ownership and Quality - Farmers’ perception on
the quality of their agricultural land
Cropping_Intensity *
Households with enough land for farming
HHs with favourable location of farm
Response
Households with fertile soil
Yes
21.04
Highly fertile
0.41
83.90
Response
7.27
Partially
72.21
Fertile
80.52
No
6.75
Not fertile
12.21
* Cropping Intensity = (Gross Cropped Area / Net Cropped Area )x 100%
Household responses to the type of farm
location
Household responses tp the type of soil
fertility
7
21
12
7
72
No
Partially Yes
Gross Cropped Area = Irrigated Area + Unirrigated
Area
81
Ferti l e
Highly fertile Not fertile
Net Cropped Area = Total Cultivated Area in last
12 months
115
Page 1 of 1
Data_Collected_Date
Monday, February 25, 2019
Region S.N.N.P
Selected Indictor:
KebeleName
KURUMA
KOTLA KORA
MAJA
DUKU
CHOYE
MOGA
OROROMAY
REGIYA
TULIGIT
DISHO
KOKA
BORIKA
BOLE BOKT
BANIKA
ANIJO
BEBUSIN
KENIDA
GUME
HARITEGA
Zone BENCH MAJI
Wereda SURIMA
Agricultural Situation: Access to Inputs - Perception of the community on access
to improved agricultural inputs
Current_Level
Change_In_Last_Decade
Comments
Good
Good
Good
Good
Good
Decreased
Decreased
Good
Good
Good
Good
Good
Good
Good
Good
Good
Good
Good
Good
Increased
Increased
Increased
Increased
Increased
The same
The same
Increased
Increased
increased
Increased
Increased
Increase
Increased
Increase
Increased
Increased
Increased
increased
Increased crop production
Increased crop production
Increased crop production
Increased crop production
There is no development
agent
Have no experts
Increased crop production
Increased yields
Increased crop production
Increased crop production
High demand on improved
agricultural inputs
Increase crop production
Increased crop product
Increasing yield
Increased crop production
Increased crop production
Increase crop production
increased crop production
116
Page 1 of 1
Data_Collected_Date
Region S.N.N.P
Zone BENCH MAJI
Monday, February 25, 2019
Wereda SURIMA
Selected Indictor:
KebeleName
Agricultural Situation: Water for irrigation - Access to water for irrigation in the
community
Current_Level
Change_In_Last_Decade
Comments
KURUMA
KOTLA KORA
Medium
Low
Increased
Decreased
High demand for small scale
irrigation
Shortage of rain fall
MAJA
Low
Decreased
There is high temperature
DUKU
Medium
The same
CHOYE
MOGA
Good
Decreased
The same
The same
High demand for small scale
irrigation
There is no access of irrigation
OROROMAY
Decreased
The same
No access of water
REGIYA
TULIGIT
DISHO
Medium
Good
Medium
Increased
Increased
The same
High demand for small scale
irrigation
High desire for small scale
irrigation
There is good attention
117
Page 1 of 1
Data_Collected_Date
Monday, February 25, 2019
Region S.N.N.P
Zone BENCH MAJI
Wereda SURIMA
Selected Indictor:
Kebele Name
Agricultural Situation: Soil Fertility - Perception of the community on soil fertility
and its change over time
Current_Level
Change_In_Last_Decade
Comments
KURUMA
KOTLA KORA
MAJA
DUKU
Good
Medium
Medium
Good
The same
The same
The same
The same
Little attention for
agriculture
Because little attention for
agriculture
Little attention for
agriculture
CHOYE
Good
The same
Attention for agriculture
MOGA
Medium
Increased
Attention for agriculture
OROROMAY
Medium
The same
Attention for agriculture
REGIYA
Good
The same
Attention for agriculture
TULIGIT
Medium
The same
Zero tillage agriculture
DISHO
KOKA
BORIKA
BOLE BOKT
BANIKA
ANIJO
Good
Medium
Good
Good
Medium
Medium
The same
The same
The same
The same
The same
The same
Little attention for
agriculture
Because a little bit
attention for agriculture
Agricultural practice are
very low
Little attention for
agriculture
Because a little attention
for agriculture
Zero tillage agriculture
BEBUSIN
Good
The same
A little attention
KENIDA
Medium
The same
118
Page 1 of 2
Data_Collected_Date
Monday, February 25, 2019
Region S.N.N.P
Zone BENCH MAJI
Wereda SURIMA
Selected Indictor:
Kebele Name
Agricultural Situation: Soil Fertility - Perception of the community on soil fertility
and its change over time
Current_Level
Change_In_Last_Decade
Comments
GUME
HARITEGA
Good
Good
The same
The same
Little attention for
agriculture
Little attention for
agriculture
119
Page 2 of 2
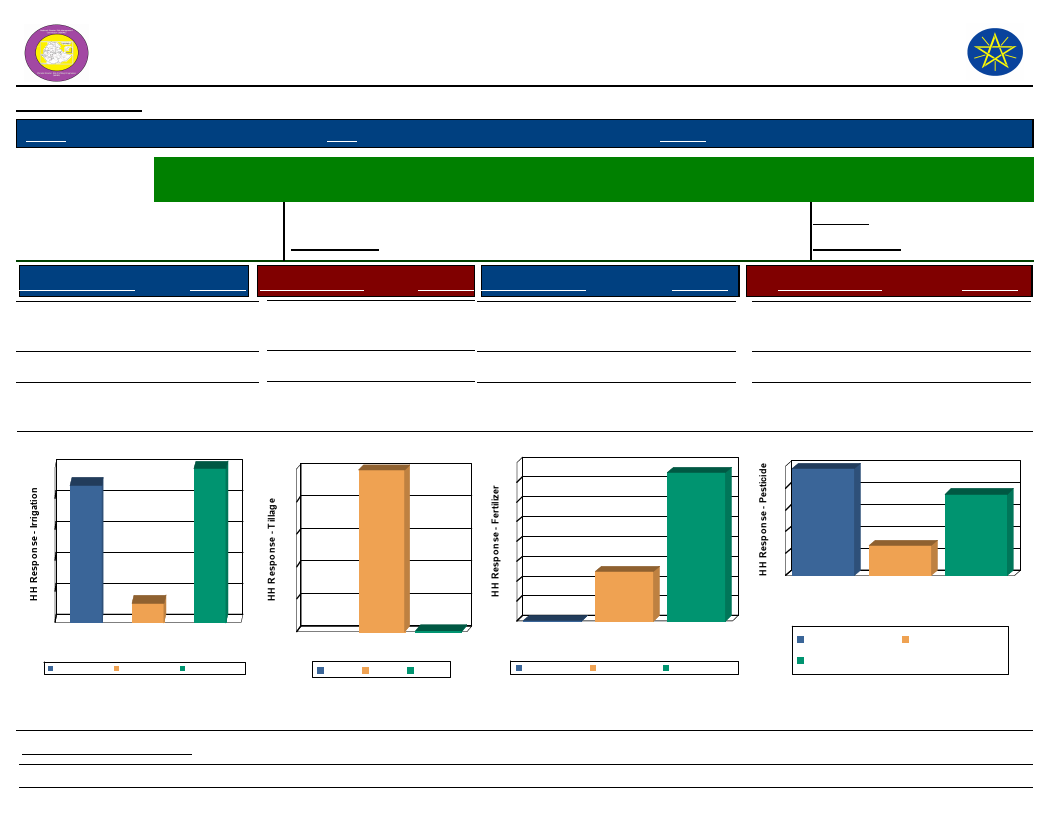
Wereda Disaster
Risk Profile
Data_Collected_Date
Region S.N.N.P
Zone BENCH MAJI
National Disaster Risk Management
Commission (NDRMC)
Monday, February 25, 2019
Wereda SURIMA
Selected Indictor:
Economic Vulnerability: Status of Agriculture - Methods of tillage, Irrigation and other agricultural input utilization
by households
Percentage of
Irrigated Area
Last Year
Five Years Ago
Percentage of households
Last Year
0.00
with irrigated area
Five Years Ago
0.00
Source of Irrigation
River/Lake/Pond
Response Method of Tillage
49.48 Oxen
Response Type of Fertilizer
0.78 Chemical
Response
0.26
Other (specify)
6.25
No Irrigation
(Rain-fed)
Source of Irrigation
50
44
40
44.27
49
30
20
10
6
0
No Irrig ation
(Rain-fed)
Other (specify) River/Lake/Pond
So u rce o f Irrig atio n
No Irrigation (Rain-fed)
Other (specify)
River/Lake/Pond
Manual
99.22
Method of Tillage
99
100
80
60
40
20
1
0
Manual
Oxen
Meth o d o f Tillag e
Manual Oxen
Natural/Animal manure
None
24.80
74.93
Type of Fertilizer
80
75
70
60
50
40
30
25
20
10
0
0
Chemical
Chemical
Natural/Animal
manure
Typ e o f F ertilizer
None
Natural/Animal manure None
Type of Pesticide
Chemicals (insecticides,
fungicide, etc)
Natural methods
None
Response
48.96
13.80
37.24
Type of Pesticide
50
49
40
37
30
20
14
10
0
Chemicals
(insecticides,
fung icide, etc)
Natural methods
Typ e o f Pesticid e
None
Chemicals (insecticides,
fung icide, etc)
None
Natural methods
Proportion_Improved_Seeds
89.84
Proportion_Agriculture_Service
120
67.79
Page 1 of 1
Data_Collected_Date
Region S.N.N.P
Zone BENCH MAJI
Wereda SURIMA
Monday, February 25, 2019
Selected Indictor:
Economic Vulnerability: Change in Agricultural Situation - Households
perception on changes of crop type, size of cultivated area and crop yields
Proportion of households reporting change in crops grown
Adequate rainfall
8.05
%
1st
2nd
3rd
54.84
4.00
Insufficient irrigation available
12.90
Less rainfall
19.35
More drought resistant crop
3.23
4.00
25.00
More pest resistant crop
12.00
25.00
More yielding crop
6.45
80.00
50.00
Other
3.23
Proportion of households reporting change in size of area cultivated
14.81 %
Addition of area
1st
2nd
26.32
17.50
Adequate rainfall
31.58
17.50
Insufficient irrigation available
5.26
2.50
Loss of area
28.07
17.50
More yielding crop
1.75
35.00
Salinity problem
5.26
10.00
Water logging
1.75
121
Page 1 of 2
Data_Collected_Date
Region S.N.N.P
Zone BENCH MAJI
Wereda SURIMA
Monday, February 25, 2019
Selected Indictor:
Economic Vulnerability: Change in Agricultural Situation - Households
perception on changes of crop type, size of cultivated area and crop yields
Proportion of households reporting change in crop yield
47.79
%
1st
2nd
Adequate fertilizer
0.54
Adequate irrigation available
1.63
Adequate rainfall
40.76
16.11
Better yielding crop
7.07
42.95
Improved variety of seeds
26.63
Insufficient fertilizer
3.36
Insufficient irrigation available
3.80
2.01
Insufficient rainfall
19.02
0.67
Other
0.54
122
Page 2 of 2
Data_Collected_Date
Region S.N.N.P
Zone BENCH MAJI
Monday, February 25, 2019
Wereda SURIMA
Selected Indicator
Economic Vulnerability: Crops Grown - Number of crops grown by households
Number of Crops Grown
One type
Crops Grown Last Year
100.00
Crops Grown Five Years Ago
100.00
Two types
0.00
0.00
Three types
0.00
0.00
Four types
0.00
0.00
Five types
0.00
0.00
Avg Crops Grown Last Year
Avg Crops Grown Five Years Ago
1.00
1.00
Number of Crops Grown Last Year
100
100
Number of Crops Grown five years ago
100
100
80
80
60
60
40
40
20
0
0
F iv e ty pes
0
0
F our ty pes One ty pe Three ty pes
Number of Crops Grown
0
Two ty pes
F iv e ty pes
Two ty pes
F our ty pes
One ty pe
Three ty pes
20
0
0
F iv e ty pes
0
0
F our ty pes One ty pe Three ty pes
Number of Crops Grown
0
Two ty pes
F iv e ty pes
Two ty pes
F our ty pes
One ty pe
Three ty pes
123
Page 1 of 1
WDRP Indicators
Livestock Production Characteristics
124

Data_Collected_Date
Monday, February 25, 2019
Regio S.N.N.P
Snelected Indictor:
Kebele Name
KURUMA
KOTLA KORA
Zone BENCH MAJI
Wereda SURIMA
Agricultural Situation: Status of Livestock Disease - Change in Livestock Disease
Status
Current_Level
Change_Over_Last_Decade
Comment
CBPP
Decreased
Increasing of knowledge
and access to health
service
CBPP, LSD
Increased
Low vaccination access
MAJA
DUKU
CHOYE
CBPP, Lumpy skin
disease
CPP, Anthrax
Kolla batting disease
Increased
The same
Increased
Lack of vaccination
No vaccination, no
veterinary service
No veterinary service
MOGA
OROROMAY
REGIYA
TULIGIT
DISHO
KOKA
BORIKA
BOLE BOKT
BANIKA
CBPP, LSD
Increased
CBPP, lumpy skin
disease
Food and mouse disease,
lung disease
Increased
Decreased
Lung disease, foot and
mouth disease
Pneumonia, Anthrax,
FMD
CBPP, LSD
Increased
Increased
Increased
Animal disease,
pneumonia, anthrax
Pneumonia, foot and
mouth disease, liver
disease
CBPP, ISD
Decreased
Decreased
Increased
Transmitted from
boundaries
poor vet services
Increasing of knowledge
and access to health
service
Lack of drugs and
vaccinations
Poor vet services
Entering from nearest
country
Good vet services
Good community awareness
and access to vet services
Tran boundary diseases
ANIJO
Long disease, FMD
Increase
Poor medicine supply and
veterinary service
125
Page 1 of 2
Data_Collected_Date
Monday, February 25, 2019
Regio S.N.N.P
Snelected Indictor:
Kebele Name
BEBUSIN
Zone BENCH MAJI
Wereda SURIMA
Agricultural Situation: Status of Livestock Disease - Change in Livestock Disease
Status
Current_Level
Change_Over_Last_Decade
Comment
CBPP, Antrax
Increased
Poor vaccination
KENIDA
GUME
HARITEGA
CBPP, Lumpy skin
disease
Foot and mouth disease
Antrax,CBPP
Increased
Decreased
Increased
Poor vet services
Attending animal health
service
No vaccination
126
Page 2 of 2
Data_Collected_Date
Monday, February 25, 2019
Region S.N.N.P
Zone BENCH MAJI
Wereda SURIMA
Selected Indictor: Livestock Diseases Prevalece
Type of livestock diseases affected households in the last five years (households reporting in %)
1st
2nd
3rd
African horse disease
2.07
1.82
0.26
Anthrax affecting cattle
22.80
4.94
3.91
Black leg
7.25
9.35
2.60
CBPP
0.26
4.17
Contagious Caprine PLeuropneumonia (CCPP)
17.36
8.31
2.86
DK
0.26
0.26
Faciolosis
0.52
9.35
1.04
Foot and mouth disease
9.59
27.79
16.15
Internal & External Parasites (Tick, mange, helminthiasis, fasci
1.82
Liverfluke (Sheep and cattle)
0.26
0.26
Lumpy Skin Disease (LSD)
1.81
22.86
18.75
Lymphangitis
0.78
Newcasle disease (Chicken)
1.82
No Disease
4.92
5.19
44.79
Pasteurellosis
0.26
0.26
PPR
0.26
0.26
Sheep pox
0.26
Trypanosomiasis
33.42
7.53
1.56
127
Page 1 of 1
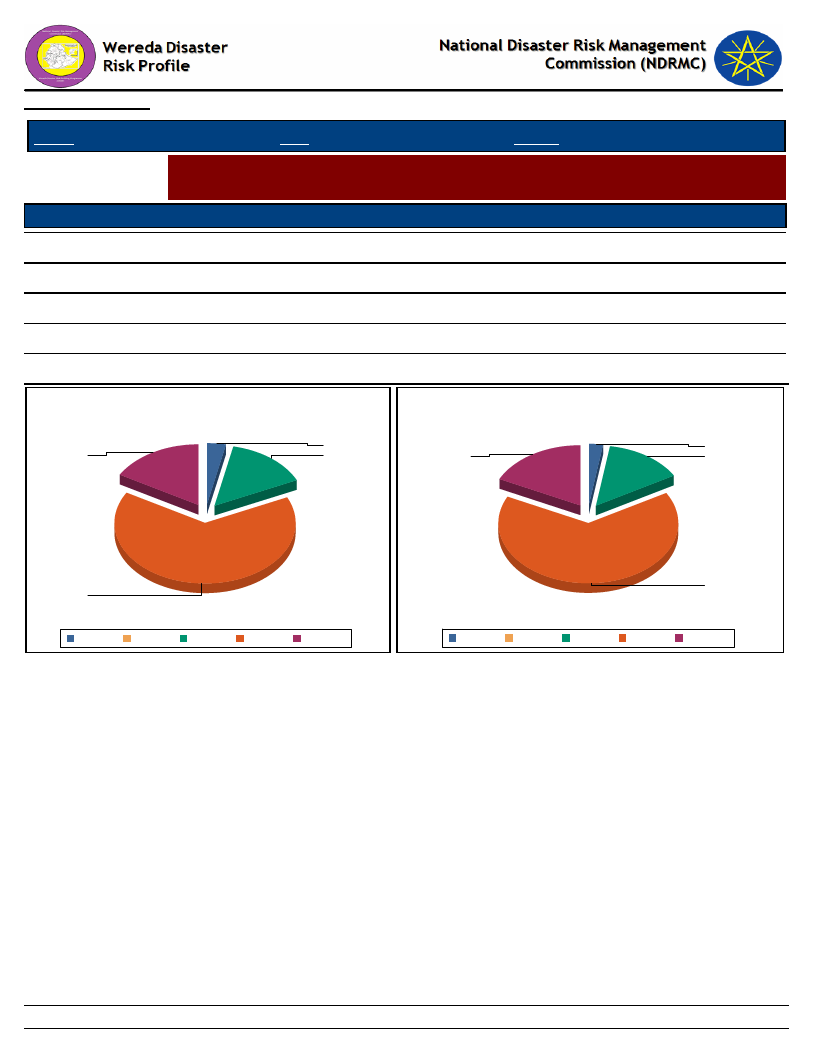
Data_Collected_Date
Monday, February 25, 2019
Region S.N.N.P
Selected Indictor:
Level of Access
Excellent
Good
Adequate
Poor
Very poor
Zone BENCH MAJI
Wereda SURIMA
Evaluation of Access to Veternary Services and Livestock Drugs
Households’ evaluation on access to drugs and veterinary services
Veternary Service
Livestock_Drugs
14.58
3.39
65.36
16.67
14.06
2.60
65.62
17.71
Level of Access to Veternary Services
Access Level of Livestock Drugs
3
3
17
15
18
14
65
Adequate Excellent
Good
Poor
Very poor
66
Adequate Excellent
Good
Poor
Very poor
128
Page 1 of 1

Data_Collected_Date
Monday, February 25, 2019
Region S.N.N.P
Selected Indictor:
Zone BENCH MAJI
Wereda SURIMA
Agricultural Situation: Water Availability for Livestock - Water availability for
livestock in the community
KebeleName
Current_Level
Change_In_Last_Decade
Comments
KURUMA
Medium
Increased
KOTLA KORA
MAJA
DUKU
CHOYE
MOGA
OROROMAY
REGIYA
Low
Low
Medium
Medium
Decreased
Decreased
Medium
Decreased
Decreased
The same
Increased
Decreased
Decreased
Increased
TULIGIT
DISHO
KOKA
BORIKA
Medium
Medium
low
Medium
Increased
Increased
Decreased
Increased
BOLE BOKT
BANIKA
ANIJO
BEBUSIN
Foot and mouth disease
Low
Medium
Medium
Decrease
Decreased
Increased
Increased
If drought is happen
association domestic
animals
Shortage of rain fall
If there is a drought occur
shortage of water occur
Drought is happen access
for domestic animals
Shortage of rain fall
Shortage of rain fall
It drought is happen,
accessible demotic animal
got in long run
It depending on the
duration of dry season
If drought is happen access
for domestic animals
Shortage of rainfall
When drought and famine is
happen water sources are
remote
Increase
Shortage of rainfall
It depends on duration of
dry season
If drought is happen access
for domestic animal
129
Page 1 of 2
Data_Collected_Date
Monday, February 25, 2019
Region S.N.N.P
Selected Indictor:
Zone BENCH MAJI
Wereda SURIMA
Agricultural Situation: Water Availability for Livestock - Water availability for
livestock in the community
KebeleName
Current_Level
Change_In_Last_Decade
Comments
KENIDA
GUME
HARITEGA
Low
Medium
Decreased
Increased
If drought is happen, access
for domestic animal go long
run
If drought happens for
shortage domestic animals
130
Page 2 of 2
Data_Collected_Date
Monday, February 25, 2019
Region S.N.N.P
Zone BENCH MAJI
Wereda SURIMA
Selected Indictor:
Agricultural Situation: Livestock Diversity - Type of livestock and their economic
importance in the community
Kebele Name
ANIJO
BANIKA
Type of Livestock
Cattle: Mature Male
Cattle: Mature Female
Goats
Cattle: under 1 year
Cattle: under 1 year
Avg_Number
4
3
2
2
10
Economic_Importance_Rank
To generate income - reproductive
payment donation
To generate income - reproductive
payment donation
To generate income - reproductive
payment donation
To generate income - reproductive
payment donation
To generate income
Goats
5
To generate income
Cattle: Mature Male
20 To generate income
Cattle: Mature Female
26 To generate income
BEBUSIN
Oxe and Cow
10 To generate income
Horses
1
To generate income
Cattle
1
To generate income
Goats
2
To generate income
BOLE BOKT
Goats
2
Increase
Cattle: under 1 year
1
Increase
Cattle: Mature Female
5
Increase
Cattle: Mature Male
4
Increase
BORIKA
Cattle: Mature Male
4
To generate income
Cattle: Mature Female
3
To generate income and food
Goats
1
To generate income
Cattle: under 1 year
1
To generate income
CHOYE
Camels: Young Female
2
Source of income
131
Page 1 of 4

Data_Collected_Date
Monday, February 25, 2019
Region S.N.N.P
Zone BENCH MAJI
Wereda SURIMA
Selected Indictor:
Agricultural Situation: Livestock Diversity - Type of livestock and their economic
importance in the community
Kebele Name
CHOYE
Type of Livestock
Cattle: Ploughing Ox
Avg_Number Economic_Importance_Rank
9
Source of income
Cattle: Cows
11 Source of income, milk production
Cattle: Male bulls
2
Source of income
Goats
2
Source of income
DISHO
Oxe and Cow
21 To generate income
Goats
3
To generate income and milk production
Cattle
2
To generate income
Eqiunes
2
To generate income
DUKU
Camels: Female
0
Cattle: Ploughing Ox
3
For ploughing
Cattle: Cows
5
Source of income and for consumption
Poultry
2
Source of income
Sheep
4
Source of income
GUME
Oxe and Cow
5
Goats
1
Cattle
1
HARITEGA
Poultry
1
To generate income
Goats
2
To generate income
Oxe and Cow
11 To generate income
KENIDA
Oxe and Cow
41 For milk production For selling
Goats
9
For selling
Cattle
6
For selling
KOKA
Goats
5
To generate income
132
Page 2 of 4

Data_Collected_Date
Monday, February 25, 2019
Region S.N.N.P
Zone BENCH MAJI
Wereda SURIMA
Selected Indictor:
Agricultural Situation: Livestock Diversity - Type of livestock and their economic
importance in the community
Kebele Name
KOKA
Type of Livestock
Cattle: under 1 year
Avg_Number Economic_Importance_Rank
9
To generate income
Cattle: Mature Female
18 To generate income
Cattle: Mature Male
15 To generate income
KOTLA KORA
Oxe and Cow
18 Income generation
Goats
16 Income generation
---------
0
KURUMA
Goats
2
To generate income and food
Oxe and Cow
13 To generate income
MAJA
Goats
6
For selling
Oxe and Cow
61 For milk production, for selling
MOGA
Cattle: Ploughing Ox
18 Source of income
Goats
3
Source of income
Camels: Young Male
9
Source of income
Cattle: Cows
20 Source of income
Cattle: Male bulls
3
Source of income
OROROMAY
Camels: Female
0
Cattle: Cows
9
To generate income
Camels: Young Male
7
To generate income
Goats
6
To generate income
Cattle: Ploughing Ox
8
To generate income
REGIYA
Cattle: Ploughing Ox
7
Source of income
Goats
2
Source of income
Camels: Young Male
1
Source of income
133
Page 3 of 4
Data_Collected_Date
Monday, February 25, 2019
Region S.N.N.P
Zone BENCH MAJI
Wereda SURIMA
Selected Indictor:
Agricultural Situation: Livestock Diversity - Type of livestock and their economic
importance in the community
Kebele Name
REGIYA
Type of Livestock
Cattle: Cows
Avg_Number Economic_Importance_Rank
9
Mil production, source of income
Cattle: Male bulls
1
Source of income
TULIGIT
Cattle: Male bulls
1
To generate income
Cattle: Cows
2
For consumption, generate income
Camels: Young Male
1
To generate income
Goats
2
To generate income
Cattle: Ploughing Ox
3
To generate income
134
Page 4 of 4
Wereda Disaster
Risk Profile
Data_Collected_Date
National Disaster Risk Management
Commission (NDRMC)
Monday, February 25, 2019
Region S.N.N.P
Zone BENCH MAJI
Wereda SURIMA
Selected Indictor:
Economic Vulnerability: Livestock Ownership and Changes - Percentage of households by number and type of
livestock owned
Bee keeping
A - None
52.33
B - 1 to 5
0.26
C - 6 to 10
2.33
D - 11 to 50
2.33
E - 51 to 100
2.85
F - More
than 100
2.33
Camels: Female
99.22
0.26
Camels: Male
99.48
0.26
Camels: Young Female
99.48
0.26
Camels: Young Male
99.48
0.26
0.26
Cattle: Female
12.18
3.89
10.10
13.73
7.25
9.07
Cattle: Male bulls
10.36
3.11
13.21
9.33
6.74
9.59
Cattle: Mature Female
4.92
0.26
3.11
3.89
2.85
6.74
Cattle: Mature Male
24.61
2.85
10.88
6.99
6.99
5.44
Cattle: under 1 year
9.84
5.70
15.54
13.99
7.25
10.62
Donkeys
98.45
1.55
Goats
22.80
1.30
4.15
3.89
3.37
6.99
Horses
98.70
1.30
135
Page 1 of 2
Wereda Disaster
Risk Profile
Data_Collected_Date
National Disaster Risk Management
Commission (NDRMC)
Monday, February 25, 2019
Region S.N.N.P
Zone BENCH MAJI
Wereda SURIMA
Selected Indictor:
Economic Vulnerability: Livestock Ownership and Changes - Percentage of households by number and type of
livestock owned
A - None
B - 1 to 5
C - 6 to 10
D - 11 to 50
E - 51 to 100
Mules
98.70
1.30
F - More
than 100
Poultry
43.52
0.78
3.11
4.15
3.63
6.22
Sheep
96.37
0.52
1.30
0.26
0.52
136
Page 2 of 2

Data_Collected_Date
Region S.N.N.P
Zone BENCH MAJI
Monday, February 25, 2019
Wereda SURIMA
Selected Indicator
Economic Vulnerability: Livestock Ownership and Changes - Households
perception on changes in livestock number in the last five years (response in %)
Type of Livestock Owned
Changes Observed By Households
Bee keeping
Camels: Female
Camels: Male
Camels: Young Female
Camels: Young Male
Cattle: Female
Cattle: Male bulls
Cattle: Mature Female
Cattle: Mature Male
Cattle: under 1 year
Donkeys
Goats
Horses
Mules
Poultry
Sheep
A - Decreased
58.79
50.00
50.00
33.33
50.00
92.92
93.06
91.01
91.75
95.97
87.88
83.03
57.14
B - Remained the Same
24.18
50.00
50.00
66.67
50.00
1.47
2.02
1.91
2.06
1.44
100.00
3.03
100.00
100.00
6.88
42.86
C - Increased
17.03
5.60
4.91
7.08
6.19
2.59
9.09
10.09
137
Page 1 of 3
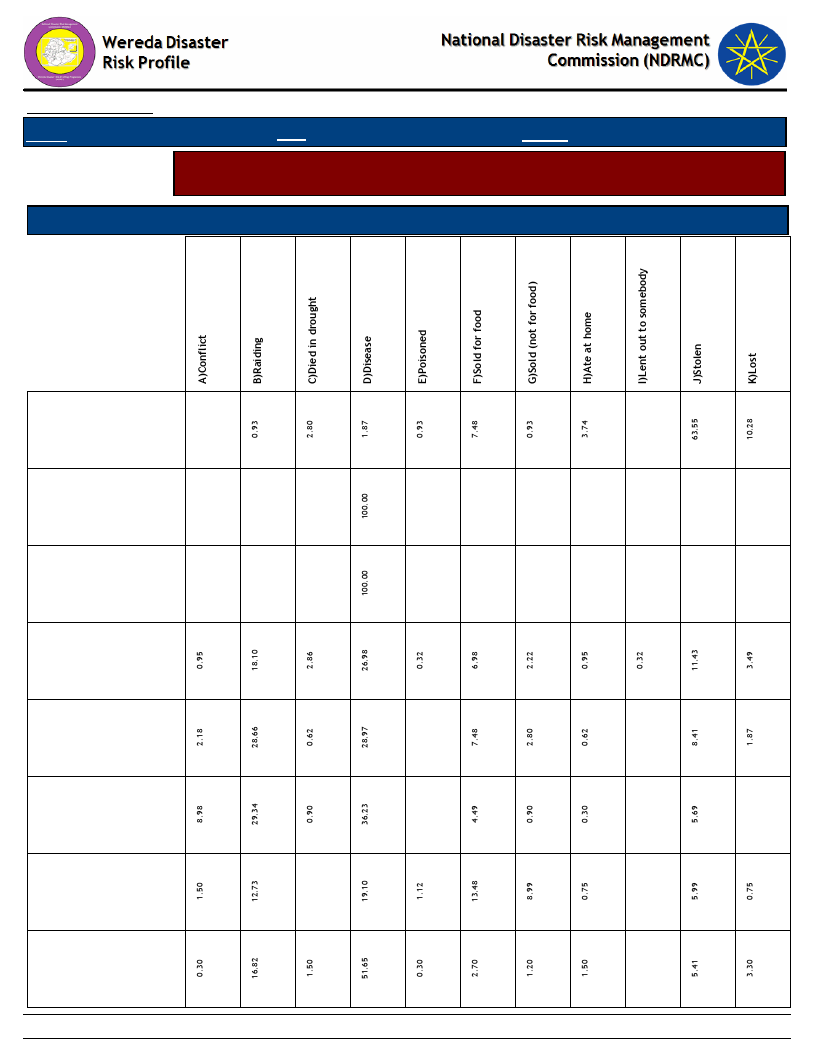
Data_Collected_Date
Region S.N.N.P
Zone BENCH MAJI
Monday, February 25, 2019
Wereda SURIMA
Selected Indicator
Economic Vulnerability: Livestock Ownership and Changes - Households
perception on changes in livestock number in the last five years (response in %)
Type of Livestock Owned
Reason for Decrease in Livestock Number
Bee keeping
Camels: Male
Camels: Young
Male
Cattle: Female
Cattle: Male bulls
Cattle: Mature
Female
Cattle: Mature
Male
Cattle: under 1
year
138
Page 2 of 3
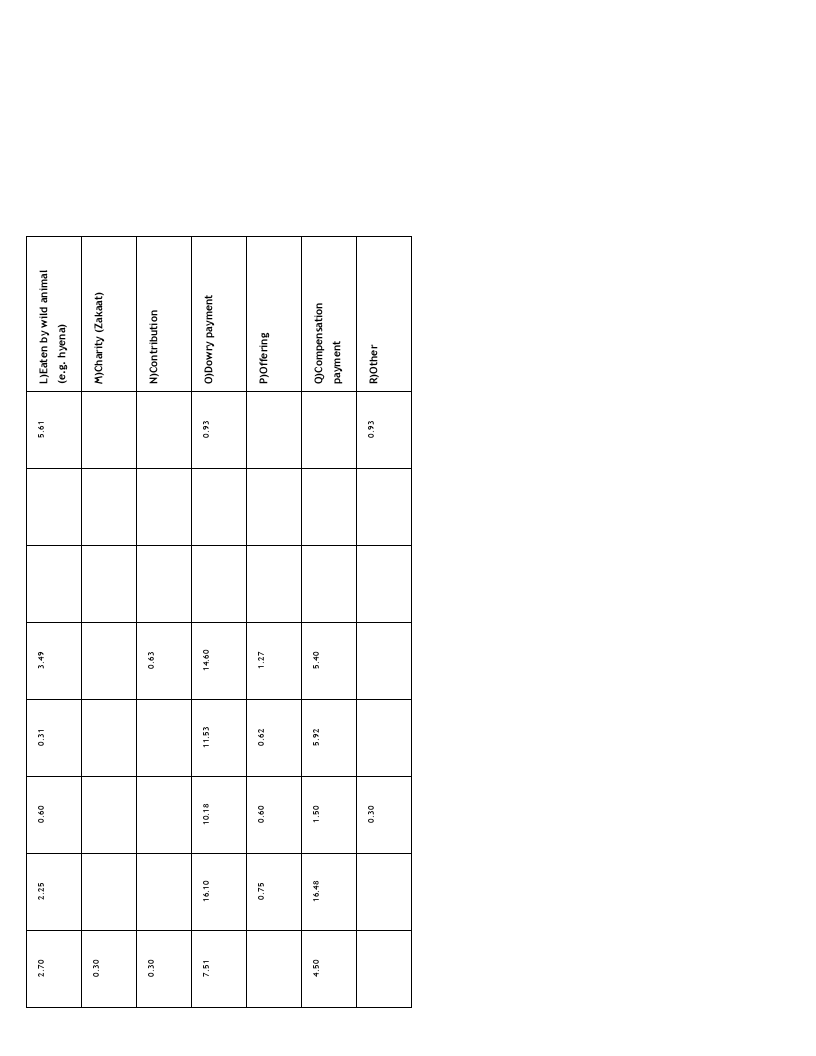
139
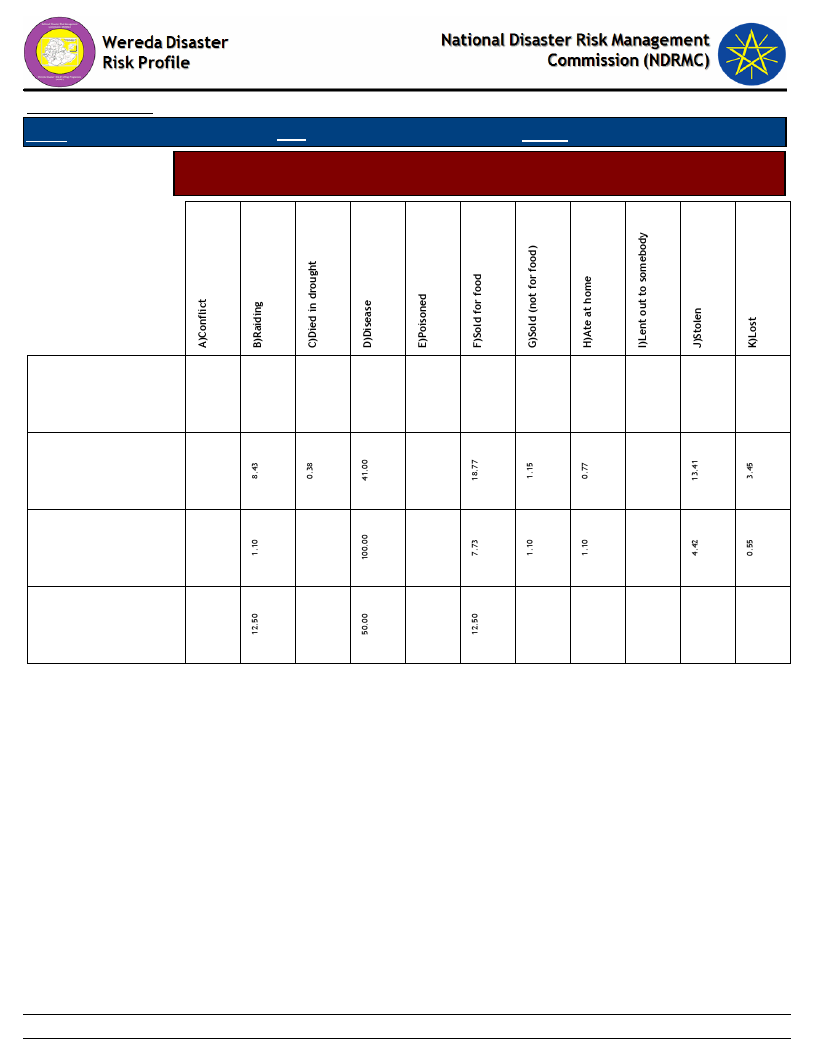
Data_Collected_Date
Region S.N.N.P
Zone BENCH MAJI
Monday, February 25, 2019
Wereda SURIMA
Selected Indicator
Economic Vulnerability: Livestock Ownership and Changes - Households
perception on changes in livestock number in the last five years (response in %)
Donkeys
Goats
Poultry
Sheep
140
Page 3 of 3
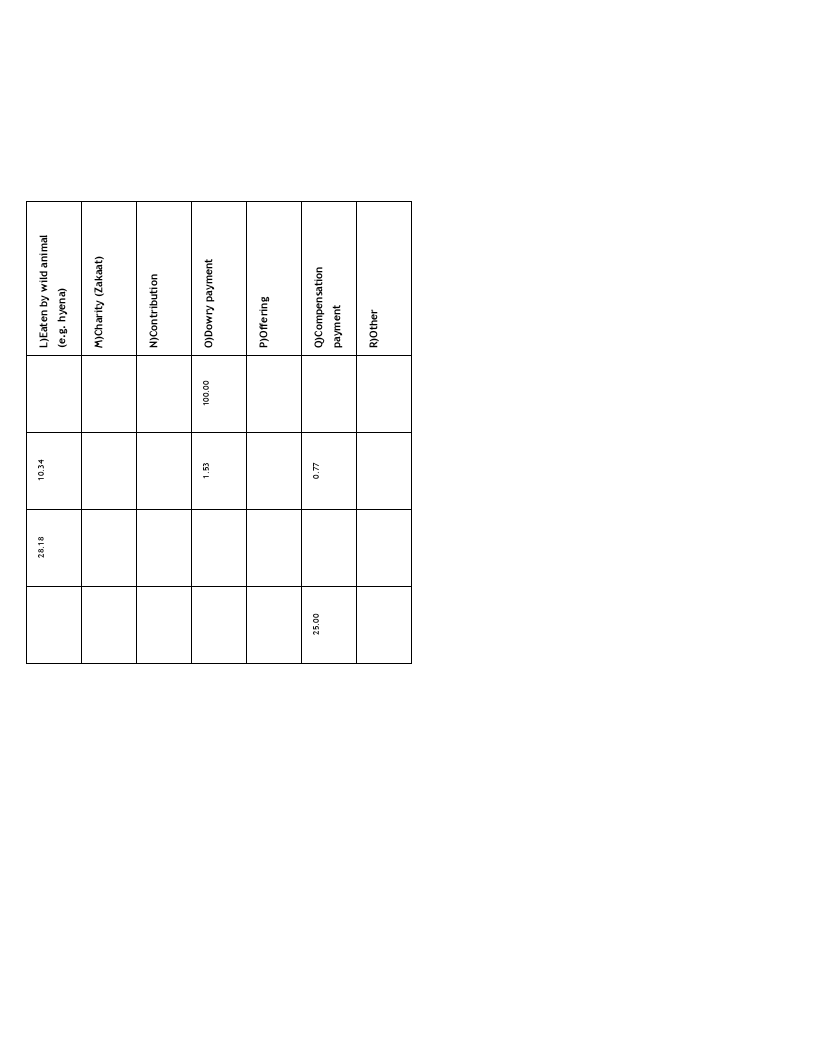
141
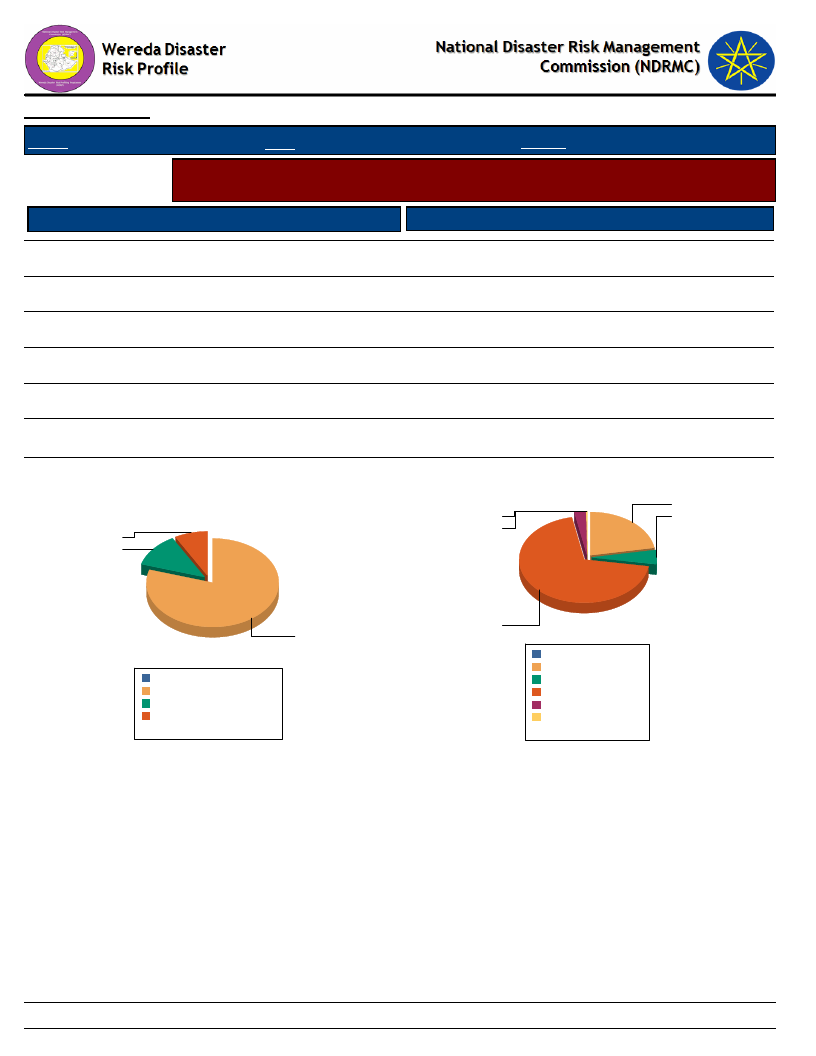
Data_Collected_Date
Region S.N.N.P
Zone BENCH MAJI
Monday, February 25, 2019
Wereda SURIMA
Selected Indicator
Access to Pasture
Agriculture (Livestock): Pasture Availability - Households perception on access
and quality of pasture
Response Percent
Quality of Pasture
Response Percent
Occasionally
79.79
B - Good
22.08
Seldom available
8.03
C - Adequate
5.19
D - Poor
68.83
E - Very poor
2.86
F - DK
0.26
Regularly available
12.18
Household responses to Access to Pasture for
Livestock
8.0
12.2
Household responses to Quality of Pasture
22.1
0.3
5.2
2.9
79.8
Occasionally
R egularly av ailable
Seldom av ailable
0.0%
79.8%
12.2%
8.0%
Total:
100.0%
68.8
B - Good
C - Adequate
D - Poor
E - Very poor
F - DK
0.0%
22.3%
5.2%
69.4%
2.9%
0.3%
Total:
100.0%
142
Page 1 of 1
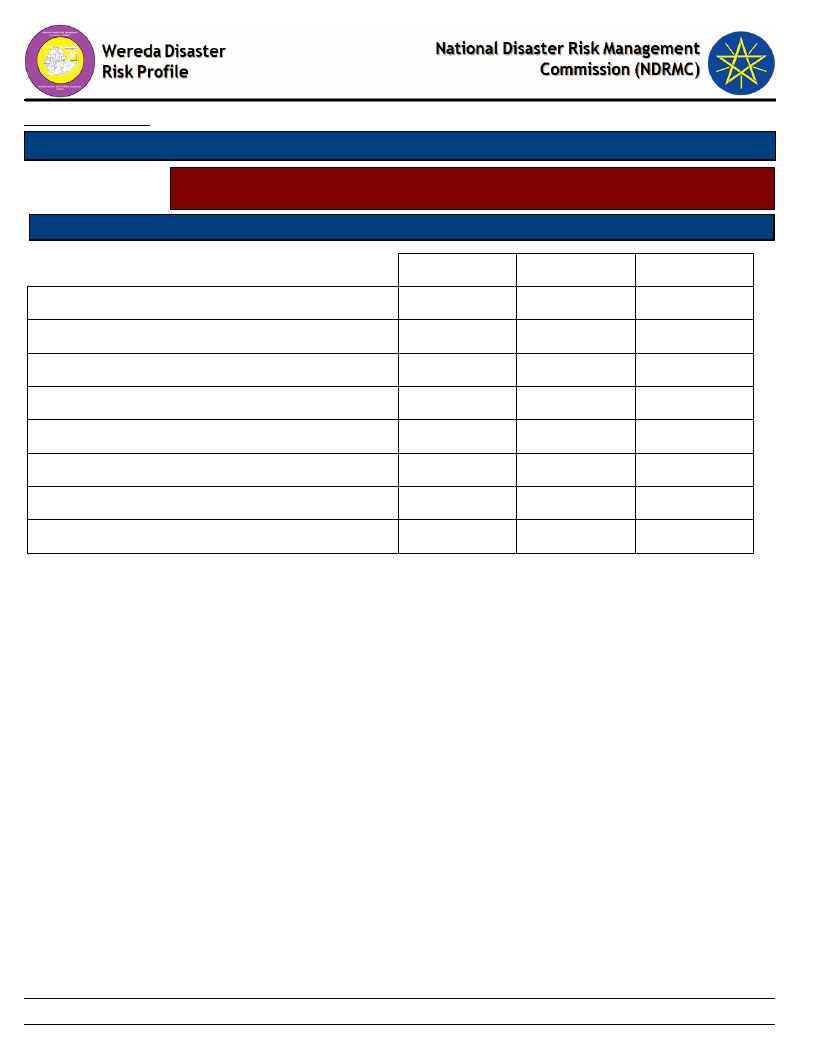
Data_Collected_Date
Region S.N.N.P
Zone BENCH MAJI
Monday, February 25, 2019
Wereda SURIMA
Selected Indicator
Agriculture (Livestock): Pasture Availability - Households perception on
problematic months for pasture availability
Problematic Months
Order of Severity
B - Oct (Tikimt)
C - Nov (Hidar)
D - Dec (Tahsas)
E - Jan (Tir)
F - Feb (Yekatit)
G - Mar (Megabit)
H - Apr (Meazea)
I - May (Ginbot)
1st
1.04
3.37
32.90
46.63
13.21
2.85
2nd
5.18
4.66
31.09
45.85
10.36
2.85
3rd
0.26
0.52
4.68
34.55
47.79
9.87
2.34
143
Page 1 of 1
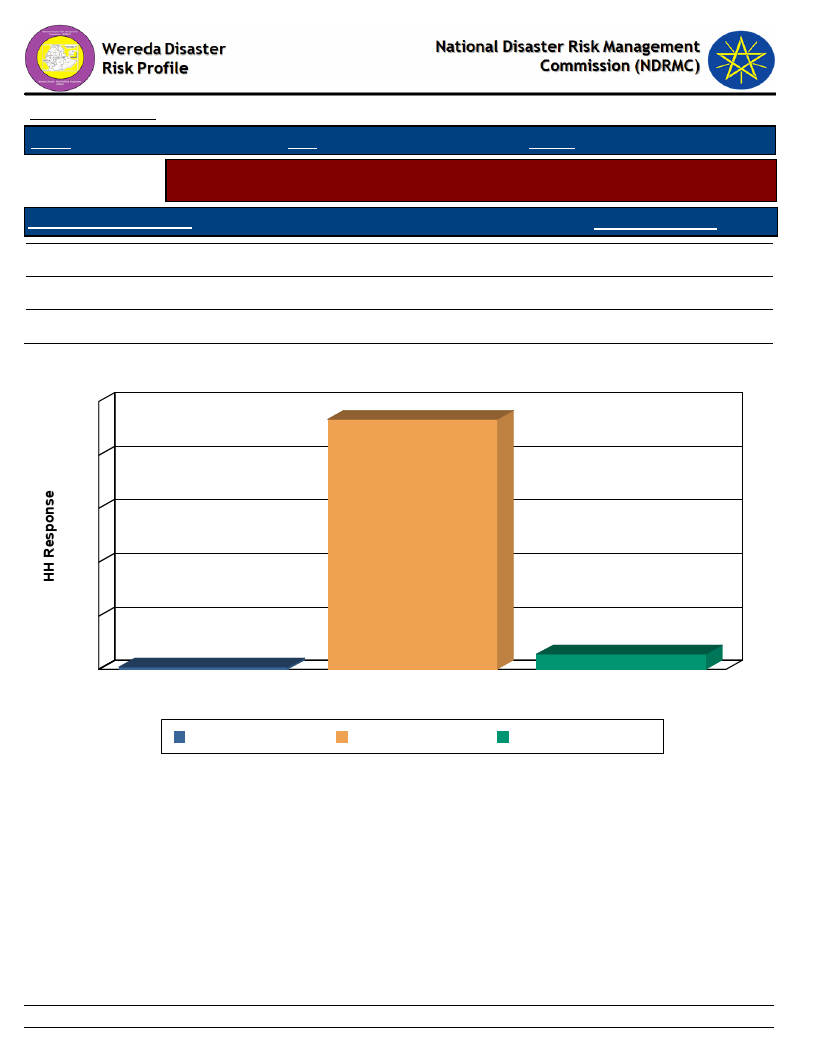
Data_Collected_Date
Region S.N.N.P
Zone BENCH MAJI
Monday, February 25, 2019
Wereda SURIMA
Selected Indicator
Agriculture (Livestock): Water Availability - Households response on water
availability for livestock
Access to Water - Livestock
Household Response
A - Regularly available
B - Occasionally
C - Seldom available
0.78
93.49
5.73
Household Access to Water for Livestock
100
93
80
60
40
20
1
0
A - Regularly available
B - Occasionally
Access to Water - Livestock
6
C - Seldom available
A - Regularly available B - Occasionally
C - Seldom available
144
Page 1 of 1
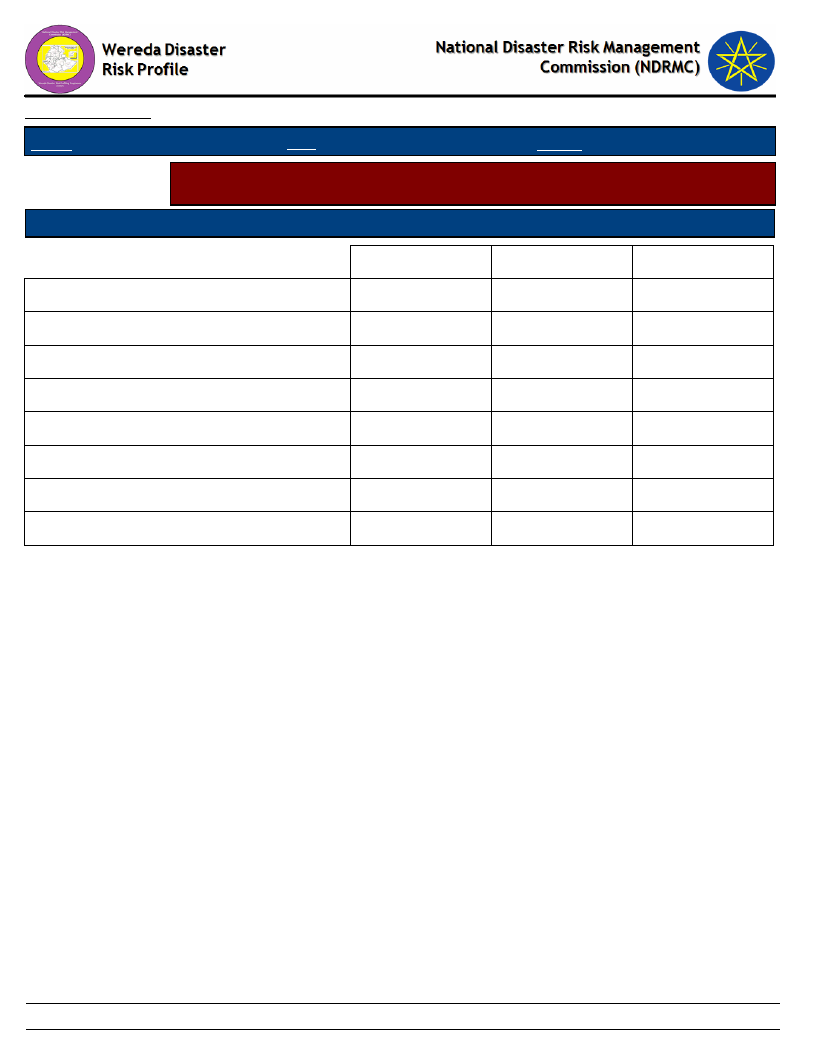
Data_Collected_Date
Region S.N.N.P
Zone BENCH MAJI
Monday, February 25, 2019
Wereda SURIMA
Selected Indicator
Agriculture (Livestock): Water Availability - Households perception on
problematic months for water availability for Livestock
Problematic Months
Order of Severity
B - Oct (Tikimt)
C - Nov (Hidar)
D - Dec (Tahsas)
E - Jan (Tir)
F - Feb (Yekatit)
G - Mar (Megabit)
H - Apr (Meazea)
I - May (Ginbot)
1st
0.52
2.59
23.06
39.38
29.02
5.44
2nd
0.26
3.64
29.61
38.70
22.86
4.94
3rd
0.26
0.52
5.47
24.74
44.01
21.09
3.91
145
Page 1 of 1
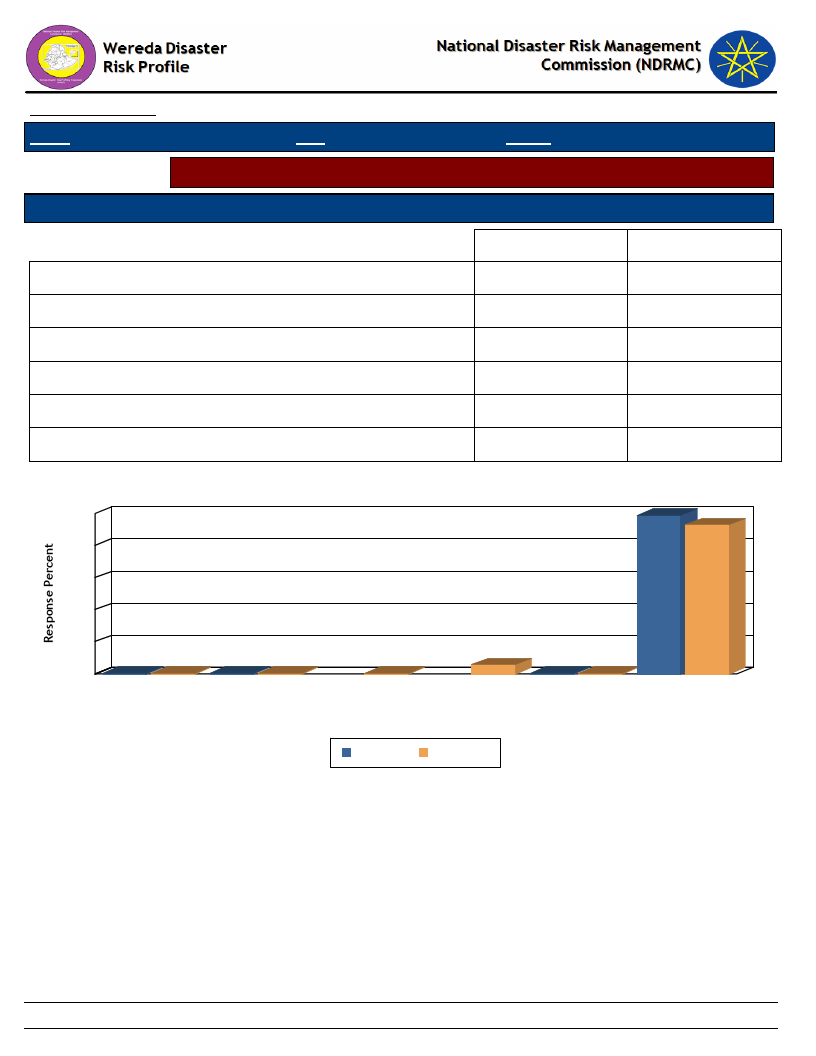
Data_Collected_Date
Region S.N.N.P
Zone BENCH MAJI
Monday, February 25, 2019
Wereda SURIMA
Selected Indicator
Sources of water for livestock (households response in %)
Type of Livestock Owned
Changes Observed By Households
Communal tap (Bono)
Open/Deep well
Piped water outside the house
Pond or lake (open access)
Rainwater harvesting
River, stream
Dry Season
0.52
0.26
0.52
98.70
Wet Season
0.52
0.26
0.26
5.71
0.26
92.99
Household Responses to Type of Water Source and Season for Livestock
99
100
93
80
60
40
20
1
1
0
Com m unal tap (Bono)
0
0
Open/Deep w ell
6
0
Piped w ater outside
the house
Pond or lake (open
access)
Type of Water Source & Season
1
0
Rainw ater har v esting
D ry Season
W et Season
Riv er , str eam
146
Page 1 of 1
WDRP Indicators
Access to Market and Credit
147
Wereda Disaster
Risk Profile
Data_Collected_Date
National Disaster Risk Management
Commission (NDRMC)
Monday, February 25, 2019
Region S.N.N.P
Zone BENCH MAJI
Wereda SURIMA
Selected Indictor:
KebeleName
KURUMA
Economic Vulnerability: Proportion of Produce Sold and Market - Proportion of crops and livestock sold from total
production and markets
Market_For_Crops
Market_For_Livestock_Produce
Percent
Livestock_Sold
Total_% Comments
Sold
Kibish
Kibish,Kuka
28
30
KOTLA KORA
MAJA
DUKU
Koka
Koka
Kibish
Koka and Tume
22
Koka and Dimma wereda
18
Kibish
29
12
Livestock keep is high because of
social value
11
Keeping of animal is high because
used for any social values
32
CHOYE
Kibish
Maji, toom
83
6
MOGA
Kibish
Kibish
12
16
OROROMAY
Kebish
Kebish
19
12
Livestock keep for consumption
REGIYA
TULIGIT
Kibish
Dima, Tom
Koka, Dimma
Dima, Tom
18
11
Livestock keep because of social
value
30
DISHO
Maja or jUM
Maja or jum
28
12
148
Page 1 of 1
Data_Collected_Date
Region S.N.N.P
Selected Indicator
Kebele Name
KURUMA
KOTLA KORA
MAJA
DUKU
CHOYE
MOGA
OROROMAY
REGIYA
TULIGIT
DISHO
KOKA
BORIKA
BOLE BOKT
BANIKA
ANIJO
BEBUSIN
KENIDA
GUME
HARITEGA
Zone BENCH MAJI
Monday, February 25, 2019
Wereda SURIMA
Economic Vulnerability: Kebele Access to Markets - Access to market by Kebele
Market_Access_Comments
Poor accessibility due to road problem
Poor accessibility due to road problem
There conflict between Dizi and sumra for that matter there no access to market
with Maji and Baro
There is no road, there is conflict with Surma and Bume
Poor accessibility due to road problem
It is in accessible
It is in accessible to sell Kebish road access
It is in accessible
There is no linkage
Its in accessible to sell to maji woreda
It is in accessible to sell in Dima
Poor accessibility due to road problem
Poor accessibility due to road problem
Poor accessibility due to road problem
Accessible to sell to KIbish wereda
Poor accessibility due to road problem
It is in access able to sell koka and Dima
Poor accessibility due to road problem
Poor accessibility due to road problem
149
Page 1 of 1
Data_Collected_Date
Region S.N.N.P
Zone BENCH MAJI
Monday, February 25, 2019
Wereda SURIMA
Selected Indicator
Economic Vulnerability: Formal & Informal Transfers - Percentage of
households reporting received formal transfers
Type of Formal Transfer
HH Response F Type of Informal Transfer
HH Response
Food aid
97.41
Food-for-Work project
Cash-for-Work project
Other cash gift
1.04
Faffa
Cash loan (no interest)
5.71
Free cash
0.52 Food or grain gift
21.50
Seeds
86.01 Grain loan (no interest)
7.51
Credit support
21.24 Seed gift
55.18
Livestock
0.52 Seed loan
19.69
Tools
83.68 Free labour
6.22
Distribution of meat to neighbours after a slaughter
1.04
takes place
Cash or kind gift to married daughters when they visit
2.08
parents or relatives
Gift of livestock to newly-weds
1.82
Donation or loan of milking animals to a relative or
0.26
friend
Dowry given to bride’s parents
2.34
Donations of cash or animals to disaster stricken
people
Free use of oxen or plough
23.64
7.25
150
Page 1 of 2
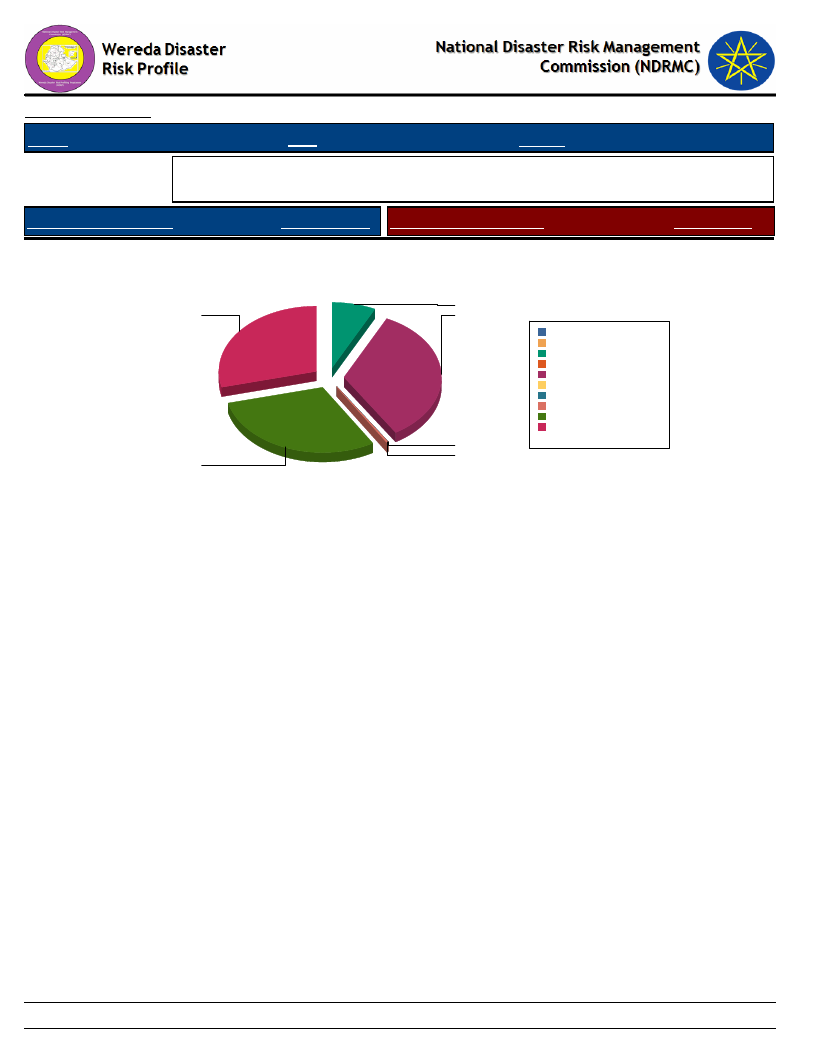
Data_Collected_Date
Region S.N.N.P
Zone BENCH MAJI
Monday, February 25, 2019
Wereda SURIMA
Selected Indicator
Economic Vulnerability: Formal & Informal Transfers - Percentage of
households reporting received formal transfers
Type of Formal Transfer
HH Response F Type of Informal Transfer
HH Response
Type of Formal Transfer Received By Households
21.2
83.7
97.4
0.0%
Cash-for-Work project 0.0%
Credit support
7.3%
Faffa
0.0%
Food aid
33.7%
Food-for-Work project 0.0%
Free cash
0.2%
Livestock
0.2%
Seeds
29.7%
Tools
28.9%
Total:
100.0%
0.5
0.5
86.0
151
Page 2 of 2
Data_Collected_Date
Region S.N.N.P
Zone BENCH MAJI
Monday, February 25, 2019
Wereda SURIMA
Selected Indicator
Capacity: Access to Credit Facilities - Households access to credit facilities
Type of Access To Credit Facilities
Indicator_Value
Households with membership in any credit /micro finance society (%)
Households who borrowed any money in the last one year (%)
Households who tried to borrow 1-2
Households who tried to borrow 3-4
Households who managed to get credit 1-2
Households who managed to get credit 3-4
Households who managed to get credit 5 & Above
Average No. of HHs Tried to get Credit
Average No. HHs Managed to get Credit
43.52
38.60
66.86
33.14
98.78
0.61
0.61
1.23
2.11
152
Page 1 of 1

Data_Collected_Date
Region S.N.N.P
Zone BENCH MAJI
Wereda SURIMA
Monday, February 25, 2019
Selected Indicator
Capacity: Access to Credit Facilities - Percentage of households by major
reasons of borrowing money
Type of Borrowing Reason
Degree of Importance of the Borrowing Reasons - HH Respones
Buy agricultural input
Buy food
Buy or rent land
Others (specify)
Pay for education
Pay for health care
Pay for social event
1st
Important
10.30
83.64
1.82
3.03
1.21
2nd
Important
22.44
9.62
0.64
7.05
0.64
53.21
6.41
3rd
Important
22.68
15.46
1.03
21.65
3.09
5.15
30.93
153
Page 1 of 1
Data_Collected_Date
Monday, February 25, 2019
Region S.N.N.P
Zone BENCH MAJI
Wereda SURIMA
Selected Indicator
Capacity: Access to Credit Facilities - Percentage of households by major
sources of credit
Major Sources of Credit for Households
Degree of Importance of the Credit Source
Bank/formal lending institution
Friends/relatives
Help associations (Edir)
Informal savings group (Ekub)
Local shops / moneylenders
Neighbors
Others (specify)
1st
Important
46.67
37.58
0.61
0.61
1.21
6.67
6.67
2nd
Important
14.66
35.34
1.72
44.83
3.45
3rd
Important
17.02
8.51
1.06
17.02
48.94
7.45
154
Page 1 of 1
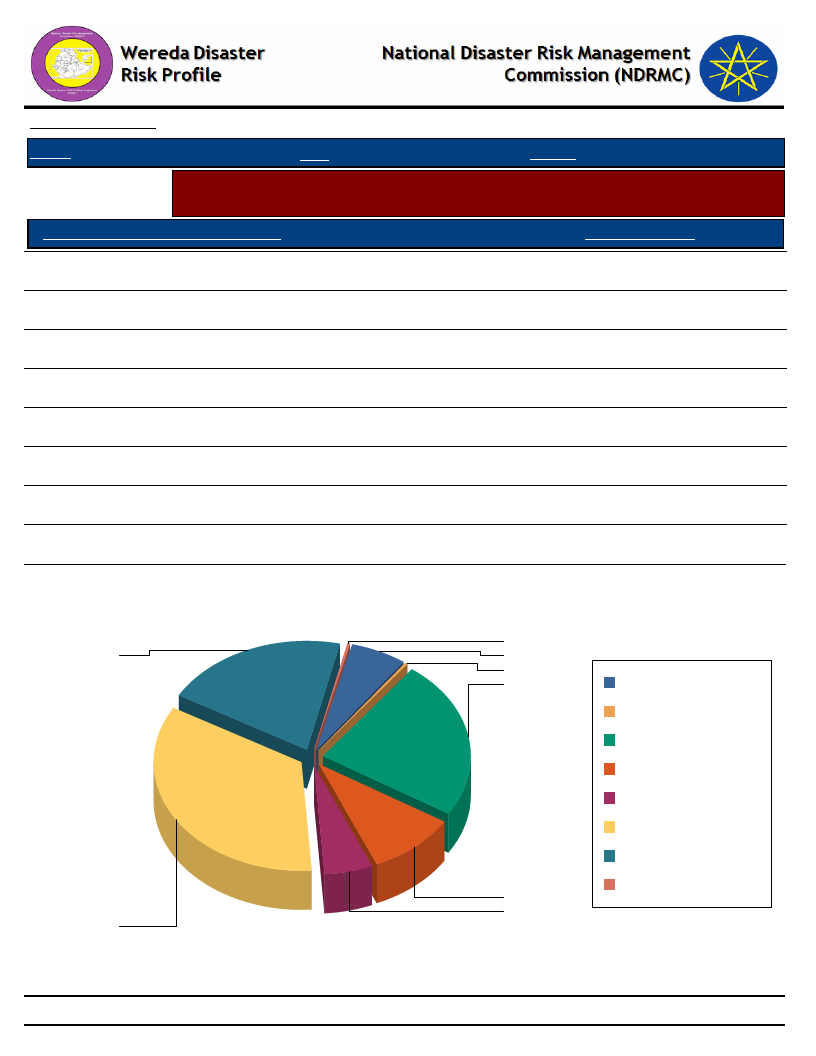
Data_Collected_Date
Monday, February 25, 2019
Region S.N.N.P
Zone BENCH MAJI
Wereda SURIMA
Selected Indicator
Capacity: Access to Credit Facilities - Percent of households with ability to raise
500 birr in one week
HH Ability To Raise 500 Br in One Week
Response_Percent
Yes, we would use our savings
21.67
Yes, by borrowing money
5.56
Yes, with some help from others
0.28
Yes, by selling asset or livestock
36.94
Perhaps, but I doubt it
10.28
No, it would be impossible
25.28
DK
6.67
NA
0.28
Households' Ability To Raise 500 Br in One Week
0
22
7
0
25
DK
NA
No, it would be
impossible
Perhaps, but I doubt it
Yes, by borrowing
money
Yes, by selling asset or
livestock
Yes, we would use our
savings
Yes, with some help
10
from others
6
37
155
Page 1 of 1
WDRP Indicators
Health and Sanitation
Characteristics
156
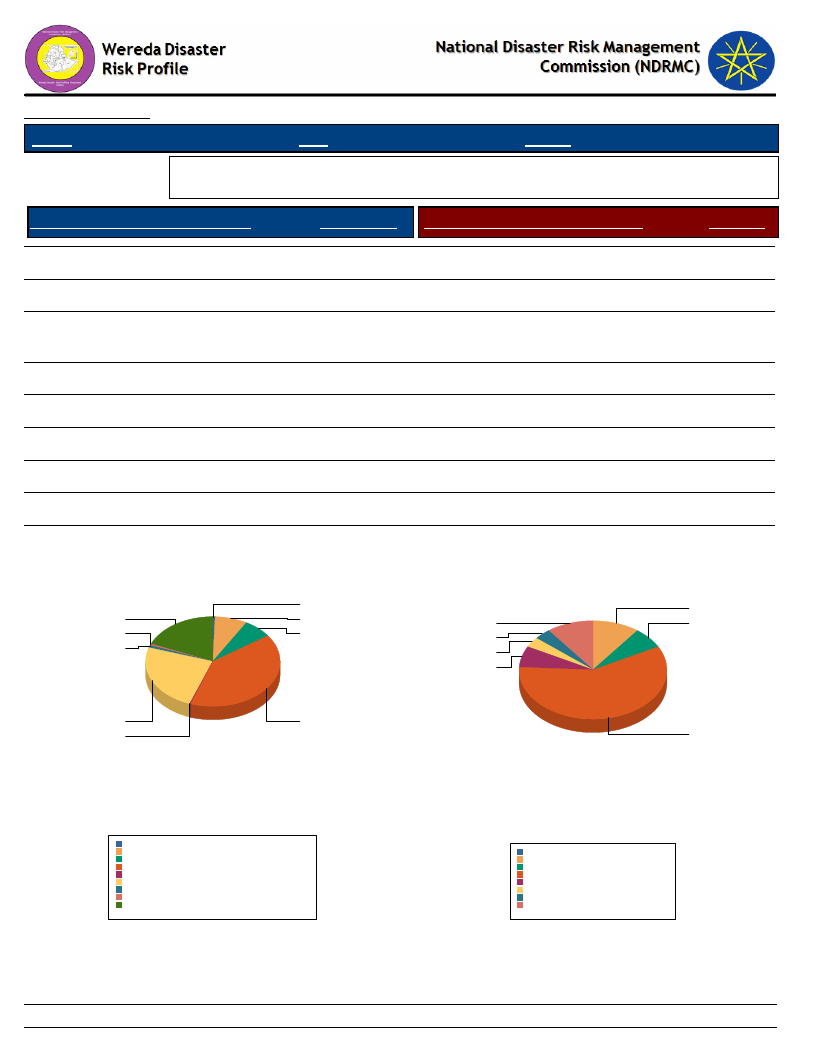
Data_Collected_Date
Region S.N.N.P
Zone BENCH MAJI
Monday, February 25, 2019
Wereda SURIMA
Selected Indicator
Household Access to Health Facilities - Where do patients go for health care?
Constraints to adequate healthcare
Where do Patients Go for Healthcare
HH Response Constraints to Adequate Health Care
Response
Did not get Health Care
Central Hospital
District/Municipal hospital/health
centre/ clinic
Other public
Community health worker
Private hospital/clinic
Other private
Traditional healer
Spiritual healer
6.90
0.43
40.09
24.35
7.97
0.86
0.22
18.53
0.65
No money for treatment costs
No money for travel
Poor quality of service
Religious reasons
Shortage of health professionals
Not aware about any health facility
Health facilities are too distant
58.62
6.90
3.45
3.45
10.34
6.90
10.34
Where Do Patients go for Health care?
0
19
8
1
7
1
Constraints to Adequate Health Care
10
10
7
3
3
7
24
40
0
59
Central Hospital
Community health worker
Did not get Health Care
District/Municipal hospital/health centre/ clinic
Other private
Other public
Private hospital/clinic
Spiritual healer
T raditional healer
T otal:
0.4%
8.0%
6.9%
40.1%
0.2%
24.3%
0.9%
0.7%
18.5%
100.0%
157
Health facilities are too distant
No money for travel
No money for treatment costs
Not aware about any health facility
Poor quality of service
Religious reasons
Shortage of health professionals
T otal:
0.0%
10.3%
6.9%
58.6%
6.9%
3.4%
3.4%
10.3%
100.0%
Page 1 of 1

Data_Collected_Date
Region S.N.N.P
Zone BENCH MAJI
Monday, February 25, 2019
Wereda SURIMA
Selected Indicator
Hazards: Health problems and changes over the last decade
Kebele Name
Health_Problems
Changes_In_Last_Decade
KURUMA
KOTLA KORA
MAJA
DUKU
CHOYE
MOGA
OROROMAY
REGIYA
TULIGIT
DISHO
KOKA
BORIKA
BOLE BOKT
Malaria, hitching ,desert wound, pneumonia Caused By
Lack of eventual protection, personal hygiene,
Skin disease Caused By Lack of personal hygiene, lack of
using mosquito net
Malaria, skin disease, pneumonia Caused By Lack of
environmental protection lack of personal hygiene, no
answer
Malaria, pneumonia, headache, Ameba, Caused By Lack
of awareness, loss of personal and environmental hygiene
Malaria, pneumonia, ichi, flea Caused By Lack of
awareness, lack of person hygiene, lack of environmental
sanitation
Skin disease, malaria Caused By Lack of personal hygiene,
lack of using mosquito net, climate change
Malaria, pneumonia Caused By Lack of environmental
protection, lack of personal hygiene
Malaria, human disease, desert wound, pneumonia Caused
By Lack of environmental sanitation protection, personal
hygiene
Malaria, tuberculosis, pneumonia, itch Caused By
Insufficient and inactive medicine
Malaria, Caused By Lack of awareness
Skin disease, malaria Caused By Lack of personal hygiene,
lack of using mosquito net
Gede, high headache, malaria Caused By Lack of personal
hygiene, unlearned environment, lack of personal
hygiene
Malaria, influenza, parasites Caused By Lack of sanitation,
lack of personal hygiene
Decreased
Increased
decreased the same
increased
Increased
Increased
Increased
Decreased
Decreased
Increased
Increased
Increased
Decreased
Decreased
158
Page 1 of 3

Data_Collected_Date
Region S.N.N.P
Zone BENCH MAJI
Monday, February 25, 2019
Wereda SURIMA
Selected Indicator
Hazards: Health problems and changes over the last decade
Kebele Name
Health_Problems
Changes_In_Last_Decade
BANIKA
ANIJO
BEBUSIN
KENIDA
GUME
HARITEGA
KOKA
BORIKA
BOLE BOKT
BANIKA
ANIJO
BEBUSIN
KENIDA
GUME
Skin disease, malaria Caused By Lack of personal hygiene,
lack of using pesticide
Malaria, elephantiasis, amoeba, high headache Caused By
Insufficient supply of human medicine, poor health
services
Malaria, gede, shisha, koyakoy Caused By Lack of
awareness, lack of personal hygiene
Malaria, skin disease, pneumonia Caused By Lack of
environmental protection, lack of personal hygiene
Malaria, hitching Caused By Un clean environment, lack
of personal hygiene
Malaria Caused By Lack of awareness, loss of personal
hygiene
Skin disease, malaria Caused By Lack of personal hygiene,
lack of using mosquito net
High headache, malaria Caused By Lack of personal
hygiene, unlearned environment, lack of personal
hygiene
Malaria, influenza, parasites Caused By Lack of sanitation,
lack of personal hygiene
Skin disease, malaria Caused By Lack of personal hygiene,
lack of using pesticide
Malaria, elephantiasis, amoeba, high headache Caused By
Insufficient supply of human medicine, poor health
services
Malaria, gede, shisha, koyakoy Caused By Lack of
awareness, lack of personal hygiene
Malaria, skin disease, pneumonia Caused By Lack of
environmental protection, lack of personal hygiene
Malaria, hitching Caused By Un clean environment, lack
of personal hygiene
159
Increased
Increased all human
disease
Increased
Increased
Increased
Increased
Increased
Decreased
Decreased
Increased
Increased all human
disease
Increased
Increased
Increased, depends on rain
fall
Page 2 of 3
Data_Collected_Date
Region S.N.N.P
Zone BENCH MAJI
Monday, February 25, 2019
Wereda SURIMA
Selected Indicator
Hazards: Health problems and changes over the last decade
Kebele Name
Health_Problems
Changes_In_Last_Decade
HARITEGA
DISHO
Malaria Caused By Lack of awareness, loss of personal
hygiene
Malaria, Caused By Lack of awareness
Increased
Increased
160
Page 3 of 3
Wereda Disaster
Risk Profile
National Disaster Risk Management
Commission (NDRMC)
Data_Collected_Date
Monday, February 25, 2019
Region S.N.N.P
Zone BENCH MAJI
Wereda SURIMA
Selected Indicator
Household Health Status - Households health condition and major health problems
Health Condition
HH Response Population Sickness
HH Response Children Sickness
HH Response
Good health
Ill for <3 months
Ill for more than three months
74.25
24.64
1.11
Chronic fever
Malaria
Diarrhea
Others
Headache
Meningitis
Pneumonia/ lung problem
Eye problems
Back ache
HIV/AIDS
10.73
71.24
8.58
0.21
6.65
0.21
0.21
1.29
0.43
0.43
Chronic fever
Malaria
Diarrhea
Headache
HIV/AIDS
15.22
63.04
8.70
10.87
2.17
161
Page 1 of 2
Wereda Disaster
Risk Profile
National Disaster Risk Management
Commission (NDRMC)
Data_Collected_Date
Monday, February 25, 2019
Region S.N.N.P
Zone BENCH MAJI
Wereda SURIMA
Selected Indicator
Household Health Status - Households health condition and major health problems
Health Condition
HH Response Population Sickness
HH Response Children Sickness
HH Response
Health Condition of the Community
1.1
24.6
74.3
0.0%
Good health
74.3%
Ill for <3 months
24.6%
Ill for more than three months 1.1%
Total:
100.0%
80
70
60
50
40
30
20
11
10
0
0
Back ache
Chronic fever
Population Sickness in the Community
71
9
Diarrhea
1
Eye problems
7
0
Headache
HIV/AIDS
Population Sickness
Malaria
0
Meningitis
0
Others
0
Pneumonia/ lung
problem
Ch ild r e n Sick n e ss in th e Co m m u n ity
70
63
60
50
40
30
20
15
11
10
9
2
0
Chronic fever
Diarrhea
Headache
HIV/AIDS
Malaria
Children Sickness
Back ache
Chronic fever
Diarrhea
Eye problems
Headache
HIV/AIDS
Malaria
Meningitis
Others
Pneumonia/ lung
problem
Chronic fever
Diarrhea
Headache
HIV/AIDS
Malaria
162
Page 2 of 2
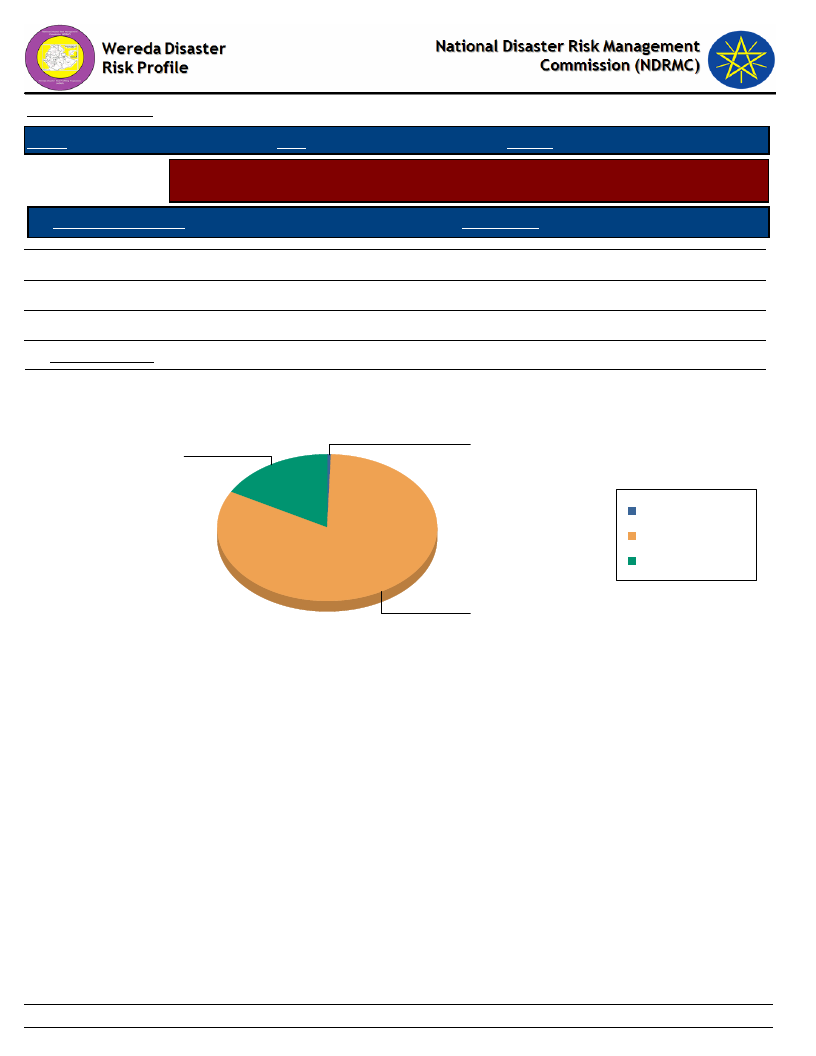
Data_Collected_Date
Monday, February 25, 2019
Region S.N.N.P
Zone BENCH MAJI
Wereda SURIMA
Selected Indicator
Household Access to Sanitation - Percentage of households with access to
different kind of toilet facilities
Type of Toilet Facility
HH Response
Modern water closet
Outdoors latrine/hole on plot
No facilities/Open Space
HH Sharing Toilet
0.52
16.93
82.55
0.52
Household Responses to the type of toilet facilities in the community
0.5
16.9
Modern water closet
N o f acilities/Open
Space
Outdoors latrine/hole on
plot
82.5
163
Page 1 of 1
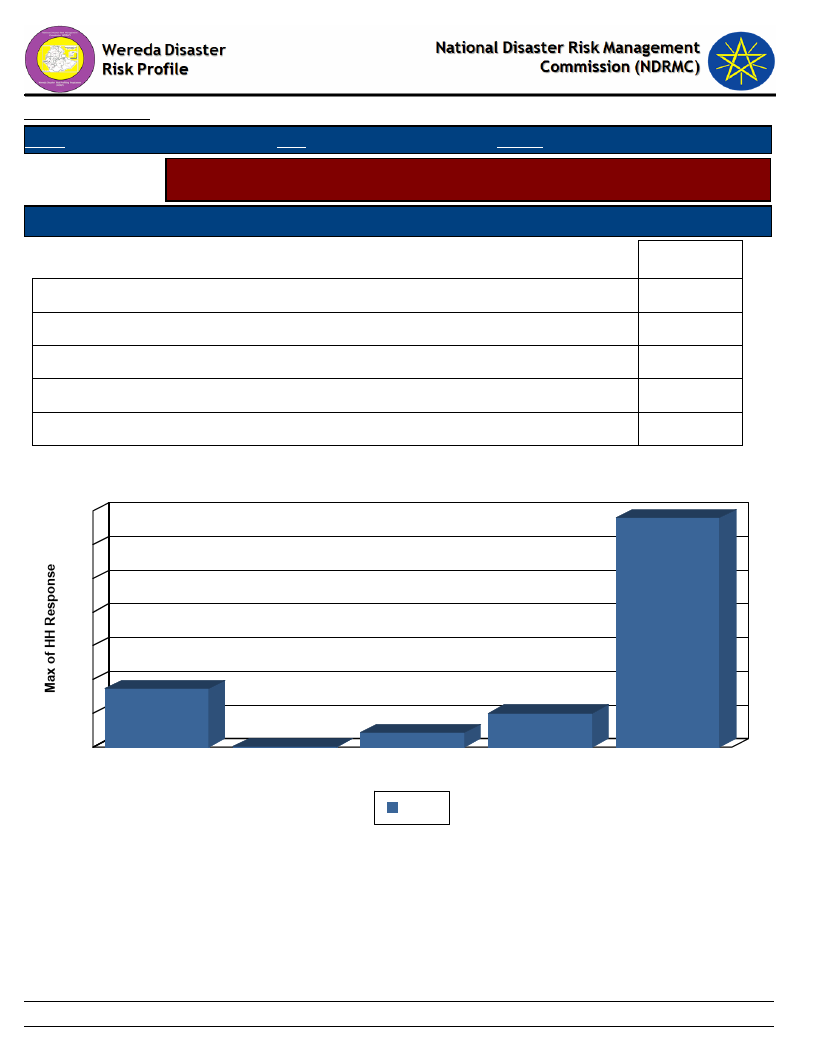
Data_Collected_Date
Region S.N.N.P
Zone BENCH MAJI
Monday, February 25, 2019
Wereda SURIMA
Selected Indicator
Household Access to Drinking Water - Sources of drinking water for
households (response in %)
Sources of drinking water for Households
Priority of the Water Source
Main
Communal tap (Bono)
Covered well or borehole
Piped water outside the house
Pond or lake (open access)
River, stream
17.36
0.26
4.40
10.10
67.88
Source of Drinking Water & Type of Source
70
68
60
50
40
30
20
17
10
0
Communal tap
(Bono)
0
Covered well or
borehole
10
4
Piped water outside Pond or lake (open
the house
acces s )
Main
River, stream
164
Page 1 of 1
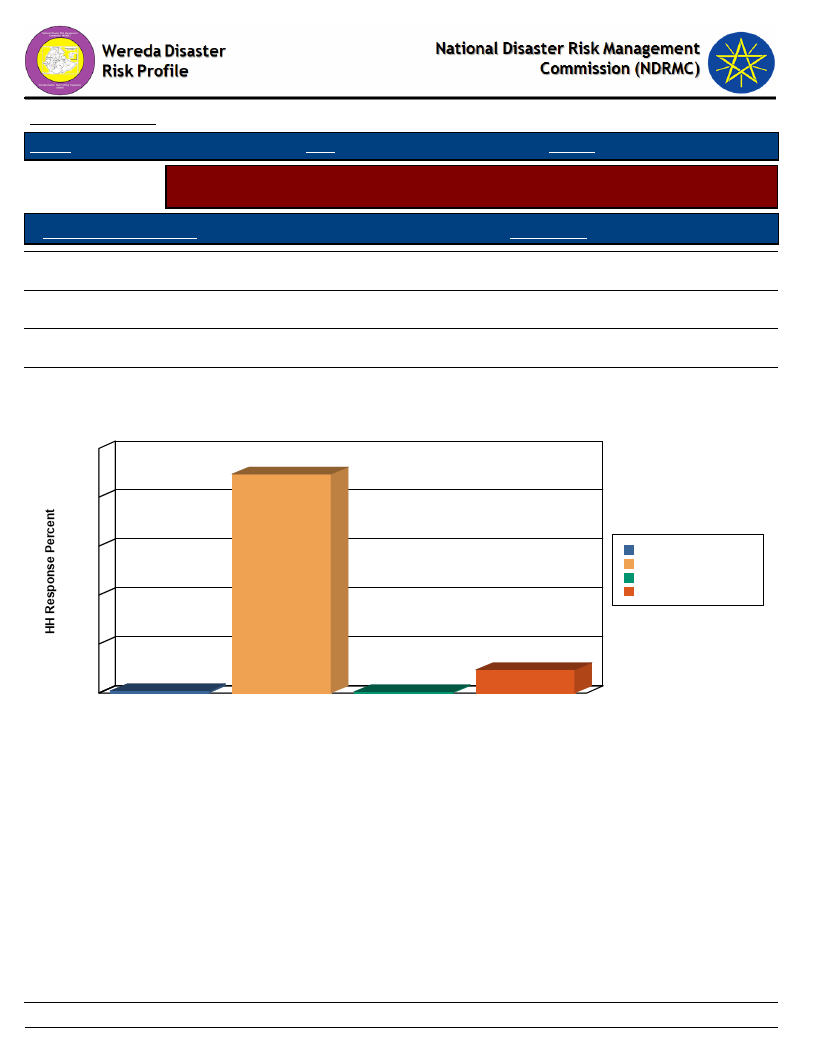
Data_Collected_Date
Region S.N.N.P
Zone BENCH MAJI
Monday, February 25, 2019
Wereda SURIMA
Selected Indicator
Household Access to Drinking Water - Households methods of treating drinking
water
Method of Treating Water
HH Response
Boil
0.78
Other chemicals
0.52
Other Method (specify)
None
9.33
89.38
Method of Treating Water by Households
100
89
80
60
Boi l
None
Other chemicals
40
Other Method (specify)
20
1
0
Boi l
1
None
Other chemicals
Water Treatment Method
9
Other Method (specify)
165
Page 1 of 1
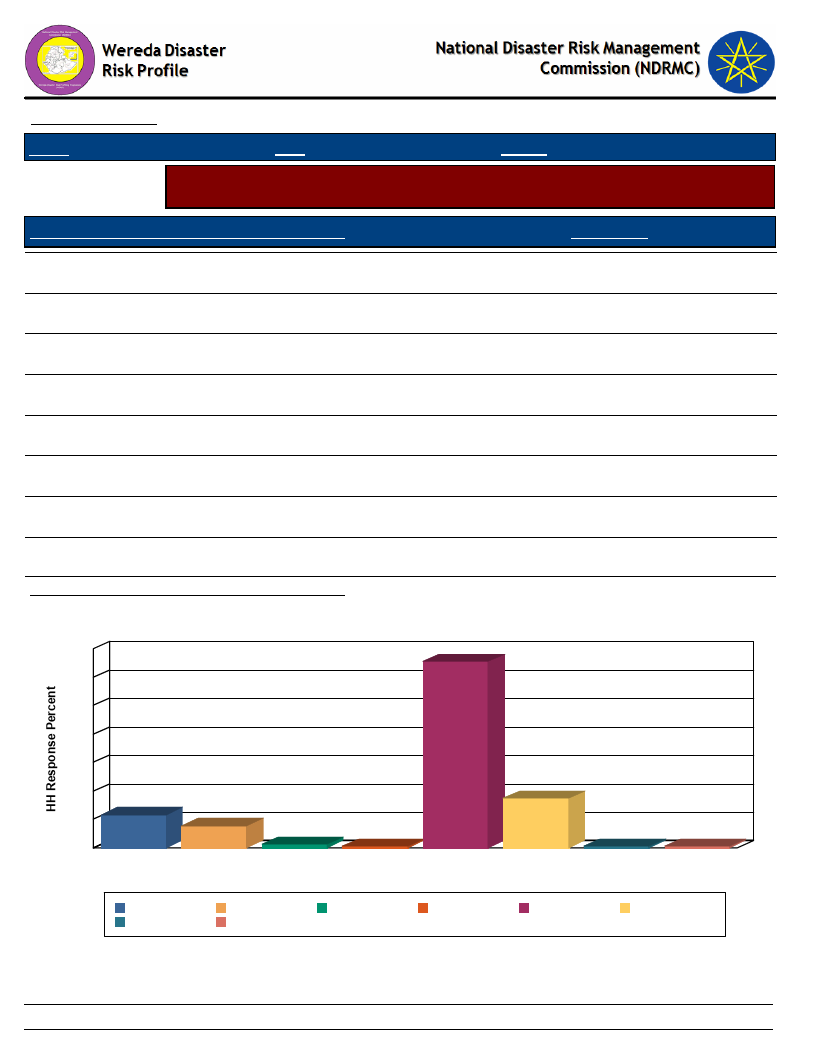
Data_Collected_Date
Region S.N.N.P
Zone BENCH MAJI
Monday, February 25, 2019
Wereda SURIMA
Selected Indicator
Household Access to Drinking Water - Number of times households fetch water
in a week
Number of Times Households Fetch Water in a Week
HH Response
Once
0.26
Twice
0.26
Three times
0.26
Four times
0.52
Five times
3.11
Six times
6.99
Seven times
26.17
Eight and more
4.66
Average Number of Times HH Fetch Water Per Week
13.65
Number of Times HH Fetch Water in a Week
28
26
24
20
16
12
8
5
4
0
Eight and
m ore
3
Five times
7
1
0
Four times
Once
Seven times
Six times
Number of Times HH Fetch Water in a Week
0
Three times
0
T wi ce
Eight and more
Three times
Five times
T wi ce
Four times
Once
Seven times
Six times
166
Page 1 of 1
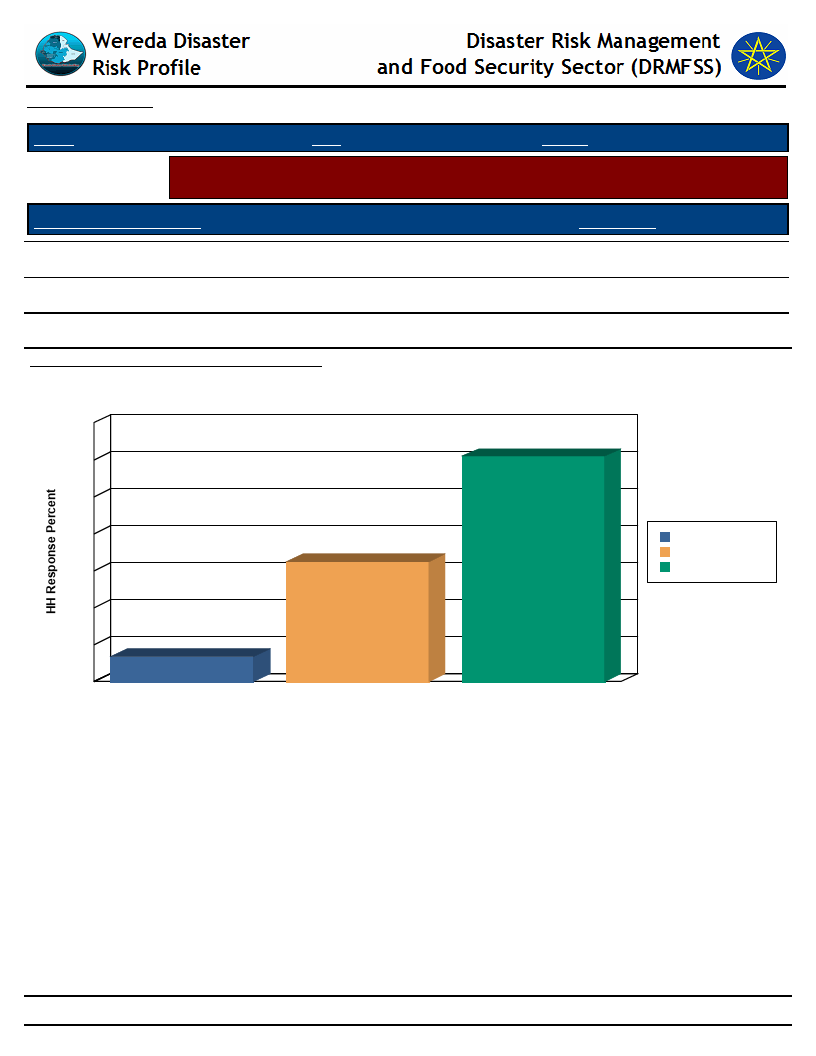
Data_Collected_Date
Monday, February 25, 2019
Region S.N.N.P
Zone BENCH MAJI
Wereda SURIMA
Selected Indicator
Household Access to Drinking Water - Time taken per day to fetch water for
households
Time Taken To Fetch Water
HH Response
Less than 30 min
60.88
30 min - 1 hr
32.38
1 hr and Above
Average Number of Times Taken To Fetch Water
Time Taken To Fetch Water for the HH
70
61
60
6.74
33.40
50
40
32
30
1 hr and Above
30 min - 1 hr
Less than 30 min
20
10
7
0
1 hr and Above
30 min - 1 hr
Less than 30 min
Time Taken To Fetch Water
167
Page 1 of 1
WDRP Indicators
Coping Mechanisms and
Preparedness
168

Wereda Disaster Risk
Profile
Data_Collected_Date
Region S.N.N.P
Zone BENCH MAJI
National Disaster Risk Management
Commission (NDRMC)
Monday, February 25, 2019
Wereda SURIMA
Selected Indicator
KebeleName
Capacity: Community Preparedness against Sudden Onset Disasters
Precaution_1
Comment_1
Precaution_2
Comment_2
Precaution_3
Comment_3
KURUMA
KOTLA KORA
MAJA
DUKU
CHOYE
MOGA
Fire preventing by
leaf spraying water
and soil
Informing for health
center
Traditional medicine
Traditional treatment
for Human and
livestock disease
Controlling fire
Leaving the area
At least it controls
Protect from the
death and reduce
impacts
Moderately effective
Less effective
Reduce its costs
To save lives
Vaccination
through traditional
medicine
Consumption of
roots and selling
animal
Livestock disease,
medical and
traditional
treatment
Moderately
effective
Saving the money
to cope the disaster
Mostly effective
OROROMAY
Medical and
traditional treatment
Less effective
REGIYA
Vaccination and
traditional treatment
Effective
TULIGIT
Preventing and
Mostly it is
protecting by water
controlled
and soil for fire
169
Page 1 of 4
Wereda Disaster Risk
Profile
Data_Collected_Date
Region S.N.N.P
Zone BENCH MAJI
National Disaster Risk Management
Commission (NDRMC)
Monday, February 25, 2019
Wereda SURIMA
Selected Indicator
KebeleName
Capacity: Community Preparedness against Sudden Onset Disasters
Precaution_1
Comment_1
Precaution_2
Comment_2
Precaution_3
Comment_3
DISHO
KOKA
BORIKA
Fire preventing by
leaf spraying water
and soil
Collecting wild fruits
Collecting wild foods
Less effective
To survive, to get
food for household
For survival
Traditional
medicine
Moderately
effective
Traditional
treatment for
human disease
Reduce human
costs
BOLE BOKT
BANIKA
ANIJO
BEBUSIN
KENIDA
Eating wild foods and
selling livestock
Eating wild foods
Displacement and
migration
To survive and
reserve, saving of
money to cope the
disaster
To survive, to get
food for household
To save lives and
livelihoods
Eating roots, selling
animal and wood
Eating roots
To survive and
reserve saving of
money to cope the
disaster
To get food for the
household
Selling of charcoal,
fire wood
To generate income
and avoid food
shortage
170
Page 2 of 4

Wereda Disaster Risk
Profile
Data_Collected_Date
Region S.N.N.P
Zone BENCH MAJI
Selected Indicator
Capacity: Community Preparedness against Sudden Onset Disasters
KebeleName
GUME
HARITEGA
KOKA
BORIKA
BOLE BOKT
BANIKA
ANIJO
BEBUSIN
Precaution_1
Eating roots, selling
of animal and wood
Eating roots selling
of animal and wood
Human disease-
informing to health
center
Fire - by cleaning any
grasses
Fire - prevention by
spraying water and
soil
Crop disease -
smoking local
indigenous plant
Conflict - cover
attacking
Traditional medicine
Comment_1
To survive and
reserve, saving of
money, to cope the
disaster
To survive and
rescue, saving of
money to cope the
disaster
Protect from the
death
Precaution_2
To control forest
fire
At least it
controlled, mostly it
is controlled
To minimize the
damage of plant
To save our cattle
Animal disease-
vaccination,
traditional
medication
Animal disease-
traditional
medicine
Human disease -
informing health
center
Less effective
171
National Disaster Risk Management
Commission (NDRMC)
Monday, February 25, 2019
Wereda SURIMA
Comment_2
Precaution_3
Comment_3
Highly effective
Moderately
effective
To protect from the
death
Page 3 of 4

Wereda Disaster Risk
Profile
Data_Collected_Date
Region S.N.N.P
Zone BENCH MAJI
Selected Indicator
KebeleName
Capacity: Community Preparedness against Sudden Onset Disasters
Precaution_1
Comment_1
Precaution_2
KENIDA
GUME
HARITEGA
Eating roots, selling
animals
Fire by traditional
way of management
BY leaf and soil
Traditional medicine
To service and
secure
At least it control
the adverse effect
of the disaster
To reduce damage
Animal disease,
traditional
medicine
Vaccination,
traditional
medicine
Tradition
medication
National Disaster Risk Management
Commission (NDRMC)
Monday, February 25, 2019
Wereda SURIMA
Comment_2
To save livestocks
Precaution_3
Comment_3
To save livestock's
To reduce damage
172
Page 4 of 4

Wereda Disaster
Risk Profile
Data_Collected_Date
Region S.N.N.P
Zone BENCH MAJI
National Disaster Risk Management
Commission (NDRMC)
Monday, February 25, 2019
Wereda SURIMA
Selected Indicator
Capacity: Community Preparedness against Increase in Disaster Intensity
KebeleName
Precaution_1
Comment_1
Precaution_2
Comment_2
Precaution_3
Comment_3
KURUMA
KOTLA KORA
MAJA
DUKU
CHOYE
MOGA
OROROMAY
REGIYA
TULIGIT
Eating root and
selling of animals
Use irrigation
Eating root and
selling wood
Eating root and
selling livestock
Eating root and
selling of animals
Mediation of
conflicts
To survive and
rescue, saving of
money to cope the
disaster
Diverting small
scale canal
To generate income
Irrigation
Use irrigation
To survive and cope
the disaster
Survive and secure
Irrigation
By diverting small
scale canal
To reduce drought
impact
To produce food
To survive in life
Eating wild fruit and
roots
To survive
Using tree fruit
and selling
livestock
Using root, tree
fruits, selling
livestock and wood
Mining
To save lives and
livelihoods
T generate income
and save lives
To avoid shortage of
food
Irrigation
development
Practicing extensive
farming
To ensure food
security
To avoid food
shortage
sell charcoal
and wood
Traditional
treatment
To survive
To service and
reduce human
death
173
Page 1 of 3

Wereda Disaster
Risk Profile
Data_Collected_Date
Region S.N.N.P
Zone BENCH MAJI
National Disaster Risk Management
Commission (NDRMC)
Monday, February 25, 2019
Wereda SURIMA
Selected Indicator
Capacity: Community Preparedness against Increase in Disaster Intensity
KebeleName
Precaution_1
Comment_1
Precaution_2
Comment_2
Precaution_3
Comment_3
DISHO
KOKA
BORIKA
BOLE BOKT
BANIKA
ANIJO
BEBUSIN
KENIDA
Eating roots selling
of animal and
wood
Eating wild foods
Eating bawora (
root crop)
Eating roots,
selling of animals
and wood
Eating wild fruit,
eating roots
Gold extraction
To survive and
rescue, saving
money to cope the
disaster
To survive, to get
food for household
For survival
To survive and food
reserve, saving of
money to cope the
disaster
To survive, to get
food for household
To avoid hunger
Eating roots,
selling animal and
wood
Eating roots
To survive and
reserve saving of
money to cope the
disaster
To get food for the
household
Use irrigation
Irrigation
development
Irrigation
development
Use irrigation
Selling of charcoal,
fire wood
Use irrigation
To increase
productivity
To ensure food
security
To secure food
security
To reduce food gaps
To generate income
and avoid food
shortage
To ensure food
security
174
Page 2 of 3

Wereda Disaster
Risk Profile
Data_Collected_Date
Region S.N.N.P
Zone BENCH MAJI
National Disaster Risk Management
Commission (NDRMC)
Monday, February 25, 2019
Wereda SURIMA
Selected Indicator
Capacity: Community Preparedness against Increase in Disaster Intensity
KebeleName
Precaution_1
Comment_1
Precaution_2
Comment_2
Precaution_3
Comment_3
GUME
HARITEGA
Eating roots,
selling of animal
and wood
Eating roots selling
of animal and
wood
To survive and
reserve, saving of
money, to cope the
disaster
To survive and
rescue, saving of
money to cope the
disaster
Irrigation
development
To ensure food
security
175
Page 3 of 3

Wereda Disaster
Risk Profile
Data_Collected_Date
Region S.N.N.P
Zone
BENCH MAJI
Selected Indicator
Capacity: Community Preparedness against Disasters
Kebele Name
Precaution 1
Comment 1
Precaution 2
KURUMA
KOTLA KORA
MAJA
CHOYE
MOGA
OROROMAY
REGIYA
Clearing around
home side
Improving
agronomic
practices
Selling of animals,
eating roots
Gold extraction
Traditional
treatment of
Animal disease
Improving
veterinary service
and vaccination
Fire clearing
around home side
To protect the trees of
honey bee lives, to
protect houses fruits
vegetables
To reduce the effects
of crop diseases
Saving the money to
cope the disaster
To earn income in
order to save money
To protect animal
death
To protect the death
of livestock
To protect the trees of
honey bee hives, to
protect house, fruits
and vegetables
Traditional
treatment of
livestock's
Livestock
veterinary
service
Animal
vaccination,
attending animal
health service
Improving
veterinary
service
Mining
Fire, cleaning
around home
Improving
vaccination,
livestock health
service
176
National Disaster Risk Management
Commission (NDRMC)
Monday, February 25, 2019
Wereda SURIMA
Comment 2
To protect the
animals from
death
Precaution 3
Comment 3
To protect
livestock from
the death
To protect
animal from the
death
To protect the
animal from
death
To get food for
there house hold
Selling livestock
and saving money
To survive
properly
To protect
livestock, human
and property
To protect
livestock from
death
Page 1 of 3

Wereda Disaster
Risk Profile
Data_Collected_Date
Region S.N.N.P
Zone
BENCH MAJI
Selected Indicator
Capacity: Community Preparedness against Disasters
Kebele Name
Precaution 1
Comment 1
Precaution 2
TULIGIT
KOKA
BORIKA
BOLE BOKT
BANIKA
ANIJO
KENIDA
Attention health
service for
livestock disease
Improving animal
vaccination
Promoting
purchasing
medicine
Improving Animal
vaccination,
attending animal
health service
Improving animal
vaccination
Improving vet
service
Migration
Protect livestock from
death
To protect animal
from the loss
To protect animals
from disease
To protect animal
from the death
Control fire by
clearing around
home
Conflict / moves
animal to
nearest home
land
Spraying
chemicals and
prepare it
Promoting loans
from the
government
To protect animal
from the death
To protect animal
from death
To protect from death
Always stand by,
patrolling with
weapons
Animal
vaccination,
attending animal
health
National Disaster Risk Management
Commission (NDRMC)
Monday, February 25, 2019
Wereda SURIMA
Comment 2
To protect
livestock, crop
and house
To protect
animal from the
loss
Precaution 3
Comment 3
To protect maize
and sorghum
from disease
To protect
famine
Promoting personal
hygiene
To protect
personal health
To protect cattle
from gunners
To protect
animal from the
disease
177
Page 2 of 3
Wereda Disaster
Risk Profile
Data_Collected_Date
Region S.N.N.P
Zone
BENCH MAJI
Selected Indicator
Capacity: Community Preparedness against Disasters
Kebele Name
Precaution 1
Comment 1
Precaution 2
GUME
Saving money, food
To protect and
prevent the negative
effects of disaster
Animal
vaccination,
attending animal
health service
National Disaster Risk Management
Commission (NDRMC)
Monday, February 25, 2019
Wereda SURIMA
Comment 2
To protect
animal from the
death
Precaution 3
Loan from the
government
Comment 3
To protect famine
178
Page 3 of 3

Wereda Disaster
Risk Profile
Data_Collected_Date
Region S.N.N.P
Zone
BENCH MAJI
Selected Indicator
Kebele Name
Hazard: Coping and recovering during last Disaster
ANIJO
Type of Disaster(s)
Coping_Strategy
Drought
Searching of water and pasture
Description
To save lives and livelihoods
Recovery_Strategy
Reconciliation
Description
Community
Participation_Ways
Description
Minimizing conflict
Coordination and collaboration in communal works
Kebele Name
Type of Disaster(s)
Coping_Strategy
Description
Recovery_Strategy
Description
Community
Participation_Ways
Description
BANIKA
Crop disease
Eating root and wild life
Sustain for a month
Loans for government
Resist crop facility
Sharing and eating different roots
Mostly they are sustain
179
National Disaster Risk Management
Commission (NDRMC)
Monday, February 25, 2019
Wereda SURIMA
Page 1 of 10

Wereda Disaster
Risk Profile
Data_Collected_Date
Region S.N.N.P
Zone
BENCH MAJI
Selected Indicator
Kebele Name
Hazard: Coping and recovering during last Disaster
BEBUSIN
Type of Disaster(s)
Coping_Strategy
Drought
During conflict searching the trace of the Buma and Dizzi
Description
In order to protect our community from theft
Recovery_Strategy
Reconciliation
Description
Community
Participation_Ways
Description
Minimize control
National Disaster Risk Management
Commission (NDRMC)
Monday, February 25, 2019
Wereda SURIMA
Kebele Name
Type of Disaster(s)
Coping_Strategy
Description
Recovery_Strategy
Description
Community
Participation_Ways
Description
BOLE BOKT
Drought
Fire clearing around home, conflict- searching the track of Bume and make alarm and siren for all
To avoid fire blaze, fight with Bume and back then to their homeland ( base)
Loans from the government
We tolerate and resist the drought
Sharing and eating different roots, sharing income
Resist drought the community can cope and with stand the drought mostly.
180
Page 2 of 10

Wereda Disaster
Risk Profile
Data_Collected_Date
Region S.N.N.P
Zone
BENCH MAJI
Selected Indicator
Kebele Name
Hazard: Coping and recovering during last Disaster
BORIKA
Type of Disaster(s)
Coping_Strategy
Drought
Shifting and searching pasture land, clearing flammable materials around trees
Description
For the survival and rescue of animals, escaping beehives from fire blaze
Recovery_Strategy
Selling of woods, charcoal preparation
Description
Community
Participation_Ways
Description
For buying foods
Sharing income
To resist famine
Kebele Name
Type of Disaster(s)
Coping_Strategy
Description
Recovery_Strategy
Description
Community
Participation_Ways
Description
CHOYE
Drought, shortage of food
Eating wild tree fruits, eating Beware
It is important to reduce costs
Loan from government
Sharing different toots
Helping each other
National Disaster Risk Management
Commission (NDRMC)
Monday, February 25, 2019
Wereda SURIMA
181
Page 3 of 10

Wereda Disaster
Risk Profile
Data_Collected_Date
Region S.N.N.P
Zone
BENCH MAJI
Selected Indicator
Kebele Name
Hazard: Coping and recovering during last Disaster
DISHO
Type of Disaster(s)
Coping_Strategy
Drought
Searching the track of Bume and Dize
Description
Fight with Bume and Dize buck then to their home land
Recovery_Strategy
No action
Description
Community
Participation_Ways
Description
National Disaster Risk Management
Commission (NDRMC)
Monday, February 25, 2019
Wereda SURIMA
Kebele Name
Type of Disaster(s)
Coping_Strategy
Description
Recovery_Strategy
Description
Community
Participation_Ways
Description
DUKU
Conflict
Conflict organizing an patrolling the cattle, livestock disease, preparing water to work for animals
To protect our cattle from attack, to access water for livestock
Reconciliation
Minimize
182
Page 4 of 10
Wereda Disaster
Risk Profile
Data_Collected_Date
Region S.N.N.P
Zone
BENCH MAJI
Selected Indicator
Kebele Name
Hazard: Coping and recovering during last Disaster
GUME
Type of Disaster(s)
Coping_Strategy
Drought
Selling of fire woods, hop, charcoal
Description
Buying floor, food, corn
Recovery_Strategy
Loans from the government
Description
Community
Participation_Ways
Description
We tolerant and resist the drought
Sharing and eating different roots, sharing income
Resist drought the community can cope
Kebele Name
Type of Disaster(s)
Coping_Strategy
Description
Recovery_Strategy
Description
Community
Participation_Ways
Description
HARITEGA
Drought
Conflict searching for the track of buma
Fight with bume them to their home land
Reconciliation
Mining conflict
183
National Disaster Risk Management
Commission (NDRMC)
Monday, February 25, 2019
Wereda SURIMA
Page 5 of 10

Wereda Disaster
Risk Profile
Data_Collected_Date
Region S.N.N.P
Zone
BENCH MAJI
Selected Indicator
Kebele Name
Hazard: Coping and recovering during last Disaster
KENIDA
Type of Disaster(s)
Coping_Strategy
Conflict
Eating wild fruit, Eating roots
Description
Sustain for 3 month
Recovery_Strategy
Loans from government
Description
Community
Participation_Ways
Description
We tolerate and resist crop failure
Sharing and eating different roots
Mostly they are sustain
Kebele Name
Type of Disaster(s)
Coping_Strategy
Description
Recovery_Strategy
Description
Community
Participation_Ways
Description
KOKA
Crop disease
Traditional control method
Sustain for 2 month
Loans from the government
To resist crop Failed
Sharing and eating different roots
Mostly they are sustain
184
National Disaster Risk Management
Commission (NDRMC)
Monday, February 25, 2019
Wereda SURIMA
Page 6 of 10

Wereda Disaster
Risk Profile
Data_Collected_Date
Region S.N.N.P
Zone
BENCH MAJI
Selected Indicator
Kebele Name
Hazard: Coping and recovering during last Disaster
KOTLA KORA
Type of Disaster(s)
Coping_Strategy
Crop disease
Crop root, wild fruit and selling mining
Description
Sustain for few months
Recovery_Strategy
Loan from government
Description
Community
Participation_Ways
Description
To resist crop failing
Sharing and eating different roots
Mostly they are sustain
Kebele Name
Type of Disaster(s)
Coping_Strategy
Description
Recovery_Strategy
Description
Community
Participation_Ways
Description
KURUMA
Drought
Eating wild fruit and roots
Effectively staying for 2 month
Loans from government
To tolerate and resist the drought
Sharing and eating different root and sharing income
Resist drought the community can cope and with stand the drought
185
National Disaster Risk Management
Commission (NDRMC)
Monday, February 25, 2019
Wereda SURIMA
Page 7 of 10

Wereda Disaster
Risk Profile
Data_Collected_Date
Region S.N.N.P
Zone
BENCH MAJI
Selected Indicator
Kebele Name
Hazard: Coping and recovering during last Disaster
MAJA
Type of Disaster(s)
Coping_Strategy
Drought and conflict
Eating wild fruit, eating roots
Description
Survive for one march
Recovery_Strategy
Loan from government, going to mining
Description
Community
Participation_Ways
Description
They sustain the drought
Sharing and eating different roofs
Mostly they are sustain
Kebele Name
Type of Disaster(s)
Coping_Strategy
Description
Recovery_Strategy
Description
Community
Participation_Ways
Description
MOGA
Conflict
Beating wild fruit, mining gold
To survive
Loan from government
To survive
Sharing food, eating different roots
Mostly they are service
186
National Disaster Risk Management
Commission (NDRMC)
Monday, February 25, 2019
Wereda SURIMA
Page 8 of 10

Wereda Disaster
Risk Profile
Data_Collected_Date
Region S.N.N.P
Zone
BENCH MAJI
Selected Indicator
Kebele Name
Hazard: Coping and recovering during last Disaster
OROROMAY
Type of Disaster(s)
Coping_Strategy
Conflict, crop disease
Bating wild fruit
Description
Effective
Recovery_Strategy
Loans from government
Description
Community
Participation_Ways
Description
Tolerate and resist the drought
Sharing eating and income
Resist drought, cope and withstand the drought
Kebele Name
Type of Disaster(s)
Coping_Strategy
Description
Recovery_Strategy
Description
Community
Participation_Ways
Description
REGIYA
Drought
Eating roots, eating of wild fruits
Effective
Loans from governments
We tolerate and resist the drought
Sharing different roots, sharing income
Resist drought can cope and withstand the drought mostly
187
National Disaster Risk Management
Commission (NDRMC)
Monday, February 25, 2019
Wereda SURIMA
Page 9 of 10
Wereda Disaster
Risk Profile
Data_Collected_Date
Region S.N.N.P
Zone
BENCH MAJI
Selected Indicator
Kebele Name
Hazard: Coping and recovering during last Disaster
TULIGIT
Type of Disaster(s)
Coping_Strategy
Drought
Collecting wild foods
Description
Effective to save lives and livelihoods
Recovery_Strategy
Applying extensive agricultural practice
Description
Community
Participation_Ways
Description
To stabilizing and security food
Through coordination and collaboration
Even if we lost number of cattle community earn income
National Disaster Risk Management
Commission (NDRMC)
Monday, February 25, 2019
Wereda SURIMA
188
Page 10 of 10

Data_Collected_Date
Region S.N.N.P
Zone BENCH MAJI
Selected Indicator
Capacity: Type Community Participation
Kebele Name
Levels_Comm_Participation
KURUMA
Local cooperation
KOTLA KORA
Good
MAJA
Good
DUKU
Good
CHOYE
Good
MOGA
Good cooperative
OROROMAY
Good
REGIYA
Good
TULIGIT
Good
DISHO
Good
KOKA
Good
BORIKA
Good
BOLE BOKT
Good
BANIKA
Good
ANIJO
Good
BEBUSIN
Good
KENIDA
Dabo
GUME
Good
HARITEGA
Good
Monday, February 25, 2019
Wereda SURIMA
Changes_In_Last_Decade
Increased
Increased
Increased
Increased
Increased
Increased
Increased
Increased
Increased
Increased
Increased
Increased
Increased
Increased
Increased
Increased
Increased
Increased
Increased
189
Page 1 of 1
Data_Collected_Date
Region S.N.N.P
Zone BENCH MAJI
Wereda SURIMA
Monday, February 25, 2019
Selected Indicator
Capacity: Recovery from Losses from Disasters - Percentage of Households
who have managed to recover from losses of disasters
Percentage of households who have managed to recover from losses of disasters
Comments
92.73 %
190
Page 1 of 1
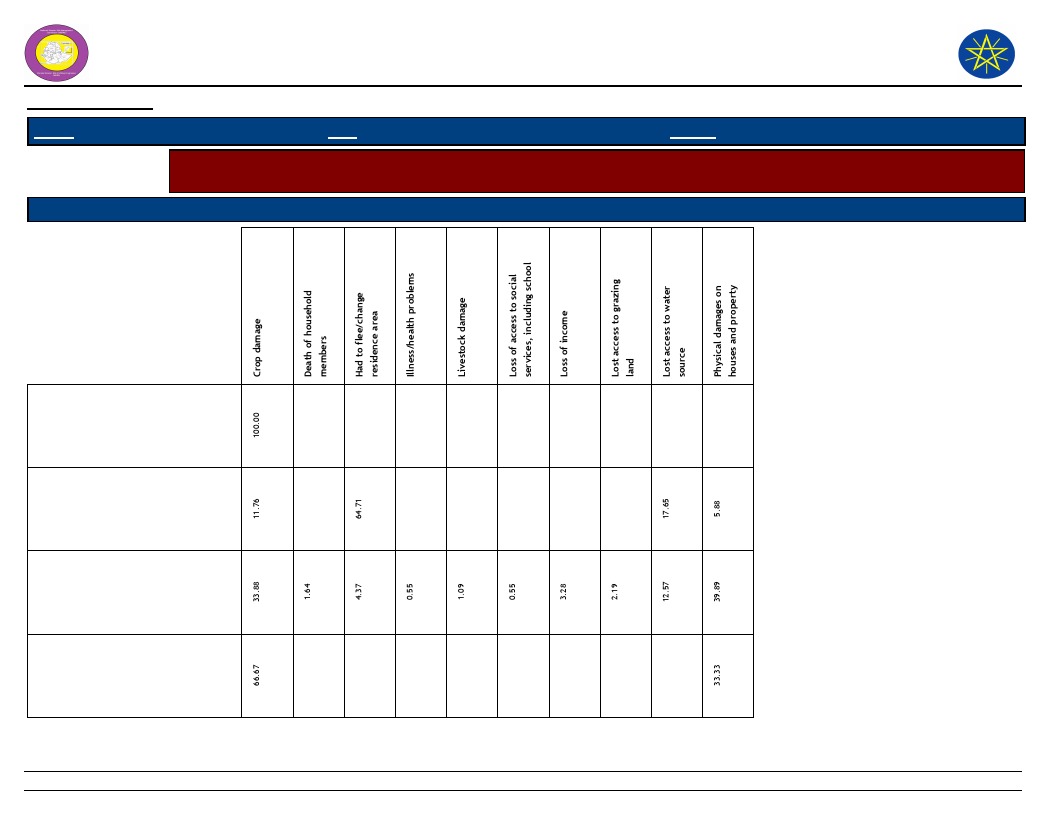
Wereda Disaster
Risk Profile
National Disaster Risk Management
Commission (NDRMC)
Data_Collected_Date
Region S.N.N.P
Zone BENCH MAJI
Wereda SURIMA
Monday, February 25, 2019
Selected Indicator
Capacity: Coping Strategies Adopted by Households - Main coping strategies adopted by households to recover
from respective losses
Type of Coping Strategy Adopted
Type of Loss
Borrowing of food or cash
(including purchasing food on
credit)
Collection of wild food
Consumption rather than sale
of crop surplus
Limit portion size at meals
191
Page 1 of 4

Wereda Disaster
Risk Profile
National Disaster Risk Management
Commission (NDRMC)
Data_Collected_Date
Region S.N.N.P
Zone BENCH MAJI
Wereda SURIMA
Monday, February 25, 2019
Selected Indicator
Capacity: Coping Strategies Adopted by Households - Main coping strategies adopted by households to recover
from respective losses
Type of Coping Strategy Adopted
Type of Loss
Long-term / permanent
migration (including distress
migration of whole families)
Others -
Reduce number of meals eaten
in a day
Reduced expenditure on
non-essential items (beer,
cigarettes, clothes, meat, etc.)
192
Page 2 of 4
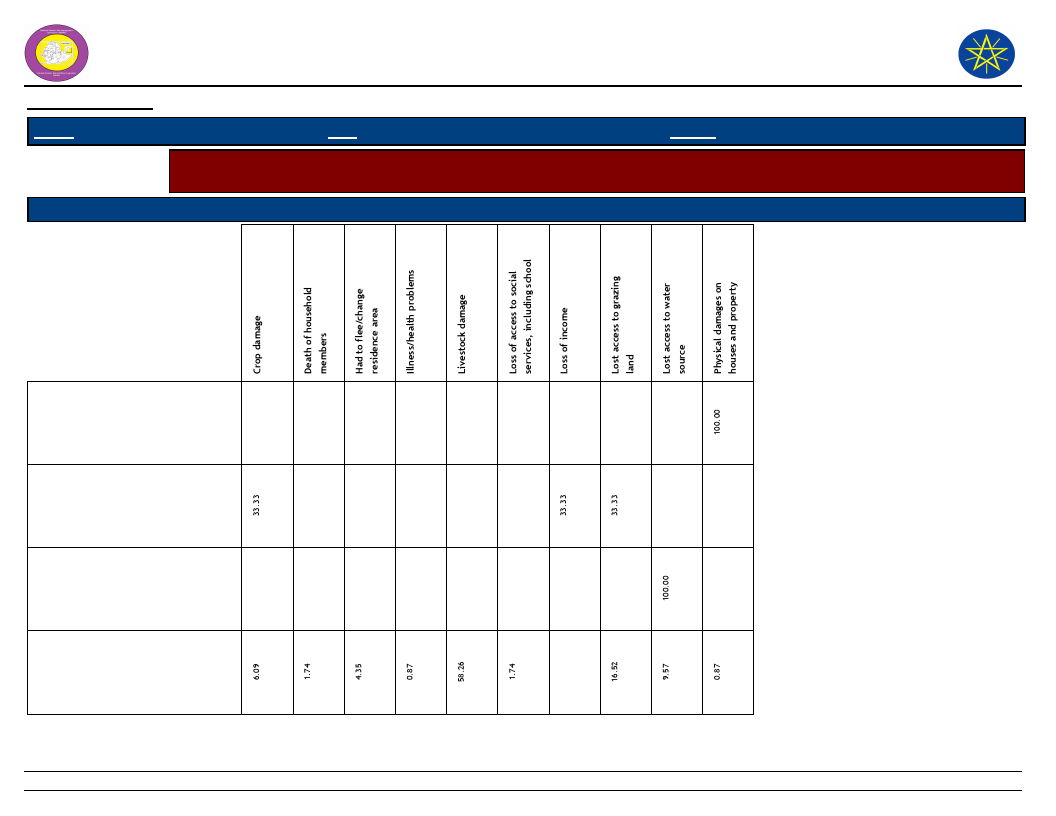
Wereda Disaster
Risk Profile
National Disaster Risk Management
Commission (NDRMC)
Data_Collected_Date
Region S.N.N.P
Zone BENCH MAJI
Wereda SURIMA
Monday, February 25, 2019
Selected Indicator
Capacity: Coping Strategies Adopted by Households - Main coping strategies adopted by households to recover
from respective losses
Type of Coping Strategy Adopted
Type of Loss
Rely on less preferred and less
expensive food
Restrict consumption by adults
in order for small children to
eat
Seek alternative or additional
jobs
Sell more livestock than usual
193
Page 3 of 4

Wereda Disaster
Risk Profile
National Disaster Risk Management
Commission (NDRMC)
Data_Collected_Date
Region S.N.N.P
Zone BENCH MAJI
Wereda SURIMA
Monday, February 25, 2019
Selected Indicator
Capacity: Coping Strategies Adopted by Households - Main coping strategies adopted by households to recover
from respective losses
Type of Coping Strategy Adopted
Type of Loss
Sending children of household
for work
Short-term / seasonal labor
migration
194
Page 4 of 4
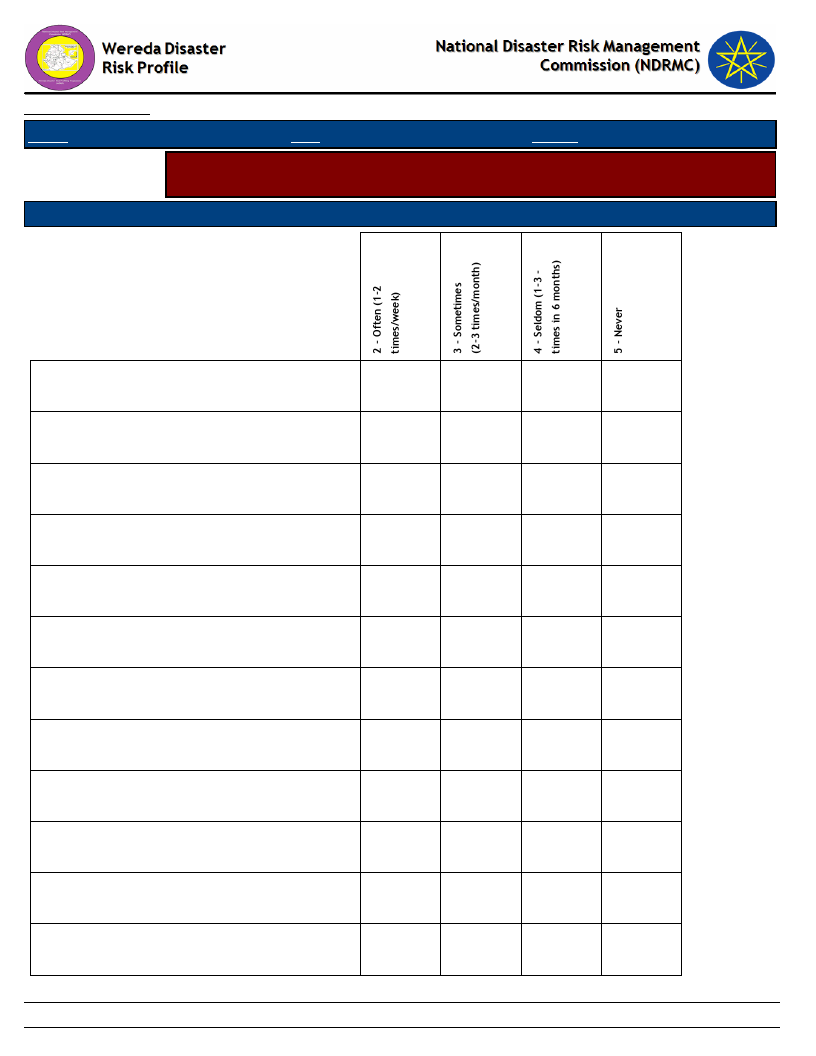
Data_Collected_Date
Region S.N.N.P
Zone BENCH MAJI
Monday, February 25, 2019
Wereda SURIMA
Selected Indicator
Capacity: Coping Strategies Adopted by Households - Percentage of households
by frequency of main coping strategies adopted
Type of Coping Strategy Adopted
Frequency of Adoption
Borrowing of food or cash (including purchasing
food on credit)
Collection of wild food
Consumption rather than sale of crop surplus
Limit portion size at meals
Long-term / permanent migration (including
distress migration of whole families)
Others -
Reduce number of meals eaten in a day
Reduced expenditure on non-essential items (beer,
cigarettes, clothes, meat, etc.)
Rely on less preferred and less expensive food
Restrict consumption by adults in order for small
children to eat
Seek alternative or additional jobs
Sell more livestock than usual
100.00
52.94
47.06
2.19
8.74
88.52
0.55
100.00
25.00
75.00
100.00
30.77
69.23
6.90
89.66
3.45
100.00
100.00
100.00
1.74
13.91
84.35
195
Page 1 of 2
Data_Collected_Date
Region S.N.N.P
Zone BENCH MAJI
Monday, February 25, 2019
Wereda SURIMA
Selected Indicator
Capacity: Coping Strategies Adopted by Households - Percentage of households
by frequency of main coping strategies adopted
Type of Coping Strategy Adopted
Frequency of Adoption
Sending children of household for work
Short-term / seasonal labor migration
50.00
25.00
50.00
75.00
196
Page 2 of 2
Wereda Disaster
Risk Profile
Data_Collected_Date
National Disaster Risk Management
Commission (NDRMC)
Monday, February 25, 2019
Region S.N.N.P
Zone BENCH MAJI
Wereda SURIMA
Selected Indicator
Kebele Name
KURUMA
KOTLA KORA
MAJA
Capacity: Alternative Livelihood Sources - Alternative livelihood sources suggested by the community
Work_Option_1
Comment_1
Work_Option_2
Comment_2
Work_Option_3
Gold extraction
Crop diseases
To generate income
Going to break in
honey production
To increase income
Selling of hop
Livestock
veterinary
service
Selling borda
(local drink)
Generate income and
avoid food shortage
To protect livestock
from the death
To buy food
consumption
Fetching water
Conflict
Selling fire wood
DUKU
CHOYE
MOGA
OROROMAY
REGIYA
TULIGIT
Fire wood selling
Gold extraction
Extract gold
Mining gold
To generate income
To generate income
Increased income
Generating income
Mining gold
Generate income
Gold extraction
Income generating
Selling
vegetables
Selling of
livestock
Selling Borde
To generate income
To generate income
To increase income
Selling fire wood,
charcoal and
Gesho
Selling of fire
wood, charcoal
and Gesho
Honey production
To control shortage of
food
Generate income
Income generating
Selling crop
production
Selling charcoal
and fire wood
Selling collected
wood
Selling livestock
Selling local
drinks /borde
Selling of
livestock
Comment_3
Generating
income
To protect
them self from
death
Generating
income and
avoid food
shortage
To generate
income
To generate
income
To get income
To increase
income
Increasing
income
Income
generating
197
Page 1 of 2
Wereda Disaster
Risk Profile
Data_Collected_Date
National Disaster Risk Management
Commission (NDRMC)
Monday, February 25, 2019
Region S.N.N.P
Zone BENCH MAJI
Wereda SURIMA
Selected Indicator
Kebele Name
DISHO
KOKA
BORIKA
BOLE BOKT
BANIKA
ANIJO
BEBUSIN
KENIDA
GUME
HARITEGA
Capacity: Alternative Livelihood Sources - Alternative livelihood sources suggested by the community
Work_Option_1
Gold extraction
Comment_1
Buying food
Work_Option_2
Honey production
Comment_2
To generate income
Work_Option_3
Selling of animals
Selling local drink
( borde)
Gold extraction
To increase income
Generate income
Gold extraction
Buying foods
Selling local drink
/Borde/
Gold extraction
To increase income
To generate income
Gold extraction
Selling local drink
/Borda/
Buying food
To increase income
Honey production
Generating income
Selling animals
To purchase food
Going to mining (
gold extension)
Preparing and
selling of fire
wood
Selling of Gesho,
fire wood,
charcoal
Going to mining
/extract gold/
Selling fire wood,
charcoal, hop,
borda
Selling animals
Going to mining
(gold extraction )
To get income
By generating income to
avoid problems in
household
To generate income to
avoid food shortage
To get income
To generate income
To purchase food
To get income
Gold extraction
Selling cabbage
Generate income and
avoid food shortage
To generate income
Selling of animals
Selling of animal
Selling fire wood,
charcoal, Gesho
Selling of animals
Selling of Hop,
charcoal, fire
wood
Selling of animal
Selling poultry
Comment_3
To purchasing
food
Income
generation
Income
generation
Income
generation
To generate
income
To generate
income
Income
generation
To generate
income
198
Page 2 of 2

Data_Collected_Date
Region S.N.N.P
Zone BENCH MAJI
Monday, February 25, 2019
Wereda SURIMA
Selected Indicator
Type of Disaster
Capacity: Recovery from Losses from Disasters - Percentage of households
recovered from past disasters by type of Disasters
Recovered Percentage
Drought
45.66
Flood
0.28
Crop diseases
16.53
Livestock diseases
18.49
Human diseases
0.56
Heat waves/ High temp
10.92
Conflicts
7.00
Forest Fires
0.28
Road Accident
0.28
199
Page 1 of 1
Data_Collected_Date
Region S.N.N.P
Zone BENCH MAJI
Monday, February 25, 2019
Wereda SURIMA
Selected Indicator:
Capacity: Recovery from Losses from Disasters - Proportion of households
recovered by type of Losses
Type of Loss
Percentage
Physical damages on houses and property
28.57
Crop damage
22.69
Livestock damage
19.05
Death of household members
1.40
Illness/health problems
0.56
Loss of access to social services, including school
0.56
Loss of income
1.96
Lost access to grazing land
6.16
Lost access to water source
10.92
Had to flee/change residence area
8.12
200
Page 1 of 1
Data_Collected_Date
Region S.N.N.P
Zone BENCH MAJI
Monday, February 25, 2019
Wereda SURIMA
Selected Indicator
Capacity: Coping Options if More Resources Available - What coping strategy
could be adopted if more resource were available?
Coping Strategy To Be Adopted
Adaptation of economic activities to hazards season (e.g. cropping cycle, short term
crops, etc.)
Storage of food and other necessities
Response (%)
58.20
34.39
Physical protection of buildings and property
3.97
Changing residence area/migration
2.38
Others (specify)
0.26
None
0.79
201
Page 1 of 1

Data_Collected_Date
Monday, February 25, 2019
Region S.N.N.P
Zone BENCH MAJI
Wereda SURIMA
Selected Indictor:
Capacity: Coping Strategies Adopted by Households - Percentage of households
by major type of coping strategies adopted (at least once)
Coping Strategy Adopted
Main Strategy
Secondary Strategy
Reduced expenditure on non-essential items (beer, cigarettes,
clothes, meat, etc.)
Consumption rather than sale of crop surplus
7.53
47.53
1.56
11.72
Sell more livestock than usual
29.87
4.69
Borrowing of food or cash (including purchasing food on credit)
1.04
1.56
Sending children of household for work
0.52
0.78
Short-term / seasonal labor migration
2.08
Long-term / permanent migration (including distress migration of
whole families)
Seek alternative or additional jobs
1.04
0.26
11.72
Collection of wild food
4.42
4.69
Rely on less preferred and less expensive food
0.26
Limit portion size at meals
0.78
4.69
Restrict consumption by adults in order for small children to eat
0.78
31.25
Reduce number of meals eaten in a day
3.38
3.91
Others -
0.52
5.47
Restrict consumption by adults in order for small children to eat
4.69
202
Page 1 of 2

Data_Collected_Date
Monday, February 25, 2019
Region S.N.N.P
Zone BENCH MAJI
Wereda SURIMA
Selected Indictor:
Capacity: Coping Strategies Adopted by Households - Percentage of households
by major type of coping strategies adopted (at least once)
Coping Strategy Adopted
Main Strategy
Secondary Strategy
Reduce number of meals eaten in a day
7.81
203
Page 2 of 2

Wereda Disaster
Risk Profile
National Disaster Risk Management
Commission (NDRMC)
Data_Collected_Date
Region S.N.N.P
Zone BENCH MAJI
Wereda SURIMA
Selected Indicator
Capacity: Coping Strategies Adopted by Households - Main coping strategies adopted by households for respective
disasters
Coping Strtegies Adopted
Types of disaters for which HHs in the community adopt the listed
Coping Strtegies
Monday, February 25, 2019
Borrowing of food or cash
(including purchasing food
on credit)
Collection of wild food
Consumption rather than
sale of crop surplus
204
Page 1 of 5
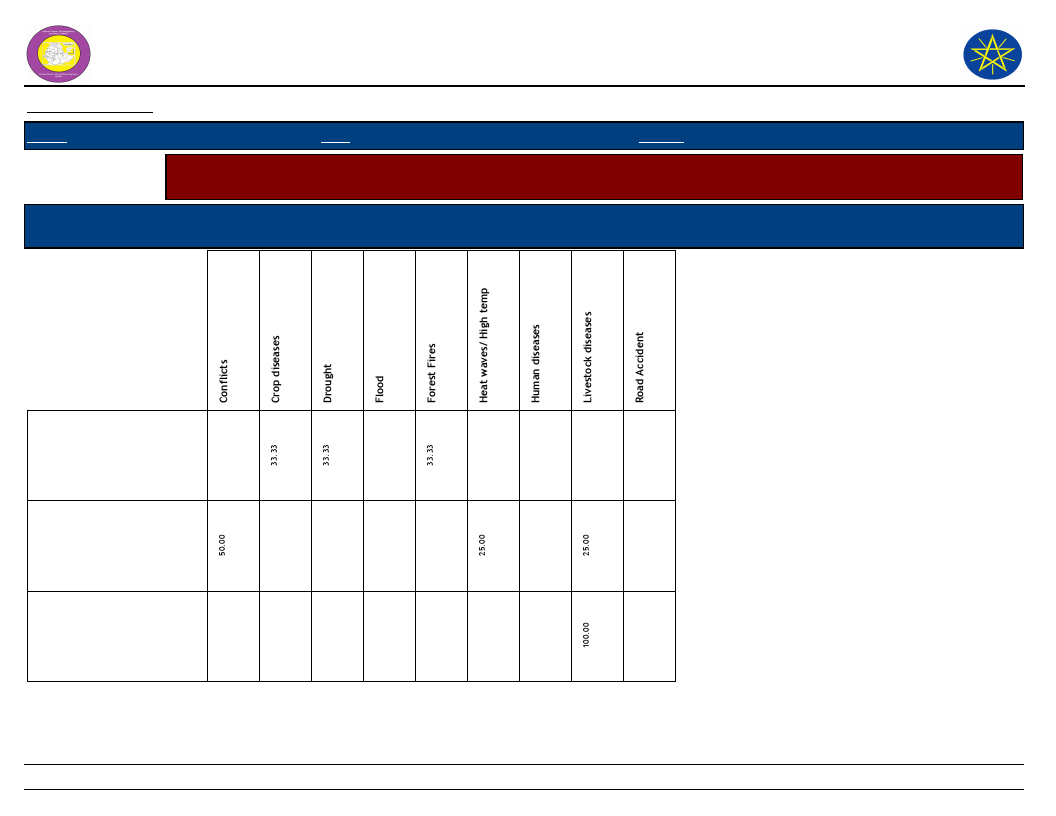
Wereda Disaster
Risk Profile
National Disaster Risk Management
Commission (NDRMC)
Data_Collected_Date
Region S.N.N.P
Zone BENCH MAJI
Wereda SURIMA
Selected Indicator
Capacity: Coping Strategies Adopted by Households - Main coping strategies adopted by households for respective
disasters
Coping Strtegies Adopted
Types of disaters for which HHs in the community adopt the listed
Coping Strtegies
Monday, February 25, 2019
Limit portion size at meals
Long-term / permanent
migration (including
distress migration of
whole families)
Others -
205
Page 2 of 5

Wereda Disaster
Risk Profile
National Disaster Risk Management
Commission (NDRMC)
Data_Collected_Date
Region S.N.N.P
Zone BENCH MAJI
Wereda SURIMA
Selected Indicator
Capacity: Coping Strategies Adopted by Households - Main coping strategies adopted by households for respective
disasters
Coping Strtegies Adopted
Types of disaters for which HHs in the community adopt the listed
Coping Strtegies
Monday, February 25, 2019
Reduce number of meals
eaten in a day
Reduced expenditure on
non-essential items (beer,
cigarettes, clothes, meat,
etc.)
Rely on less preferred and
less expensive food
206
Page 3 of 5
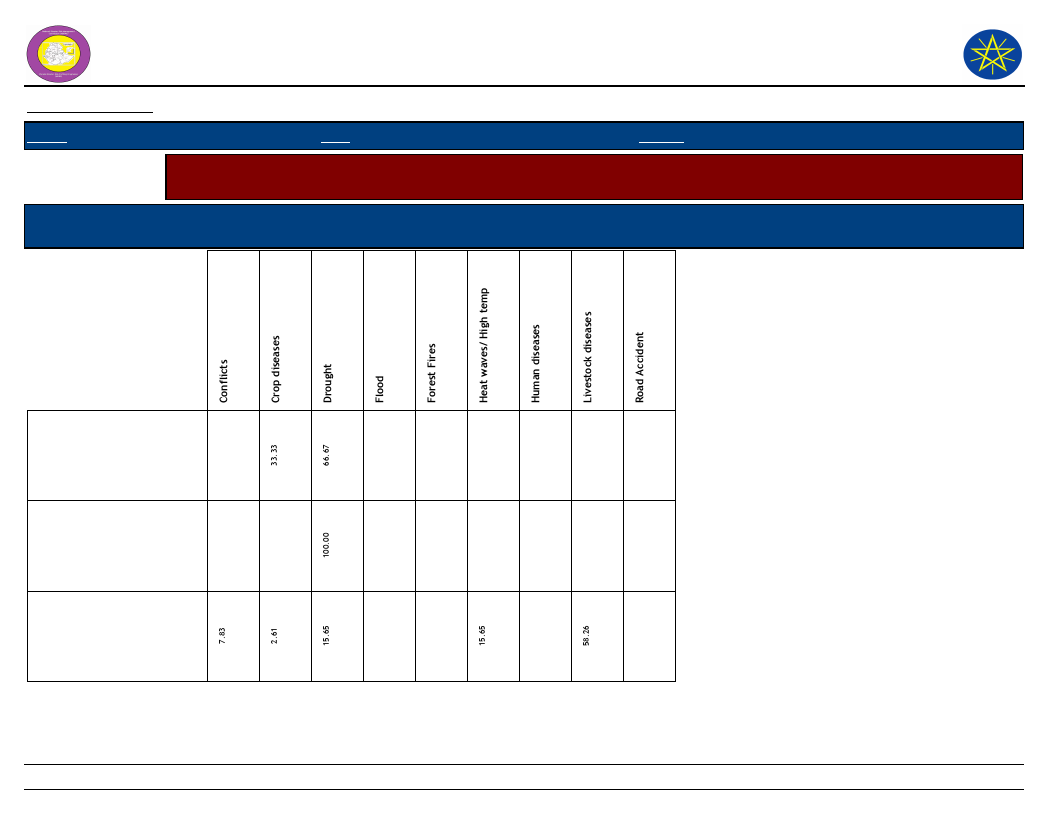
Wereda Disaster
Risk Profile
National Disaster Risk Management
Commission (NDRMC)
Data_Collected_Date
Region S.N.N.P
Zone BENCH MAJI
Wereda SURIMA
Selected Indicator
Capacity: Coping Strategies Adopted by Households - Main coping strategies adopted by households for respective
disasters
Coping Strtegies Adopted
Types of disaters for which HHs in the community adopt the listed
Coping Strtegies
Monday, February 25, 2019
Restrict consumption by
adults in order for small
children to eat
Seek alternative or
additional jobs
Sell more livestock than
usual
207
Page 4 of 5
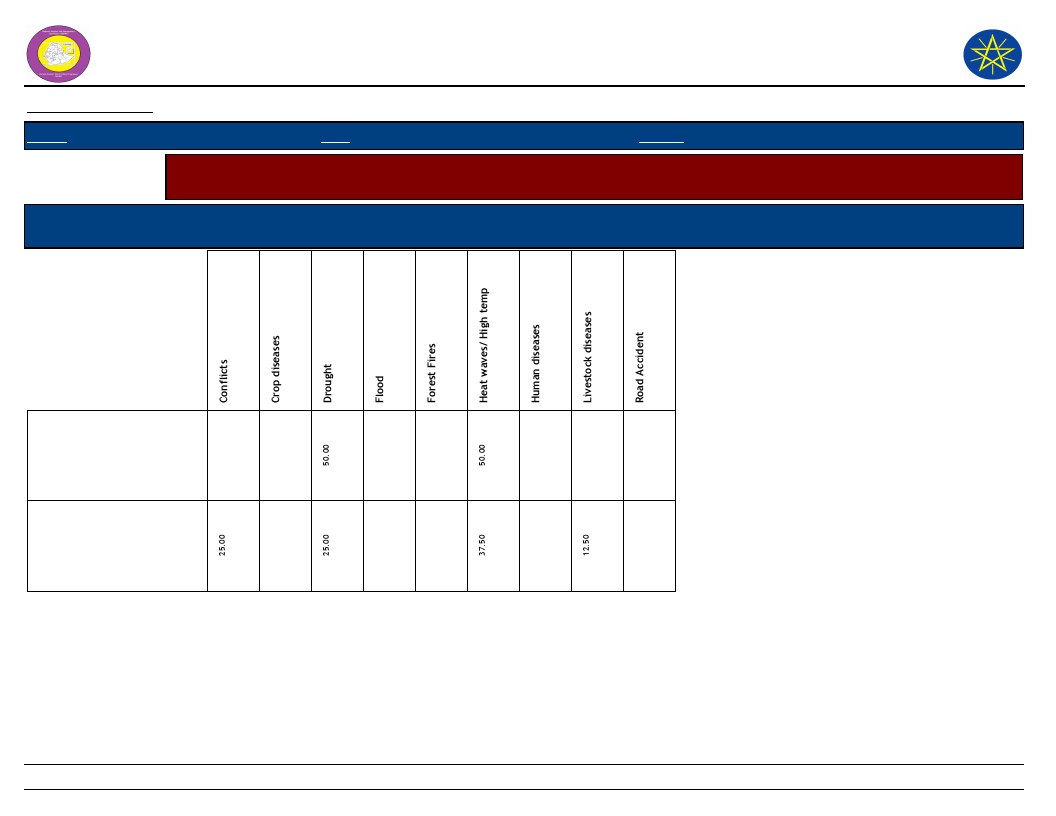
Wereda Disaster
Risk Profile
National Disaster Risk Management
Commission (NDRMC)
Data_Collected_Date
Region S.N.N.P
Zone BENCH MAJI
Wereda SURIMA
Selected Indicator
Capacity: Coping Strategies Adopted by Households - Main coping strategies adopted by households for respective
disasters
Coping Strtegies Adopted
Types of disaters for which HHs in the community adopt the listed
Coping Strtegies
Monday, February 25, 2019
Sending children of
household for work
Short-term / seasonal
labor migration
208
Page 5 of 5
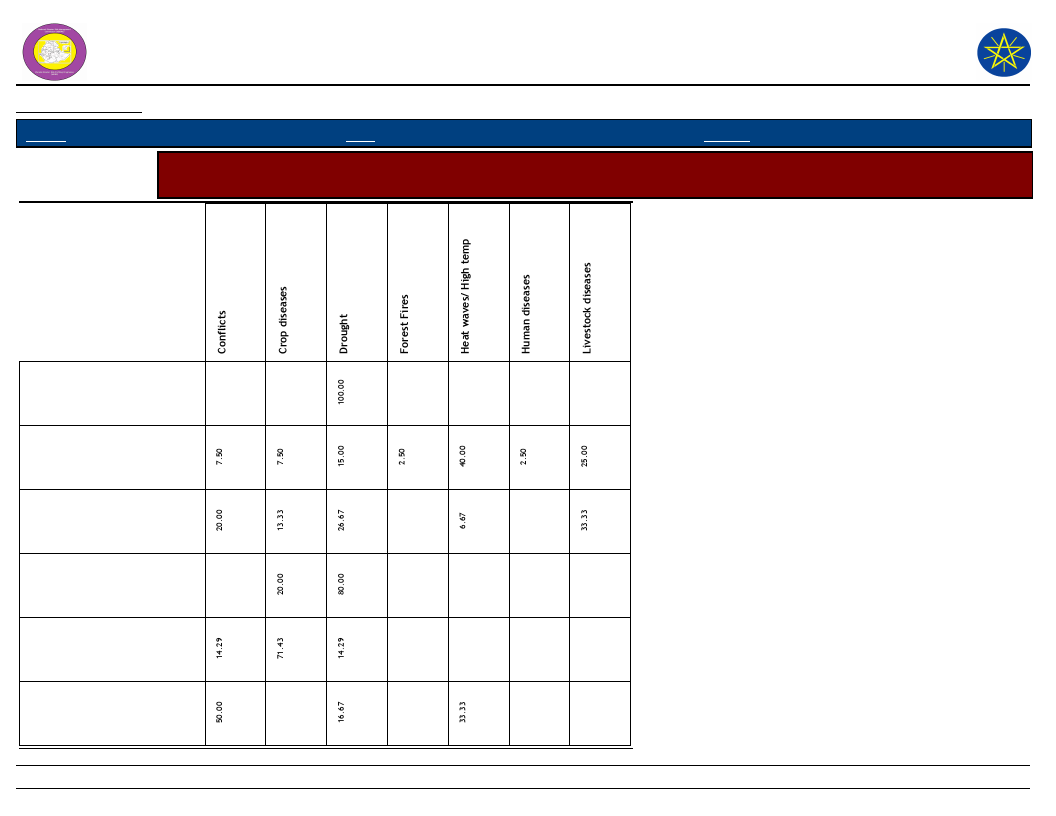
Wereda Disaster Risk
Profile
National Disaster Risk Management
Commission (NDRMC)
Data_Collected_Date
Region S.N.N.P
Zone
BENCH MAJI
Wereda SURIMA
Monday, February 25, 2019
Selected Indicator
Capacity: Coping Strategies Adopted by Households - Secondary coping strategies adopted by households for
respective disasters
Borrowing of food or cash
(including purchasing food
on credit)
Collection of wild food
Consumption rather than
sale of crop surplus
Increased working hours
Limit portion size at meals
Long-term / permanent
migration (including
distress migration of whole
209
Page 1 of 3
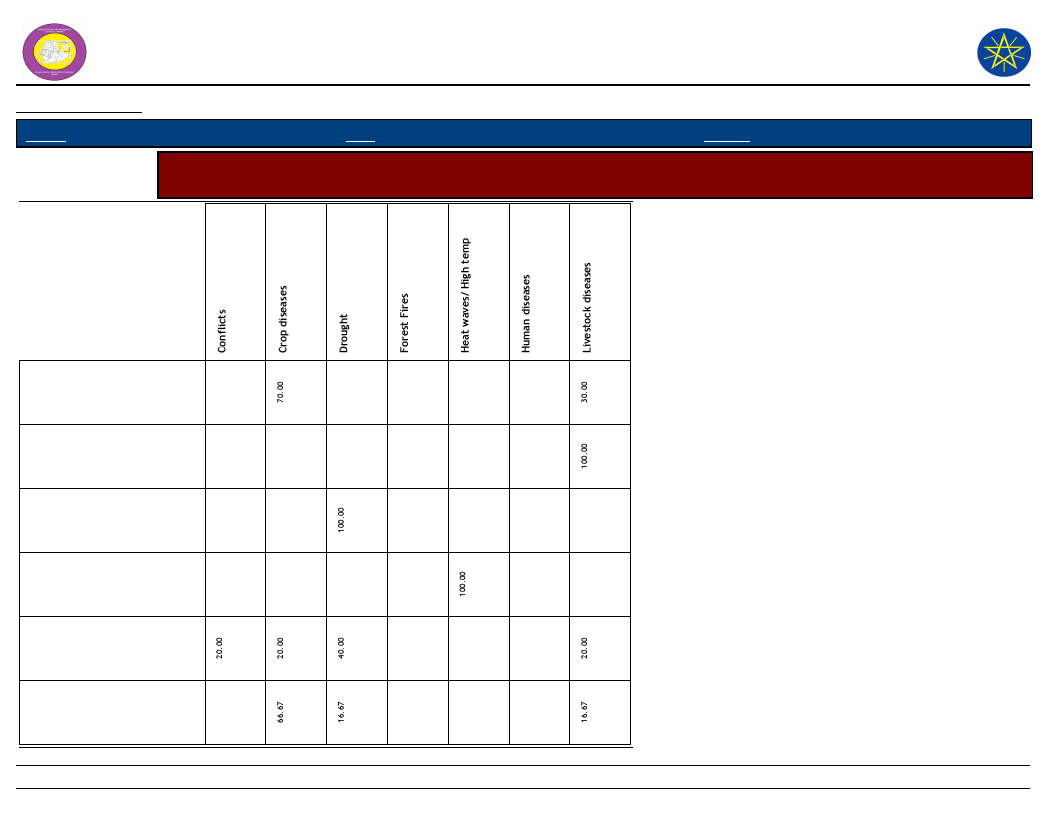
Wereda Disaster Risk
Profile
National Disaster Risk Management
Commission (NDRMC)
Data_Collected_Date
Region S.N.N.P
Zone
BENCH MAJI
Wereda SURIMA
Monday, February 25, 2019
Selected Indicator
Capacity: Coping Strategies Adopted by Households - Secondary coping strategies adopted by households for
respective disasters
Reduce number of meals
eaten in a day
Reduced expenditure on
health and education
(including taking children
Reduced expenditure on
non-essential items (beer,
cigarettes, clothes, meat,
Reduced expenditure on
productive inputs
(fertilizer, seeds, livestock
Rely on less preferred and
less expensive food
Restrict consumption by
adults in order for small
children to eat
210
Page 2 of 3
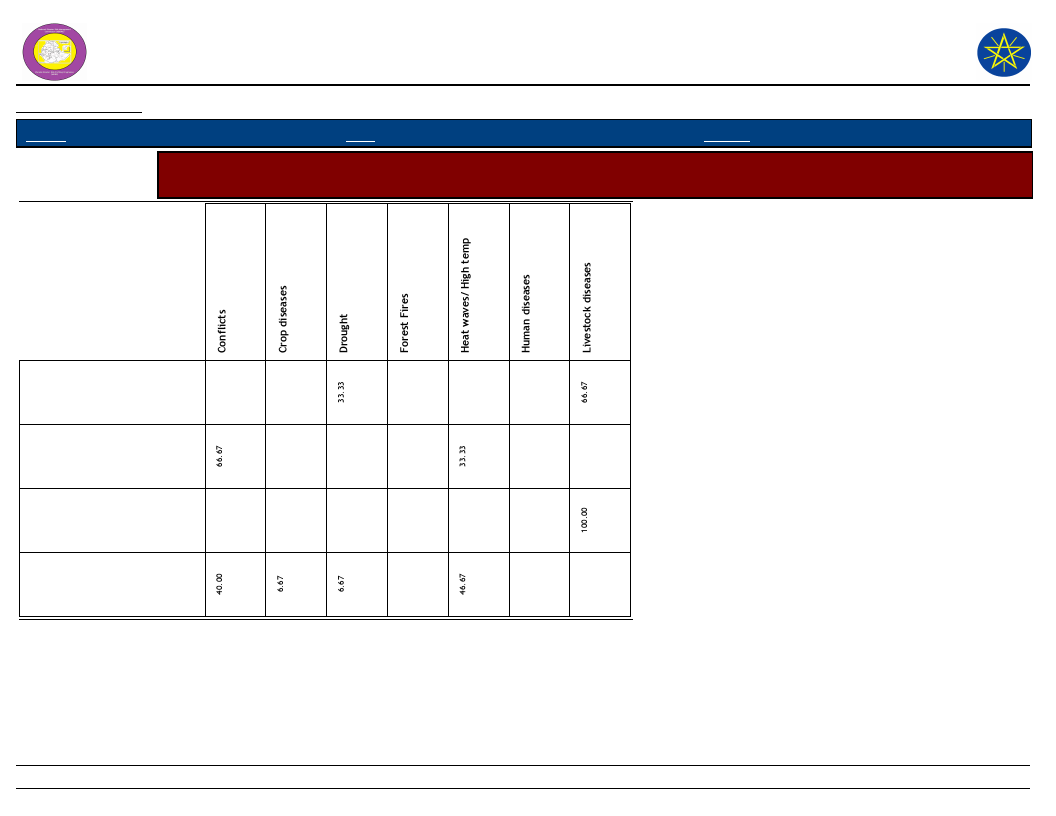
Wereda Disaster Risk
Profile
National Disaster Risk Management
Commission (NDRMC)
Data_Collected_Date
Region S.N.N.P
Zone
BENCH MAJI
Wereda SURIMA
Monday, February 25, 2019
Selected Indicator
Capacity: Coping Strategies Adopted by Households - Secondary coping strategies adopted by households for
respective disasters
Seek alternative or
additional jobs
Sell more livestock than
usual
Sending children of
household for work
Short-term / seasonal labor
migration
211
Page 3 of 3
WDRP Indicators
Community
Perceptions and Suggestions
212
Wereda Disaster
Risk Profile
Data_Collected_Date
National Disaster Risk Management
Commission (NDRMC)
Monday, February 25, 2019
Region S.N.N.P
Zone
BENCH MAJI
Wereda SURIMA
Selected Indicator
Kebele Name
Interventions: Community Perception on Mediums to Influence DRM Actors - Community perception on the
effectiveness of institutional channels to use to influence DRM actors
Institution_1
Process_Description
Institution_2 Process_Description
Institution_3
Process_Description
KURUMA
KOTLA KORA
MAJA
DUKU
CHOYE
MOGA
Kebele
development
agent
Kebele elders
Kebele
administration
Demanding
development agent
to pastoral
governments
medicine
Discuss
administrative issues
To get
administration
Kebel
administration
to woreda
administration
To get administrative
issue
Kebele
development
agents
Kebele health
extension
Demanding improved
seed
Demanding medicine
Kebele facilitator
to concerned
sector
Kebele health
extension service
Kebele
administration
office
To facility human
health way of life
Demanding medicine
To discuss
administrative issue
Kebele
administration
to wereda
administration
Kebele
developmental
agent
To get administration
issue
Demanding improved
seeds
Kebele
development
agents
Demanding improved
seed
213
Page 1 of 4

Wereda Disaster
Risk Profile
Data_Collected_Date
National Disaster Risk Management
Commission (NDRMC)
Monday, February 25, 2019
Region S.N.N.P
Zone
BENCH MAJI
Wereda SURIMA
Selected Indicator
Interventions: Community Perception on Mediums to Influence DRM Actors - Community perception on the
effectiveness of institutional channels to use to influence DRM actors
Kebele Name
OROROMAY
REGIYA
TULIGIT
DISHO
KOKA
BORIKA
Institution_1
Kebele
administration to
wereda
administration
Kebele health
extension service
Process_Description
To get
administrative
issued
Demanding medicine
Kebele
developmental
agent to wereda
agriculture office
Keble
administration
Kebele
administrative
office
Kebele agriculture
office
Demanding livestock
medicine, improved
agricultural inputs
To get
administrative issues
To discuss
administrative issues
For demanding
improved seeds,
chemicals and
agricultural inputs
Institution_2 Process_Description
Kebele
developmental
agent to
wereda
agriculture
Kebele health
extension
service
Demanding improve
seed and insecticide
Demanding health
keeping inputs
Kebele sub
police station
Kebele
Development
agents
Kebele health
extension
service
T get response
Demanding improved
seed
Demanding
medicines, mosquito
nets, delivery
services for all health
services
Institution_3
Process_Description
Kebele
administration
to wereda
administration
To get administrative
issues
With wereda
health office,
kebele
administrative
To get administrative
issue
Kebele health
extension
Demanding medicine
Kebele
administration
To get all
administrative issues.
214
Page 2 of 4

Wereda Disaster
Risk Profile
Data_Collected_Date
National Disaster Risk Management
Commission (NDRMC)
Monday, February 25, 2019
Region S.N.N.P
Zone
BENCH MAJI
Wereda SURIMA
Selected Indicator
Interventions: Community Perception on Mediums to Influence DRM Actors - Community perception on the
effectiveness of institutional channels to use to influence DRM actors
Kebele Name
BOLE BOKT
BANIKA
ANIJO
BEBUSIN
KENIDA
GUME
Institution_1
Kebele
developmental
agent to wereda
agriculture and
natural resource
office
Kebele
administration
Kebele
Development
Aagents to wereda
agriculture and
natural resource
management
office
Woreda
administration
Kebell
administration
Process_Description
Demanding
improved seeds and
insecticide
chemicals
To discuss
administrative issues
Demanding
improved seeds,
agricultural inputs
To get
administrative issue
To get
administrative issue
Kebele health
extension service
Demanding Medicine
Institution_2
Kebele
administration
to wereda
administration
Process_Description
To get administrative
issues
Kebele
administration
to wereda
administration
To get different
administrative issues
like conflict
Kebel
development
agent
Keble
development
agent
Demanding improved
seed
Demanding improved
seed and insecticide
/chemicals
Institution_3
Process_Description
Kebele
facilitator to
wereda
agriculture
To gain government
service
Kebele health
extension
Demanding medicine
Kebele
administration
To get administrative
issue
215
Page 3 of 4
Wereda Disaster
Risk Profile
Data_Collected_Date
National Disaster Risk Management
Commission (NDRMC)
Monday, February 25, 2019
Region S.N.N.P
Zone
BENCH MAJI
Wereda SURIMA
Selected Indicator
Interventions: Community Perception on Mediums to Influence DRM Actors - Community perception on the
effectiveness of institutional channels to use to influence DRM actors
Kebele Name
HARITEGA
Institution_1
Woreda
administration
Process_Description
To get
administrative issue
Institution_2 Process_Description
Institution_3
Process_Description
216
Page 4 of 4
Data_Collected_Date
Region S.N.N.P
Zone
BENCH MAJI
Monday, February 25, 2019
Wereda SURIMA
Selected Indicator
Interventions: Community Perception on their Knowledge used in DRM Process -
Perception of the community on how their knowledge influences the priorities
and measures of DRM actors
KebeleName
Community_Suggestions
KURUMA
The service given by the above institution is good
KOTLA KORA
Service given by institution is good
MAJA
The service give by about institution is good
CHOYE
The service is given the above institution is good
MOGA
The service given at this kebele is very poor facilities
OROROMAY
The service given by above institution is good
REGIYA
The service given by the above institution is good
TULIGIT
The service given by the above institution are good
DISHO
The service given by the above institution partially good
KOKA
The service given by above institution are good
BORIKA
BOLE BOKT
Measures taken by the authorities and other risk management institutions working
in the community is good
To survive given by the above institution is good
BANIKA
There is no any institution
ANIJO
The overall service given by the above institution are good.
KENIDA
The service given by above institution is good
GUME
The service given by the above institution is good
217
Page 1 of 1
Wereda Disaster Risk
Profile
National Disaster Risk Management
Commission (NDRMC)
Data_Collected_Date
Region S.N.N.P
Zone BENCH MAJI
Wereda SURIMA
Monday, February 25, 2019
Selected Indicator
Interventions: Suggestions to DRM Actors in the Area - Community suggested measures to DRM actors in the area
for effective DRM actions
Kebele Name
KURUMA
KOTLA KORA
MAJA
Measure 1
Health center,
personal hygiene,
distributing
mosquito net
PCDP constructing
school and livestock
health
Constructing school,
Police office
CHOYE
PCDP contacting
school
MOGA
OROROMAY
REGIYA
PCDP constructing
school
RPIRP distributing
improved goats
RPLRP, planting
pasture, fruit and
vegetables
Comment 1
To create health
and productive
community
To create
literate, to get
health service
To create
educated
community
Creating literate
pastoral
community
To create literate
community
To increase
productivity
To change
pattern of
pastoralist to
semi pastoralist
Measure 2
PCDP constructing
school
Personal and
environmental hygiene
URAP constructing
rural accessible road
Health office personal
and environmental
hygiene, distributing
mosquito net,
distributing medicine
for malaria
218
Comment 2
Create educated
community
Measure 3
URAP
constructing rural
road
Comment 3
To facilitate
different kind of
development
To create health
and productive
community
To facilitate
different kind of
development
To create healthy
productive pastoral
community
PCDP
Constructing
school
Creating literate
pastoral
community
Page 1 of 3
Wereda Disaster Risk
Profile
National Disaster Risk Management
Commission (NDRMC)
Data_Collected_Date
Region S.N.N.P
Zone BENCH MAJI
Wereda SURIMA
Monday, February 25, 2019
Selected Indicator
Interventions: Suggestions to DRM Actors in the Area - Community suggested measures to DRM actors in the area
for effective DRM actions
Kebele Name
TULIGIT
Measure 1
John private
company,
awareness creation
and increasing
livelihood
DISHO
Constructing school
Comment 1
To change
economic status
of the community
To educate the
community
Measure 2
Health center,
protecting personal
and environmental
hygiene, distributing
health protection
inputs
Constructions of rural
road
KOKA
BORIKA
BOLE BOKT
PCDP - constructing
school
PCDP- constructing
mill house,
constructing school,
water harvesting
Health center-
pastoral and
environmental
hygiene,
distributing bed net
To create literate
community
To construct
schools
Health- distributing
mosquito net,
distributing medicine
Health center-
distributing mosquito
net
To create health
and productive
pastoral
community
PCDP - constructing
school to create
Comment 2
To create
productive pastoral
community
Measure 3
PCDP constructing
schools
Comment 3
Creating literate
communities
To facilitate
different kind of
development
o create health full
society
Agriculture office
Demanding seed
To create health
community
To literate pastoral
community
URAP -
constructing rural
accessible road
To facilitate
different kinds of
development
219
Page 2 of 3
Wereda Disaster Risk
Profile
National Disaster Risk Management
Commission (NDRMC)
Data_Collected_Date
Region S.N.N.P
Zone BENCH MAJI
Wereda SURIMA
Monday, February 25, 2019
Selected Indicator
Interventions: Suggestions to DRM Actors in the Area - Community suggested measures to DRM actors in the area
for effective DRM actions
Kebele Name
ANIJO
Measure 1
PCDP - constructing
school
Comment 1
Creating literate
community
Measure 2
RPLRP
KENIDA
GUME
PCDP constructing
school
Health center
Pastoral and
environmental
hygiene, mosquito
net
To create
educated
community
To create health
and productive
pastoral
Distributing mosquito
net, distributing
malaria for malaria
PCDP constructing
school to create
Comment 2
Ensuring food
security by
planting sweet
potato s
To create health
full and productive
community
Educate the
pastoral
community
Measure 3
URAP
constructing ruler
accusable road
Comment 3
To facility
different kind of
development
220
Page 3 of 3

Wereda Disaster Risk
Profile
National Disaster Risk Management
Commission (NDRMC)
Data_Collected_Date
Region S.N.N.P
Zone BENCH MAJI
Wereda SURIMA
Monday, February 25, 2019
Selected Indicator
Economic Vulnerability: Community Suggestions to Improve Economic Situation - Community suggested measures
to improve the economic situation of the area
KebeleName
Measure 1
Comment 1
Measure 2
Comment 2
Measure 3 Comment 3
KURUMA
KOTLA KORA
MAJA
DUKU
CHOYE
MOGA
OROROMAY
REGIYA
TULIGIT
Mill house construction
For grinding cereals in
order to avoid long run
distance
Improving animal
specious
Improve animal specious
To improve animal
product
Improve animal product
Construction of rural
road
Constructing farm roads
with maji
Facilitate accessible
market
For market linkage
Improving livestock
species
Improve livestock
species
Widely cultivating crops
To improve livestock
products
Improve productivity
Improving crops yields
Improving health
centers
Decreased death of
human
Animal medicine
Building mill
Improve seed
Expansion of school
Animal protection
Building mill
Building mill
Animal health
protection
Livestock health
protection
221
To increase animal
production
To decrease long
distance e move
Improve crop
product
Create literate
community
To increased
animal production
To minimize long
walk
To minimize long
move
To increase animal
production
To incraesed
animal production
In access of
pure water
The scheme
is constructs
but is not
access
Building clear
water
To get clear
water
Road between Access to
the kebele
market
Construction
of mill house
Establishing
marketing
center
To accelerate
Building
water
To get clean
water
Building clean
water access
To get clean
water
Establishing
market
center
To accelerate
exchanges
Page 1 of 3

Wereda Disaster Risk
Profile
National Disaster Risk Management
Commission (NDRMC)
Data_Collected_Date
Region S.N.N.P
Zone BENCH MAJI
Wereda SURIMA
Monday, February 25, 2019
Selected Indicator
Economic Vulnerability: Community Suggestions to Improve Economic Situation - Community suggested measures
to improve the economic situation of the area
KebeleName
Measure 1
Comment 1
Measure 2
Comment 2
Measure 3 Comment 3
DISHO
KOKA
BORIKA
BOLE BOKT
BANIKA
ANIJO
BEBUSIN
Constructing schools
Improving animal
species
Lack of farm and inside
roads
Supplying improved
seeds ( production
increased inputs)
To create educated
community
To improve animal
product
Facilitate accessibility
To increase crop
production
Improving animal
species
Mill house construction
To improve animal
production
For preparing food
Constructing school
To create educated
community
Animal protection
Building mill
No market center
Activate millhouse
Building mill
Constructing pure
water
Animal protection
To increase animal
production
To minimize long
move
To accelerate
exchanges
To increase animal
production
To minimize long
move
Save from water
born disease
To increase animal
production
Establishing
marketing
center
Building clean
water
Improving
animal
species
Supplying
farm ox and
practicing
improved
agriculture
Building clear
water
Donate
marginalize
Establishing
market
center
To access
and exchange
money
To get clean
water
To improve
animal
production
Improving
yield
To get clean
water
Equally
benefited
with those
healthy one
To access
exchange
money
222
Page 2 of 3
Wereda Disaster Risk
Profile
National Disaster Risk Management
Commission (NDRMC)
Data_Collected_Date
Region S.N.N.P
Zone BENCH MAJI
Wereda SURIMA
Monday, February 25, 2019
Selected Indicator
Economic Vulnerability: Community Suggestions to Improve Economic Situation - Community suggested measures
to improve the economic situation of the area
KebeleName
Measure 1
Comment 1
Measure 2
Comment 2
Measure 3 Comment 3
KENIDA
GUME
HARITEGA
Improve animal specious
To improve animal
product
Wild cultivating crop
Improve crop yield
construction of school
To create educated
community
Constructing
market center
Animal health
protection
Animal protection
Accessible to sell
To increase animal
productivities
To increase animal
production
Wild
cultivating
crop
Establishing
marketing
center
Establishing
marketing
center
To improve
crop product
To accelerate
exchange
To access
exchange
money
223
Page 3 of 3

Wereda Disaster
Risk Profile
Data_Collected_Date
Region S.N.N.P
Zone BENCH MAJI
Selected Indicator
Community Awareness of Disaster Risk Management System and Actors
Kebele Name
ANIJO
Institution 1
Responsibility
Activity
PCDP
Awareness creation
Constructing school
Institution 2
Responsibility
Activity
RPLRP
Awareness creation
Planting sweet potato s
Institution 3
Responsibility
Activity
Kebele Name
BANIKA
Institution 1
Responsibility
Activity
There is government and NGO institution
Institution 2
Responsibility
Activity
Institution 3
Responsibility
Activity
National Disaster Risk
Management Comission (NDRMC)
Monday, February 25, 2019
Wereda SURIMA
224
Page 1 of 10
Wereda Disaster
Risk Profile
Data_Collected_Date
Region S.N.N.P
Zone BENCH MAJI
Selected Indicator
Community Awareness of Disaster Risk Management System and Actors
Kebele Name
BEBUSIN
Institution 1
Responsibility
Activity
Health service
Awareness creation
Protection pastoralist health
Institution 2
Responsibility
Activity
Institution 3
Responsibility
Activity
Kebele Name
BOLE BOKT
Institution 1
Responsibility
Activity
PCDP
Creating awareness
Constructing schools
Institution 2
Responsibility
Activity
Health service
Protecting the community health
Gives health service
Institution 3
Responsibility
Activity
National Disaster Risk
Management Comission (NDRMC)
Monday, February 25, 2019
Wereda SURIMA
225
Page 2 of 10

Wereda Disaster
Risk Profile
Data_Collected_Date
Region S.N.N.P
Zone BENCH MAJI
Selected Indicator
Community Awareness of Disaster Risk Management System and Actors
Kebele Name
BORIKA
Institution 1
Responsibility
Activity
PCDP
Awareness creation of pastoral community
water harvesting, school construction, road construction
Institution 2
Responsibility
Activity
Government health staff
Protecting community health
Birth control, material protection, delivery program
Institution 3
Responsibility
Activity
Kebele Name
CHOYE
Institution 1
Responsibility
Activity
PCDP
Creating awareness
Constricting school
Institution 2
Responsibility
Activity
URAP
Constructing rural road
Constructing road
Institution 3
Responsibility
Activity
Health service
Protecting the community health
Give health service
National Disaster Risk
Management Comission (NDRMC)
Monday, February 25, 2019
Wereda SURIMA
226
Page 3 of 10

Wereda Disaster
Risk Profile
Data_Collected_Date
Region S.N.N.P
Zone BENCH MAJI
Selected Indicator
Community Awareness of Disaster Risk Management System and Actors
Kebele Name
DISHO
Institution 1
Responsibility
Activity
Pcdp
Construction and awareness creation
Storing food
Institution 2
Responsibility
Activity
Institution 3
Responsibility
Activity
Kebele Name
DUKU
Institution 1
Responsibility
Activity
PCDP
Creating awareness
Constructing health exertion center
Institution 2
Responsibility
Activity
Institution 3
Responsibility
Activity
National Disaster Risk
Management Comission (NDRMC)
Monday, February 25, 2019
Wereda SURIMA
227
Page 4 of 10

Wereda Disaster
Risk Profile
Data_Collected_Date
Region S.N.N.P
Zone BENCH MAJI
Selected Indicator
Community Awareness of Disaster Risk Management System and Actors
Kebele Name
GUME
Institution 1
Responsibility
Activity
Health service
Protecting the community
Gives health service
Institution 2
Responsibility
Activity
PCDP
Creating awareness of pastor
Constructing schools police office , health office
Institution 3
Responsibility
Activity
Kebele Name
HARITEGA
Institution 1
Responsibility
Activity
Health service
Awareness creation
Protecting pastoralist health
Institution 2
Responsibility
Activity
Institution 3
Responsibility
Activity
National Disaster Risk
Management Comission (NDRMC)
Monday, February 25, 2019
Wereda SURIMA
228
Page 5 of 10

Wereda Disaster
Risk Profile
Data_Collected_Date
Region S.N.N.P
Zone BENCH MAJI
Selected Indicator
Community Awareness of Disaster Risk Management System and Actors
Kebele Name
KENIDA
Institution 1
Responsibility
Activity
PCDP
Creating awareness
Constructing school clinic police office
Institution 2
Responsibility
Activity
Government health office
Protecting the community
Giving health service
Institution 3
Responsibility
Activity
Kebele Name
KOKA
Institution 1
Responsibility
Activity
RPLPP`
Planting root crops
Giving money for farming activities
Institution 2
Responsibility
Activity
PCDP
Creating awareness
Constructing school/ health center
Institution 3
Responsibility
Activity
Government development agent
Demanding improved seed
Demanding seed
National Disaster Risk
Management Comission (NDRMC)
Monday, February 25, 2019
Wereda SURIMA
229
Page 6 of 10

Wereda Disaster
Risk Profile
Data_Collected_Date
Region S.N.N.P
Zone BENCH MAJI
Selected Indicator
Community Awareness of Disaster Risk Management System and Actors
Kebele Name
KOTLA KORA
Institution 1
Responsibility
Activity
PCDP
Creating awareness
Constructing school, livestock health center
Institution 2
Responsibility
Activity
Institution 3
Responsibility
Activity
Kebele Name
KURUMA
Institution 1
Responsibility
Activity
PCDP
Creating awareness of pasture
Construction of school
Institution 2
Responsibility
Activity
URAP
Rural roads
Constructing inside roads
Institution 3
Responsibility
Activity
Government health staff
Protecting the community health
Giving health service
National Disaster Risk
Management Comission (NDRMC)
Monday, February 25, 2019
Wereda SURIMA
230
Page 7 of 10

Wereda Disaster
Risk Profile
Data_Collected_Date
Region S.N.N.P
Zone BENCH MAJI
Selected Indicator
Community Awareness of Disaster Risk Management System and Actors
Kebele Name
MAJA
Institution 1
Responsibility
Activity
PCDP
Creating awareness
Constructing school, police
Institution 2
Responsibility
Activity
Government health staff
Creating awareness
Giving health service
Institution 3
Responsibility
Activity
Kebele Name
Agricultural and natural resource staff
Creating awareness
Giving developmental service
MOGA
Institution 1
Responsibility
Activity
PCDP
Creating awareness
Constructing school, farmer training center, health center, mill building
Institution 2
Responsibility
Activity
Institution 3
Responsibility
Activity
National Disaster Risk
Management Comission (NDRMC)
Monday, February 25, 2019
Wereda SURIMA
231
Page 8 of 10

Wereda Disaster
Risk Profile
Data_Collected_Date
Region S.N.N.P
Zone BENCH MAJI
Selected Indicator
Community Awareness of Disaster Risk Management System and Actors
Kebele Name
OROROMAY
Institution 1
Responsibility
Activity
RPIRP
Creating awareness
Distributing improved goats
Institution 2
Responsibility
Activity
Institution 3
Responsibility
Activity
Kebele Name
REGIYA
Institution 1
Responsibility
Activity
RPLRP
Food security
Plantation of vegetables and fruit, hand pump supply
Institution 2
Responsibility
Activity
PCDP
Creating awareness of pastoral community
Constructing school
Institution 3
Responsibility
Activity
URAP
Constructing rural roads
Constructing roads
National Disaster Risk
Management Comission (NDRMC)
Monday, February 25, 2019
Wereda SURIMA
232
Page 9 of 10
Wereda Disaster
Risk Profile
Data_Collected_Date
Region S.N.N.P
Zone BENCH MAJI
Selected Indicator
Community Awareness of Disaster Risk Management System and Actors
Kebele Name
TULIGIT
Institution 1
Responsibility
Activity
John Private company
Awareness creation and increased livelihood
Constructing water, school health center and church
Institution 2
Responsibility
Activity
PCDP
Awareness creation and increased livelihood
Construction of school
Institution 3
Responsibility
Activity
Health office
Protecting the communities health
Distributing health supplying material
National Disaster Risk
Management Comission (NDRMC)
Monday, February 25, 2019
Wereda SURIMA
233
Page 10 of 10
Wereda Disaster
Risk Profile
National Disaster Risk Management
Commission (NDRMC)
Data_Collected_Date
Monday, February 25, 2019
Region S.N.N.P
Zone BENCH MAJI
Wereda SURIMA
Selected Indicator
Community Perception of DRM System and Actors - Perception of the community on the effectiveness of DRM
system in helping them to prevent, cope and recover from disasters
KebeleName
KURUMA
Prevention
Less effective
Coping
They are at least effective
Recovery
Mostly they are effective
Overall_Effectiveness
Moderately effective
KOTLA KORA
Effective
Less effective
Effective
Moderately effective
MAJA
DUKU
Effective
Not effective
They are more or less
effective
Not effective
They are mostly
effective
Not effective
Moderately effective
Not effective
CHOYE
Effective
Effective
Effective
Effective
MOGA
Not effective
Not effective
Not effective
Not effective
OROROMAY
Effective
Less effective
Effective
Moderaetly Effective
REGIYA
Effective
Less effective
Effective
Moderately Effective
TULIGIT
Effective
Effective
Effective
Effective
DISHO
KOKA
BORIKA
We are not happy they are
not effective
Yes they are effective
Yes they are effective
They are not effective
They are more or less
effective
Yes they are productive
They are not efficient
They are effective
mostly effective by
giving above activities
Effective
They are not efficient
Moderately effective
Effective
BOLE BOKT
Yes they are effective
Yes they are productive
Mostly they are effective
Yes they are effective
BANIKA
Not effective
Not effective
234
Not effective
Not effective
Page 1 of 2
Wereda Disaster
Risk Profile
National Disaster Risk Management
Commission (NDRMC)
Data_Collected_Date
Monday, February 25, 2019
Region S.N.N.P
Zone BENCH MAJI
Wereda SURIMA
Selected Indicator
Community Perception of DRM System and Actors - Perception of the community on the effectiveness of DRM
system in helping them to prevent, cope and recover from disasters
KebeleName
Prevention
Coping
Recovery
Overall_Effectiveness
ANIJO
BEBUSIN
KENIDA
GUME
Yes, They are effective and
we are happy for these
They are not effective
Yes they are effective
Yes they are effective
They are effective
They are not effective
They are more or less
effective
They are at least effective
They are mostly
effective
They are not effective
They are mostly
effective
Mostly they are effective
Effective
No health experts, no pure
water access, no road, no
mill house They are not
effective
Moderately effective
Moderately effective
HARITEGA
They are not effective
They are not effective
They are not effective
They are not effective
235
Page 2 of 2
Data_Collected_Date
Region S.N.N.P
Zone BENCH MAJI
Wereda SURIMA
Monday, February 25, 2019
Selected Indicator
Major Public Interventions Desired - Percentage of households by type of
intervention desired
Major public interventions desired by the community
Degree of Importance for the community
Access to markets
1st
2nd
3rd
0.26
8.29
6.54
Access to roads
0.00
0.52
1.31
Agricultural inputs (fertilizer, improved seeds, etc.)
0.52
10.10
24.35
Better job
8.29
2.07
3.40
Cash transfers/social assistance
0.26
0.52
2.09
Cash-for-work activities (not employment)
0.26
0.00
0.26
Enhance access to schools / School feeding for children
3.89
42.75
6.81
Food-for-work activities
0.00
0.00
1.57
Medical assistance / access to health facilities
0.26
2.85
20.16
Micro-credit programmes
3.89
5.18
3.14
Rental subsidies
0.26
0.00
0.26
School fees for children
0.00
0.00
0.26
Subsidized health care
2.85
6.22
12.57
Supplementary feeding for women and young children
10.62
16.58
10.99
Veterinary facilities
0.26
1.55
1.57
236
Page 1 of 2
Data_Collected_Date
Region S.N.N.P
Zone BENCH MAJI
Wereda SURIMA
Monday, February 25, 2019
Selected Indicator
Major Public Interventions Desired - Percentage of households by type of
intervention desired
Major public interventions desired by the community
Degree of Importance for the community
Food aid
1st
2nd
3rd
68.39
3.37
4.71
237
Page 2 of 2
WDRP Indicators
Other Community Characteristics
238
Wereda Disaster
Risk Profile
Data_Collected_Date
Region S.N.N.P
Zone BENCH MAJI
Selected Indicator
Capacity: Community Based Organizations in the Wereda
Name_Of_Organization
Est._Year
Formal/Informal
Kebele Name
Irrigation
ANIJO
2009
Informal
Irrigation
Kebele Name
Irrigation
BOLE BOKT
2009
2009
Informal
Informal
Irrigation
Kebele Name CHOYE
Irrigation cooperative
2009
2008
Informal
Informal
Honey production cooperative
Kebele Name DUKU
Irrigation cooperative
Kebele Name GUME
Irrigation cope
2010
2009
2005
Informal
Informal
Informal
Irrigation cope
Kebele Name KENIDA
Irrigation cooperation
2005
2004
Informal
Informal
National Disaster Risk Management
Commission (NDRMC)
Monday, February 25, 2019
Wereda SURIMA
Type of Members
pastoralist
pastoralist
Pastoralist
Pastoralist
Both
Male
Both
pastoralist
pastoralist
Both
Activity
To generate income
To generate income
To get income
To get income
To secure food security
To generate income
To secure food scarcity
To increase productivity, to get income
To increase productivity, to get income
Farming vegetable crop
239
Page 1 of 3
Wereda Disaster
Risk Profile
Data_Collected_Date
National Disaster Risk Management
Commission (NDRMC)
Monday, February 25, 2019
Region S.N.N.P
Zone BENCH MAJI
Selected Indicator
Capacity: Community Based Organizations in the Wereda
Name_Of_Organization
Est._Year
Formal/Informal
Wereda SURIMA
Type of Members
Activity
Irrigation cooperation
Female milling house
Female milling house
Kebele Name KOKA
Sand association cooperation
Sand association cooperation
MIll cooperation
MIll cooperation
Mining ( stone)
Mining ( stone)
Kebele Name KOTLA KORA
Irrigation cooperative
Kebele Name KURUMA
Irrigation corporation
Kebele Name MAJA
Female mill house
2004
2004
2004
2003
2003
2003
2003
2005
2005
2003
2009
2005
Informal
Formal
Formal
Formal
Formal
Informal
Informal
Informal
Informal
Informal
Informal
Informal
Both
Only female
Only female
Male
Male
Only female
Only female
Male
Male
Both
Both
Female
Farming vegetable crop
For saving money
For saving money
To sell sand generate income
To sell sand
To get powder
To get powder
To sell stone
To sell stone
Increasing income
To secure food
To minimize extravagance
240
Page 2 of 3
Wereda Disaster
Risk Profile
Data_Collected_Date
Region S.N.N.P
Zone BENCH MAJI
Selected Indicator
Capacity: Community Based Organizations in the Wereda
Name_Of_Organization
Est._Year
Formal/Informal
Irrigation cooperation
Kebele Name MOGA
Mining Cooperative
Kebele Name OROROMAY
Boraa Cooperation
Kebele Name REGIYA
Irrigation cooperative
Bordey cooperative
Millhouse cooperative
2005
2005
2009
2009
2010
2009
Informal
Informal
Informal
Informal
Informal
Informal
National Disaster Risk Management
Commission (NDRMC)
Monday, February 25, 2019
Wereda SURIMA
Type of Members
Both
Both
Both
Both
Female
Both
Activity
To facilitate agricultural activity
Extracting gold
To facilitate agricultural activities
To secure food security
To secure food scarcity
Facilitating millhouse activities
241
Page 3 of 3
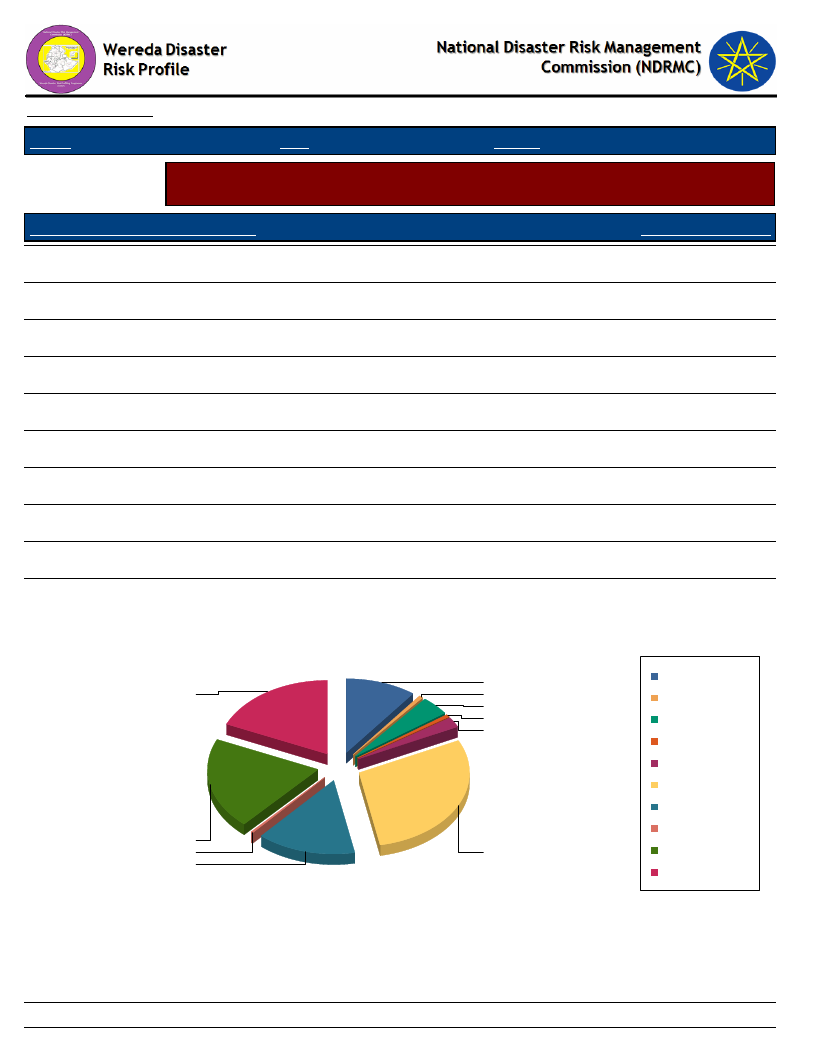
Data_Collected_Date
Region S.N.N.P
Zone BENCH MAJI
Wereda SURIMA
Monday, February 25, 2019
Selected Indicator
Supporting Agencies against Disasters - Percentage of households by supporting
institutions to handle or recover from disaster damages
Supporting Agencies Against Disasters
Response_Percentage
National or local authorities
14.29
International NGOs (e.g. UN organizations, ICRC, etc.)
2.08
Local NGOs
29.35
Family members in the same community
10.39
Friends and neighbors in the same community
4.16
Family members outside the community
0.52
Friends outside the community
0.52
Support via contacts working for the authorities
18.44
Support via contacts working for NGOs
20.00
None
0.26
Supporting Agencies Against Disasters
18.4
20
0.3
14.3
10.4
0.5
4.2
0.5
2.1
29.4
Family members in the
same community
Family members outside
the community
Friends and neighbors in
the same community
Friends outside the
community
International NGOs (e.g.
UN organizations, ICRC,
etc.)
Local NGOs
National or local
authorities
None
Support via contacts
working for NGOs
Support via contacts
working for the authorities
242
Page 1 of 1
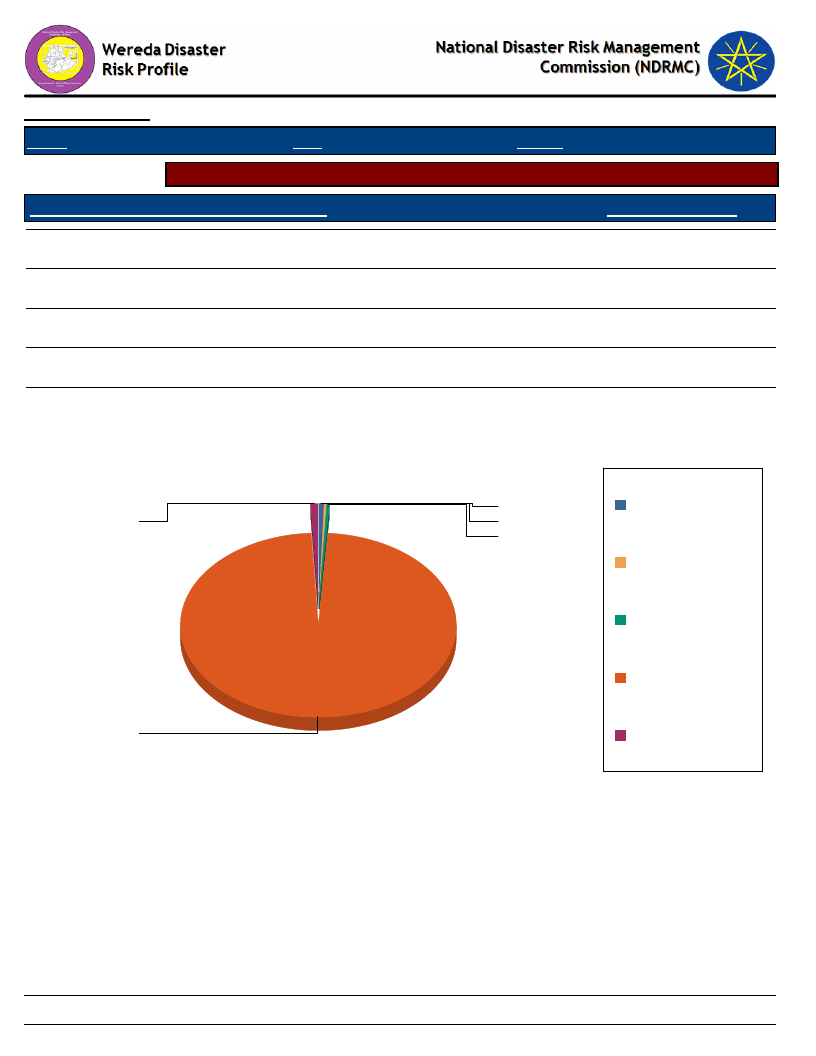
Data_Collected_Date
Region S.N.N.P
Zone BENCH MAJI
Monday, February 25, 2019
Wereda SURIMA
Selected Indicator
Types of support received by households during disasters
Type of Support Provided By Supporting Agencies
Response_Percentage
Emergency aid (food, water, shelter, etc.)
98.18
Capital for re-construction of house and property
0.26
New house
0.78
Access to capital or loan for adaptation/protection measures
0.52
Assets such as livestock replenishment
0.26
Type of Support Provided By Supporting Agencies
Access to capital or
loan for
1
adaptation/protection
1
0
measures
0
Assets such as
livestock replenishment
Capital for
re-construction of
house and property
Emergency aid (food,
w ater, shelter, etc.)
98
New house
243
Page 1 of 1

Wereda Disaster
Risk Profile
Data_Collected_Date
Region S.N.N.P
Zone BENCH MAJI
National Disaster Risk Management
Commission (NDRMC)
Monday, February 25, 2019
Wereda SURIMA
Selected Indicator
Government Actors in the Field of Disaster Risk Management - Government actors and their activities in the field
of Disaster Risk Managements
Government Institution
Wereda Agriculture Office
Activity
Description
Irrigation
To secured food scarcity
Activity
Description
Mining
To save money
Activity
Description
Activity
Description
Government Institution
Wereda Education Office
Activity
Description
Awareness creation
School awareness their students on hazards about their family to ready to protect hazards
Activity
Description
Coordination
School coordinate when food dispatch or given to infected people
Activity
Description
Activity
Description
244
Page 1 of 3
Wereda Disaster
Risk Profile
Data_Collected_Date
Region S.N.N.P
Zone BENCH MAJI
National Disaster Risk Management
Commission (NDRMC)
Monday, February 25, 2019
Wereda SURIMA
Selected Indicator
Government Actors in the Field of Disaster Risk Management - Government actors and their activities in the field
of Disaster Risk Managements
Government Institution
Wereda Environmental Protection and Land Administration Office
Activity
Prevention
Description
Agro forestry activities activities crops to resist hazards
Activity
Description
Activity
Description
Activity
Description
Government Institution
Wereda Health Office
Activity
Description
To create awareness
Personal prevention
Activity
Description
Prepared drugs
To prevent disease
Activity
Description
Activity
Description
Distribute bed net
Prevent malaria
245
Page 2 of 3
Wereda Disaster
Risk Profile
Data_Collected_Date
Region S.N.N.P
Zone BENCH MAJI
National Disaster Risk Management
Commission (NDRMC)
Monday, February 25, 2019
Wereda SURIMA
Selected Indicator
Government Actors in the Field of Disaster Risk Management - Government actors and their activities in the field
of Disaster Risk Managements
Government Institution
Wereda Women and Children Office
Activity
To give awareness
Description
To give awareness for the rural area population about the drought and animal disease
Activity
Description
Activity
Description
Activity
Description
246
Page 3 of 3
Data_Collected_Date
Monday, February 25, 2019
Region S.N.N.P
Zone BENCH MAJI
Wereda SURIMA
Selected
Indicator
Non-Government Actors in the Field of Disaster Risk Management - Non-government
actors and their activities in the field of Disaster Risk Management
Non Governmental
Actors in the Wereda
Activities
Red cross
Supplying house properties
PCDP
To construct building school
Prepare infrastructure
247
Page 1 of 1
Wereda Disaster Risk
Profile
Data_Collected_Date
National Disaster Risk Management
Commission (NDRMC)
February 25, 2019
Region S.N.N.P
Selected Indicator:
Zone
BENCH MAJI
Interventions: Community Suggestions to Development Actors
Wereda SURIMA
Kebele Name
Type Of Disaster 1
Early Warning Indicator
ANIJO
Conflict
Slaughtering of goat, cow reading the intestine
No
Type Of Disaster 3
Early Warning Indicator
Preparedness Measure
Type Of Disaster 2
According EWI, Bume is coming under huge
condition so we ready to protect
No
Preparedness Measure
No
Type Of Disaster 4
Early Warning Indicator
Early Warning Indicator
Preparedness Measure
Preparedness Measure
Kebele Name
Type Of Disaster 1
Early Warning Indicator
Preparedness Measure
Type Of Disaster 2
Early Warning Indicator
Preparedness Measure
BANIKA
Crop disease
High temperature and desert fire
Storing food, selling animal
Type Of Disaster 3
Early Warning Indicator
Preparedness Measure
Type Of Disaster 4
Early Warning Indicator
Preparedness Measure
248
Page 1 of 10

Region S.N.N.P
Selected Indicator:
Zone
BENCH MAJI
Interventions: Community Suggestions to Development Actors
Wereda SURIMA
Kebele Name
Type Of Disaster 1
Early Warning Indicator
BEBUSIN
Drought
Traditionally reading the intestine of animals
Type Of Disaster 3
Early Warning Indicator
Preparedness Measure
Storing food
Preparedness Measure
Type Of Disaster 2
Early Warning Indicator
Type Of Disaster 4
Early Warning Indicator
Preparedness Measure
Preparedness Measure
Kebele Name
Type Of Disaster 1
Early Warning Indicator
Preparedness Measure
Type Of Disaster 2
Early Warning Indicator
Preparedness Measure
BOLE BOKT
No
No
No
Type Of Disaster 3
Early Warning Indicator
Preparedness Measure
No
Type Of Disaster 4
Early Warning Indicator
Preparedness Measure
249
Page 2 of 10

Region S.N.N.P
Selected Indicator:
Kebele Name
Type Of Disaster 1
Zone
BENCH MAJI
Interventions: Community Suggestions to Development Actors
BORIKA
No
Type Of Disaster 3
Wereda SURIMA
Early Warning Indicator
Early Warning Indicator
Preparedness Measure
Preparedness Measure
Type Of Disaster 2
Early Warning Indicator
Type Of Disaster 4
Early Warning Indicator
Preparedness Measure
Preparedness Measure
Kebele Name
Type Of Disaster 1
Early Warning Indicator
Preparedness Measure
Type Of Disaster 2
Early Warning Indicator
Preparedness Measure
KOTLA KORA
Crop disease
High temperature consecutive
Storing food
Type Of Disaster 3
Early Warning Indicator
Preparedness Measure
Type Of Disaster 4
Early Warning Indicator
Preparedness Measure
250
Page 3 of 10
Region S.N.N.P
Selected Indicator:
Zone
BENCH MAJI
Interventions: Community Suggestions to Development Actors
Wereda SURIMA
Kebele Name
Type Of Disaster 1
Early Warning Indicator
MAJA
Drought
High temperature and desert fire
Type Of Disaster 3
Early Warning Indicator
Preparedness Measure
Storing food selling animal and saving money
Preparedness Measure
Type Of Disaster 2
Early Warning Indicator
Type Of Disaster 4
Early Warning Indicator
Preparedness Measure
Preparedness Measure
Kebele Name
Type Of Disaster 1
Early Warning Indicator
Preparedness Measure
Type Of Disaster 2
Early Warning Indicator
Preparedness Measure
DISHO
Drought
Looking the intestine of the cattle
Storing food
Type Of Disaster 3
Early Warning Indicator
Preparedness Measure
Type Of Disaster 4
Early Warning Indicator
Preparedness Measure
251
Page 4 of 10

Region S.N.N.P
Selected Indicator:
Kebele Name
Type Of Disaster 1
Zone
BENCH MAJI
Interventions: Community Suggestions to Development Actors
DUKU
Type Of Disaster 3
Wereda SURIMA
Early Warning Indicator
Early Warning Indicator
Preparedness Measure
Preparedness Measure
Type Of Disaster 2
Early Warning Indicator
Type Of Disaster 4
Early Warning Indicator
Preparedness Measure
Preparedness Measure
Kebele Name
Type Of Disaster 1
Early Warning Indicator
Preparedness Measure
Type Of Disaster 2
Early Warning Indicator
Preparedness Measure
GUME
No
Type Of Disaster 3
Early Warning Indicator
Preparedness Measure
Type Of Disaster 4
Early Warning Indicator
Preparedness Measure
252
Page 5 of 10

Region S.N.N.P
Selected Indicator:
Zone
BENCH MAJI
Interventions: Community Suggestions to Development Actors
Wereda SURIMA
Kebele Name
Type Of Disaster 1
Early Warning Indicator
HARITEGA
Drought
Traditionally reading the intestine of the animal
Type Of Disaster 3
Early Warning Indicator
Preparedness Measure
Storing food
Preparedness Measure
Type Of Disaster 2
Early Warning Indicator
Type Of Disaster 4
Early Warning Indicator
Preparedness Measure
Preparedness Measure
Kebele Name
Type Of Disaster 1
Early Warning Indicator
Preparedness Measure
Type Of Disaster 2
Early Warning Indicator
Preparedness Measure
CHOYE
Type Of Disaster 3
Early Warning Indicator
Preparedness Measure
Type Of Disaster 4
Early Warning Indicator
Preparedness Measure
253
Page 6 of 10

Region S.N.N.P
Selected Indicator:
Zone
BENCH MAJI
Interventions: Community Suggestions to Development Actors
Wereda SURIMA
Kebele Name
Type Of Disaster 1
Early Warning Indicator
KENIDA
Conflict
High temperature and desert fire
Type Of Disaster 3
Early Warning Indicator
Preparedness Measure
Storing food , selling animal
Preparedness Measure
Type Of Disaster 2
Early Warning Indicator
Type Of Disaster 4
Early Warning Indicator
Preparedness Measure
Preparedness Measure
Kebele Name
Type Of Disaster 1
Early Warning Indicator
Preparedness Measure
Type Of Disaster 2
Early Warning Indicator
Preparedness Measure
KOKA
Conflict
High Temprature and desert fire
Storing food, selling animal
Type Of Disaster 3
Early Warning Indicator
Preparedness Measure
Type Of Disaster 4
Early Warning Indicator
Preparedness Measure
254
Page 7 of 10

Region S.N.N.P
Selected Indicator:
Kebele Name
Type Of Disaster 1
Zone
BENCH MAJI
Interventions: Community Suggestions to Development Actors
KURUMA
Type Of Disaster 3
Wereda SURIMA
Early Warning Indicator
Early Warning Indicator
Preparedness Measure
Preparedness Measure
Type Of Disaster 2
Early Warning Indicator
Type Of Disaster 4
Early Warning Indicator
Preparedness Measure
Preparedness Measure
Kebele Name
Type Of Disaster 1
Early Warning Indicator
Preparedness Measure
Type Of Disaster 2
Early Warning Indicator
Preparedness Measure
MOGA
Conflict
Shortage of source, increasing temperature
occurring fire
Storing food, selling livestock
Type Of Disaster 3
Early Warning Indicator
Preparedness Measure
Type Of Disaster 4
Early Warning Indicator
Preparedness Measure
255
Page 8 of 10

Region S.N.N.P
Selected Indicator:
Zone
BENCH MAJI
Interventions: Community Suggestions to Development Actors
Wereda SURIMA
Kebele Name
Type Of Disaster 1
Early Warning Indicator
OROROMAY
Drought
Thronging and predicting
Type Of Disaster 3
Early Warning Indicator
Preparedness Measure
Type Of Disaster 2
Prepare and storing food, selling livestock and
saving money
Preparedness Measure
Type Of Disaster 4
Early Warning Indicator
Early Warning Indicator
Preparedness Measure
Preparedness Measure
Kebele Name
Type Of Disaster 1
Early Warning Indicator
Preparedness Measure
Type Of Disaster 2
Early Warning Indicator
Preparedness Measure
REGIYA
Drought
Shoe throwing and predicting
Preparing and storing food, selling livestock and
saving money
Type Of Disaster 3
Early Warning Indicator
Preparedness Measure
Type Of Disaster 4
Early Warning Indicator
Preparedness Measure
256
Page 9 of 10

Region S.N.N.P
Selected Indicator:
Zone
BENCH MAJI
Interventions: Community Suggestions to Development Actors
Wereda SURIMA
Kebele Name
Type Of Disaster 1
Early Warning Indicator
TULIGIT
Conflict
Slaughtering goat and read intestine
Type Of Disaster 3
Early Warning Indicator
Preparedness Measure
Migration, partially ready for counter attack
Preparedness Measure
Type Of Disaster 2
Early Warning Indicator
Preparedness Measure
Flood
Slaughtering goats and read intestine
Migration
Type Of Disaster 4
Early Warning Indicator
Preparedness Measure
257
Page 10 of 10
Wereda Disaster Risk
Profile
Data_Collected_Date
Region S.N.N.P
Zone
BENCH MAJI
National Disaster Risk Management
Commission (NDRMC)
Monday, February 25, 2019
Wereda SURIMA
Selected Indicator
Wereda Strengths, weaknesses, opportunites and treats (SWOT) Analysis
Kebele Name
KOTLA KORA
MAJA
DISHO
DUKU
CHOYE
KURUMA
MOGA
Strength
- High social interaction
- High indigenous
knowledge
- High social interaction
- High social interaction
- High social interaction
- Increase social
interaction
- High social interaction
- High social interaction
- High social interaction
- Indigenous knowledge
OROROMAY
- High social interaction
- Ingenious knowledge
Weakness
- Low work culture
- Lack of early warning
system
- Low work culture lack of
knowledge
- Low work culture
- Poor participation
- Low work culture , lack of
awareness
- Low work culture
- Low work culture, lack of
awareness
- Low work culture, lack of
awareness
- Lack of early warning
system
- Low work culture, lack of
awareness
- Lack of early warning
system
Opportunity
- Availability of government
- Access of improved seed
- Availability of government
support
- Availability of government
- Availability of micro finance
- Availability of government
- Availability of government
- Availability of governments
- There is no available NGO
and government facilities
- There is access of improved
seed
- Availability of government
- Access to agriculture like
improved seed
Threat
- No answer
- Insufficient rain fall for
crop production
- They supposed the land
is taken by the government
- They supposed the land
is taken by the government
- Work of skills and
knowledge
- Loss of position or
attitude
- They supposed the land
is taken by the government
- They suppose the land
taken by the government
- Shortage of rain fall
- They supposed the land
is taken by government
- In sufficient rain fall for
crop production
258
Page 1 of 2

Wereda Disaster Risk
Profile
Data_Collected_Date
Region S.N.N.P
Zone
BENCH MAJI
National Disaster Risk Management
Commission (NDRMC)
Monday, February 25, 2019
Wereda SURIMA
Selected Indicator
Wereda Strengths, weaknesses, opportunites and treats (SWOT) Analysis
Kebele Name
REGIYA
TULIGIT
Strength
- High social interaction
- Indegnious knowladgefor
water resource
management practices
- Increased social
interaction
- Favorable agro climate
condition for agriculture
- High social interaction
Weakness
- Low work culture, lack of
awareness
- Lack of people control
early warning system
- Low work culture, lack of
awareness
- Low work culture,
extensive farming, zero
tillage agriculture
- The productive parts of
the community participation
is weak
Opportunity
- Availability of NGOs and
micro finance
- Access to agricultural
extension service
- Availability of NGOs
- Good soil fertility, good
extension, communication
service
- Availability of micro finance
Threat
- They supposed the land
is taken by the government
- Erratic rain fall,
insufficient rain fall for
crop production
- Loss of position or
attitude of suspect
- Youth participation is
weak, lack of skill
- Lack of skill and
knowledge
259
Page 2 of 2