


NATIONAL
DISASTER RISK MANAGEMENT COMMISSION
(NDRMC)
WOREDA DISASTER RISK PROFILE (WDRP)
REGION: S.N.N.P
ZONE: SOUTH OMO
WEREDA: NYANGATOM
December, 2020
Addis Ababa

About the National Disaster Risk Management Commission (NDRMC)
The National Disaster Risk Management Commission (NDRMC) was reestablished in
December 2015 and recognized by an act of Council of Ministers (Regulation No.
363/2015) as an autonomous Federal Government office mandated to conduct
appropriate activities for the comprehensive implementation and realization of the
objectives of the National Disaster Risk Management Policy and Strategy and to
coordinate, monitor and provide appropriate support with respect to activities
carried out by the lead sector institutions.
Address: Kirkos Sub-city Behind Dembel City Center, Addis Ababa, Ethiopia.
P.O.Box: 5686
Tele: 0115524259/4272
Website: www.dppc.gov.et
© 2020 National Disaster Risk Management Commission. All rights reserved
Printed in Addis Ababa, Ethiopia.
Citation- This Document May be Cited as Follows:
National Disaster Risk Management Commission (2020), Nyangatom Woreda Disaster
Risk Profile, Addis Ababa, Ethiopia.

PREFACE
Ethiopia is well aware of the impact that disasters can have on the
development goals that we are rigorously pursuing through our
Growth and Transformation Plan II. With this recognition we started
a paradigm shift a few years ago, largely triggered by the revised
National Policy and Strategy on Disaster Risk Management.
To make the DRM programme implementation in the country well-informed, a
comprehensive information management system is required. We have been undertaking
a comprehensive risk assessment exercise under which Disaster Risk Profiles are being
prepared for each district and at sub-district levels in the country.
This Wereda Disaster Risk Profile establishes an extensive database on disaster risk
elements that will help decision makers at all levels to be better informed at community
and Wereda level about the characteristics of potential hazards, their potential
exposure, vulnerabilities of communities, capacities and that can also be an input for
Wereda Disaster Risk Reduction Plans and area specific early warning tools.
Wereda Disaster Risk Profiles developed are publically available here for the use of all
development partners and government sectors at all levels. Also, other data sources of
NDRMC, such as Desinventar, Livelihood Baseline and the Early Warning information will
be integrated and harmonized with this Information Management System.
Finally, we need to acknowledge the support of partners who have funded this
programme and we also look for the support of donors and all development partners in
order to achieve the ambitious indicators of this risk information and providing every
district with the disaster risk profile and their respective risk-informed plans.
H.E. Ato Mitiku Kassa
Commissioner
National Disaster Risk Management Commission (NDRMC)
The Federal Democratic Republic of Ethiopia (FDRE)

PREFACE
Woreda Disaster Risk Profiling (WDRP) is a government owned
programme undertaken by the National Disaster Risk
Management Commission (NDRMC) in collaboration with regional
DRM offices and development partners to provide baseline
information for disaster risk management practices and
activities in the country. The programme is designed by taking
into account the experiences gained from the implementation of pervious strategies
and actions like the Hygo Framework for Action (2000-2015) and the Sendai Framework
for Disaster Risk Reduction (2015-2030).
WDRP is composed of diversified indicators including hazard related issues, crop and
livestock production, landholding and environmental issues, human and livestock health
issues, education and social issues at wereda and kebele level. It provides basic and
detailed indicators with both quantitative and qualitative information which obtained
from both primary and secondary data sources.
Moreover, two pages summary of profiles is also prepared to help users easily
understand WDRP results for each wereda without going into detail for all indicators.
In addition to this booklet, developed profiles are uploaded on WDRP website
(http://profile.ndrmc.gov.et) to be viewed by all users; we encourage all DRM actors
at all levels to use this profile as baseline information for all DRM initiatives.
This WDRP booklet was produced through exemplary collaboration of all concerned
bodies and I would like to give my deepest gratitude to all who directly or indirectly
contribute for the success of the programme particularly for data enumerators and
supervisors, data encoders and profile development teams, consultants and advisors,
partner ministries and all DRM stakeholders.
Abraham Abebe
Director
Disaster Risk Reduction and Rehabilitation Directorate (DRRRD)
National Disaster Risk Management Commission (NDRMC)
Contents
No. Indicator Name
Page
General Information
I
Preface
II
Wereda Location in Ethiopian Map
III
Methodology
IV
Summary Profile
Hazard Related Characteristics
1
1
Biological Hazards of the Wereda
2
2
Geological Hazards of the Wereda
3
3
Hydro Metrological Hazards of the Wereda
4
4
Socio Economic Hazards of the Wereda
5
5
Technological Hazards of the Wereda
6
6
Disaster Characteristics By Kebele
7
7
Hazards: Conflict as an Issue
25
Hazard Situation During Last Disaster - Characteristics of most recent disaster that
8
affected the community
27
9
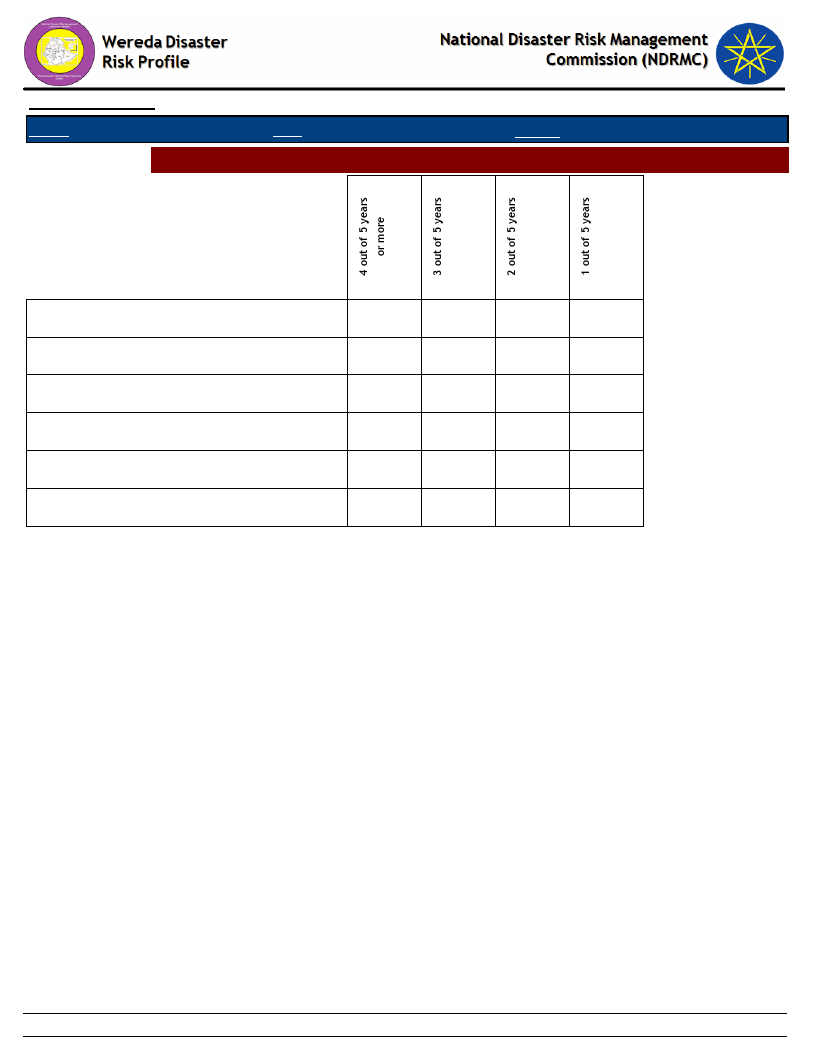
Frequency of Disaster Occurrence
31
10
Household Exposure to Hazards
32
11
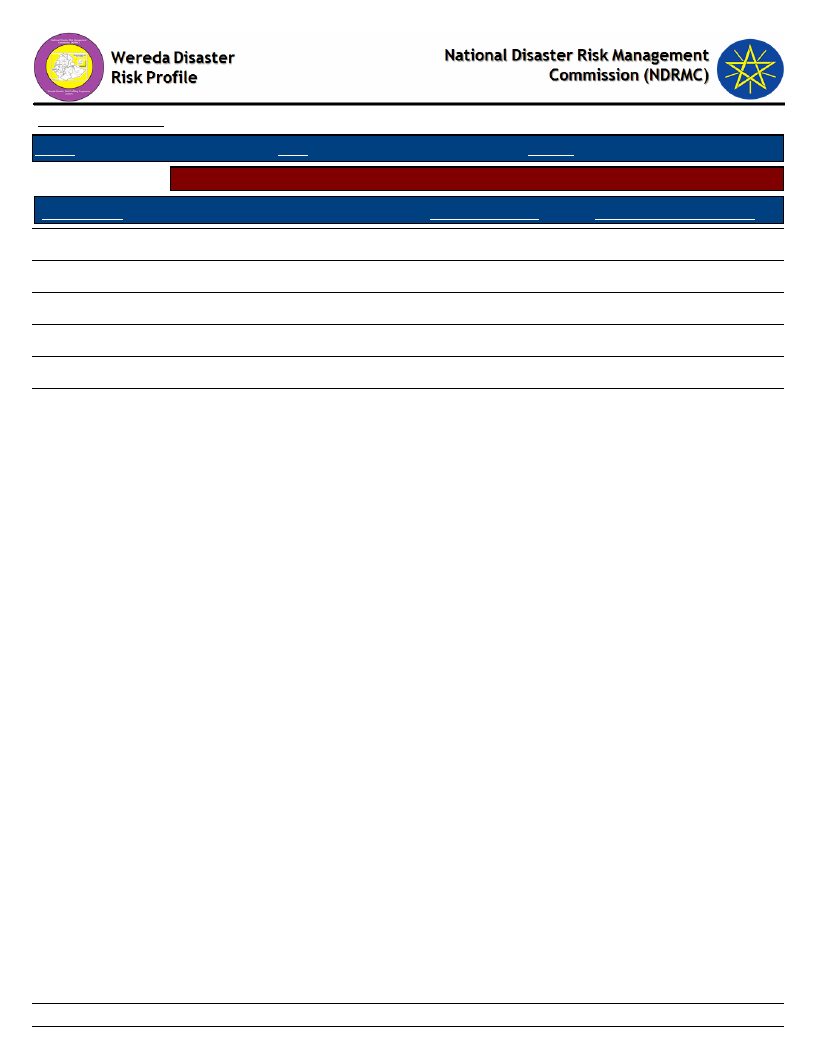
Months of Occurrence of Frequent Disasters
33
12
Conflicts: Perception of households on conflict issues - Is conflict an issue in this
community?
34
13
Conflicts: Perception of households on conflict issues - Who do you turn to in case
of a conflict?
35
14
Losses from Disasters - Losses from all disasters (household response in %)
36
15
Losses from Disasters - Main Losses by Type of Disasters (household response in %) 37
16
Losses from Disasters - Secondary Losses by Type of Disasters (household response
in %)
40
17
Seasonal Calendar for Hazards, Activities and Income Level By Kebele
43
No. Indicator Name
Page
Infrastructure Access Characteristics
18
Physical Vulnerability: Access to Roads & Urban Centres - Households access to
road and urban centre
64
19
Physical Vulnerability: Access to Electricity - Households’ access and utilization of
electricity
65
20
Physical Vulnerability: Type of Dwelling Units - Households’ type of dwelling houses 66
Socio Demographic Characteristics
21
Economic Vulnerability: Level of Migration - Migration level and its characteristics
by Kebele
68
22
Economic Vulnerability: Household Migration - Household migration and reason for
migration
70
23
Economic Vulnerability: Household Migration - Disasters as a triggering factor for
migration (households response in %)
71
24
Demography: Population Structure
72
25
Demography: Population Trends and Ethnic Groups
74
26
Social Vulnerability: Household Demographic Characteristics - Demographic
characteristics of households
75
Social Vulnerability: Level of Educational Attainment - Education status of
27
household members
76
28
Social Vulnerability: Gender Parity - Gender parity in education level (7+ years)
and household heading
77
Environmental Characteristics
29
Environmental Situation: Environmental Problems - Major environmental problems
by Kebele
79
30
Environmental Situation: General Land Quality - Perceptions of the community
on changes in the general quality of land over a decade
81
31
Environmental Situation: Changes in Landscape - Changes observed by the
community on landscape and the problems due to the changes
83
32
Environmental Situation: Land-Use other than crop production - Types of land use
other than crop production across Kebeles
85
33
Environmental Situation: Deforestation - Observed changes over levels of
deforestation by the community and its problems
87
No. Indicator Name
Page
34
Environmental Situation: Natural Resources Availability - Natural resources
available and changes observed by the community
89
35
Environmental Situation: Rainfall & Temperature - Observed changes on rainfall
and temperature by the community over the last decade
99
36
Environmental Situation: Reasons for Environmental Changes
101
37
Environmental Situation: Soil Erosion - Observed changes on levels of soil erosion
by the community
102
Livelihood, Occupation and Source of food
38
Economic Vulnerability: Major Occupational Categories - Major categories of
occupation and percent of population engaged in the occupation by Kebele
105
Economic Vulnerability: Livelihoods - Households important sources of
39
livelihood (response in %)
107
40
Economic Vulnerability: Occupational Categories - Percent of population above 15
years age by occupation categories
108
41
Economic Vulnerability: Sources of Food - Households source for different food
items (response in %)
109
Crop Production
42
Hazards: Change in Crop Damages - Proportion of total crop damage (percentage
response by households)
112
43
Hazards: Change in Crop Damages - Major reasons for crop damage (percentage
response by households)
113
44
Hazards: Change in Crop Damages - Proportion of Damage for Major Crops
(percentage response by households)
114
Hazards: Change in Crop Damages - Reasons for Damage of Major Crops
45
(percentage response by households)
115
46
Agricultural Situation: Change in Crops Grown - Five major crops grown by
116
proportion of total cultivated land
47
Agricultural Situation: Access to Extension - Perception of the community on
Access to Agricultural extension Services
117
48
Economic Vulnerability: Crops Grown - Types of crops grown by households
119
49
Economic Vulnerability: Crops Grown - Proportion of households by amount of yield
of major crops (last year)
120
50
Economic Vulnerability: Crops Grown - Proportion of households by amount of yield
of major crops (Five years ago)
121
51
Economic Vulnerability: Land Ownership and Quality - Landownership of households 122
No. Indicator Name
Page
52
Economic Vulnerability: Land Ownership and Quality - Farmers’ perception on the
quality of their agricultural land
123
53
Agricultural Situation: Access to Inputs - Perception of the community on access
to improved agricultural inputs
124
54
Agricultural Situation: Water for irrigation - Access to water for irrigation in the
community
126
55
Agricultural Situation: Soil Fertility - Perception of the community on soil fertility
and its change over time
127
56
Economic Vulnerability: Status of Agriculture - Methods of tillage, Irrigation and
other agricultural input utilization by households
129
57
Economic Vulnerability: Change in Agricultural Situation - Households
perception on changes of crop type, size of cultivated area and crop yields
130
58
Economic Vulnerability: Crops Grown - Number of crops grown by households
132
Livestock Production
59
Agricultural Situation: Status of Livestock Disease - Change In Livestock Disease
Status By Kebele
134
60
Livestock Prevalent of Diseases & Veterinary Facility - Livestock Diseases
Prevalence
136
61
Livestock Prevalent of Diseases & Veterinary Facility - Evaluation of Access to
Veterinary Services and Livestock Drugs
137
62
Agricultural Situation: Water Availability for Livestock - Water availability for
livestock in the community
138
63
Agricultural Situation: Livestock Diversity - Type of livestock and their economic
importance in the community
140
64
Economic Vulnerability: Livestock Ownership and Changes - Percentage of
households by number and type of livestock owned
145
65
Economic Vulnerability: Livestock Ownership and Changes - Households’ perception
on changes in livestock number in the last five years (response in %)
147
66
Economic Vulnerability: Livestock Ownership and Changes - Households
perception on changes in livestock number in the last five years (response in %)
148
67
Agriculture (Livestock): Pasture Availability - Households’ perception on access and
quality of pasture
152
68
Agriculture (Livestock): Pasture Availability - Households’ perception on
problematic months for pasture availability
153
No. Indicator Name
Page
69
Agriculture (Livestock): Water Availability - Households’ response on water
availability for livestock
154
70
Agriculture (Livestock): Water Availability - Households’ perception on problematic
months of water availability for livestock
155
71
Agriculture (Livestock): Water Availability - Sources of water for livestock
(households response in %)
156
Access to Markets and Credit
72
Economic Vulnerability: Proportion of Produce Sold and Market - Proportion of
crops and livestock sold from total production and markets
158
73
Economic Vulnerability: Kebele Access to Markets - Access to market by Kebele
160
74
Economic Vulnerability: Formal & Informal Transfers - Percentage of households
reporting received formal transfers
161
75
Capacity: Access to Credit Facilities - Households access to credit facilities
163
76
Capacity: Access to Credit Facilities - Percentage of households by major reasons
of borrowing money
164
77
Capacity: Access to Credit Facilities - Percentage of households by major sources
of credit
165
78
Capacity: Access to Credit Facilities - Percent of households with ability to raise
500 birr in one week
166
Health and Sanitation Characteristics
79
Household Access to Health Facilities - Where do patients go for health care?
168
80
Hazards: Health problems and changes over the last decade
169
81
Household Health Status - Households’ health condition and major health problems 171
Household Access to Sanitation - Percentage of households with access to different
82
kind of toilet facilities
173
83
Household Access to Drinking Water - Sources of drinking water for households
(response in %)
174
84
Household Access to Drinking Water - Households’ methods of treating drinking
water
175
85
Household Access to Drinking Water - Number of times households fetch water in a
week
176
No. Indicator Name
86
Household Access to Drinking Water - Time taken per day to fetch water for
households
Coping Mechanisms and Preparedness Measures
87
Capacity: Community Preparedness against Sudden Onset Disasters
88
Capacity: Community Preparedness against Increase in Disaster Intensity
89
Capacity: Community Preparedness against Disasters
90
Hazard: Coping and recovering during last Disaster
91
Capacity: Type Community Participation
Capacity: Recovery from Losses from Disasters - Percentage of Households who
92
have managed to recover from losses of disasters
Capacity: Coping Strategies Adopted by Households - Main coping strategies
93
adopted by households to recover from respective losses
Page
177
179
182
185
188
198
199
200
94
Capacity: Coping Strategies Adopted by Households - Percentage of households
by frequency of main coping strategies adopted
204
95
Capacity: Alternative Livelihood Sources - Alternative livelihood sources suggested
by the community
206
96
Capacity: Recovery from Losses from Disasters - Percentage of households
recovered from past disasters by type of Disasters
208
97
Capacity: Recovery from Losses from Disasters - Proportion of households
209
recovered by type of Losses
98
Capacity: Coping Options if More Resources Available - What coping strategy could
be adopted if more resource were available?
210
Capacity: Coping Strategies Adopted by Households - Percentage of households by
99
major type of coping strategies adopted (at least once)
211
101
Capacity: Coping Strategies Adopted by Households - Main coping strategies
212
adopted by households for respective disasters
102
Capacity: Coping Strategies Adopted by Households - Secondary coping strategies
adopted by households for respective disasters
217
No. Indicator Name
Page
Community Perception and Suggestions
Interventions: Community Perception on Mediums to Influence DRM Actors -
103
Community perception on the effectiveness of institutional channels to use to
221
influence DRM actors
Interventions: Community Perception on their Knowledge used in DRM Process -
104
Perception of the community on how their knowledge influences the priorities and 226
measures of DRM actors
105
Interventions: Suggestions to DRM Actors in the Area - Community suggested
measures to DRM actors in the area for effective DRM actions
228
106
Economic Vulnerability: Community Suggestions to Improve Economic Situation -
Community suggested measures to improve the economic situation of the area
232
107
Community Awareness of Disaster Risk Management System and Actors
236
Community Perception of DRM System and Actors - Perception of the community on
108
the effectiveness of DRM system in helping them to prevent, cope and recover
246
from disasters
109
Major Public Interventions Desired - Percentage of households by type of
intervention desired
249
Others
110
Capacity: Community Based Organizations
252
111
Supporting Agencies against Disasters - Percentage of households by supporting
institutions to handle or recover from disaster damages
254
112
Types of support received by households during disasters
255
113
Government Actors in the Field of Disaster Risk Management - Government actors
and their activities in the field of Disaster Risk Managements
256
114
Non-Government Actors in the Field of Disaster Risk Management - Non-government
actors and their activities in the field of Disaster Risk Management
259
115
Interventions: Community Suggestions to Development Actors
260
116
Wereda SWOT Analysis
270

WEREDA
SUMMARY DISASTER RISK PROFILE
INFORMATION
III
WDRP Indicators
Hazard Related Characteristics
1
Wereda Disaster
Risk Profile
National Disaster Risk Management
Commission (NDRMC)
Data_Collected_Date
Tuesday, July 31, 2012
Region S.N.N.P
Zone
SOUTH OMO
Wereda
NYANGATOM
Selected Indicator
Biological Hazards of the Wereda
Hazard_Name
Hazard_Sub_Type
Stack borer
Army Worm
Hazard_Sub_Type
Malaria
Diarrhea
Malnutrition
Typhoid and typhus
Hazard_Sub_Type
FMD
LSD
Trip
Pasteullosis
Anthrax
Cause_Of_Hazard
Crop pest and diseases
Erratic rainfall
Poor agronomic practices
Increasing temperature
Human diseases
Poor sanitation and hygiene
Poor mealing habit
Shortage of water
Presence of waste disposals
Livestock diseases
Shortage of pasture and water
Internal and external parasites
Effects_Of_Hazard
Crop damage
Loss of income and livelihood
Death of human beings
Loss of working power
Regular illness and treatment
Death of livestock
Loss of income
Loss of livelihood
Page 1 of 1
2

Wereda Disaster
Risk Profile
National Disaster Risk Management
Commission (NDRMC)
Data_Collected_Date
Tuesday, July 31, 2012
Region S.N.N.P
Zone
SOUTH OMO
Wereda
NYANGATOM
Selected Indicator
Geological Hazards of the Wereda
Hazard_Name
Hazard_Sub_Type
Not reported
Cause_Of_Hazard
Geological Hazards
Effects_Of_Hazard
Page 1 of 1
3
Wereda Disaster
Risk Profile
National Disaster Risk Management
Commission (NDRMC)
Data_Collected_Date
Tuesday, July 31, 2012
Region S.N.N.P
Zone
SOUTH OMO
Wereda
NYANGATOM
Selected Indicator
Hydro Metrological Hazards of the Wereda
Hazard_Name
Hazard_Sub_Type
Drought
Cause_Of_Hazard
Hydro metrological hazards
Erratic rainfall
Deforestation
Effects_Of_Hazard
Damage of pasture and water
Loss of income
Death of livestock
Increasing malnutrition
Increasing of School drop out
Page 1 of 1
4
Wereda Disaster
Risk Profile
National Disaster Risk Management
Commission (NDRMC)
Data_Collected_Date
Tuesday, July 31, 2012
Region S.N.N.P
Zone
SOUTH OMO
Wereda
NYANGATOM
Selected Indicator
Socio Economic Hazards of the Wereda
Hazard_Name
Hazard_Sub_Type
Conflict
Cause_Of_Hazard
Socio economic hazards
Competition over resources like pasture
and water
Border demarcation
Effects_Of_Hazard
Loss of human life
Theft and bribery
Page 1 of 1
5

Wereda Disaster
Risk Profile
National Disaster Risk Management
Commission (NDRMC)
Data_Collected_Date
Tuesday, July 31, 2012
Region S.N.N.P
Zone
SOUTH OMO
Wereda
NYANGATOM
Selected Indicator
Technological Hazards of the Wereda
Hazard_Name
Hazard_Sub_Type
Not Reported
Cause_Of_Hazard
Technological hazards
Effects_Of_Hazard
Page 1 of 1
6

Wereda Disaster
Risk Profile
National Disaster Risk Management
Commission (NDRMC)
Data_Collected_Date
Friday, July 12, 2019
Region S.N.N.P
Zone SOUTH OMO
Wereda NYANGATOM
Selected Indictor:
Kebele Name
AYEPA
KAJAMAKEN
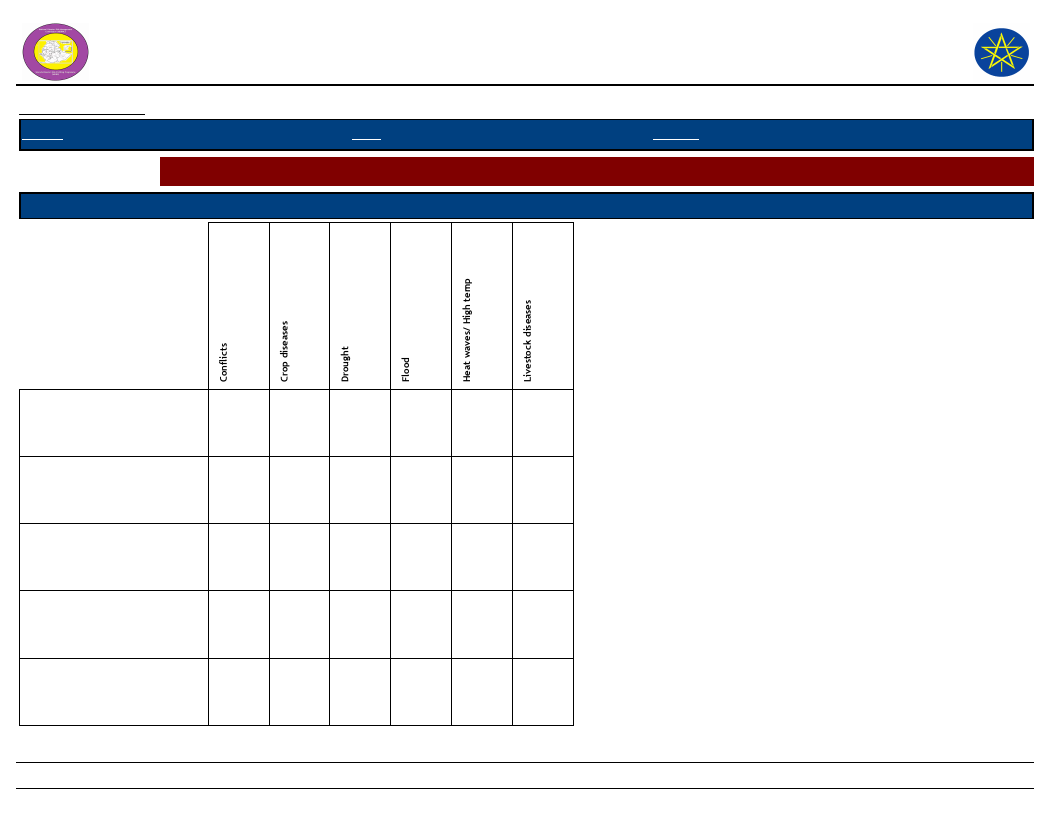
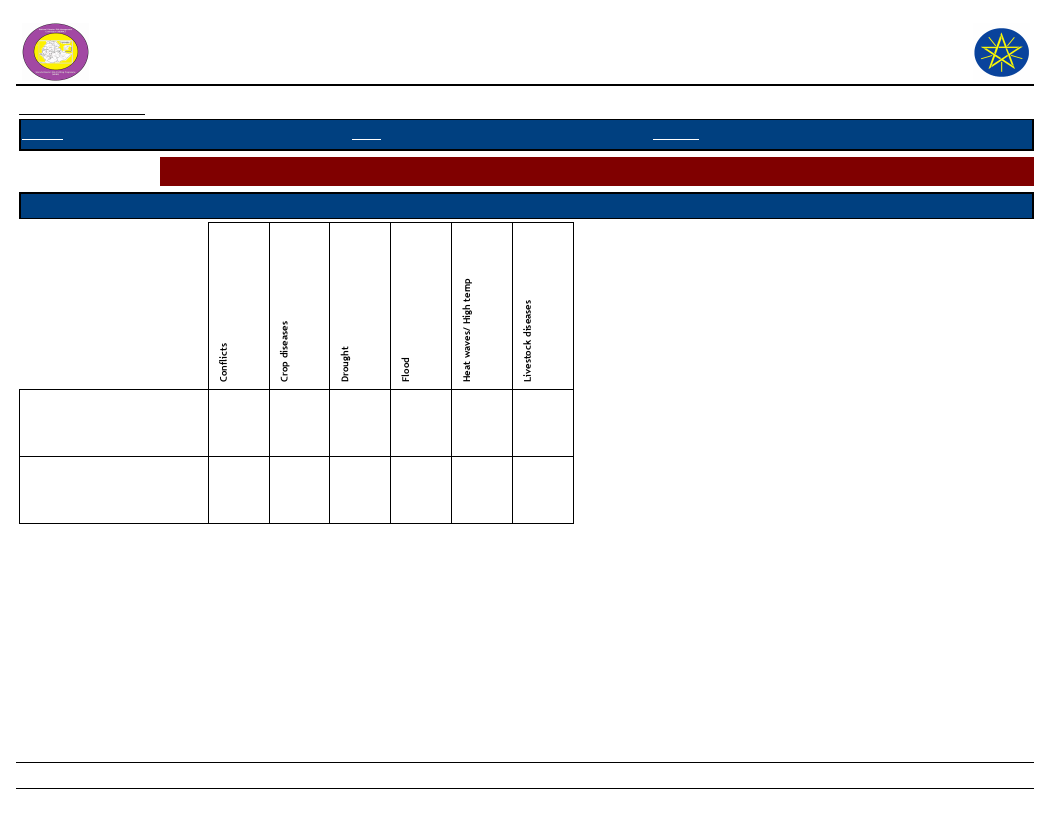
Disaster Characteristics By Kebele
Disaster_Type Common Period
Year
Worst_ Trends of
Occured Year Effects
Drought
February,
March, April
1999,
2002,
2008,
2009
2009
Increased
Conflicts
Livestock
diseases
Drought
February,
March, April
February,
March, April
January,
February, March
1997,
1998,
2001,
2003,
2008,
2009
2003,
2004,
2007,
2009
1993,
1994,
2007,
2008,
2009
2009
Increased
2009
Increased
2009
Increased
Root Causes
Shortage of
rain fall,
deforestation
, over
grazing, high
wind
Shortage of
pasture and
land
Shortage of
feed,
shortage of
ran
Deforestation
, shortage of
rain fall
Effects
Shortage of
pasture and
water
Death of
human,
livestock
were stolen
Death of
livestock,
loss of
income
Shortage of
pasture,
death of
livestock,
crop failure,
loss of
income
Vulnerability
Harsh environment
Settlement of
community to
nearest, shortage of
water and pasture
Livestock herd size
and over grazing
land
Coping Strategy
Migration
Migration
Migration
7
Page 1 of 18

Wereda Disaster
Risk Profile
National Disaster Risk Management
Commission (NDRMC)
Data_Collected_Date
Friday, July 12, 2019
Region S.N.N.P
Zone SOUTH OMO
Wereda NYANGATOM
Selected Indictor:
Kebele Name
KAJAMAKEN
Disaster Characteristics By Kebele
Disaster_Type Common Period
Livestock
diseases
March, April,
May
Year
Occured
2007,
2008,
2009
Worst_
Year
2009
Trends of
Effects
Increased
Conflicts
All month of the
year
Every
year
2008
Increased
Root Causes
Shortage of
pasture,
environment
favorability
for disease
causing agent
Shortage of
pasture and
water
KEBELE 01
Drought
December
Livestock
diseases
December
Human
diseases
November
2003,
2005,
2007
2007
Increased
Climate
change,
shortage of
rain fall
20058
2005
Decreased Climate
change, flood
2003
2003
Decreased Drought
Effects
Death of
livestock,
decreasing
income
Vulnerability
Poor veterinary
service
Death of
human,
livestock
were stolen,
loss of crop,
migration
Loss of
livestock and
livestock
production,
shortage of
food,
Death of
livestock,
loss of
income
Shortage of
water and
food, poor
living
condition
Coping Strategy
Report to
government,
migration
No strategic
designed rather than
fighting
Migration
Medical treatment,
isolate infected one
Medical treatment
8
Page 2 of 18

Wereda Disaster
Risk Profile
National Disaster Risk Management
Commission (NDRMC)
Data_Collected_Date
Friday, July 12, 2019
Region S.N.N.P
Zone SOUTH OMO
Wereda NYANGATOM
Selected Indictor:
Kebele Name
KEBELE 01
Disaster Characteristics By Kebele
Disaster_Type Common Period
Year
Worst_ Trends of
Occured Year Effects
Root Causes
Crop diseases December
2005,
2007
2007
Decreased
Drought,
shortage of
water
KOPEREYA
Drought
Human
diseases
Livestock
diseases
January,
February, April,
May
April, May,
June, July
February,
March, April
1996,
1997,
1999,
2000,
2003,
2004
1994,
1997,
2000,
2003,
2004
1996,
2000,
2006,
2009
2009
Increased
Shortage of
rain fall,
deforestation
2003
Decreased
2006
Decreased
Effects
Loss of crop
production,
loss of
income
Shortage of
water, food
and pasture
Death and
disease of
human
Death of
livestock,
decreasing
number of
livestock and
livestock
production
Vulnerability
Coping Strategy
Migration
Migration
Migration
9
Page 3 of 18

Wereda Disaster
Risk Profile
National Disaster Risk Management
Commission (NDRMC)
Data_Collected_Date
Friday, July 12, 2019
Region S.N.N.P
Zone SOUTH OMO
Wereda NYANGATOM
Selected Indictor:
Kebele Name
KUCHURU
LOKAMEGNAN
Disaster Characteristics By Kebele
Disaster_Type Common Period
Drought
February,
March, April,
May
Year
Occured
1999,
2001,
2003,
2004,
2008,
2008
Worst_
Year
2009
Trends of
Effects
Increased
Root Causes
Shortage of
rainfall,
deforestation
, over grazing
Livestock
diseases
February,
March, April,
May
1999,
2001,
2002,
2003,
2006,
2009
2008
Decreased
Human
diseases
September,
November,
December
2005,
2006,
2008,
2009
2008
Decreased Pollution of
Omo river
Livestock
diseases
March, April,
May
2000,
2006,
2008,
2009
2009
Increased
Frequent
drought
Effects
Shortage of
water, food
and pasture,
death of
livestock
Death of
livestock,
decreasing
livestock
quality
production
Human
health
problem
Death of
livestock,
loss of
income,
migration
Vulnerability
Agro-ecology of the
area
Poor veterinary
service
Coping Strategy
Migration
Migration
Medical treatment,
migration
10
Page 4 of 18

Wereda Disaster
Risk Profile
National Disaster Risk Management
Commission (NDRMC)
Data_Collected_Date
Friday, July 12, 2019
Region S.N.N.P
Zone SOUTH OMO
Wereda NYANGATOM
Selected Indictor:
Kebele Name
LOKAMEGNAN
Disaster Characteristics By Kebele
Disaster_Type Common Period
Drought
January,
February, March
Year
Occured
1993,
1994,
2006,
2008,
2009
Worst_
Year
009
Trends of
Effects
Increased
Root Causes
Shortage of
rain, fall
Conflicts
January - June
2001,
2008,
2009
2008
Increased
Shortage of
pasture,
border
sharing with
turkana tribes
Human
diseases
May, June, July
2003,
2005,
2006,
2009
2006
Decreased
Shortage of
rain fall, poor
environment
hygiene,
imbalance
diet
Effects
Vulnerability
Shortage of
pasture,
death and
disease of
livestock,
loss of
income, high
expense of
drug
Death of
human, loss
of working
group,
livestock
stolen, social
instability
Death ad
disease of
human,
children
malnutrition,
expense of
medicine and
medial
service
Poor pasture
management, dry
season
Coping Strategy
Migration
Medical treatment
11
Page 5 of 18

Wereda Disaster
Risk Profile
National Disaster Risk Management
Commission (NDRMC)
Data_Collected_Date
Friday, July 12, 2019
Region S.N.N.P
Zone SOUTH OMO
Wereda NYANGATOM
Selected Indictor:
Kebele Name
LOKORLEM
Disaster Characteristics By Kebele
Disaster_Type Common Period
Conflicts
January - June
Year
Occured
2001,
2006,
2007,
2008,
2009
Worst_
Year
2008
Trends of
Effects
Increased
Drought
January - June
1994,
2006,
2008,
2009
2009
Increased
Root Causes
Frequent
travel to
border area
for searching
water and
pasture near
to Turkana
Shortage of
rain fall
Livestock
diseases
March - May
2000,
2006,
2007,
2008,
2009
2007
Increased
Reducing
resistant of
livestock
Effects
Vulnerability
Death of
human,
livestock
stolen, social
instability
Border sharing
Shortage of
food, death
and disease
of livestock,
loss of
income,
increasing
expense of
livestock
treatment
Death of
livestock,
loss of
income,
expense of
livestock
drug,
migration
Settling at water
search area, unable
to manage
Poor veterinary
service
Coping Strategy
Migration
Migration
Migration
12
Page 6 of 18

Wereda Disaster
Risk Profile
National Disaster Risk Management
Commission (NDRMC)
Data_Collected_Date
Friday, July 12, 2019
Region S.N.N.P
Zone SOUTH OMO
Wereda NYANGATOM
Selected Indictor:
Kebele Name
LOPAKOR
Disaster Characteristics By Kebele
Disaster_Type Common Period
Drought
March, April,
May, June,
January,
February
Year
Occured
1999,
20001,
2002,
2003,
2004,
2005,
2006,
2009
Worst_
Year
2009
Trends of
Effects
Increased
Root Causes
Shortage of
rain fall,
deforestation
, over
grazing,
agro-ecology
area
Conflicts
March,
February, April,
May
1999,
2000,
2001,
2003,
2004,
2008,
2009
2008
Decreased
Shortage of
water and
pasture
Livestock
diseases
June, July,
August
2000,
2003,
2004,
2007,
2008,
2009
2008
Decreased Climate
change
Human
diseases
July, August,
September,
October
1999,
2001,
2002,
2008,
2009
2008
Decreased
Climate
change, poor
sanitation
Effects
Shortage
food and
water,
shortage of
pasture
Death of
human,
livestock
stolen
Death of
livestock,
decreasing
livestock
production
Death of
human, loss
of income
Vulnerability
Agro-ecology of the
area
Shortage of enough
pasture land
No water resource
Agro-ecology of the
area
Coping Strategy
Migration
Migration
Migration
Closing points around
the community
13
Page 7 of 18

Wereda Disaster
Risk Profile
National Disaster Risk Management
Commission (NDRMC)
Data_Collected_Date
Friday, July 12, 2019
Region S.N.N.P
Zone SOUTH OMO
Wereda NYANGATOM
Selected Indictor:
Kebele Name
LORENKACHAWE
LOTOMEN
Disaster Characteristics By Kebele
Disaster_Type Common Period
Year
Worst_ Trends of
Occured Year Effects
Root Causes
Drought
January,
February, April,
May
1996,
1997,
1999,
2000,
2003,
2009
2009
Increased
Shortage of
rain fall,
deforestation
, over grazing
Livestock
diseases
February,
March, April
1996,
2000,
2001,
2002,
2006,
2007,
2009
2009
Decreased Drought
Human
diseases
April, May
2006,
2008,
2009
2006
Decreased
Shortage of
clean water,
favorable
weather for
outbreak
disease
Conflicts
January - June
2001,
2007,
2008,
2009
2008
Increased
Border
sharing with
Turkana,
shortage of
food
Effects
Vulnerability
Shortage of
pasture and
water, loss
of income
Agro-ecology of
area
Death of
livestock,
loss of
income
Settlement nearest
to Omo river
Human
health
problem,
expense for
buying drug
Death of
human,
livestock
stolen, social
instability
Inhabitation at the
border area with
Turkana
Coping Strategy
Migration
Migration
Medical treatment
Migration
14
Page 8 of 18

Wereda Disaster
Risk Profile
National Disaster Risk Management
Commission (NDRMC)
Data_Collected_Date
Friday, July 12, 2019
Region S.N.N.P
Zone SOUTH OMO
Wereda NYANGATOM
Selected Indictor:
Kebele Name
LOTOMEN
Disaster Characteristics By Kebele
Disaster_Type Common Period
Drought
January,
February, March
Year
Occured
1998,
2002,
2006,
207,
2008,
2009
Worst_
Year
2009
Trends of
Effects
Increased
Root Causes
Deforestation
, shortage of
water and
pasture
Livestock
diseases
March, April,
May
2000,
2006,
2008,
2009
2009
Increased
Climate
change
NAPATOKOYET
Drought
February,
March, April
1988,
19974,
2006,
2009
2009
Increased
Deforestation
, over
grazing,
shortage of
rainfall
Conflicts
September,
October,
November
2005 ,
2006,
25009
2006
Decreased
Shortage of
water and
food
15
Effects
Shortage of
food, loss of
livestock,
crop failure,
migration,
confect,
income
reduction
Death of
livestock,
decreasing
income,
expense for
drug and
medication
Shortage of
food, water
and pasture,
death and
disease of
livestock,
loss of
production
Death of
human,
stolen
livestock,
loss of asset
Vulnerability
Settling in the arid
area
Sharing resource
with Tribes/hamer
community
Coping Strategy
Migration
Migration
Migration
Migration
Page 9 of 18

Wereda Disaster
Risk Profile
National Disaster Risk Management
Commission (NDRMC)
Data_Collected_Date
Friday, July 12, 2019
Region S.N.N.P
Zone SOUTH OMO
Wereda NYANGATOM
Selected Indictor:
Kebele Name
NAPATOKOYET
Disaster Characteristics By Kebele
Disaster_Type Common Period
Year
Worst_ Trends of
Occured Year Effects
Human
diseases
May, June
2006,
2008
2006
Increased
Root Causes
Climate
change
NAROGOY
Livestock
diseases
Livestock
diseases
Drought
March, April
2006,
2007,
2008,
2009
March, April,
May
2001,
2006,
2009
February, March
1994,
1997,
2003,
2008,
2009
2009
Increased
Environmenta
l favorability
for disease
cause
2009
Increased
Shortage of
pasture
2008
Increased
Shortage of
rain fall,
deforestation
Effects
Death and
disease of
human, high
expense for
drug and
medical
treatment
Death of
livestock,
loss of asset,
decreasing
income
Death of
livestock,
loss of
income
Death of
livestock,
crop failure,
shortage of
water and
pasture, loss
of income
Vulnerability
Poor health service,
settling malaria
reproduction area,
high temperature
Frequent drought,
shortage of food
and water, poor
health facility
Harsh environment,
poor vaccination
access
Climate change
Coping Strategy
Medial and
traditional treatment
Migration, medical
treatment
Migration
Migration
16
Page 10 of 18

Wereda Disaster
Risk Profile
National Disaster Risk Management
Commission (NDRMC)
Data_Collected_Date
Friday, July 12, 2019
Region S.N.N.P
Zone SOUTH OMO
Wereda NYANGATOM
Selected Indictor:
Kebele Name
NAROGOY
Disaster Characteristics By Kebele
Disaster_Type Common Period
Flood
August
Year
Occured
2006
Worst_
Year
2006
Trends of
Effects
Decreased
Root Causes
Omor river
over flow
NATEKER
Human
diseases
Drought
August
2006
January,
February, March
1993,
1994,
2007,
2008,
2009
2006
2009
Decreased
Flood,
drought,
shortage of
drinking
water
Increased
Deforestation
, shortage of
rain fall
Conflicts
The whole year
Every
year
2008
Increased
Shortage of
water and
pasture
Effects
Vulnerability
Loss of
properties
and
livestock,
displacement
Human
health
problem
The settlement of
near to river Omo
Shortage of
pasture and
water, death
of livestock,
crop failure,
reduction of
income,
human
disease
Death of
human,
livestock
stolen, crop
loss,
migration
Livestock heard size
and over grazing
land
Settlement on the
border of the
wereda
Coping Strategy
Migration
Migration, using bed
net
Migration
17
Page 11 of 18

Wereda Disaster
Risk Profile
National Disaster Risk Management
Commission (NDRMC)
Data_Collected_Date
Friday, July 12, 2019
Region S.N.N.P
Zone SOUTH OMO
Wereda NYANGATOM
Selected Indictor:
Kebele Name
NATEKER
Disaster Characteristics By Kebele
Disaster_Type Common Period
Livestock
diseases
March, April,
May
Year
Occured
2007,
2008,
2009
Worst_
Year
2009
Trends of
Effects
Increased
Human
diseases
May, June, July
1994,
2001,
2006,
2009
2009
Increased
Root Causes
Shortage of
pasture,
climate
change
Climate
change, short
period rain in
May
NAWEYAPE
Drought
January,
February, March
1993,
1994,
2007,
2008,
2009
2009
Increased
Deforestation
, shortage of
rain fall
Livestock
diseases
Conflicts
Every month of
the year
2007,
2008,
2009
March, April,
May
2007,
2008,
2009
2009
2009
Increased
Increased
Shortage of
pasture
environmenta
l favorability
for disease
causing
Shortage of
food, water
and pasture
Effects
Death of
livestock,
loss of
income
Death of
human, high
expense for
drug and
treatment,
Shortage of
pasture,
death of
livestock,
crop
damage, loss
of income
Death of
livestock,
loss of
income
Death of
livestock,
decreasing
income
Vulnerability
Poor access of
livestock health
service
Far from health
service
Livestock heard size
and over grazing
land
Poor access of
veterinary service
Poor veterinary
service access
Coping Strategy
Migration, report to
the government
Medical treatment,
using bed net
Migration
Migration
Migration, reported
to government
18
Page 12 of 18

Wereda Disaster
Risk Profile
National Disaster Risk Management
Commission (NDRMC)
Data_Collected_Date
Friday, July 12, 2019
Region S.N.N.P
Zone SOUTH OMO
Wereda NYANGATOM
Selected Indictor:
Kebele Name
NAWEYAPE
Disaster Characteristics By Kebele
Disaster_Type Common Period
Human
diseases
May, June, July
Year
Occured
1994,
2001,
2006,
2009
Worst_
Year
2009
Trends of
Effects
Increased
Root Causes
Short period
rain
SHENKORA
Drought
Conflicts
Livestock
diseases
February,
March, April
February,
March, April
June, July,
August
1994,
2003,
2005,
2006,
2008,
2009
2006,
2007,
2009
1994,
2005,
2006,
2008,
2009
2009
Increased
Shortage of
rain fall,
deforestation
, over grazing
2009
2008
Decreased
Shortage of
pasture and
water
Increased
Drought,
disease out
break
Human
diseases
August,
September,
October
2004,
2006,
2007,
2009
2006
Decreased
Over flow of
Omo river,
shortage of
clean water
Effects
Vulnerability
Death of
human, high
expense of
drug and
treatment
Shortage of
pasture,
death of
livestock
Poor health center
Agro ecology of
area
Livestock
stolen, death
of human
Settling nearest to
other tribe
Death of
livestock,
decreasing
production
and quality
of production
Death of
human, loss
of income
High temperature,
agro-ecology of the
area
Settlement nearest
to the Omo river,
reproduction of
mosquito bite
Coping Strategy
Medical treatment,
using bed net
Temporary migration
Change pasture land
Migration, using bed
net
19
Page 13 of 18

Wereda Disaster
Risk Profile
National Disaster Risk Management
Commission (NDRMC)
Data_Collected_Date
Friday, July 12, 2019
Region S.N.N.P
Zone SOUTH OMO
Wereda NYANGATOM
Selected Indictor:
Kebele Name
TERGA
KOWTEM
Disaster Characteristics By Kebele
Disaster_Type Common Period
Drought
February,
March, April
Year
Occured
1999,
2000,
2003,
2004,
2006,
2008,
2009
Worst_
Year
2008
Trends of
Effects
Increased
Root Causes
Deforestation
, shortage of
rain fall, over
grazing
Livestock
diseases
August, October,
September
1994,
1999,
2001,
2003,
2006,
2008,
2009
2008
Decreased Drought
Human
diseases
August, October,
September
2001,
2003,
2006,
2008,
2009
2009
Decreased
Shortage of
drinking
water,
Favorable
environmenta
l disease,
Conflicts
All the month of
the year
Every
year
2008
Increased
Shortage of
water and
pasture
Effects
Vulnerability
Shortage of
water and
pasture, loss
of income
Agro-ecology of the
area
Death of
livestock,
Agro-ecology of the
area
Health
problem, loss
of income
Death of
human,
livestock
stolen, crop
loss, loss of
income,
migrant
Settling on the
border of the
wereda
Coping Strategy
Migration
Migration
20
Page 14 of 18

Wereda Disaster
Risk Profile
National Disaster Risk Management
Commission (NDRMC)
Data_Collected_Date
Friday, July 12, 2019
Region S.N.N.P
Zone SOUTH OMO
Wereda NYANGATOM
Selected Indictor:
Kebele Name
KOWTEM
Disaster Characteristics By Kebele
Disaster_Type Common Period
Year
Worst_ Trends of
Occured Year Effects
Drought
January,
February, March
1993,
1994,
2007,
2008,
2009
2009
Increased
Root Causes
Deforestation
, shortage of
rain fall
Livestock
diseases
March, April,
May
2007,
2008,
2009
2009
Increased
Drought,
shortage of
pasture
Human
diseases
May, June, July
1994,
2001,
2006,
2009
2008
Increased
Shortage of
rain in May
Effects
Shortage of
water and
pasture,
death of
livestock,
crop failure,
loss of
income
Death of
livestock,
decreasing
production,
loss of
income
Malaria
occur,
human
death,
Human
health
problem,
high expense
for drug and
Vulnerability
Over grazing land
Poor access of
veterinary service
Settlement of near
to kebele
Coping Strategy
Migration
Report to
governmental office,
migration
Using bed net,
medical treatment
21
Page 15 of 18

Wereda Disaster
Risk Profile
National Disaster Risk Management
Commission (NDRMC)
Data_Collected_Date
Friday, July 12, 2019
Region S.N.N.P
Zone SOUTH OMO
Wereda NYANGATOM
Selected Indictor:
Kebele Name
LEBERE
Disaster Characteristics By Kebele
Disaster_Type Common Period
Livestock
diseases
March, April,
May
Year
Occured
2000,
2006,
2008,
2009
Worst_
Year
2009
Trends of
Effects
Increased
Root Causes
Frequent
drought,
shortage of
pasture and
water
Drought
January,
February, March
1993,
1994,
2006,
2008,
2009
2009
Increased
Shortage of
rain fall, area
aridity
Conflicts
January - June
2001,
2008,
2009
2008
Increased
Border
sharing with
Turkana
tribes,
shortage of
pasture and
water
Effects
Vulnerability
Death of
livestock,
income loss,
malnutrition,
extra
expense for
drug,
migration
Shortage of
pasture,
death and
disease of
livestock,
loss of
income,
expense for
drug and
treatment
Death of
human, loss
of working
group,
livestock
stolen
Settlement on arid
area, poor
veterinary service
Settling water
scarce area, unable
to pasture
management
Coping Strategy
Medical treatment,
migration
Temporary migration
Trying to apply for
government to seek
solution
22
Page 16 of 18
Wereda Disaster
Risk Profile
National Disaster Risk Management
Commission (NDRMC)
Data_Collected_Date
Friday, July 12, 2019
Region S.N.N.P
Zone SOUTH OMO
Wereda NYANGATOM
Selected Indictor:
Kebele Name
LEBERE
Disaster Characteristics By Kebele
Disaster_Type Common Period
Human
diseases
May, June, July
Year
Occured
2003,
2005,
2006,
2009
Worst_
Year
2006
Trends of
Effects
Decreased
Root Causes
Short period
of rainfall,
favorable
environment
for mosquito,
imbalanced
diet
NAKARMAN
Drought
Conflicts
February,
March, April
February,
March, April
1999,
2000,
2003,
2004,
2006,
2009
2003,
2006,
2009
2009
2009
Increased
Deforestation
, over
grazing, high
wind,
shortage of
rain fall
Decreased
Shortage of
pasture and
water
Livestock
diseases
June, July,
August
2000,
2003,
2004,
2007,
2088,
2009
2008
Increased
Favorable
environmenta
l for disaster
out break
Effects
Vulnerability
Death of
human,
children
malnutrition,
expense for
drug and
medical
service
Shortage of
water and
pasture,
death of
livestock
Mosquito
reproduction
Agro ecology of the
area
Death of
human,
livestock
stolen
Death of
livestock,
loss of
production,
loss of
income
Agro-ecology of the
area
Coping Strategy
Medical treatment
Making peace
23
Page 17 of 18

Wereda Disaster
Risk Profile
National Disaster Risk Management
Commission (NDRMC)
Data_Collected_Date
Friday, July 12, 2019
Region S.N.N.P
Zone SOUTH OMO
Wereda NYANGATOM
Selected Indictor:
Kebele Name
NAPUSUMERYA
Disaster Characteristics By Kebele
Disaster_Type Common Period
Drought
January,
February, April,
May
Year
Occured
1996,
1997,
1999,
2000,
2003,
2009
Worst_
Year
2009
Trends of
Effects
Increased
Root Causes
Deforestation
, overgrazing,
shortage of
rain fall
Human
diseases
Livestock
diseases
May
February,
March, April
2006,
2009
1996,
2000,
2006,
2009
2006
2009
Decreased
Over flow of
river, being
favorable to
mosquito
reproduction
Increased
Drought,
favorable
weather
condition for
disease
IMPORTANT: The years and months mentoned in this report are according to Ethiopian Calendar (EC).
Effects
Death of
livestock,
crop failure,
shortage of
water and
pasture, loss
of income
Human
health
problem,
expense for
drug
Death of
livestock,
decreasing
production,
loss of
income,
expense for
drug
Vulnerability
Settlement near to
river
Settlement near to
river
Unable to go for
vaccination before
the incident,
settling in disease
susceptible area
Coping Strategy
Temporary
migration, using bed
net
Medical treatment
24
Page 18 of 18
Wereda Disaster
Risk Profile
Data_Collected_Date
Region S.N.N.P
Zone SOUTH OMO
Selected Indictor: Hazards: Conflict as an Issue
KebeleName
Description_Of_Conflict
AYEPA
Conflict
KAJAMAKEN
Conflict
KEBELE 01
KOPEREYA
KUCHURU
LOKAMEGNAN
LOKORLEM
Conflict
Conflict
Conflict
Frequent conflict
Frequent conflict
LOPAKOR
Conflict
LORENKACHAWE
Conflict
LOTOMEN
Conflict
NAPATOKOYET
High conflict
NAROGOY
NATEKER
No conflict
Frequent conflict
NAWEYAPE
Frequent conflict
National Disaster Risk Management
Commission (NDRMC)
Friday, July 12, 2019
Wereda NYANGATOM
Change_In_Last_Decade
Increased
Increased
Increased
Increased
Decreased
Increasing
Increasing
Decreased
Decreased
Increasing
Increased
Increasing
Increasing
25
Main_Causes_Of_Conflict
Shortage of pasture and
land
For pasture and water
scarcity, resource sharing
Resource sharing
Resource sharing
Resource sharing
Resource sharing
Shortage of pasture and
water, resource sharing
Shortage of water and
pasture, resource sharing
Shortage of water and
pasture, resource sharing
Shortage of water and
pasture, resource sharing
Shortage of water and
pasture, resource sharing
Shortage of water and
pasture, resource sharing
Shortage of pasture and
water, resource sharing
Page 1 of 2

Wereda Disaster
Risk Profile
Data_Collected_Date
Region S.N.N.P
Zone SOUTH OMO
Selected Indictor: Hazards: Conflict as an Issue
KebeleName
Description_Of_Conflict
SHENKORA
Conflict
TERGA
Conflict
KOWTEM
Frequent conflict
LEBERE
Frequent conflict
NAKARMAN
NAPUSUMERYA
Conflict
Conflict
National Disaster Risk Management
Commission (NDRMC)
Friday, July 12, 2019
Wereda NYANGATOM
Change_In_Last_Decade
Decreased
Decreased
Increasing
Increasing
Decreased
Increasing
Main_Causes_Of_Conflict
Shortage of pasture and
water, resource sharing
Unequal distribution of
relief
Shortage of water and
pasture
Shortage of pasture and
water, livestock stolen,
death of human
Shortage of pasture and
water, livestock stolen
Shortage of pure drinking
water and pasture
26
Page 2 of 2

Wereda Disaster Risk
Profile
Data_Collected_Date
National Disaster Risk Management
Commission (NDRMC)
Friday, July 12, 2019
Region S.N.N.P
Zone
SOUTH OMO
Wereda
NYANGATOM
Selected Indicator: Hazard Situation During Last Disaster - Characteristics of most recent disasters that affected the community
KebeleName
Types of Disasters
Hazard_Description
Effect_Of_Disaster
Most_Severly_Affected
Reason
AYEPA
Drought
KAJAMAKEN
Conflict
KEBELE 01
KOPEREYA
Drought
Drought
KUCHURU
LOKAMEGNAN
Drought
Drought
Occurred in 2009 and highly affected
Occurred between the kebeles
resident and border sharing resource
for faced scarcity of water
For four years
Occurred in 2009 and cause higher
water shortage
It occurred every year and affect all
community
Occurs year to year affect all
community for a long period
Shortage of food and
pasture, loss of
income,
Children, women, elders
Death of human,
Death of livestock,
migration, loss of
income
All community members
Migration, loss of
income
Decreasing
production, flood,
shortage of water and
pasture
Shortage of food and
water, loss of income
Damage vegetable and
pasture, death of
livestock, loss of
income
Children, women and
poor communities
Children, women, elders
and disabled
Children, women and
elders
Children, lactating and
pregnant women, elders
and disabled
They can not travel
to the place where
their animals are
displaced form
disease
They travel around
the border for
search of feed and
water, scrambling
these resource with
the tribes and lead
to conflict
Livelihood pattern
They can not travel
with their livestock
They have no
potential
They have no
capacity
27
Page 1 of 4
Wereda Disaster Risk
Profile
Data_Collected_Date
National Disaster Risk Management
Commission (NDRMC)
Friday, July 12, 2019
Region S.N.N.P
Zone
SOUTH OMO
Wereda
NYANGATOM
Selected Indicator: Hazard Situation During Last Disaster - Characteristics of most recent disasters that affected the community
KebeleName
LOKORLEM
Types of Disasters
Conflict
LOPAKOR
Drought
LORENKACHAWE
Drought
LOTOMEN
NAPATOKOYET
NAROGOY
NATEKER
Conflict
Drought
Livestock disease
Conflict
Hazard_Description
Occur every year
It occurs every year and highly affect
the community
Occurred in 2009 and highly affect
the community
Occurred year to year and highly
affect the whole community
Occurred in 2009 and highly affect
the whole community
It occurs in 2009 for three months
and highly affect the community
It occurs between the kebeles
resident and border sharing with
Turkana tribs
Effect_Of_Disaster
Death of human,
decreasing number of
livestock, social
instability and
migration
Shortage of water,
food and pasture, loss
of livestock
Shortage of pasture,
food and water, loss
of production, loss of
income
Death of human,
livestock stolen, social
instability
Death of livestock,
loss of asset,
migration
Death of livestock,
shortage of food, loss
of income
Death of human, and
livestock, migration,
shortage of pasture
and water
Most_Severly_Affected
Youth of the kebele
members
Children, women, elders
Children, women, elders
and disabled
The whole community
specially youths
Children, pregnant and
lactating women, elders
and disabled
Children, women, elders
and disabled
Heard keeper face a
frequent conflict
problem are more affect
the community members
Reason
They are hard
keeper not able to
stabilize
They can not travel
or migrate easily
They can not cope
easily, no capacity
They face
instability and
disturbance
They are vulnerable
They can not able
to travel
They travel around
the border for
searching of
pasture and water
28
Page 2 of 4

Wereda Disaster Risk
Profile
Data_Collected_Date
National Disaster Risk Management
Commission (NDRMC)
Friday, July 12, 2019
Region S.N.N.P
Zone
SOUTH OMO
Wereda
NYANGATOM
Selected Indicator: Hazard Situation During Last Disaster - Characteristics of most recent disasters that affected the community
KebeleName
NAWEYAPE
SHENKORA
TERGA
KOWTEM
LEBERE
NAKARMAN
Types of Disasters
Conflict
Drought
Drought
Conflict
Drought
Drought
Hazard_Description
It occurred between the kebele
residents and border sharing Turkana
tribs for pasture and water
scrambling and causes human death
and leads to revenge every year
It occurs every year but highly affect
the community in 2009
Occur every year and affect the
whole community
Occur between the kebele resident
and border sharing Turkana
tribes/Kenya for pasture and water
and revenge every year
Occurs every year and highly affect
the community
Occurred every year and affect the
community
Effect_Of_Disaster
Death of human, loss
of livestock, shortage
of food, migration
Most_Severly_Affected
Heard keepr face a
freqwuent conflict
Shortage of water and
pasture, loss of
income
Shortage of rain fall,
shortage of water and
pasture, decreasing
quality of production
Death of human,
livestock stolen, loss
of income, migration
Death of livestock,
loss of production,
shortage of pasture
and water, loss of
income
Shortage of food,
water and pasture
Children, women and
elders
Children, pregnant and
lactating women and
elders
Herd keepers face a
frequent conflict
problem are more
affected community
member
Children, lactating and
pregnant women, weak
communality elders and
disabled
Children, women and
elders
Reason
They travel around
the border for
searching of feed
and water
They can not travel
place to place
They can not easily
travel
They travel around
the border far
search of feed and
water
The are not able to
migrate
They can
displacement or
move easily
29
Page 3 of 4
Wereda Disaster Risk
Profile
Data_Collected_Date
National Disaster Risk Management
Commission (NDRMC)
Friday, July 12, 2019
Region S.N.N.P
Zone
SOUTH OMO
Wereda
NYANGATOM
Selected Indicator: Hazard Situation During Last Disaster - Characteristics of most recent disasters that affected the community
KebeleName
NAPUSUMERYA
Types of Disasters
Drought
Hazard_Description
Occurred every year specially in 2009
and highly affect whole community
Effect_Of_Disaster
Shortage of water,
food and pasture, loss
of livestock,
decreasing
production, migration
Most_Severly_Affected
Children, pregnant and
lactating women, elders
and disabled
Reason
They can not travel
or migrate
30
Page 4 of 4
Data_Collected_Date
Region S.N.N.P
Zone SOUTH OMO
Selected Indictor: Frequency of Disaster Occurrence
Wereda
NYANGATOM
Friday, July 12, 2019
Conflicts
Crop diseases
Drought
Flood
Heat waves/ High temp
Livestock diseases
94.44
57.14
85.83
100.00
100.00
16.67
14.29
7.78
50.00
14.29
5.83
33.33
5.56
14.29
0.56
31
Page 1 of 1
Data_Collected_Date
Region S.N.N.P
Zone SOUTH OMO
Selected Indictor: Household Exposure to Hazards
Disaster Type
Drought
Conflicts
Crop diseases
Heat waves/ High temp
Livestock diseases
Flood
Friday, July 12, 2019
Wereda NYANGATOM
General_Exposure
92.42
4.04
1.77
1.26
0.51
Last_Five_Years_Exposure
90.91
1.77
1.01
1.52
0.25
32
Page 1 of 1
Wereda Disaster
Risk Profile
Data_Collected_Date
Region S.N.N.P
Selected Indictor:
Zone SOUTH OMO
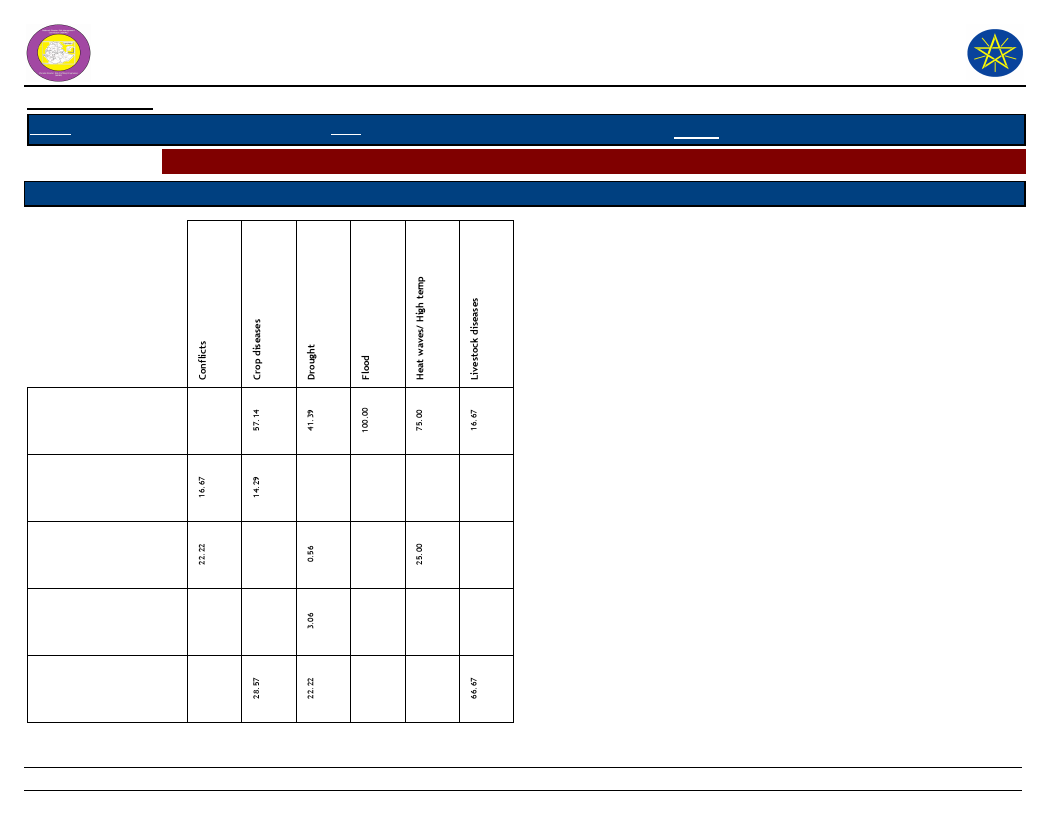
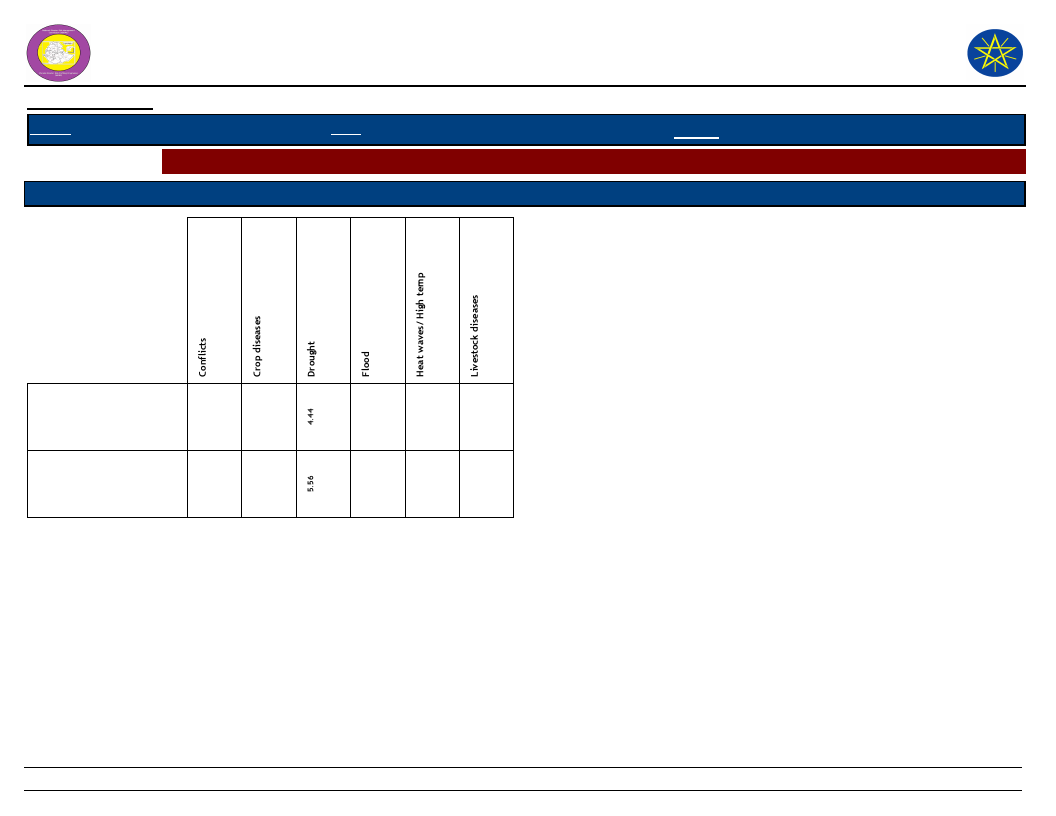
Months of Occurrence of Frequent Disasters
National Disaster Risk Management
Commission (NDRMC)
Friday, July 12, 2019
Wereda NYANGATOM
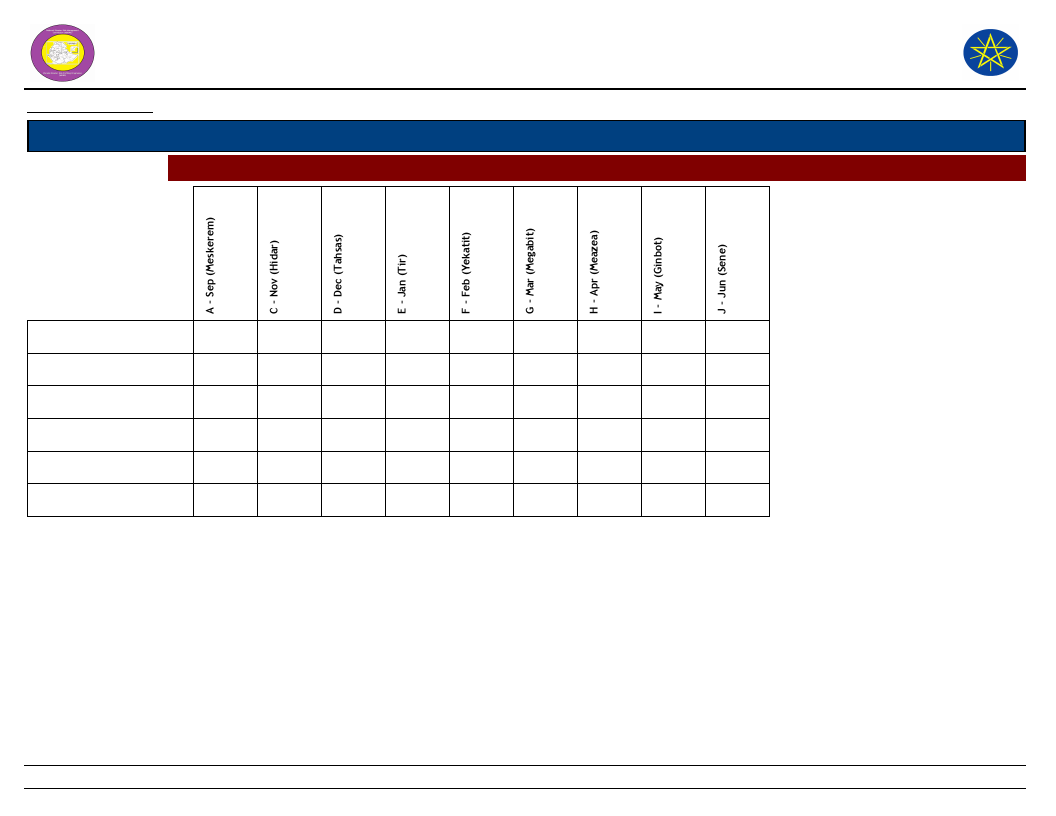
Conflicts
Crop diseases
Drought
Flood
Heat waves/ High temp
Livestock diseases
5.56
33.33
33.33
5.56
22.22
28.57
57.14
14.29
0.28
0.83
24.44
41.67
8.06
23.33
0.56
0.56
0.28
100.00
25.00
25.00
25.00
25.00
33.33
33.33
33.33
33
Page 1 of 1
Data_Collected_Date
Friday, July 12, 2019
Region S.N.N.P
Zone SOUTH OMO
Wereda NYANGATOM
Selected Indictor:
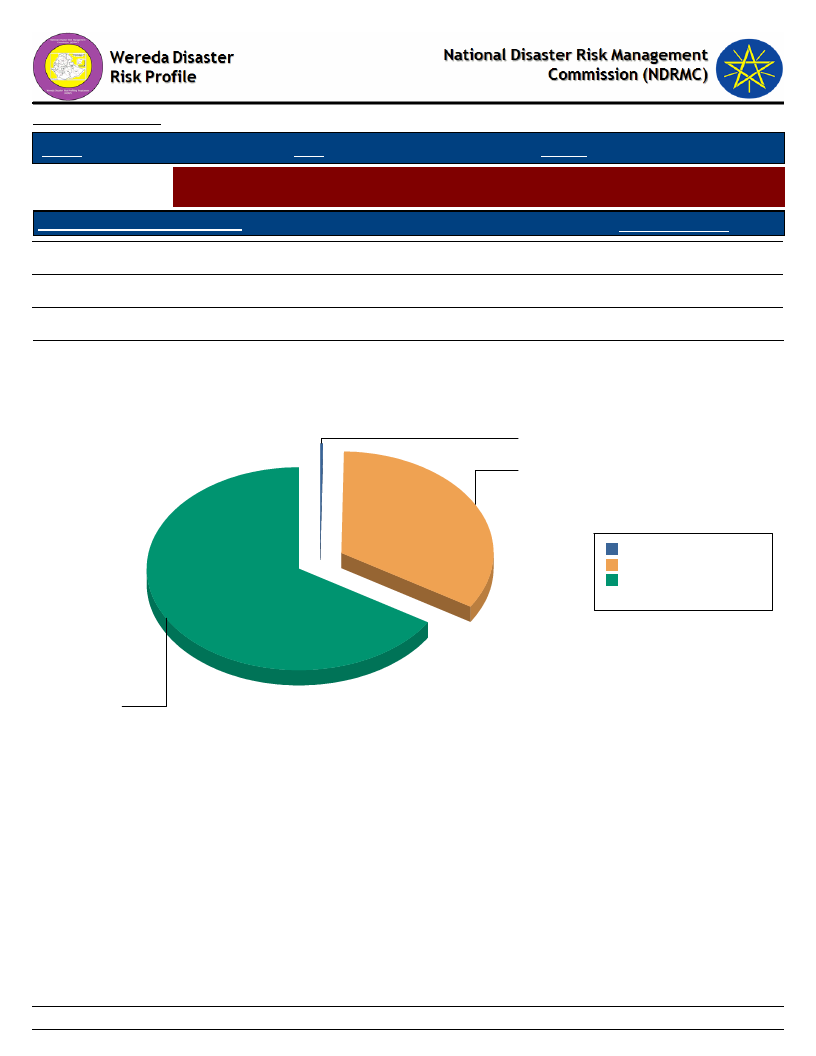
Conflicts: Perception of households on conflict issues - Is conflict an issue in this
community?
Is Conflict an Issue in Community?
Response_Percent
Yes
66.24
No
33.50
NA
0.25
Is Conflict an Issue in Community?
NA
0.3
No
33.5
NA
0.3 0.3%
No 33.5 33.5%
Yes 66.2 66.2%
Total: 100.0 100.0%
Yes
66.2
34
Page 1 of 1
Data_Collected_Date
Region S.N.N.P
Zone SOUTH OMO
Friday, July 12, 2019
Wereda NYANGATOM
Selected Indictor:
Conflicts: Perception of households on conflict issues - Who To Turn To in case
of Conflict?
Who To Turn During Conflict?
Response_Percentage
Family members
12.21
Elders
70.99
Amakaris
1.15
Wereda administration
6.87
Police
2.29
Militia
3.82
Regional representatives
2.67
Who To Turn During Conflict?
Wereda administration
7
Regional
representatives
3
Police
2
Militia
4
Family members
12
Amakaris
1
Elders
71
Amakaris
1 1.1%
Elders
71 71.0%
Family members
Militia
Police
Regional representatives
Wereda administration
12 12.2%
4 3.8%
2 2.3%
3 2.7%
7 6.9%
Total:
100 100.0%
35
Page 1 of 1
Data_Collected_Date
Region S.N.N.P
Zone SOUTH OMO
Friday, July 12, 2019
Wereda NYANGATOM
Selected Indictor: Losses from Disasters - Losses from all disasters (household response in %)
Type of Loss
Main_Loss_Percent
Secondary_Loss_Percent
Physical damages on houses and property
5.05
2.11
Crop damage
39.90
2.63
Livestock damage
21.72
6.84
Death of household members
1.01
3.95
Illness/health problems
2.78
5.26
Loss of access to social services, including school
0.76
3.42
Loss of income
6.06
22.11
Loss of savings
1.01
3.68
Livestock were stolen
2.53
1.84
Lost access to grazing land
13.38
19.21
Lost access to water source
4.04
27.63
Had to flee/change residence area
1.77
1.32
36
Page 1 of 1
Wereda Disaster
Risk Profile
National Disaster Risk Management
Commission (NDRMC)
Data_Collected_Date
Region S.N.N.P
Zone SOUTH OMO
Wereda NYANGATOM
Friday, July 12, 2019
Selected Indictor: Losses from Disasters - Main Losses by Type of Disasters (household response in %)
Type of Loss
Type of Disasters which mainly caused Listed Losses
Crop damage
Death of household
members
Had to flee/change
residence area
Illness/health problems
Livestock damage
37
Page 1 of 3

Wereda Disaster
Risk Profile
National Disaster Risk Management
Commission (NDRMC)
Data_Collected_Date
Region S.N.N.P
Zone SOUTH OMO
Wereda NYANGATOM
Friday, July 12, 2019
Selected Indictor: Losses from Disasters - Main Losses by Type of Disasters (household response in %)
Type of Loss
Type of Disasters which mainly caused Listed Losses
Livestock were stolen
Loss of access to social
services, including
school
Loss of income
Loss of savings
Lost access to grazing
land
38
Page 2 of 3
Wereda Disaster
Risk Profile
National Disaster Risk Management
Commission (NDRMC)
Data_Collected_Date
Region S.N.N.P
Zone SOUTH OMO
Wereda NYANGATOM
Friday, July 12, 2019
Selected Indictor: Losses from Disasters - Main Losses by Type of Disasters (household response in %)
Type of Loss
Type of Disasters which mainly caused Listed Losses
Lost access to water
source
Physical damages on
houses and property
39
Page 3 of 3

Wereda Disaster Risk
Profile
Data_Collected_Date
Region S.N.N.P
Zone SOUTH OMO
National Disaster Risk Management
Commission (NDRMC)
Wereda NYANGATOM
Friday, July 12, 2019
Selected Indictor: Losses from Disasters - Secondary Losses by Type of Disasters (household response in %)
Type of Loss
Type of Disasters which caused Listed Secondary Losses
Crop damage
Death of household
members
Had to flee/change
residence area
Illness/health problems
Livestock damage
14.29
2.60
58.82
1.45
5.88
1.16
28.57
5.20
7.23
100.00
40
Page 1 of 3
Wereda Disaster Risk
Profile
Data_Collected_Date
Region S.N.N.P
Zone SOUTH OMO
National Disaster Risk Management
Commission (NDRMC)
Wereda NYANGATOM
Friday, July 12, 2019
Selected Indictor: Losses from Disasters - Secondary Losses by Type of Disasters (household response in %)
Type of Loss
Type of Disasters which caused Listed Secondary Losses
Livestock were stolen
Loss of access to social
services, including school
Loss of income
Loss of savings
Lost access to grazing land
35.29
0.29
3.76
28.57
21.97
14.29
3.76
14.29
20.81
66.67
66.67
41
Page 2 of 3
Wereda Disaster Risk
Profile
Data_Collected_Date
Region S.N.N.P
Zone SOUTH OMO
National Disaster Risk Management
Commission (NDRMC)
Wereda NYANGATOM
Friday, July 12, 2019
Selected Indictor: Losses from Disasters - Secondary Losses by Type of Disasters (household response in %)
Type of Loss
Type of Disasters which caused Listed Secondary Losses
Lost access to water source
Physical damages on houses
and property
29.77
2.02
33.33
16.67
16.67
42
Page 3 of 3

Wereda Disaster
Risk Profile
Data_Collected_Date
National Disaster Risk Management
Commission (NDRMC)
Friday, July 12, 2019
Region S.N.N.P
Zone SOUTH OMO
Wereda NYANGATOM
Selected Indictor: Seasonal Calendar for Hazards, Activities and Income Level By Kebele
Month of Hazard
Major_Problems /Disasters
Hazard Severity
Rank
Agricultural_Activities
Kebele Name AYEPA
E - Jan (Tir)
Drought, shortage of feed, livestock disease
2
Livestock activities
Income
Level Rank
12th
F - Feb (Yekatit)
Drought, shortage of feed, livestock disease
2
Livestock activities
11th
G - Mar (Megabit)
Drought, shortage of feed, livestock disease
3
Livestock activities
10th
H - Apr (Meazea)
Low pasture and land
2
Livestock activities
9th
I - May (Ginbot)
Low pasture and land
1
Livestock activities
2nd
J - Jun (Sene)
Drought, human livestock disease
2
Livestock activities
1st
K - Jul (Hamle)
Drought, human livestock disease
2
Livestock activities
3rd
L - Aug (Nehase)
Drought, livestock disease
2
Livestock activities
4th
A - Sep (Meskerem)
Shortage of drinking water
3
Livestock activities
5th
B - Oct (Tikimt)
Shortage of drinking water
2
Livestock activities
6th
C - Nov (Hidar)
Shortage of drinking water
3
Livestock activities
7th
D - Dec (Tahsas)
Shortage of drinking water
2
Livestock activities
8th
NOTE: Hazard Severity Rank helps prioritize the more severe hazards that have occurred in the months of disaster occurrence, 3 being the worst and 1
the least severe hazards.
43
Page 1 of 20

Wereda Disaster
Risk Profile
Data_Collected_Date
National Disaster Risk Management
Commission (NDRMC)
Friday, July 12, 2019
Region S.N.N.P
Zone SOUTH OMO
Wereda NYANGATOM
Selected Indictor: Seasonal Calendar for Hazards, Activities and Income Level By Kebele
Month of Hazard
Major_Problems /Disasters
Hazard Severity
Rank
Agricultural_Activities
Kebele Name KAJAMAKEN
E - Jan (Tir)
Shortage of water and pasture, conflict
2
Livestock activities
Income
Level Rank
10th
F - Feb (Yekatit)
Shortage of water and pasture, conflict
3
Livestock activities
12th
G - Mar (Megabit)
Shortage of water and pasture, conflict
3
Livestock activities
11th
H - Apr (Meazea)
Shortage of water and pasture, conflict
3
Livestock activities
6th
I - May (Ginbot)
Human disease, conflict
2
Livestock activities
4th
J - Jun (Sene)
Human disease, conflict
3
Livestock activities
1st
K - Jul (Hamle)
Human disease, conflict
3
Livestock activities
2nd
L - Aug (Nehase)
Shortage of food, conflict
3
Livestock activities
3rd
A - Sep (Meskerem)
Shortage of food
3
Livestock activities
5th
B - Oct (Tikimt)
Shortage of food
3
Livestock activities
7th
C - Nov (Hidar)
Shortage of food
3
Livestock activities
8th
D - Dec (Tahsas)
Shortage of food
3
Livestock activities
9th
NOTE: Hazard Severity Rank helps prioritize the more severe hazards that have occurred in the months of disaster occurrence, 3 being the worst and 1
the least severe hazards.
44
Page 2 of 20

Wereda Disaster
Risk Profile
Data_Collected_Date
National Disaster Risk Management
Commission (NDRMC)
Friday, July 12, 2019
Region S.N.N.P
Zone SOUTH OMO
Wereda NYANGATOM
Selected Indictor: Seasonal Calendar for Hazards, Activities and Income Level By Kebele
Month of Hazard
Major_Problems /Disasters
Hazard Severity
Rank
Agricultural_Activities
Kebele Name KEBELE 01
E - Jan (Tir)
Livestock disease
3
Livestock activities
Income
Level Rank
2nd
F - Feb (Yekatit)
Livestock disease
3
Livestock activities
4th
G - Mar (Megabit)
Drought
2
Livestock activities
5th
H - Apr (Meazea)
Crop disease
2
Livestock activities
6th
I - May (Ginbot)
Livestock disease
2
Livestock activities
7th
J - Jun (Sene)
Drought
3
Livestock activities
8th
K - Jul (Hamle)
Livestock disease
3
Livestock activities
9th
L - Aug (Nehase)
Drought
3
Livestock activities
10th
A - Sep (Meskerem)
Livestock disease
3
Livestock activities
11th
B - Oct (Tikimt)
Drought, livestock disease
3
Livestock activities
12th
C - Nov (Hidar)
Livestock disease, drought
3
Livestock activities
1st
D - Dec (Tahsas)
Livestock disease, drought
3
Livestock activities
2nd
NOTE: Hazard Severity Rank helps prioritize the more severe hazards that have occurred in the months of disaster occurrence, 3 being the worst and 1
the least severe hazards.
45
Page 3 of 20

Wereda Disaster
Risk Profile
Data_Collected_Date
National Disaster Risk Management
Commission (NDRMC)
Friday, July 12, 2019
Region S.N.N.P
Zone SOUTH OMO
Wereda NYANGATOM
Selected Indictor: Seasonal Calendar for Hazards, Activities and Income Level By Kebele
Month of Hazard
Major_Problems /Disasters
Hazard Severity
Rank
Agricultural_Activities
Kebele Name KOPEREYA
E - Jan (Tir)
Drought, shortage of food
2
Livestock activities
Income
Level Rank
12th
F - Feb (Yekatit)
Livestock disease, drought, shortage of food
3
Livestock activities
11th
G - Mar (Megabit)
Livestock disease, drought, shortage of food
3
Livestock activities
10th
H - Apr (Meazea)
Livestock disease, drought, shortage of food
3
Livestock activities
9th
I - May (Ginbot)
Livestock disease, drought, shortage of food
2
Livestock activities
8th
J - Jun (Sene)
Human disease, drought, shortage of food
3
Livestock activities
7th
K - Jul (Hamle)
Human disease, drought, shortage of food
2
Livestock activities
6th
L - Aug (Nehase)
Human disease, drought, shortage of food
3
Livestock activities
5th
A - Sep (Meskerem)
Human disease, drought
2
Livestock activities
4th
B - Oct (Tikimt)
Human disease, drought
2
Livestock activities
3rd
C - Nov (Hidar)
Human disease, drought
3
Livestock activities
2nd
D - Dec (Tahsas)
Human disease, drought
1
Livestock activities
1st
NOTE: Hazard Severity Rank helps prioritize the more severe hazards that have occurred in the months of disaster occurrence, 3 being the worst and 1
the least severe hazards.
46
Page 4 of 20

Wereda Disaster
Risk Profile
Data_Collected_Date
National Disaster Risk Management
Commission (NDRMC)
Friday, July 12, 2019
Region S.N.N.P
Zone SOUTH OMO
Wereda NYANGATOM
Selected Indictor: Seasonal Calendar for Hazards, Activities and Income Level By Kebele
Month of Hazard
Major_Problems /Disasters
Hazard Severity
Rank
Agricultural_Activities
Kebele Name KOWTEM
E - Jan (Tir)
Shortage of pasture and water for drinking, conflict
2
Income
Level Rank
F - Feb (Yekatit)
Shortage of pasture and water for drinking, conflict
2
G - Mar (Megabit)
Shortage of pasture and water for drinking, conflict
3
H - Apr (Meazea)
Shortage of pasture and water for drinking, conflict
3
I - May (Ginbot)
Human disease/malaria, conflict
3
J - Jun (Sene)
Human disease/malaria, conflict
3
K - Jul (Hamle)
Human disease/malaria, conflict
3
L - Aug (Nehase)
Shortage of food, pasture and water, conflict
2
A - Sep (Meskerem)
Shortage of food, pasture and water, conflict
3
B - Oct (Tikimt)
Shortage of food, pasture and water, conflict
3
C - Nov (Hidar)
Shortage of food, pasture and water, conflict
3
D - Dec (Tahsas)
Shortage of food, pasture and water, conflict
3
NOTE: Hazard Severity Rank helps prioritize the more severe hazards that have occurred in the months of disaster occurrence, 3 being the worst and 1
the least severe hazards.
47
Page 5 of 20

Wereda Disaster
Risk Profile
Data_Collected_Date
National Disaster Risk Management
Commission (NDRMC)
Friday, July 12, 2019
Region S.N.N.P
Zone SOUTH OMO
Wereda NYANGATOM
Selected Indictor: Seasonal Calendar for Hazards, Activities and Income Level By Kebele
Month of Hazard
Major_Problems /Disasters
Hazard Severity
Rank
Agricultural_Activities
Kebele Name KUCHURU
E - Jan (Tir)
Shortage of water, drought
2
Bee keeping
Income
Level Rank
12th
F - Feb (Yekatit)
Drought, shortage of water and pasture
2
Bee keeping
11th
G - Mar (Megabit)
Drought, shortage of water and pasture
3
Ploughing
10th
H - Apr (Meazea)
Drought, livestock disease, shortage of water and
2
Ploughing
9th
pasture
I - May (Ginbot)
Drought, livestock disease, shortage of water and
2
Sowing
8th
pasture
J - Jun (Sene)
Drought, livestock disease, shortage of water and
2
Cultivation
7th
pasture
K - Jul (Hamle)
Drought, livestock disease, shortage of water and
2
Cultivation
6th
pasture
L - Aug (Nehase)
Drought, livestock disease, shortage of water and
2
Harvesting
2nd
pasture
A - Sep (Meskerem)
Human disease
3
Honey production
1st
B - Oct (Tikimt)
Human disease, drought, shortage of water and pasture
2
Honey production
3rd
C - Nov (Hidar)
Human disease, drought, shortage of water and pasture
2
Honey production
4th
D - Dec (Tahsas)
Human disease, drought, shortage of water and pasture
2
Honey production
5th
NOTE: Hazard Severity Rank helps prioritize the more severe hazards that have occurred in the months of disaster occurrence, 3 being the worst and 1
the least severe hazards.
48
Page 6 of 20

Wereda Disaster
Risk Profile
Data_Collected_Date
National Disaster Risk Management
Commission (NDRMC)
Friday, July 12, 2019
Region S.N.N.P
Zone SOUTH OMO
Wereda NYANGATOM
Selected Indictor: Seasonal Calendar for Hazards, Activities and Income Level By Kebele
Month of Hazard
Major_Problems /Disasters
Hazard Severity
Rank
Agricultural_Activities
Kebele Name LEBERE
E - Jan (Tir)
Drought, shortage of food, water and pasture, conflict
3
Income
Level Rank
F - Feb (Yekatit)
Drought, shortage of food, water and pasture, conflict
3
G - Mar (Megabit)
Drought, shortage of food, water and pasture, conflict
3
H - Apr (Meazea)
Drought, shortage of food, water and pasture, conflict
3
I - May (Ginbot)
Human disease, conflict
2
J - Jun (Sene)
Human disease, conflict
3
K - Jul (Hamle)
Human disease, conflict
3
L - Aug (Nehase)
Human disease, conflict
2
A - Sep (Meskerem)
Shortage of food, water and pasture, conflict
2
B - Oct (Tikimt)
Shortage of food, water and pasture, conflict
2
C - Nov (Hidar)
Shortage of food, water and pasture, conflict
3
D - Dec (Tahsas)
Shortage of food, water and pasture, conflict
3
NOTE: Hazard Severity Rank helps prioritize the more severe hazards that have occurred in the months of disaster occurrence, 3 being the worst and 1
the least severe hazards.
49
Page 7 of 20

Wereda Disaster
Risk Profile
Data_Collected_Date
National Disaster Risk Management
Commission (NDRMC)
Friday, July 12, 2019
Region S.N.N.P
Zone SOUTH OMO
Wereda NYANGATOM
Selected Indictor: Seasonal Calendar for Hazards, Activities and Income Level By Kebele
Month of Hazard
Major_Problems /Disasters
Hazard Severity
Rank
Agricultural_Activities
Kebele Name LOKAMEGNAN
E - Jan (Tir)
Drought, shortage of water and pasture, conflict
3
Income
Level Rank
1st
F - Feb (Yekatit)
Drought, shortage of water and pasture, conflict
3
1st
G - Mar (Megabit)
Drought, shortage of water and pasture, conflict
3
1st
H - Apr (Meazea)
Drought, shortage of water and pasture, conflict
3
1st
I - May (Ginbot)
Human disease, conflict
2
1st
J - Jun (Sene)
Human disease, conflict
3
1st
K - Jul (Hamle)
Human disease, conflict
3
1st
L - Aug (Nehase)
Human disease, conflict
2
1st
A - Sep (Meskerem)
Shortage of food, pasture and water, conflict
2
1st
B - Oct (Tikimt)
Shortage of food, pasture and water, conflict
2
1st
C - Nov (Hidar)
Shortage of food, pasture and water, conflict
3
1st
D - Dec (Tahsas)
Shortage of food, pasture and water, conflict
3
1st
NOTE: Hazard Severity Rank helps prioritize the more severe hazards that have occurred in the months of disaster occurrence, 3 being the worst and 1
the least severe hazards.
50
Page 8 of 20

Wereda Disaster
Risk Profile
Data_Collected_Date
National Disaster Risk Management
Commission (NDRMC)
Friday, July 12, 2019
Region S.N.N.P
Zone SOUTH OMO
Wereda NYANGATOM
Selected Indictor: Seasonal Calendar for Hazards, Activities and Income Level By Kebele
Month of Hazard
Major_Problems /Disasters
Hazard Severity
Rank
Agricultural_Activities
Kebele Name LOKORLEM
E - Jan (Tir)
Drought, shortage of food and water, conflict
3
Income
Level Rank
1st
F - Feb (Yekatit)
Drought, shortage of food and water, conflict
3
1st
G - Mar (Megabit)
Drought, shortage of food and water, livestock disease
3
1st
H - Apr (Meazea)
Drought, shortage of food and water, livestock disease
3
1st
I - May (Ginbot)
Drought, shortage of food and water, livestock disease
2
1st
J - Jun (Sene)
Drought, shortage of food and water, livestock disease
2
1st
K - Jul (Hamle)
Human disease
2
1st
L - Aug (Nehase)
Human disease
2
1st
A - Sep (Meskerem)
Shortage of food and water
3
1st
B - Oct (Tikimt)
Human and livestock disease
3
1st
C - Nov (Hidar)
Shortage of pasture, drought, conflict
3
1st
D - Dec (Tahsas)
Shortage of pasture, drought, conflict
3
1st
NOTE: Hazard Severity Rank helps prioritize the more severe hazards that have occurred in the months of disaster occurrence, 3 being the worst and 1
the least severe hazards.
51
Page 9 of 20

Wereda Disaster
Risk Profile
Data_Collected_Date
National Disaster Risk Management
Commission (NDRMC)
Friday, July 12, 2019
Region S.N.N.P
Zone SOUTH OMO
Wereda NYANGATOM
Selected Indictor: Seasonal Calendar for Hazards, Activities and Income Level By Kebele
Month of Hazard
Major_Problems /Disasters
Hazard Severity
Rank
Agricultural_Activities
Kebele Name LOPAKOR
E - Jan (Tir)
Drought, shortage of food
2
Livestock activities
Income
Level Rank
12th
F - Feb (Yekatit)
Livestock disease, drought, shortage of food
3
Livestock activities
11th
G - Mar (Megabit)
Human disease, drought, shortage of food
3
Livestock activities
10th
H - Apr (Meazea)
Human disease, drought, shortage of food
3
Livestock activities
2nd
I - May (Ginbot)
Shortage of water
2
Livestock activities
9th
J - Jun (Sene)
Drought, human disease
2
Livestock activities
7th
K - Jul (Hamle)
Drought, human disease
2
Livestock activities
8th
L - Aug (Nehase)
Human and livestock disease
3
Livestock activities
6th
A - Sep (Meskerem)
Human and livestock disease
2
Livestock activities
4th
B - Oct (Tikimt)
Human and livestock disease
2
Livestock activities
5th
C - Nov (Hidar)
Shortage of food, drought
2
---------
D - Dec (Tahsas)
Shortage of food, drought
2
---------
NOTE: Hazard Severity Rank helps prioritize the more severe hazards that have occurred in the months of disaster occurrence, 3 being the worst and 1
the least severe hazards.
52
Page 10 of 20

Wereda Disaster
Risk Profile
Data_Collected_Date
National Disaster Risk Management
Commission (NDRMC)
Friday, July 12, 2019
Region S.N.N.P
Zone SOUTH OMO
Wereda NYANGATOM
Selected Indictor: Seasonal Calendar for Hazards, Activities and Income Level By Kebele
Month of Hazard
Major_Problems /Disasters
Hazard Severity
Rank
Agricultural_Activities
Kebele Name LORENKACHAWE
E - Jan (Tir)
Drought, shortage of food
2
Income
Level Rank
1st
F - Feb (Yekatit)
Livestock disease, drought, shortage of food
3
1st
G - Mar (Megabit)
Livestock disease, drought, shortage of food
3
1st
H - Apr (Meazea)
Livestock disease, drought, shortage of food
2
1st
I - May (Ginbot)
Human disease, drought, shortage of food
3
1st
J - Jun (Sene)
Human disease, drought, shortage of food
3
1st
K - Jul (Hamle)
Shortage of water, drought
2
1st
L - Aug (Nehase)
Shortage of water, drought
2
1st
A - Sep (Meskerem)
Shortage of water, drought
2
1st
B - Oct (Tikimt)
Shortage of water, drought
1
1st
C - Nov (Hidar)
Shortage of food, drought, livestock disease
2
1st
D - Dec (Tahsas)
Shortage of food, drought, livestock disease
1
1st
NOTE: Hazard Severity Rank helps prioritize the more severe hazards that have occurred in the months of disaster occurrence, 3 being the worst and 1
the least severe hazards.
53
Page 11 of 20

Wereda Disaster
Risk Profile
Data_Collected_Date
National Disaster Risk Management
Commission (NDRMC)
Friday, July 12, 2019
Region S.N.N.P
Zone SOUTH OMO
Wereda NYANGATOM
Selected Indictor: Seasonal Calendar for Hazards, Activities and Income Level By Kebele
Month of Hazard
Major_Problems /Disasters
Hazard Severity
Rank
Agricultural_Activities
Kebele Name LOTOMEN
E - Jan (Tir)
Shortage of food, drought, conflict
3
Income
Level Rank
F - Feb (Yekatit)
Shortage of food, drought, conflict
3
G - Mar (Megabit)
Shortage of food, drought, conflict
3
H - Apr (Meazea)
Livestock disease, conflict
2
I - May (Ginbot)
Livestock disease, conflict
3
J - Jun (Sene)
Livestock disease, conflict
3
K - Jul (Hamle)
Livestock disease, conflict
3
L - Aug (Nehase)
Livestock disease, conflict
2
A - Sep (Meskerem)
Drought, shortage of food
2
B - Oct (Tikimt)
Conflict
3
C - Nov (Hidar)
Conflict
3
D - Dec (Tahsas)
Conflict
3
NOTE: Hazard Severity Rank helps prioritize the more severe hazards that have occurred in the months of disaster occurrence, 3 being the worst and 1
the least severe hazards.
54
Page 12 of 20

Wereda Disaster
Risk Profile
Data_Collected_Date
National Disaster Risk Management
Commission (NDRMC)
Friday, July 12, 2019
Region S.N.N.P
Zone SOUTH OMO
Wereda NYANGATOM
Selected Indictor: Seasonal Calendar for Hazards, Activities and Income Level By Kebele
Month of Hazard
Major_Problems /Disasters
Hazard Severity
Rank
Agricultural_Activities
Kebele Name NAKARMAN
E - Jan (Tir)
Drought, shortage of pasture and water
2
Income
Level Rank
F - Feb (Yekatit)
Drought, shortage of pasture and water
3
G - Mar (Megabit)
Drought, shortage of pasture and water
3
H - Apr (Meazea)
Drought, shortage of pasture and water
2
I - May (Ginbot)
Drought, shortage of pasture and water
1
J - Jun (Sene)
Livestock outbreak disease, drought
3
K - Jul (Hamle)
Livestock outbreak disease, drought
2
L - Aug (Nehase)
Livestock outbreak disease, drought
1
A - Sep (Meskerem)
Livestock outbreak disease, drought
1
B - Oct (Tikimt)
Conflict
3
C - Nov (Hidar)
Conflict
2
D - Dec (Tahsas)
Conflict
1
NOTE: Hazard Severity Rank helps prioritize the more severe hazards that have occurred in the months of disaster occurrence, 3 being the worst and 1
the least severe hazards.
55
Page 13 of 20

Wereda Disaster
Risk Profile
Data_Collected_Date
National Disaster Risk Management
Commission (NDRMC)
Friday, July 12, 2019
Region S.N.N.P
Zone SOUTH OMO
Wereda NYANGATOM
Selected Indictor: Seasonal Calendar for Hazards, Activities and Income Level By Kebele
Month of Hazard
Major_Problems /Disasters
Hazard Severity
Rank
Agricultural_Activities
Kebele Name NAPATOKOYET
E - Jan (Tir)
Drought, shortage of water and pasture
2
Income
Level Rank
1st
F - Feb (Yekatit)
Drought, shortage of water and pasture
3
1st
G - Mar (Megabit)
Livestock disease, shortage of pasture, drought
2
1st
H - Apr (Meazea)
Livestock disease, shortage of pasture, drought
3
1st
I - May (Ginbot)
Human and livestock disease, shortage of pasture
3
1st
J - Jun (Sene)
Human disease
2
1st
K - Jul (Hamle)
Human disease, shortage of water
3
1st
L - Aug (Nehase)
Human disease, shortage of water
3
1st
A - Sep (Meskerem)
Conflict, livestock stolen, loss of crop
1
1st
B - Oct (Tikimt)
Conflict, livestock stolen, loss of crop
3
1st
C - Nov (Hidar)
Conflict, livestock where stolen
3
1st
D - Dec (Tahsas)
Drought, shortage of pasture
2
1st
NOTE: Hazard Severity Rank helps prioritize the more severe hazards that have occurred in the months of disaster occurrence, 3 being the worst and 1
the least severe hazards.
56
Page 14 of 20

Wereda Disaster
Risk Profile
Data_Collected_Date
National Disaster Risk Management
Commission (NDRMC)
Friday, July 12, 2019
Region S.N.N.P
Zone SOUTH OMO
Wereda NYANGATOM
Selected Indictor: Seasonal Calendar for Hazards, Activities and Income Level By Kebele
Month of Hazard
Major_Problems /Disasters
Hazard Severity
Rank
Agricultural_Activities
Kebele Name NAPUSUMERYA
E - Jan (Tir)
Drought, shortage food and pasture
2
Income
Level Rank
F - Feb (Yekatit)
Livestock disease, drought, shortage food and pasture
3
G - Mar (Megabit)
Livestock disease, drought, shortage food and pasture
3
H - Apr (Meazea)
Livestock disease, drought, shortage food and pasture
2
I - May (Ginbot)
Human disease, drought and shortage food
2
J - Jun (Sene)
Human disease
3
K - Jul (Hamle)
Human disease
3
L - Aug (Nehase)
Shortage of pure water
3
A - Sep (Meskerem)
Shortage of pure water
3
B - Oct (Tikimt)
Shortage of pure water
3
C - Nov (Hidar)
Shortage of pure water
3
D - Dec (Tahsas)
Shortage of pure water
3
NOTE: Hazard Severity Rank helps prioritize the more severe hazards that have occurred in the months of disaster occurrence, 3 being the worst and 1
the least severe hazards.
57
Page 15 of 20
Wereda Disaster
Risk Profile
Data_Collected_Date
National Disaster Risk Management
Commission (NDRMC)
Friday, July 12, 2019
Region S.N.N.P
Zone SOUTH OMO
Wereda NYANGATOM
Selected Indictor: Seasonal Calendar for Hazards, Activities and Income Level By Kebele
Month of Hazard
Major_Problems /Disasters
Hazard Severity
Rank
Agricultural_Activities
Kebele Name NAROGOY
E - Jan (Tir)
Shortage of food and pasture
2
Income
Level Rank
F - Feb (Yekatit)
Shortage of pasture
3
G - Mar (Megabit)
Shortage of pasture
3
H - Apr (Meazea)
Shortage of food and water
3
I - May (Ginbot)
Livestock disease
2
J - Jun (Sene)
Livestock disease
3
K - Jul (Hamle)
Livestock disease
1
L - Aug (Nehase)
Human disease
3
A - Sep (Meskerem)
Human disease
1
B - Oct (Tikimt)
Human disease
1
C - Nov (Hidar)
Shortage of pasture
2
D - Dec (Tahsas)
Shortage of pasture
2
NOTE: Hazard Severity Rank helps prioritize the more severe hazards that have occurred in the months of disaster occurrence, 3 being the worst and 1
the least severe hazards.
58
Page 16 of 20

Wereda Disaster
Risk Profile
Data_Collected_Date
National Disaster Risk Management
Commission (NDRMC)
Friday, July 12, 2019
Region S.N.N.P
Zone SOUTH OMO
Wereda NYANGATOM
Selected Indictor: Seasonal Calendar for Hazards, Activities and Income Level By Kebele
Month of Hazard
Major_Problems /Disasters
Hazard Severity
Rank
Agricultural_Activities
Kebele Name NATEKER
E - Jan (Tir)
Shortage of pasture and water, conflict, shortage of
2
drinking water
F - Feb (Yekatit)
Shortage of pasture and water, conflict, shortage of
3
drinking water
G - Mar (Megabit)
Shortage of pasture and water, conflict, shortage of
3
drinking water
H - Apr (Meazea)
Shortage of pasture and water, conflict, shortage of
3
drinking water
I - May (Ginbot)
Human health, conflict
2
Income
Level Rank
J - Jun (Sene)
Human health, conflict
3
K - Jul (Hamle)
Human health, conflict
3
L - Aug (Nehase)
Shortage of pasture, shortage of food and water
3
A - Sep (Meskerem)
Shortage of pasture, shortage of food and water
3
B - Oct (Tikimt)
Shortage of pasture, shortage of food and water
3
C - Nov (Hidar)
Shortage of pasture, shortage of food and water
3
D - Dec (Tahsas)
Shortage of pasture, shortage of food and water
3
NOTE: Hazard Severity Rank helps prioritize the more severe hazards that have occurred in the months of disaster occurrence, 3 being the worst and 1
the least severe hazards.
59
Page 17 of 20

Wereda Disaster
Risk Profile
Data_Collected_Date
National Disaster Risk Management
Commission (NDRMC)
Friday, July 12, 2019
Region S.N.N.P
Zone SOUTH OMO
Wereda NYANGATOM
Selected Indictor: Seasonal Calendar for Hazards, Activities and Income Level By Kebele
Month of Hazard
Major_Problems /Disasters
Hazard Severity
Rank
Agricultural_Activities
Kebele Name NAWEYAPE
E - Jan (Tir)
Shortage of water and pasture, conflict
---------
Income
Level Rank
1st
F - Feb (Yekatit)
Shortage of water and pasture, conflict
---------
1st
G - Mar (Megabit)
Shortage of water and pasture, conflict
---------
1st
H - Apr (Meazea)
Shortage of water and pasture, conflict
---------
1st
I - May (Ginbot)
Human disease/malaria, conflict, livestock disease
---------
1st
J - Jun (Sene)
Human disease/malaria, conflict, livestock disease
---------
1st
K - Jul (Hamle)
Human disease/malaria, conflict, livestock disease
---------
1st
L - Aug (Nehase)
Shortage of food, pasture and water, conflict
---------
1st
A - Sep (Meskerem)
Shortage of food, pasture and water, conflict
---------
1st
B - Oct (Tikimt)
Shortage of food, pasture and water, conflict
---------
1st
C - Nov (Hidar)
Shortage of food, pasture and water, conflict
---------
1st
D - Dec (Tahsas)
Shortage of food, pasture and water, conflict
---------
1st
NOTE: Hazard Severity Rank helps prioritize the more severe hazards that have occurred in the months of disaster occurrence, 3 being the worst and 1
the least severe hazards.
60
Page 18 of 20

Wereda Disaster
Risk Profile
Data_Collected_Date
National Disaster Risk Management
Commission (NDRMC)
Friday, July 12, 2019
Region S.N.N.P
Zone SOUTH OMO
Wereda NYANGATOM
Selected Indictor: Seasonal Calendar for Hazards, Activities and Income Level By Kebele
Month of Hazard
Major_Problems /Disasters
Hazard Severity
Rank
Agricultural_Activities
Kebele Name SHENKORA
E - Jan (Tir)
Shortage of pasture and water, drought
3
Income
Level Rank
F - Feb (Yekatit)
Shortage of pasture and water, drought
2
G - Mar (Megabit)
Shortage of water, food and pasture
2
H - Apr (Meazea)
Shortage of water, food and pasture
1
I - May (Ginbot)
Livestock disease
2
J - Jun (Sene)
Livestock disease
1
K - Jul (Hamle)
Livestock disease
2
L - Aug (Nehase)
Human disease
2
A - Sep (Meskerem)
Human disease
2
B - Oct (Tikimt)
---------
C - Nov (Hidar)
---------
D - Dec (Tahsas)
---------
NOTE: Hazard Severity Rank helps prioritize the more severe hazards that have occurred in the months of disaster occurrence, 3 being the worst and 1
the least severe hazards.
61
Page 19 of 20

Wereda Disaster
Risk Profile
Data_Collected_Date
National Disaster Risk Management
Commission (NDRMC)
Friday, July 12, 2019
Region S.N.N.P
Zone SOUTH OMO
Wereda NYANGATOM
Selected Indictor: Seasonal Calendar for Hazards, Activities and Income Level By Kebele
Month of Hazard
Major_Problems /Disasters
Hazard Severity
Rank
Agricultural_Activities
Kebele Name TERGA
E - Jan (Tir)
Drought, shortage of food, pasture and water
2
Income
Level Rank
F - Feb (Yekatit)
Drought, shortage of food, pasture and water
2
G - Mar (Megabit)
Drought, shortage of food, pasture and water
3
H - Apr (Meazea)
Drought, shortage of food, pasture and water
3
I - May (Ginbot)
Drought, shortage of food, pasture and water
3
J - Jun (Sene)
Drought
2
K - Jul (Hamle)
Drought
1
L - Aug (Nehase)
Livestock disease, human disease, drought
3
A - Sep (Meskerem)
Livestock disease, human disease, drought
2
B - Oct (Tikimt)
Livestock disease, human disease, drought
2
C - Nov (Hidar)
Shortage of food, pasture and water
2
D - Dec (Tahsas)
Shortage of food, pasture and water
2
NOTE: Hazard Severity Rank helps prioritize the more severe hazards that have occurred in the months of disaster occurrence, 3 being the worst and 1
the least severe hazards.
62
Page 20 of 20

WDRP Indicators
Infrastructure Access Characteristics
63
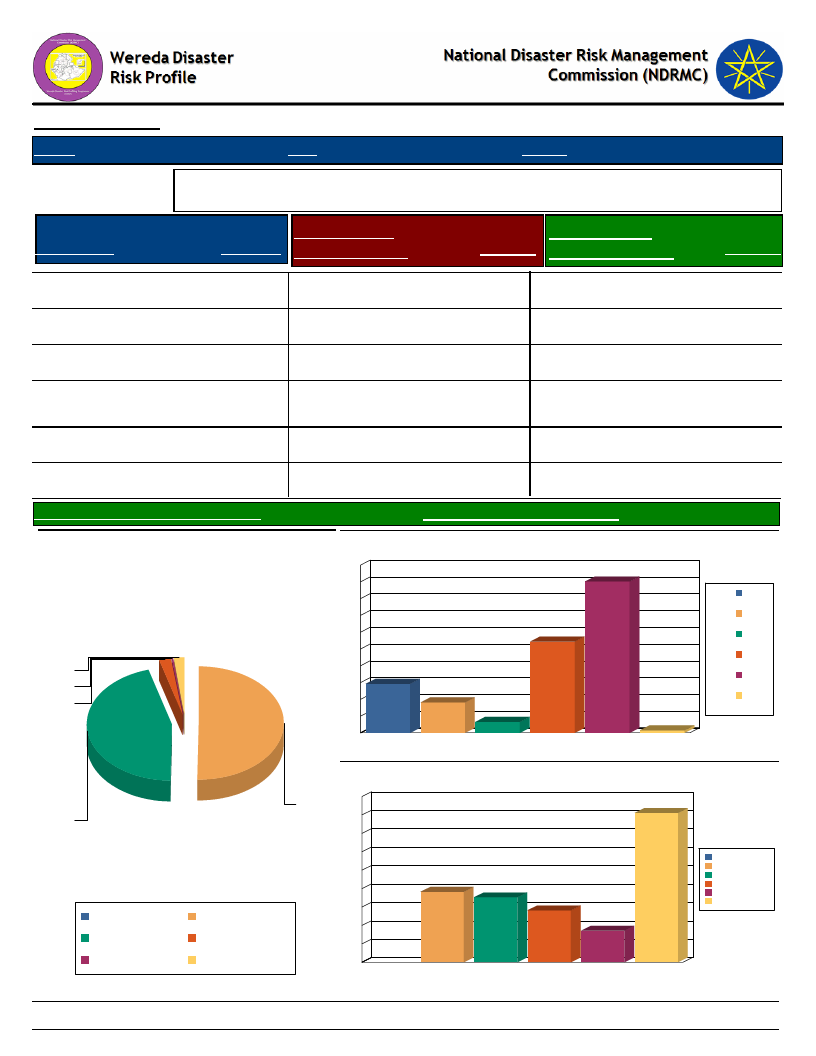
Data_Collected_Date
Region S.N.N.P
Zone SOUTH OMO
Friday, July 12, 2019
Wereda NYANGATOM
Selected Indicator
Type of Road
Yes, paved
Physical Vulnerability: Access to Roads & Urban Centres - Households access to
road and urban centre
Time to Nearest
Response Paved Road (Mins.)
Time To Nearest
Response Urban Center (Mins.)
2.02 Less than 30 min
45.09 Less than 1 hr
Response
8.56
Yes, partly paved road
0.25 30 – 60 min
27.20 1 - 2 hrs
19.14
Yes, gravel road
2.02 1 – 2 hrs
14.61 2 - 4 hrs
17.63
Yes, dirt road (difficult
for car)
No road
45.09 2 – 3 hrs
49.87 3 – 4 hrs
9.07 4 - 6 hrs
3.27 More than 6 hrs
14.11
40.55
More than 4 hrs
0.76
Avg Time To Nearest Urban Center(Mins.)
Type of Road
2
0
2
50
45
Yes, dirt road (difficult
for car)
Yes, partly paved road
No road
Yes, gravel road
Yes, paved
298.19
Avg_Time_To_Nearest_Paved_Road
65.48
Time to reach the nearest paved road from the HH
50
45
45
40
1 – 2 hrs
35
2 – 3 hrs
30
27
3 – 4 hrs
25
20
15
15
10
5
0
1 – 2 hrs
9
2 – 3 hrs
3
3 – 4 hrs
30 – 60 min
Less than 30
min
1
More than 4
hrs
30 – 60 min
Less than 30 min
More than 4 hrs
Time to reach nearest urban center from the HH
45
41
40
35
30
25
20
19
18
15
14
1 - 2 hrs
2 - 4 hrs
4 - 6 hrs
Less than 1 hr
More than 6 hrs
10
9
5
0
1 - 2 hrs
2 - 4 hrs
4 - 6 hrs
Less than 1 hr More than 6 hrs
64
Page 1 of 1

Data_Collected_Date
Region S.N.N.P
Zone SOUTH OMO
Friday, July 12, 2019
Wereda NYANGATOM
Selected Indicator
Physical Vulnerability: Access to Electricity - Households access and utilization
of electricity
Household_Located_In_Electricity
0.00
Household_Connected_To Electricity
0.00
65
Page 1 of 1
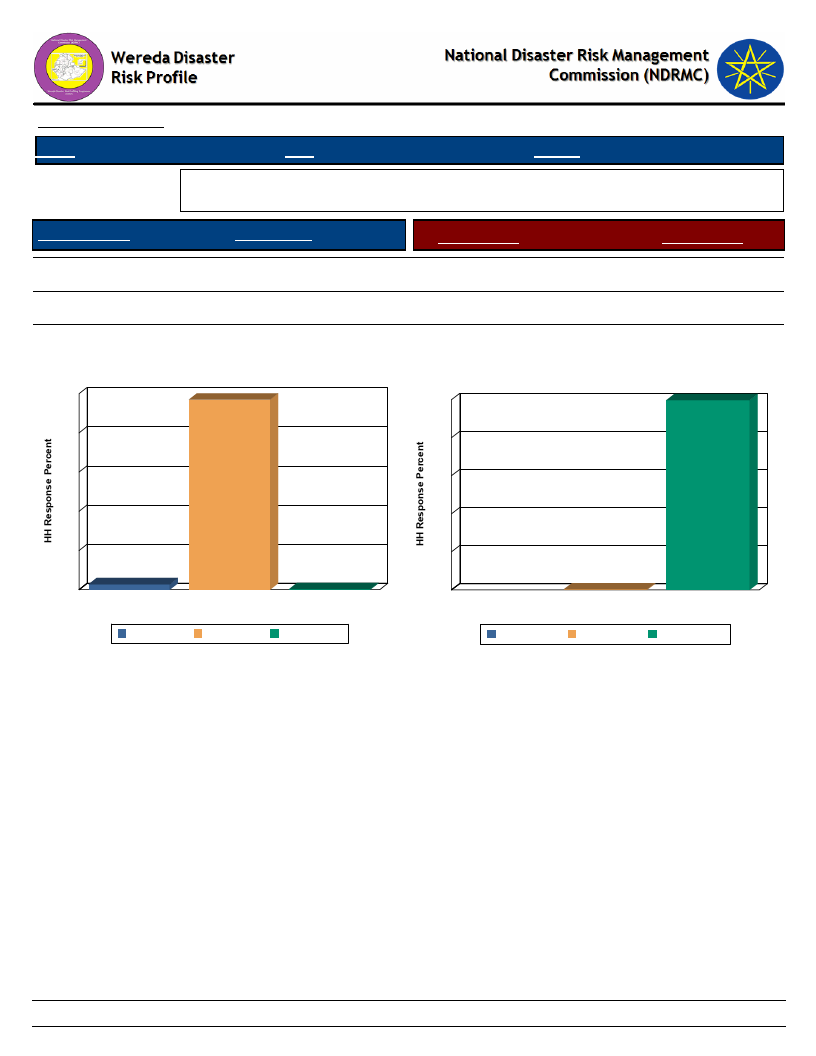
Data_Collected_Date
Region S.N.N.P
Zone SOUTH OMO
Friday, July 12, 2019
Wereda NYANGATOM
Selected Indicator
Physical Vulnerability: Type of Dwelling Units - Households type of dwelling
houses
Floor Structure
HH Response
Type of Floor
HH Response
Tin house
0.25
Concrete
0.26
Mobile home
2.78
Non-Concrete
99.74
Thatched
96.97
Floor Structure
100
97
80
Type of Floor
100
100
80
60
60
40
40
20
20
3
0
0
0
Mobile home
Thatched
Tin house
Floor Structure
Mobile home Thatched
Tin house
0
Concrete
Type of Floor
Concrete
Non-Concrete
Non-Concrete
66
Page 1 of 1
WDRP Indicators
Socio Demographic Characteristics
67
Wereda Disaster
Risk Profile
National Disaster Risk Management
Commission (NDRMC)
Data_Collected_Date
Friday, July 12, 2019
Region S.N.N.P
Zone SOUTH OMO
Wereda NYANGATOM
Selected Indicator
Economic Vulnerability: Level of Migration - Migration level and its characteristics by Kebele
Kebele Name
AYEPA
KAJAMAKEN
KEBELE 01
KOPEREYA
Approx_No. Age_Group
30 - 45
All
80 - 100
200 - 250
Youth and
working gr
All
20 - 30
Youth
Sex
Both
Both
Both
Both
Migration_Period
February to April
January to April,
August to De
December to
January
February
Migration Trend
Increased
Increased
Decreased
Increased
Migration_Reason
Loss of asset,
economic hardship
Shortage of food,
pasture and water
Loss of asset
Loss of asset
Destination
Migrute Tirya
Tirga
Tirga kebele
Tirga
KUCHURU
10 - 15
Youth
Youth
April
Increased
Loss of asset
LOKAMEGNAN
LOKORLEM
LOPAKOR
LORENKACHAWE
More than
80
Youth and
working gr
More than
150
20 - 25
Youth and
working gr
Youth
Both
Male
Both
September to
March
January to June
February
Increased
Increased
Increased
---------
Searching water and
pasture, escape from
conflict
Searching pastor and
water
Searching for water
and pasture
Tigra
Nayita/Tirga
LOTOMEN
NAPATOKOYET
NAROGOY
85 -100
30 - 35
50 and
above
Youth and
working gr
Youth and
working gr
Adult
Both
Both
Both
January to June
February, March,
April
January to April
Increased
Increased
Increased
Loss of asset
Searching water and
pasture
Shortage of water
and pasture, loss of
asset
Tirga
Tirga
Niata, Tirga
68
Page 1 of 2

Wereda Disaster
Risk Profile
National Disaster Risk Management
Commission (NDRMC)
Data_Collected_Date
Friday, July 12, 2019
Region S.N.N.P
Zone SOUTH OMO
Wereda NYANGATOM
Selected Indicator
Economic Vulnerability: Level of Migration - Migration level and its characteristics by Kebele
Kebele Name
NATEKER
NAWEYAPE
SHENKORA
TERGA
KOWTEM
LEBERE
NAKARMAN
NAPUSUMERYA
Approx_No. Age_Group
75 and
above
75
15 - 20
Youth and
working gr
Youth and
working gr
Youth
5 - 10
Youth
100 and
above
100 and
above
Youth and
working gr
Youth and
working gr
40 - 50
Youth
50 - 80
Youth and
working gr
Sex
Male
Male
Both
Male
Male
Male
Both
Male
Migration_Period
January to April ,
August to D
January, April,
August to Dece
February
Migration Trend
Increased
Increased
Decreased
February
Increased
January, April,
August to Dece
September to
March
Increased
Increased
February - October
Increased
January to April
Increased
Migration_Reason
Searching pasture
and water
Searching water and
pasture
Searching pasture
and water
Searching water and
pasture
Searching food,
pasture and water
Searching of pasture
and water, to escape
from conflict
Searching water and
pasture
Searching food,
pasture and water
Destination
Tirgra, Nayita
Tirga
Tirga
Triga
Tirga
Tirga
Tirga
Tirga
69
Page 2 of 2
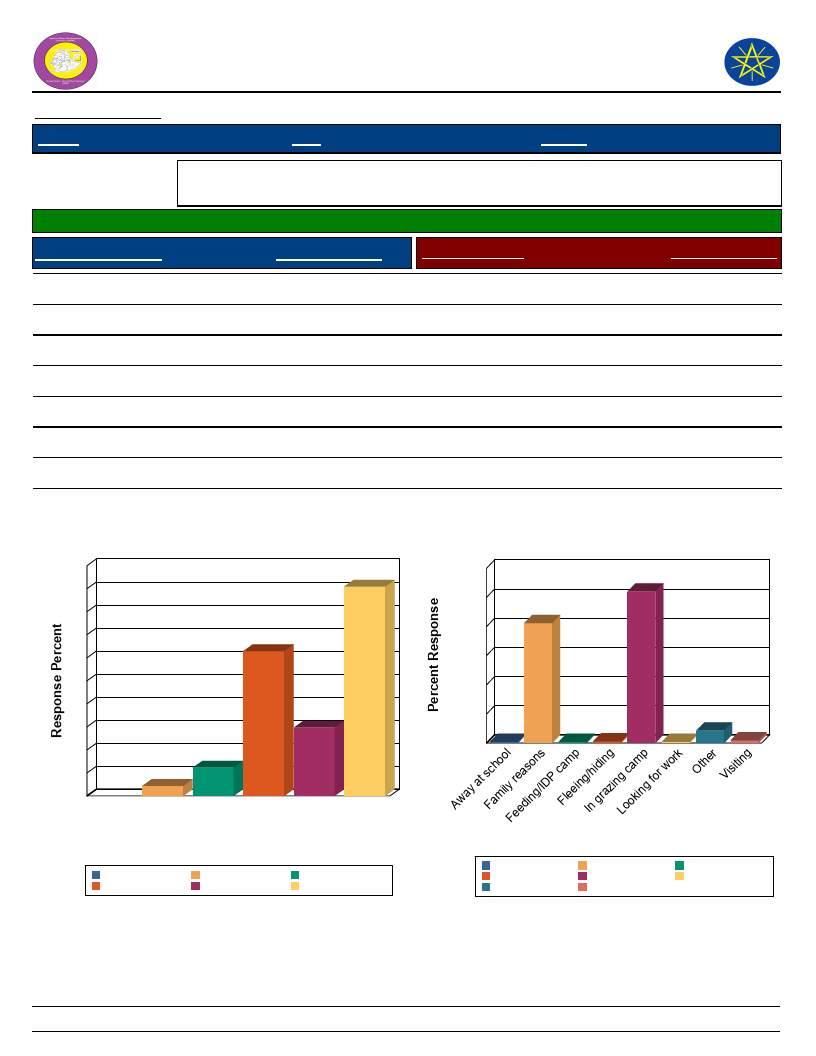
Wereda Disaster
Risk Profile
Data_Collected_Date
Region S.N.N.P
National Disaster Risk Management
Commission (NDRMC)
Friday, July 12, 2019
Zone SOUTH OMO
Wereda NYANGATOM
Selected Indicator
Economic Vulnerability: Household Migration - Household migration and reason
for migration
Households who migrated (%)
25.15
Duration of Migration
Response Percent
Migration Reason
Response Percent
Less than 2 weeks
Two weeks – month
A month – 3 months
3 – 6 months
> 6 months
14.82
45.45
31.42
6.13
2.17
Visiting
Family reasons
Looking for work
In grazing camp
Fleeing/hiding
Feeding/IDP camp
Away at school
Other
0.96
41.15
0.38
51.92
0.58
0.38
0.38
4.23
Duration of Migration
50
45
45
40
35
31
30
25
20
15
15
10
6
5
2
0
> 6 3 – 6 A month Less Two
months months – 3 than 2 weeks –
months weeks month
Duration of Migration
A month – 3 months
> 6 months
Less than 2 weeks
3 – 6 months
Two weeks – month
Migration Reason
60
52
50
41
40
30
20
10
0
01
0
0
Away at sFcahmooilylFereeadsinogn/sIDP cFalmeepingI/nhigdrinagzingLocoakminpg for work
4
1
Other Visiting
Migration Reason
Away at school
Fleeing/hiding
Other
Family reasons
In grazing camp
Visiting
Feeding/IDP camp
Looking for work
70
Page 1 of 1
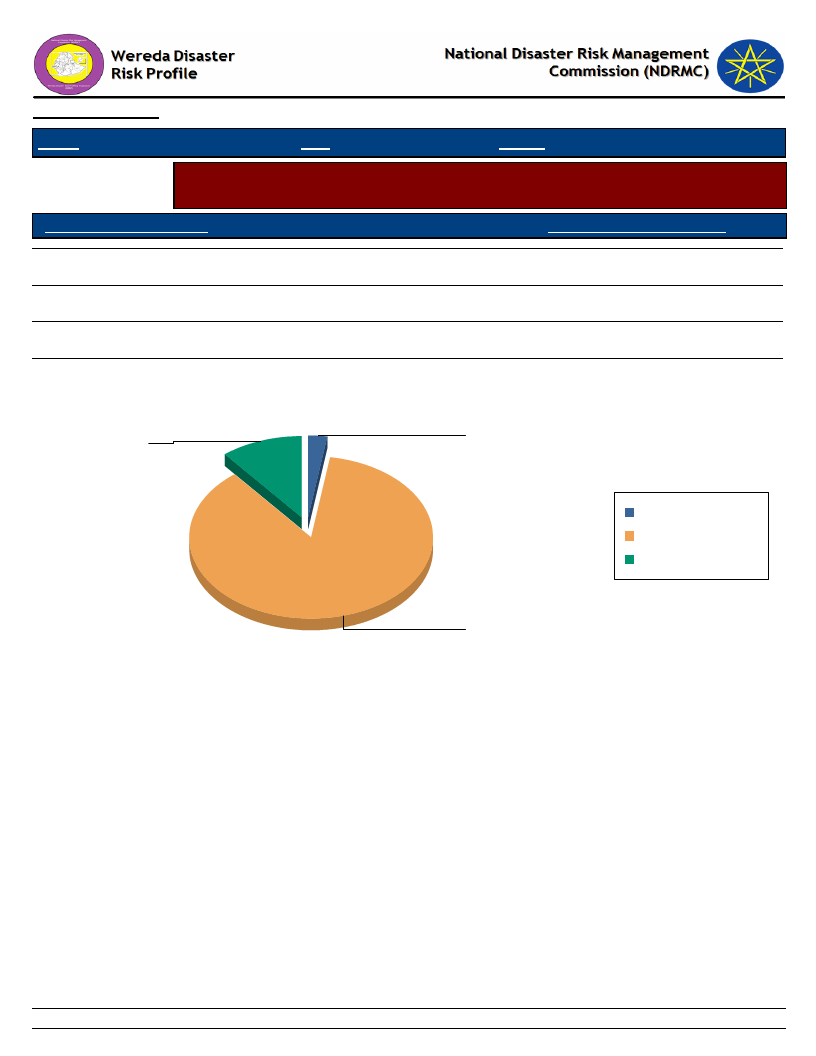
Data_Collected_Date
Friday, July 12, 2019
Region S.N.N.P
Zone SOUTH OMO
Wereda NYANGATOM
Selected Indicator
Economic Vulnerability: Household Migration - Disasters as a triggering factor for
migration (households response in %)
Is Migration Due to Hazard?
HH Response - Due To Hazard
No
88.30
Yes
11.17
Migration partly because of such impacts
2.66
Is Migration Due to Hazard?
Yes
11.2
Migration partly because of such
impacts
2.7
Migration partly because
of such impacts
No
Yes
No
88.3
71
Page 1 of 1
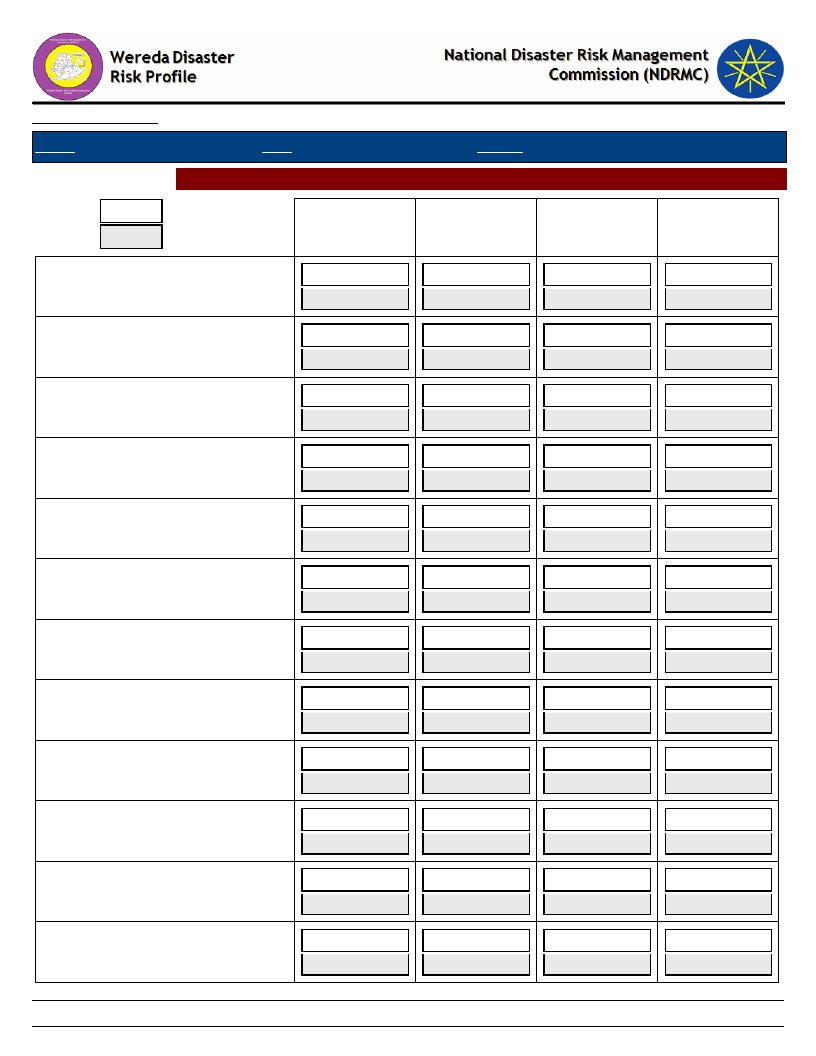
Data_Collected_Date
Region S.N.N.P
Zone SOUTH OMO
Selected Indictor: Demography: Population Structure
KEY:
Male
Female
A-Children
(0-12 yrs)
AYEPA
12
8
KAJAMAKEN
-
-
KEBELE 01
8
10
KOPEREYA
12
8
KOWTEM
-
-
KUCHURU
20
10
LEBERE
10
7
LOKAMEGNAN
-
-
LOKORLEM
7
9
LOPAKOR
15
10
LORENKACHAWE
10
5
LOTOMEN
12
8
Wereda NYANGATOM
B-Youth
(12-25 yrs)
17
13
14
16
12
20
17
13
17
16
15
10
18
15
14
14
14
14
18
12
18
17
20
15
C-Working
(25-55 yrs)
-
-
16
19
19
16
10
25
-
-
9
21
-
-
19
21
18
20
15
20
10
30
-
-
72
Friday, July 12, 2019
D-Older
(Above 55
10
5
-
-
10
5
6
9
10
6
-
-
6
4
-
-
11
7
6
4
8
7
7
8
Page 1 of 2
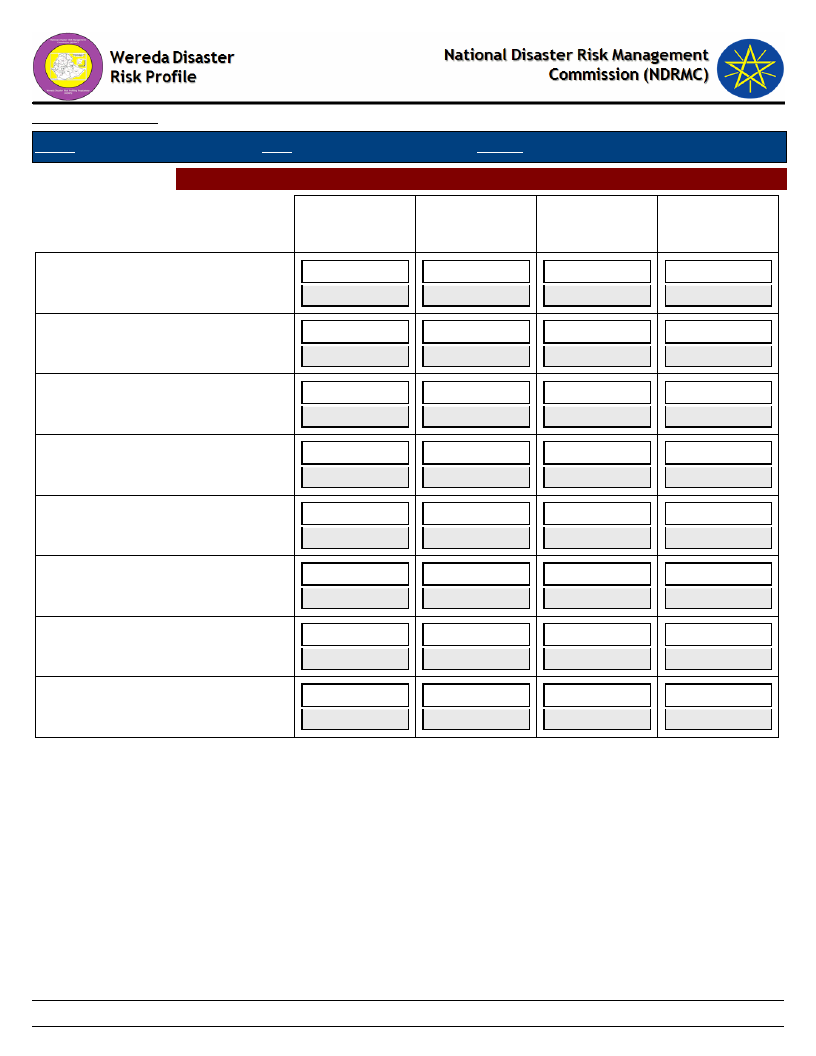
Data_Collected_Date
Region S.N.N.P
Zone SOUTH OMO
Selected Indictor: Demography: Population Structure
A-Children
(0-12 yrs)
NAKARMAN
15
10
NAPATOKOYET
14
11
NAPUSUMERYA
12
8
NAROGOY
17
6
NATEKER
6
9
NAWEYAPE
10
10
SHENKORA
18
9
TERGA
10
10
Wereda NYANGATOM
Friday, July 12, 2019
B-Youth
(12-25 yrs)
20
10
17
8
13
17
15
10
14
16
13
12
17
3
13
12
C-Working
(25-55 yrs)
15
20
13
22
10
25
12
18
21
19
16
19
15
20
16
19
D-Older
(Above 55
7
3
-
-
10
5
13
7
9
6
10
10
7
8
10
10
73
Page 2 of 2
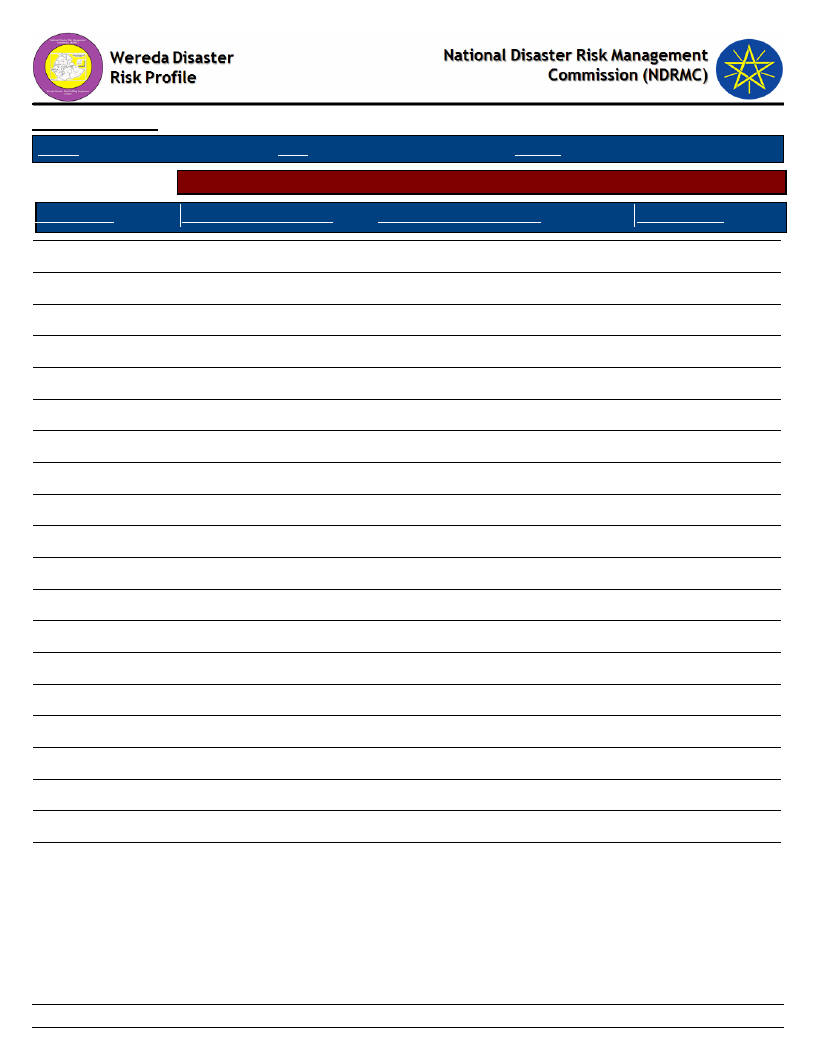
Data_Collected_Date
Region S.N.N.P
Zone SOUTH OMO
Friday, July 12, 2019
Wereda NYANGATOM
Selected Indicator
Demography: Population Trends and Ethnic Groups
Kebele Name
Population Change Trend
Population Change Reasons
Ethnic_Groups
AYEPA
KAJAMAKEN
KEBELE 01
KOPEREYA
KUCHURU
LOKAMEGNAN
LOKORLEM
LOPAKOR
LORENKACHAWE
LOTOMEN
NAPATOKOYET
NAROGOY
NATEKER
NAWEYAPE
SHENKORA
TERGA
KOWTEM
LEBERE
NAKARMAN
NAPUSUMERYA
Increased
Increased
Increased
Increased
Increased
Increased
Increased
Increased
Increased
Increased
Increased
Increased
Increased
Increased
Increased
Increased
Increased
Increased
Increased
Increased
More children
More children, immigration
Drought
More children
More children
More children
More children
More children
More children
More children, in migration
More children
More children
More children
More children
More children
More children
More children, In migration
More children, in migration
More children
More children, in migration
Nyangaton
Nyangatom
Nyangatom
Nyangatom
Koyikoy
Nyangatom
Nyangatom
Nyangatom
Nyngatom
Nyangatom
Nyangatom
Nyangatom
Nyangatom
Nyangatom
Nyangatom
Nyangatom
Nyangatom
Nyngatom
Nyangatom
Nyangatom
74
Page 1 of 1
Data_Collected_Date
Friday, July 12, 2019
Region S.N.N.P
Zone
SOUTH OMO
Wereda NYANGATOM
Selected Indicator
Social Vulnerability: Household Demographic Characteristics - Demographic
characteristics of households
Demographic Indicator
Indicator_Value Comments
Average household size
5.3
Sex ratio
1,062.0 Number of females per 1000 males
Child sex ratio (under 14 yrs)
968.0 Number of females per 1000 males
Adult sex ratio (18 & Above yrs)
1,343.0 Number of females per 1000 males
Dependency ratio ([(0-14)+(64+)] / (15-64)
1.4
yrs)
75
Page 1 of 1
Wereda Disaster
Risk Profile
Data_Collected_Date
National Disaster Risk Management
Commission (NDRMC)
Friday, July 12, 2019
Region S.N.N.P
Selected Indicator
General Awareness
Zone
SOUTH OMO
Wereda NYANGATOM
Social Vulnerability: Level of Educational Attainment - Education status of household members
Percentage Educational Level
Percentage
Read and understand text - Yes, easily
Read and understand text - Yes, with
difficulty
Can write letters - Yes, easily
Can write letters - Yes, with difficulty
General Literacy Rate
Proportion of literate population (7+) to total 7+
population
3.03
From Proportion of population (7+) - Less than 1st grade completed
4.64
Primary Education (Grade 1 - 6) Student
2.89
Secondary School Education (7 - 12) Student
2.55
From Proportion of population (7+) - Technical / vocational
certificate or diploma
From Proportion of population (7+) - University degree or higher
From Proportion of population (15+) - Less than 1st grade
From Proportion of population (15+) - Primary (1-6)
From Proportion of population (15+) - Secondary (7-12)
From Proportion of population (15+) - Technical
UNIVERSITY DEGREE
Percentage
6.08
Adult Literacy Rate
Proportion of literate population (15+) to total 15+
population
69.83
27.85
1.87
0.06
0.13
83.14
13.21
3.08
0.11
0.23
Percentage
4.00
76
Page 1 of 1

Data_Collected_Date
Friday, July 12, 2019
Region S.N.N.P
Zone SOUTH OMO
Wereda NYANGATOM
Selected Indicator
Social Vulnerability: Gender Parity - Gender parity in education level (7+ years)
and household heading
Educational Level
Male_Percent
Female_Percent
From Proportion of population (7+) - Less than 1st grade
completed
From Proportion of population (7+) - Technical / vocational
certificate or diploma
From Proportion of population (7+) - University diploma
46.07
0.00
0.00
53.93
0.00
0.00
From Proportion of population (7+) - Pursuing University degree
0.00
0.00
From Proportion of population (7+) - University degree or higher
100.00
0.00
Primary Education (Grade 1 - 6) Student
49.53
50.47
Secondary School Education (7 - 12) Student
89.29
10.71
Male Head of HH
50.90
Female Head of HH
49.10
77
Page 1 of 1

WDRP Indicators
Environmental Characteristics
78

Data_Collected_Date
Region S.N.N.P
Zone SOUTH OMO
Friday, July 12, 2019
Wereda NYANGATOM
Selected Indicator
Environmental Situation: Environmental Problems - Major environmental
problems by Kebele
KebeleName
Problem_1
Problem_2
Problem_3
Problem4
AYEPA
Wind erosion
Deforestation
Temperature
KAJAMAKEN
Temperature
Soil erosion
Deforestation
KEBELE 01
Pest
Deforestation
KOPEREYA
Deforestation
Wind erosion
High temperature
KUCHURU
Wind erosion
Water pollution
Deforestation
LOKAMEGNAN
High temperature
LOKORLEM
Deforestation
High temperature
Poisonous tree
LOPAKOR
Wind erosion
Deforestation
High temperature
LORENKACHAWE
Erosion
Deforestation
High temperature
LOTOMEN
NAPATOKOYET
Deforestation
High temperature
High temperature
Deforestation
Livestock disease
out break
High rain fall
NAROGOY
Deforestation
Soil erosion
Temperature
Air pollution
NATEKER
Temperature
Soil erosion
Deforestation
NAWEYAPE
Temperature
SHENKORA
Deforestation
Erosion
High temperature
TERGA
Erosion
Deforestation
High temperature
KOWTEM
LEBERE
Temperature
Temperature
Soil erosion with
land degradation
Poisonous tree
79
Page 1 of 2
Data_Collected_Date
Region S.N.N.P
Zone SOUTH OMO
Friday, July 12, 2019
Wereda NYANGATOM
Selected Indicator
Environmental Situation: Environmental Problems - Major environmental
problems by Kebele
KebeleName
Problem_1
Problem_2
Problem_3
Problem4
NAKARMAN
Wind erosion
Deforestation
NAPUSUMERYA
Erosion
Deforestation
High temperature
Shortage of rain fall
80
Page 2 of 2
Data_Collected_Date
Region S.N.N.P
Zone SOUTH OMO
Friday, July 12, 2019
Wereda NYANGATOM
Selected Indicator
Environmental Situation: General Land Quality - Perceptions of the community
on changes in the general quality of land over a decade
KebeleName
AYEPA
Current_Situation
Good
KAJAMAKEN
KEBELE 01
Not usable
Change_Last_Decade
Increased
Decreasing
Comment
Because they are use
irrigation land to ensure
crop
Carried with of foreign
tree
KOPEREYA
KUCHURU
LOKAMEGNAN
Poor land use
Good
Low land use
No change
Increased
Increased
Good fertile soil but
have shortage of land
Using irrigation land
properly
LOKORLEM
LOPAKOR
Covered with foreign tree,
poor quality
Poor land use
LORENKACHAWE
Poor land use
LOTOMEN
NAPATOKOYET
Poor quality
Unproductive
NAROGOY
Decreasing
No change
No change
Decreasing
Decreasing
Reducing the area
productivity too
Fertile soil but no
enough rain fall
Good fertile and
irrigation land but not
wet
Covered with canopy of
poisons tree
Pasture productivity of
the areas is decreasing
year to year
NATEKER
NAWEYAPE
SHENKORA
Not usable
Not usable
Good
Decreased
Decreasing
Increased
Covered with canopy of
foreign tree
Covered with canopy for
foreign free
Use irrigation land by
distribution system
81
Page 1 of 2

Data_Collected_Date
Region S.N.N.P
Zone SOUTH OMO
Friday, July 12, 2019
Wereda NYANGATOM
Selected Indicator
Environmental Situation: General Land Quality - Perceptions of the community
on changes in the general quality of land over a decade
KebeleName
TERGA
KOWTEM
LEBERE
NAKARMAN
Current_Situation
Poor qualities of land use
Not usable
Low quality, invaded with
foreign poisonous tree
Good
Change_Last_Decade
No change
Decreased
Increasing
No change
Comment
Having fertile soil but no
capacity to work
Covered with canopy of
foreign tree
Its diminishing quality of
the land is burning issue
Not able to work farming
NAPUSUMERYA
Poor land use
No change
Good ad fertile irrigation
land but not used
82
Page 2 of 2

Data_Collected_Date
Friday, July 12, 2019
S.N.N.P
Region
Selected Indicator
Zone SOUTH OMO
Wereda NYANGATOM
Environmental Situation: Changes in Landscape - Changes observed by the
community on landscape and the problems due to the changes
KebeleName
Changes_Observed
Problems_Due_To_Changes
AYEPA
KAJAMAKEN
KEBELE 01
Changing land for farming
that means taking by
investment
The area is covered with a
canopy of foreign tree
called prosophis tree
Environmental change
Shortage of pasture land
The tree damage any grass species
KOPEREYA
Poor land use
Shortage of grazing area
KUCHURU
LOKAMEGNAN
LOKORLEM
LOPAKOR
LORENKACHAWE
Poor land use
The land covered at foreign
poisonous
Covered by common
poisonous tree
The land cover with grass
and plant species with
unpalatable due to soil
fertility
Poor land cover
Shortage of rain fall, shortage of honey
production
Shortage of food, pasture, human health problem
Shortage of rain fall, increasing wind erosion
Shortage of pasture
LOTOMEN
NAPATOKOYET
NAROGOY
Covered with foreign
poisonous tree
The area covered with for
foreign implantable plant
species
Wind erosion reduce
pasture land in to bare
land, drought destroy
palatable plants with
unpalatable and thorny
plant species
Destruction of grass species, pasture loss,
livestock death and human health problem
Shortage of pasture, livestock disease
Range land shortage and feed resource shortage
83
Page 1 of 2
Data_Collected_Date
Friday, July 12, 2019
S.N.N.P
Region
Selected Indicator
Zone SOUTH OMO
Wereda NYANGATOM
Environmental Situation: Changes in Landscape - Changes observed by the
community on landscape and the problems due to the changes
KebeleName
NATEKER
NAWEYAPE
SHENKORA
Changes_Observed
Covered with a canopy of
foreign tree could
prosophis tree
Covered with a canopy of
foreign tree called
prosophis tree
Poor
Problems_Due_To_Changes
The tree destroy any grass species around,
shortage of pasture
Shortage of pasture and rain fall
TERGA
KOWTEM
Land cover with forest is
reduced
Covered with canopy tree
Shortage of rain fall and pasture
LEBERE
NAKARMAN
NAPUSUMERYA
Covered with a canopy of
foreign poisonous tree
Changing farming system
that, measure cutting of
three for farming
Land cover with palatable
grass and plant species are
changed with unpalatable
due to soil fertility loss
Distribution of palatable grass and plants create
shortage animal feed
Shortage of pasture land
Shortage of livestock feed
84
Page 2 of 2
Wereda Disaster Risk
Profile
Data_Collected_Date
Region S.N.N.P
Zone SOUTH OMO
National Disaster Risk Management
Commission (NDRMC)
Friday, July 12, 2019
Wereda NYANGATOM
Selected Indicator
Kebele Name
Environmental Situation: Land-Use other than crop production - Types of land use other than crop production
across Kebeles
Landuse_1
Comments_1
Landuse_2
Comments_2
Landuse_3
Comments_3
AYEPA
Grazing land
Forest
KAJAMAKEN
Grazing land
KEBELE 01
KOPEREYA
Grazing land
Forest
KUCHURU
Forest
Bee keeping
LOKAMEGNAN
Grazing land
LOKORLEM
Grazing land
LOPAKOR
Grazing land
Forest
LORENKACHAWE
Grazing land
Forest
LOTOMEN
Grazing land
NAPATOKOYET
Grazing land
Forest
NAROGOY
Grazing land
Forest
NATEKER
Grazing land
NAWEYAPE
Grazing land
SHENKORA
Grazing land
Forest
85
Page 1 of 2

Wereda Disaster Risk
Profile
Data_Collected_Date
Region S.N.N.P
Zone SOUTH OMO
National Disaster Risk Management
Commission (NDRMC)
Friday, July 12, 2019
Wereda NYANGATOM
Selected Indicator
Kebele Name
Environmental Situation: Land-Use other than crop production - Types of land use other than crop production
across Kebeles
Landuse_1
Comments_1
Landuse_2
Comments_2
Landuse_3
Comments_3
TERGA
Grazing land
Forest
KOWTEM
Grazing land
LEBERE
Grazing land
NAKARMAN
Grazing land
NAPUSUMERYA
Grazing land
For livestock
Forest land
For house
construction
Irrigation land
86
Page 2 of 2
Data_Collected_Date
Region S.N.N.P
Zone SOUTH OMO
Friday, July 12, 2019
Wereda NYANGATOM
Selected Indicator
KebeleName
Environmental Situation: Deforestation - Observed changes over levels of
deforestation by the community and its problems
Changes_Observed
Problems_Due_To_Changes
AYEPA
Increased
Shortage of painful, shortage of livestock feed
KAJAMAKEN
KEBELE 01
Usable forest trees
are changed with
unusable one
Increasing environmental temperature reduced land
moisture and aggravate oddity of the area reduced
productivity of pasture land
KOPEREYA
Increasing
Drought, shortage of pasture and rain fall
KUCHURU
Increasing
Shortage of rain fall
LOKAMEGNAN
LOKORLEM
LOPAKOR
Increased
Increasing
deforestation
Deforestation
Increasing environmental temperature, reduced land
moisture and fertility
Wind degradation
Climate change
LORENKACHAWE
High deforestation
Climate change
LOTOMEN
NAPATOKOYET
Increasing
Increasing
Destroy portable plantation, feed shortage, livestock death
and climate change
Increasing environmental temperature
NAROGOY
NATEKER
NAWEYAPE
SHENKORA
Expansion of
investment leads high
deforestation
Usable forest trees
are changed with
unusable
Increased
Increased
climate change, drought, shortage of food
High temperature, decreasing land moisture, decreased
productivity
Increasing temperature, reduce land moisture and
decreased productivity
Climate change, drought
TERGA
Increased
Drought, shortage of rain fall
87
Page 1 of 2
Data_Collected_Date
Region S.N.N.P
Zone SOUTH OMO
Friday, July 12, 2019
Wereda NYANGATOM
Selected Indicator
KebeleName
Environmental Situation: Deforestation - Observed changes over levels of
deforestation by the community and its problems
Changes_Observed
Problems_Due_To_Changes
KOWTEM
Increased
Climate change, shortage of pasture
LEBERE
NAKARMAN
Increasing
Increased
High temperature, decreasing land moisture and fertility,
reduced pasture
Shortage of rain fall, shortage of pasture
NAPUSUMERYA
Increasing
Climate change
88
Page 2 of 2
Wereda Disaster
Risk Profile
National Disaster Risk Management
Commission (NDRMC)
Data_Collected_Date
Region S.N.N.P
Zone SOUTH OMO
Wereda NYANGATOM
Friday, July 12, 2019
Selected Indicator
KebeleName
Environmental Situation: Natural Resources Availability - Natural resources available and changes observed by
the community
AYEPA
Resources_1
Water
Resources_3
Fish
Observed_Change_1
Decreased
Observed_Change_3
Decreased
Problems_Changes_1
Resources_2
Shortage of pure drinking water
Forest
Problems_Changes_3
Resources_4
The community member can not get
balance diet
Observed_Change_2
Decreased
Observed_Change_4
Problems_Changes_2
Deforestation
Problems_Changes_4
KebeleName
KAJAMAKEN
Resources_1
Land
Observed_Change_1
Decreased
Problems_Changes_1
Shortage of food, increasing area aridity
Resources_3
Observed_Change_3
Problems_Changes_3
Resources_2
Observed_Change_2
Problems_Changes_2
Pasture
Replacement of portable plants
Shortage of pasture, death of livestock
Resources_4
Observed_Change_4
Problems_Changes_4
KebeleName
KEBELE 01
89
Page 1 of 10

Wereda Disaster
Risk Profile
National Disaster Risk Management
Commission (NDRMC)
Data_Collected_Date
Region S.N.N.P
Zone SOUTH OMO
Wereda NYANGATOM
Friday, July 12, 2019
Selected Indicator
Resources_1
Observed_Change_1
Problems_Changes_1
Environmental Situation: Natural Resources Availability - Natural resources available and changes observed by
the community
Land
Resources_3
Wood
Degraded
Observed_Change_3
Decreased
Migration
Problems_Changes_3
Deforestation
Resources_2
Observed_Change_2
Problems_Changes_2
Water
Decreased
Dried
Resources_4
Observed_Change_4
Problems_Changes_4
KebeleName
KOPEREYA
Resources_1
Land
Observed_Change_1
Decreased
Problems_Changes_1
Shortage of pasture and death of livestock
Resources_3
Observed_Change_3
Problems_Changes_3
Water
Decreased
Absence of over flow
Resources_2
Observed_Change_2
Problems_Changes_2
Wood
Decreased
Shortage of forest
Resources_4
Observed_Change_4
Problems_Changes_4
KebeleName
KOWTEM
90
Page 2 of 10

Wereda Disaster
Risk Profile
National Disaster Risk Management
Commission (NDRMC)
Data_Collected_Date
Region S.N.N.P
Zone SOUTH OMO
Wereda NYANGATOM
Friday, July 12, 2019
Selected Indicator
Resources_1
Observed_Change_1
Environmental Situation: Natural Resources Availability - Natural resources available and changes observed by
the community
Land
Resources_3
Covered with foreign tree
Observed_Change_3
Problems_Changes_1
Resources_2
Shortage of pasture, increasing area
aridity
Pasture
Problems_Changes_3
Resources_4
Observed_Change_2
Problems_Changes_2
Replacement of palatable plant with un
palatable
Shortage of pasture, death of livestock
Observed_Change_4
Problems_Changes_4
KebeleName
KUCHURU
Resources_1
Forest
Observed_Change_1
Decreased
Problems_Changes_1
Decreasing of honey production
Resources_3
Observed_Change_3
Problems_Changes_3
Resources_2
Observed_Change_2
Problems_Changes_2
Fish
Decreasing
Observe of over flow of Omo river
Resources_4
Observed_Change_4
Problems_Changes_4
KebeleName
LEBERE
91
Page 3 of 10

Wereda Disaster
Risk Profile
National Disaster Risk Management
Commission (NDRMC)
Data_Collected_Date
Region S.N.N.P
Zone SOUTH OMO
Wereda NYANGATOM
Friday, July 12, 2019
Selected Indicator
Resources_1
Observed_Change_1
Problems_Changes_1
Environmental Situation: Natural Resources Availability - Natural resources available and changes observed by
the community
Land
Resources_3
Decreased
Observed_Change_3
Shortage of pasture, reduced soil moisture
Problems_Changes_3
Resources_2
Observed_Change_2
Problems_Changes_2
Pasture
Decreased
Palatable grass replaced with unpalatable
Resources_4
Observed_Change_4
Problems_Changes_4
KebeleName
LOKAMEGNAN
Resources_1
Land
Observed_Change_1
Decreasing
Problems_Changes_1
Shortage of food, reduce soil moisture
Resources_3
Observed_Change_3
Problems_Changes_3
Resources_2
Observed_Change_2
Problems_Changes_2
Resources_4
Observed_Change_4
Problems_Changes_4
KebeleName
LOKORLEM
92
Page 4 of 10
Wereda Disaster
Risk Profile
National Disaster Risk Management
Commission (NDRMC)
Data_Collected_Date
Region S.N.N.P
Zone SOUTH OMO
Wereda NYANGATOM
Friday, July 12, 2019
Selected Indicator
Resources_1
Observed_Change_1
Problems_Changes_1
Environmental Situation: Natural Resources Availability - Natural resources available and changes observed by
the community
Land
Resources_3
Decreasing
Observed_Change_3
Decreasing pasture
Problems_Changes_3
Resources_2
Observed_Change_2
Problems_Changes_2
Resources_4
Observed_Change_4
Problems_Changes_4
KebeleName
LOPAKOR
Resources_1
Grazing land
Observed_Change_1
Decreased
Problems_Changes_1
Shortage of food and pasture
Resources_3
Observed_Change_3
Problems_Changes_3
Resources_2
Observed_Change_2
Problems_Changes_2
Water
Decreased
absence of over flow of Omo rive
Resources_4
Observed_Change_4
Problems_Changes_4
KebeleName
LORENKACHAWE
93
Page 5 of 10
Wereda Disaster
Risk Profile
National Disaster Risk Management
Commission (NDRMC)
Data_Collected_Date
Region S.N.N.P
Zone SOUTH OMO
Wereda NYANGATOM
Friday, July 12, 2019
Selected Indicator
Resources_1
Observed_Change_1
Problems_Changes_1
Environmental Situation: Natural Resources Availability - Natural resources available and changes observed by
the community
Grazing land
Resources_3
Decreased
Observed_Change_3
Shortage of pasture
Problems_Changes_3
Resources_2
Water
Observed_Change_2
Decreased
Problems_Changes_2
Shortage of water due to overflow of Omo
river
KebeleName
LOTOMEN
Resources_1
Pasture
Observed_Change_1
Decreasing
Problems_Changes_1
Resources_2
Observed_Change_2
Shortage of food and conflict, death of
livestock, migration, decreasing pasture
Lapnrdoductivity
Degraded
Problems_Changes_2
Shortage of food and conflict, death of
livestock, migration, decreasing pasture
productivity
KebeleName
NAKARMAN
Resources_4
Observed_Change_4
Problems_Changes_4
Resources_3
Observed_Change_3
Problems_Changes_3
Resources_4
Observed_Change_4
Problems_Changes_4
94
Page 6 of 10
Wereda Disaster
Risk Profile
National Disaster Risk Management
Commission (NDRMC)
Data_Collected_Date
Region S.N.N.P
Zone SOUTH OMO
Wereda NYANGATOM
Friday, July 12, 2019
Selected Indicator
Resources_1
Observed_Change_1
Problems_Changes_1
Environmental Situation: Natural Resources Availability - Natural resources available and changes observed by
the community
Water
Resources_3
Fish
Decreased
Observed_Change_3
Decreased
Shortage of drinking water
Problems_Changes_3
Community faces health status
Resources_2
Observed_Change_2
Problems_Changes_2
Forest
Decreased
Deforestation, overgrazing
Resources_4
Observed_Change_4
Problems_Changes_4
KebeleName
NAPATOKOYET
Resources_1
Water
Observed_Change_1
Decreased
Problems_Changes_1
Resources_2
Absence of river overflow makes un able to
grow crops on flood
Land
Observed_Change_2
Decreased
Problems_Changes_2
covered with unpalatable and unproductive
plantation
KebeleName
NAPUSUMERYA
Resources_3
Observed_Change_3
Problems_Changes_3
Resources_4
Observed_Change_4
Problems_Changes_4
Fish
Decreased
Due to Omo river reduction
95
Page 7 of 10

Wereda Disaster
Risk Profile
National Disaster Risk Management
Commission (NDRMC)
Data_Collected_Date
Region S.N.N.P
Zone SOUTH OMO
Wereda NYANGATOM
Friday, July 12, 2019
Selected Indicator
Resources_1
Observed_Change_1
Problems_Changes_1
Environmental Situation: Natural Resources Availability - Natural resources available and changes observed by
the community
Grazing land
Resources_3
Fish
Decreasing
Observed_Change_3
Decreasing
Shortage of food, loss of livestock
Problems_Changes_3
Community lost optional food source
Resources_2
Observed_Change_2
Problems_Changes_2
Water
Decreasing
Unable to grow cereal Omo river flood
Resources_4
Observed_Change_4
Problems_Changes_4
Forest
Decreased
Deforestation
KebeleName
NAROGOY
Resources_1
Pasture
Observed_Change_1
Decreased
Problems_Changes_1
Due to drought
Resources_3
Observed_Change_3
Problems_Changes_3
Fish
Decreased
Lost optional food source form fishery
Resources_2
Water
Observed_Change_2
Decreasing
Problems_Changes_2
No Omo river over flow and we are and not
able to cultivate with flood recession
KebeleName
NATEKER
Resources_4
Observed_Change_4
Problems_Changes_4
96
Page 8 of 10

Wereda Disaster
Risk Profile
National Disaster Risk Management
Commission (NDRMC)
Data_Collected_Date
Region S.N.N.P
Zone SOUTH OMO
Wereda NYANGATOM
Friday, July 12, 2019
Selected Indicator
Resources_1
Observed_Change_1
Problems_Changes_1
Environmental Situation: Natural Resources Availability - Natural resources available and changes observed by
the community
Land
Resources_3
Decreased
Observed_Change_3
Shortage of pasture,
Problems_Changes_3
Resources_2
Observed_Change_2
Problems_Changes_2
Resources_4
Observed_Change_4
Problems_Changes_4
KebeleName
NAWEYAPE
Resources_1
Land
Observed_Change_1
Decreased
Problems_Changes_1
Shortage of water and pasture
Resources_3
Observed_Change_3
Problems_Changes_3
Resources_2
Observed_Change_2
Problems_Changes_2
Resources_4
Observed_Change_4
Problems_Changes_4
KebeleName
SHENKORA
97
Page 9 of 10
Wereda Disaster
Risk Profile
National Disaster Risk Management
Commission (NDRMC)
Data_Collected_Date
Region S.N.N.P
Zone SOUTH OMO
Wereda NYANGATOM
Friday, July 12, 2019
Selected Indicator
Resources_1
Observed_Change_1
Problems_Changes_1
Environmental Situation: Natural Resources Availability - Natural resources available and changes observed by
the community
Land
Resources_3
Fish
Decreased
Observed_Change_3
Increased
Shortage of pasture land
Problems_Changes_3
Resources_2
Observed_Change_2
Problems_Changes_2
Water
Decreased
Shortage of water
Resources_4
Observed_Change_4
Problems_Changes_4
KebeleName
TERGA
Resources_1
Water
Observed_Change_1
Decreased
Problems_Changes_1
Absence of overflow of Omo river
Resources_3
Observed_Change_3
Problems_Changes_3
Wood
Decreased
Increasing construction
Resources_2
Observed_Change_2
Problems_Changes_2
Forest
Decreased
Drought, shortage of rain fall
Resources_4
Observed_Change_4
Problems_Changes_4
98
Page 10 of 10
Wereda Disaster
Risk Profile
National Disaster Risk Management
Commission (NDRMC)
Data_Collected_Date
Region S.N.N.P
Selected Indicator
Zone SOUTH OMO
Wereda NYANGATOM
Environmental Situation: Rainfall & Temperature - Observed changes on rainfall and temperature by the
community over the last decade
Rainfall
Temperature
Friday, July 12, 2019
Kebele Name
AYEPA
KAJAMAKEN
KEBELE 01
KOPEREYA
KUCHURU
LOKAMEGNAN
LOKORLEM
LOPAKOR
Changes Observed Problems
Decreased
Decreased
Decreasing
Shortage of livestock feed, shortage
of drinking water
Livestock feed and water shortage
livestock death
Poor living condition
Decreased
Drought, shortage of rain fall
Decreasing
Drought
Decreased
Human and livestock disease
Decreased
Decreased
No enough rain fall before and
decreasing time to time
Drought, climate change
LORENKACHAWE
Decreased
LOTOMEN
Decreasing
NAPATOKOYET
Decreasing
Shortage of water, human and
livestock disease
Drought, shortage of food, conflict,
shortage of food and migration
Frequent drought, shortage of after
and pasture, livestock death and
disease
Changes Observed
Problems
Increased
Deforestation
Increased
Health problem, causing water shortage
Increased
Increasing
Increasing
Increased
Increasing
Poor living condition
Health problem
Reduce amount of water
Climate change, human disease
Human disease
High temperature
High temperature
Shortage of pasture, increase the amount
of forest
Shortage of pasture
Increasing
Increased
Increase occurrence of wild fire, reduce
water availability
Human disease, wild fire
99
Page 1 of 2
Wereda Disaster
Risk Profile
National Disaster Risk Management
Commission (NDRMC)
Data_Collected_Date
Region S.N.N.P
Selected Indicator
Zone SOUTH OMO
Wereda NYANGATOM
Environmental Situation: Rainfall & Temperature - Observed changes on rainfall and temperature by the
community over the last decade
Rainfall
Temperature
Friday, July 12, 2019
Kebele Name
Changes Observed Problems
Changes Observed
Problems
NAROGOY
Decreased
NATEKER
NAWEYAPE
SHENKORA
TERGA
KOWTEM
LEBERE
NAKARMAN
NAPUSUMERYA
No rain fall
Decreased
Decreased
Decreased
Decreased
Decreased
Decreased
Decreasing
Reduce pasture land productivity,
reduce livestock productivity,
shortage of water
Livestock pasture and water, death
of livestock
Shortage of water and pasture,
death livestock
Shortage of food, pasture and water,
drought
Drought, deforestation, shortage of
water and pasture
Shortage of food, pasture and water,
death of livestock
Drought, livestock disease, human
disease/malaria
Shortage of water, pasture and food,
death and disease of livestock
Absence of Omo rover over flow and
not able to grow cereal crops,
drought and shortage of pasture
Increased
Increased
Increased
Increased
Increased
Increased
Increasing
Increased
Increasing
Human disease, disturb the social life of
the community
Shortage of water and pasture, health
problem
Health problem, shortage of water,
destruction of grass
Shortage of food, pasture and water
Human and livestock disease
Human disease and livestock
Creating human health problem, reduce
environmental moisture
Deforestation
Human and livestock disease
100
Page 2 of 2
Data_Collected_Date
Region S.N.N.P
Zone SOUTH OMO
Friday, July 12, 2019
Wereda NYANGATOM
Selected Indicator
KebeleName
Environmental Situation: Reasons for Environmental Changes
Reason_For_Environmental_Changes
AYEPA
Deforestation, drought, overgrazing
KAJAMAKEN
KEBELE 01
Elnino, lack of rain fall
KOPEREYA
Drought, climate change
KUCHURU
Drought
LOKAMEGNAN
Conflict
LOKORLEM
Poisonous tree, land to be board ad faced high degradation
LOPAKOR
Frequent occurrence of drought around the community settlement
LORENKACHAWE
Frequent drought, deforestation
LOTOMEN
Prosophis/poisonous tree, land eroded
NAPATOKOYET
Deforestation, drought
NAROGOY
NATEKER
Expansion of investment site, absence of strong institutional
organization, deforestation
Land degradation, foreign tree, conflict
NAWEYAPE
Conflict, land degradation
SHENKORA
Deforestation, shortage of rain fall, high temperature
TERGA
Frequent drought, deforestation
KOWTEM
Deforestation, conflict
LEBERE
Deforestation, soil erosion, emerging of foreign poisonous tree
NAKARMAN
NAPUSUMERYA
Oddity and frequent drought occurrence are the main cause for every
disaster, deforestation
101
Page 1 of 1
Data_Collected_Date
Region S.N.N.P
Zone SOUTH OMO
Friday, July 12, 2019
Wereda NYANGATOM
Selected Indicator
KebeleName
AYEPA
KAJAMAKEN
Environmental Situation: Soil Erosion - Observed changes on levels of soil
erosion by the community
Changes_Observed
Problems_Observed
Increased
Increasing
Reduce fertility of soil that leads to reduce
productivity of crop
Feed shortage, livestock disease occurrence
KEBELE 01
KOPEREYA
Increasing
High wind
KUCHURU
Increasing
High wind erosion
LOKAMEGNAN
Increased
Shortage of food and water
LOKORLEM
LOPAKOR
LORENKACHAWE
LOTOMEN
NAPATOKOYET
Increasing
High wind erosion
Increased
Increasing
No change
Removal of the tree on land lead to increasing wind
erosion
Decrease the fertility of soil, reduce the availability of
pasture
Decreased soil fertility, decreasing production and
productivity
After the removal of this poisoning tree the land
become eroded and the land become eroded and bore
land
No problem occurrence with soil erosion
NAROGOY
NATEKER
Decreased
Wind erosion
Removal of the upper fertile soil and reduce soil
fertility
Shortage of food, livestock disease
NAWEYAPE
Increased
Shortage of food, livestock disease
SHENKORA
Increased
Remove upper fertile soil and reduce soil fertility
TERGA
Increased
High wind erosion
KOWTEM
Increased
Shortage of food and pasture, livestock disease
LEBERE
Increasing
Shortage of food, water and pasture
102
Page 1 of 2

Data_Collected_Date
Region S.N.N.P
Zone SOUTH OMO
Friday, July 12, 2019
Wereda NYANGATOM
Selected Indicator
KebeleName
NAKARMAN
Environmental Situation: Soil Erosion - Observed changes on levels of soil
erosion by the community
Changes_Observed
Problems_Observed
Increased
Reduce the fertility of soil and productivity of livestock
NAPUSUMERYA
Increasing
Decreasing soil fertility, shortage of pasture, migration
103
Page 2 of 2
WDRP Indicators
Livelihood, Occupation and Source
of Food Characteristics
104

Wereda Disaster
Risk Profile
Data_Collected_Date
National Disaster Risk Management
Commission (NDRMC)
Friday, July 12, 2019
Region S.N.N.P
Zone
SOUTH OMO
Wereda NYANGATOM
Selected Indicator
Economic Vulnerability: Major Occupational Categories - Major categories of occupation and percent of population
engaged in the occupation by Kebele
Occupational Categories and Percent of Population engaged within these occupational categories
Percent (%) of Population
KebeleName
Occupation 1
Population Occupation 2
Population Occupation 3
Population Occupation 4
Population
AYEPA
Livestock production -
100
-
-
-
KAJAMAKEN
Livestock production -
100
-
-
-
KEBELE 01
Livestock production -
100
-
-
-
KOPEREYA
Pastoralist -
100
-
-
-
KUCHURU
Hunting - Collecting
10
Honey production -
20
Crop production -
20
Relief from
50
fore tree
government -
LOKAMEGNAN
Livestock production -
100
-
-
-
LOKORLEM
Livestock production -
100
-
-
-
LOPAKOR
Livestock production -
100
-
-
-
LORENKACHAWE
Livestock production -
100
-
-
-
LOTOMEN
Livestock production -
100
-
-
-
NAPATOKOYET
Livestock production -
100
-
-
-
NAROGOY
Livestock production -
100
-
-
-
105
Page 1 of 2
Wereda Disaster
Risk Profile
Data_Collected_Date
National Disaster Risk Management
Commission (NDRMC)
Friday, July 12, 2019
Region S.N.N.P
Zone
SOUTH OMO
Wereda NYANGATOM
Selected Indicator
Economic Vulnerability: Major Occupational Categories - Major categories of occupation and percent of population
engaged in the occupation by Kebele
Occupational Categories and Percent of Population engaged within these occupational categories
Percent (%) of Population
KebeleName
Occupation 1
Population Occupation 2
Population Occupation 3
Population Occupation 4
Population
NATEKER
Livestock production -
100
-
-
-
NAWEYAPE
Livestock production -
100
-
-
-
SHENKORA
Livestock production -
100
-
-
-
TERGA
Livestock production -
10
-
-
-
KOWTEM
Livestock production -
100
-
-
-
LEBERE
Livestock production -
100
-
-
-
NAKARMAN
pastoralist -
100
-
-
-
NAPUSUMERYA
Livestock production -
100
-
-
-
106
Page 2 of 2
Data_Collected_Date
Region S.N.N.P
Zone SOUTH OMO
Friday, July 12, 2019
Wereda NYANGATOM
Selected Indicator
Economic Vulnerability: Livelihoods - Households important sources of
livelihood (response in %)
Type of Livelihood Activity
Order of Importnce
Buying and selling livestock (cattle, sheep, goats, camels)
1st
2nd
3rd
0.25
0.00
0.00
Making jewellery
0.25
0.00
0.00
Others
0.50
36.17
66.67
Rearing & selling animals (camels, cattle, sheep, goats)
97.98
6.38
0.00
Religious teacher
0.00
2.13
0.00
Salaried job
0.25
0.00
0.00
Selling Cereal food crops (sorghum, maize, wheat, barley)
0.00
48.94
0.00
Selling dairy products (milk, butter, ghee, cheese)
0.00
0.00
33.33
Selling eggs (from own chickens) Beekeeping (selling honey
bees-wax, or bee-hives)
Selling Fruits (mango, papaya, banana, orange, lemon, etc.)
0.76
2.13
0.00
0.00
2.13
0.00
Selling Pulses (beans, cow-pea, chick-pea)
0.00
2.13
0.00
107
Page 1 of 1
Data_Collected_Date
Region S.N.N.P
Zone SOUTH OMO
Friday, July 12, 2019
Wereda NYANGATOM
Selected Indicator
Economic Vulnerability: Occupational Categories - Percent of population
above 15 years age by occupation categories
Type of Livelihood Activity
Main Occupation
Secondary Occupation
B)Student
C)Unemployed & seeking work
D)Neither studying nor working nor seeking work
E)Retired/ Old
F)Cultivator
G)Agricultural labourer
H)Livestock rearing
I)Non-agricultural labour
J)Craftsman
K)Shopkeeper and Petty trade
L)Home-maker (housewife)
M)Salaried
N)Chronically ill
P)Others (specify)
Q)None
R)Herder
S)Herder
1st Occupation
10.36
0.12
0.50
0.37
0.37
0.12
51.19
0.25
0.25
27.47
0.25
0.12
0.12
8.49
2nd Occupation
2.58
0.54
7.46
0.27
8.14
0.68
0.14
0.27
12.35
0.68
63.50
0.14
3.26
108
Page 1 of 1

Wereda Disaster Risk
Profile
National Disaster Risk Management
Commission (NDRMC)
Data_Collected_Date
Region S.N.N.P
Zone SOUTH OMO
Wereda NYANGATOM
Friday, July 12, 2019
Selected Indictor: Economic Vulnerability: Sources of Food - Households source for different food items (response in %)
Source of Food
Types of Food Item
A)Own
cultivation/production
B)Casual labor
C)Borrowed
D)Gifts from
friends/neighbors
E)Purchases from main
shop
109
Page 1 of 2
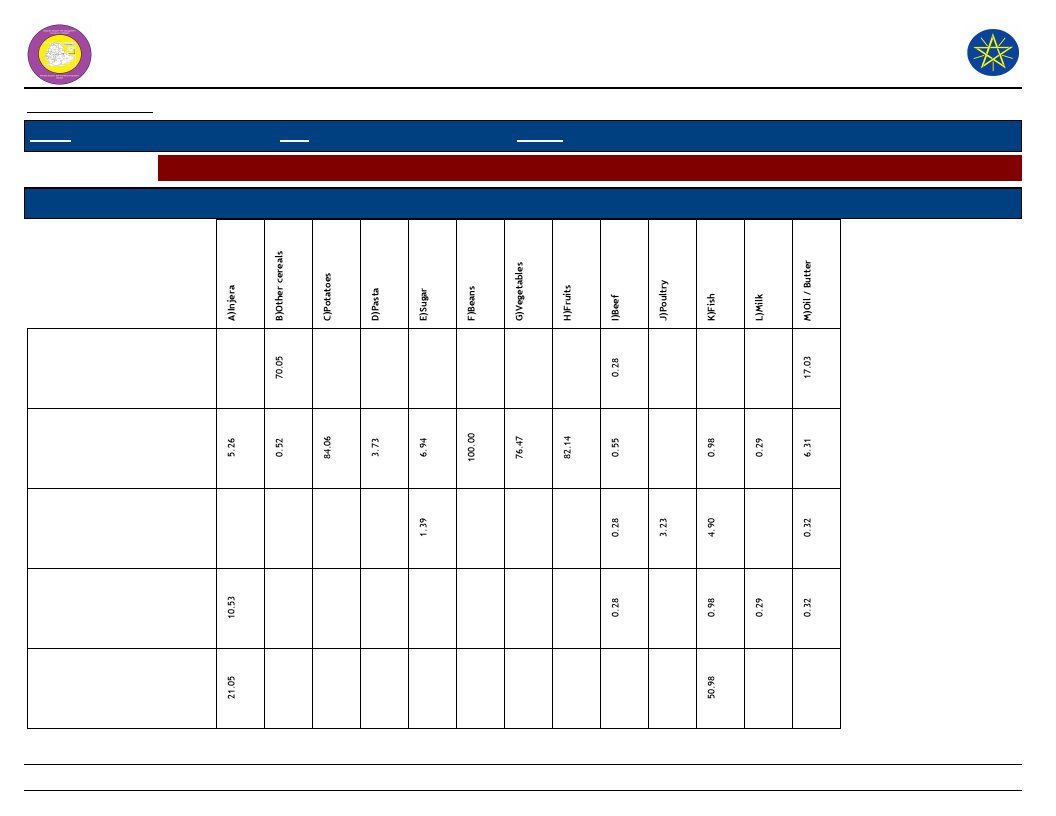
Wereda Disaster Risk
Profile
National Disaster Risk Management
Commission (NDRMC)
Data_Collected_Date
Region S.N.N.P
Zone SOUTH OMO
Wereda NYANGATOM
Friday, July 12, 2019
Selected Indictor: Economic Vulnerability: Sources of Food - Households source for different food items (response in %)
Source of Food
Types of Food Item
F)Free meals/Food
assistance
G)Purchase from
roadside vendor/tuck
shop
H)Purchase subsidized
food from Kebele shop
J)Begging
K)Other
110
Page 2 of 2
WDRP Indicators
Crop Production Characteristics
111
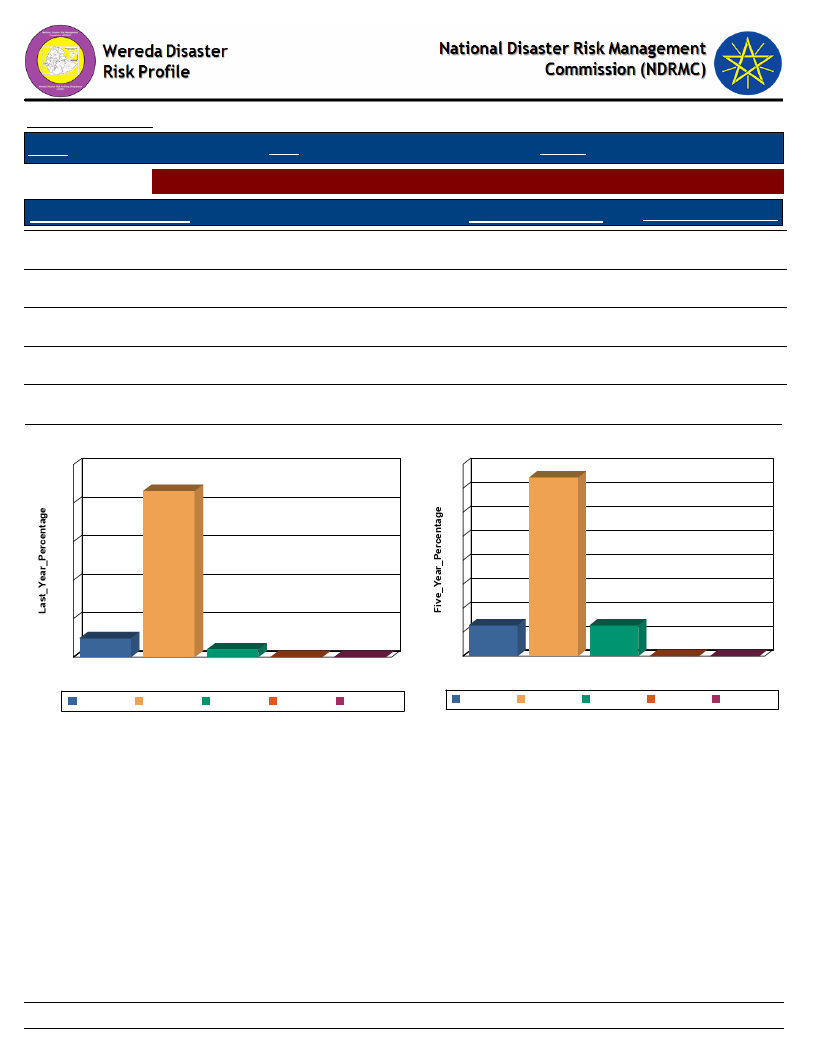
Data_Collected_Date
Region S.N.N.P
Zone SOUTH OMO
Friday, July 12, 2019
Wereda NYANGATOM
Selected Indictor: Hazards: Change in Crop Damages - Proportion of Total Crop Damage
Extent of Crop Damage (%)
0%
Last_Year_Percentage
9.80
Five_Year_Percentage
12.77
1 - 25 %
86.27
74.47
26 - 50 %
3.92
12.77
51 - 75 %
0.00
0.00
76 - 100 %
0.00
0.00
Extent of Crop Damage Last_Year
100
86
80
60
40
20
10
0
0%
0%
4
0
1 - 25 %
26 - 50 %
51 - 75 %
Extent of Crop Damage
0
76 - 100 %
1 - 25 %
26 - 50 %
51 - 75 %
76 - 100 %
Extent of Crop Damage Five Years Ago
80
74
70
60
50
40
30
20
13
10
0
0%
0%
13
0
1 - 25 %
26 - 50 % 51 - 75 %
Extent of Crop Damage
0
76 - 100 %
1 - 25 %
26 - 50 %
51 - 75 %
76 - 100 %
112
Page 1 of 1
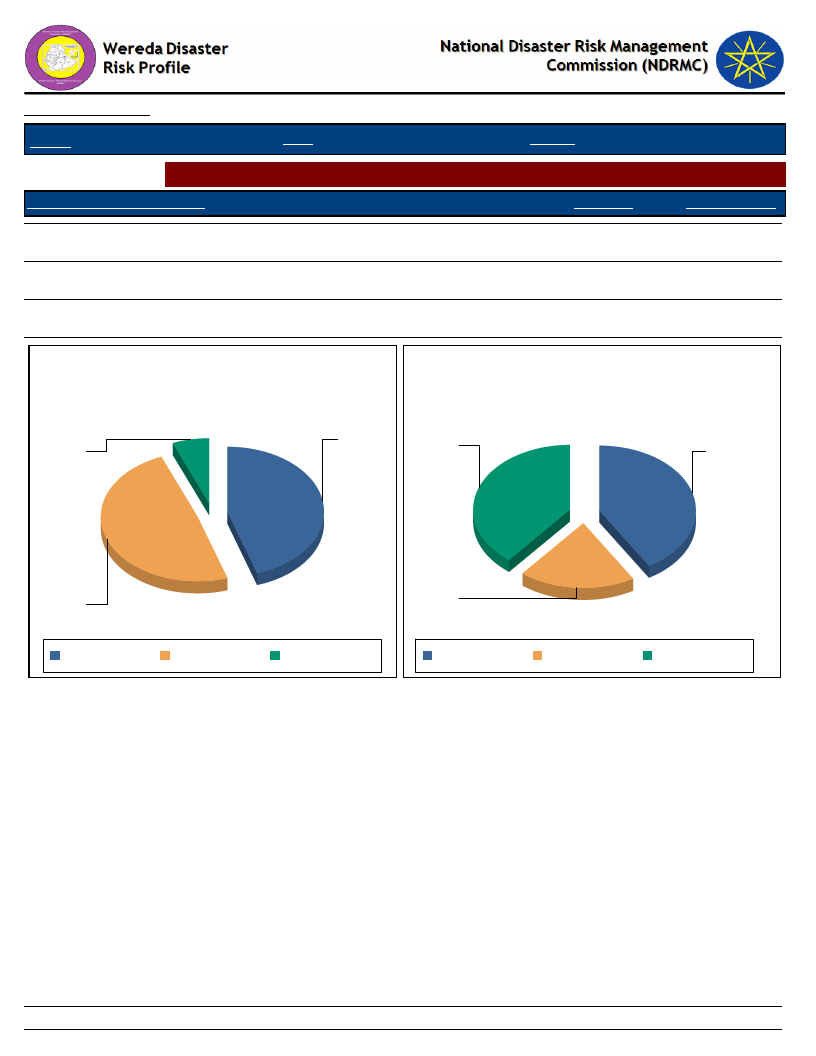
Data_Collected_Date
Friday, July 12, 2019
Region S.N.N.P
Zone SOUTH OMO
Wereda NYANGATOM
Selected Indictor: Hazards: Change in Crop Damages - Major reasons for crop damage
Major Reason of Crop Damage
Last_Year
Five_Year_Ago
A - Pests, Insects, Weeds
44.90
40.43
B - Drought
48.98
19.15
C - Flood
6.12
38.30
Major Reason of Crop Damage -
Last Year
44.9
6.1
Major Reason of Crop Damage -
Five Years Ago
C - Flood
A - Pests,
Insects,
Weeds
49.0
A - Pests, Insects,
Weeds
B - Drought
C - Flood
B - Drought
A - Pests, Insects,
Weeds
B - Drought
C - Flood
113
Page 1 of 1
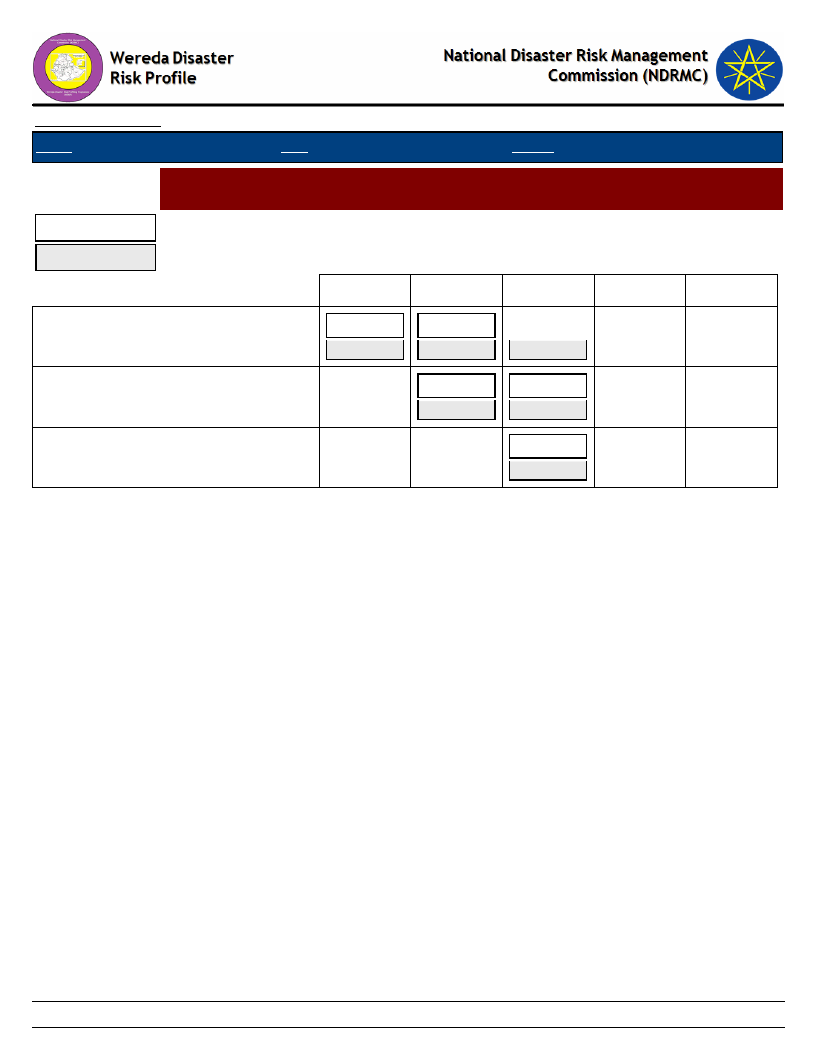
Data_Collected_Date
Region S.N.N.P
Zone SOUTH OMO
Wereda NYANGATOM
Selected Indictor:
Last Year
Hazards: Change in Crop Damages - Proportion of Damage for Major Crops
(percentage response by households)
Five Years Ago
Friday, July 12, 2019
0%
1-25%
26-50%
51-75%
76-100%
Maize
19.23
80.77
33.33
61.11
5.56
Sorghum
95.83
85.71
4.17
14.29
Wheat
100.00
100.00
114
Page 1 of 1
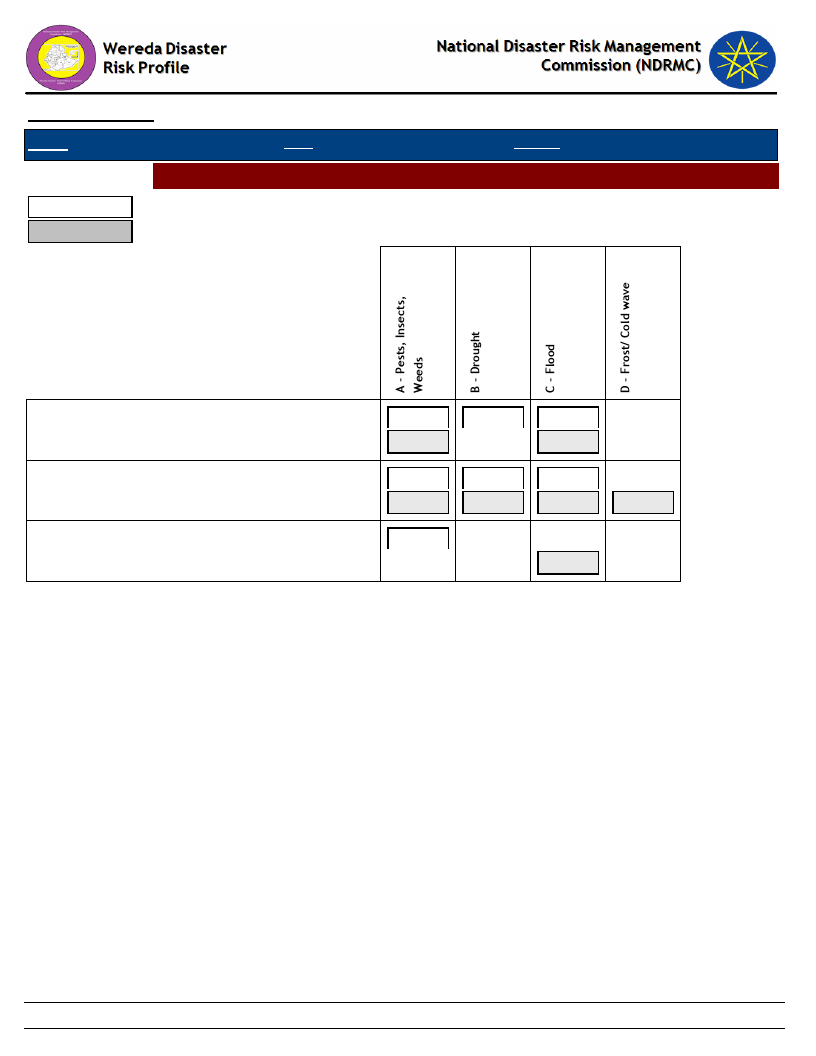
Data_Collected_Date
Region S.N.N.P
Zone SOUTH OMO
Friday, July 12, 2019
Wereda NYANGATOM
Hazards: Change in Crop Damages - Reasons for Damage of Major Crops
Last Year
Five Years Ago
Maize
Sorghum
Wheat
56.00
77.78
36.00
8.00
22.22
30.43
65.22
4.35
17.86
32.14
46.43
3.57
100.00
100.00
115
Page 1 of 1
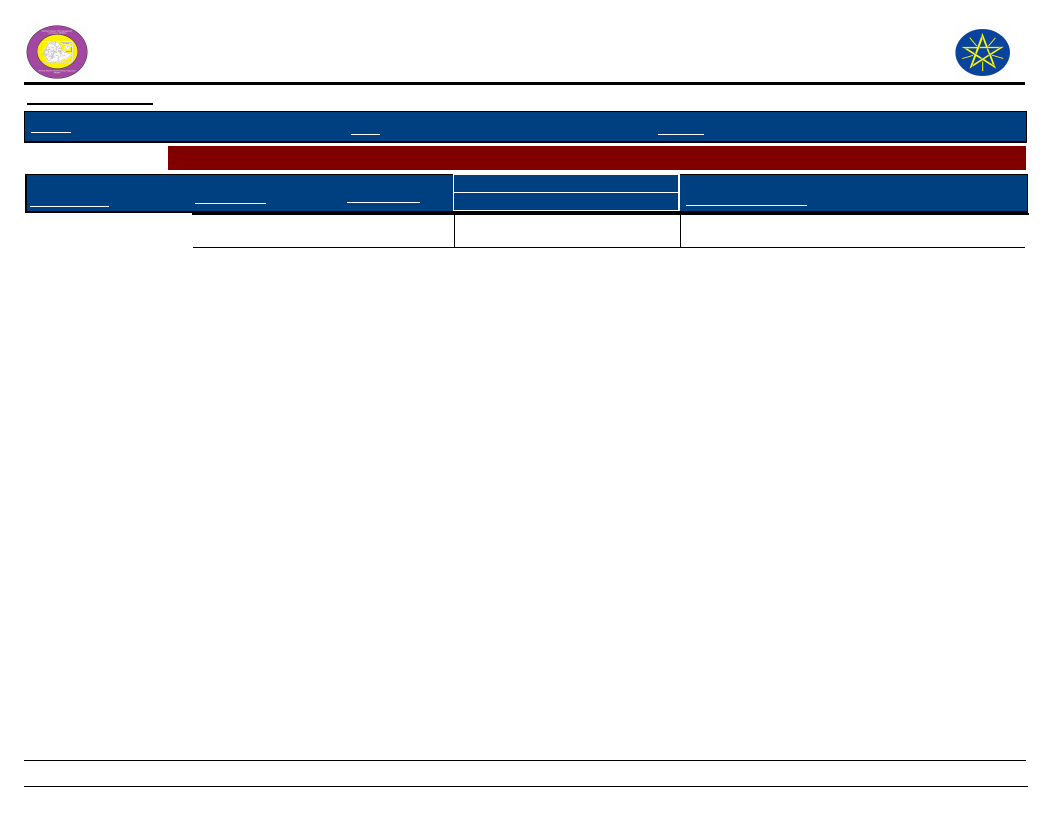
Wereda Disaster
Risk Profile
Data_Collected_Date
National Disaster Risk Management
Commission (NDRMC)
Friday, July 12, 2019
Region
S.N.N.P
Zone
SOUTH OMO
Wereda
NYANGATOM
Selected Indictor:
Kebele Name
KUCHURU
Agricultural Situation: Change in Crops Grown - Five major crops grown by proportion of total cultivated land
Major Crops
Main Season
Present
Cropped Area
Five_Years_Ago
Reason_For_Change
Sesame
Meher
8 hectare
30 hectare
116
Page 1 of 1
Data_Collected_Date
Friday, July 12, 2019
Region S.N.N.P
Zone SOUTH OMO
Wereda NYANGATOM
Selected Indictor:
Agricultural Situation: Access to Extension - Perception of the community on
Access to Agricultural extension Services
KebeleName
Current_Level
Change_In_Last_Decade
Comments
AYEPA
KAJAMAKEN
KEBELE 01
Poor
No access
Good
Increased
No change
They are teach something
about their responsibility
No agricultural extension
workers
KOPEREYA
Good
KUCHURU
LOKAMEGNAN
Good
No access
Increased
Increased
Have extension workers
profession with in kebele
but have no enough
Extension work but not
enough to give saving
LOKORLEM
LOPAKOR
Poor
Good
No change
Increasing
No extension work and
developmental agent in
the kebele
Extension service
LORENKACHAWE
Poor
LOTOMEN
Poor access
NAPATOKOYET
Poor agricultural extension
service
NAROGOY
No change
No change
No change
No enough extension
workers
There is no extension
workers
The extension workers in
the kebele are not
enough
NATEKER
NAWEYAPE
No access
No access
No change
No change
No agricultural extension
workers
No agriculture extension
SHENKORA
TERGA
Good
Good
Increased
Increased
The provision of
extension is good
There is provision of
extension but not enough
117
Page 1 of 2

Data_Collected_Date
Friday, July 12, 2019
Region S.N.N.P
Zone SOUTH OMO
Wereda NYANGATOM
Selected Indictor:
Agricultural Situation: Access to Extension - Perception of the community on
Access to Agricultural extension Services
KebeleName
Current_Level
Change_In_Last_Decade
Comments
KOWTEM
LEBERE
NAKARMAN
NAPUSUMERYA
No access
No access
Good
Poor
No change
No change
Increased
No change
No agricultural extension
workers
No enough extension
workers in the kebele
Teach about their
responsibility
There is no enough
extension worker
118
Page 2 of 2
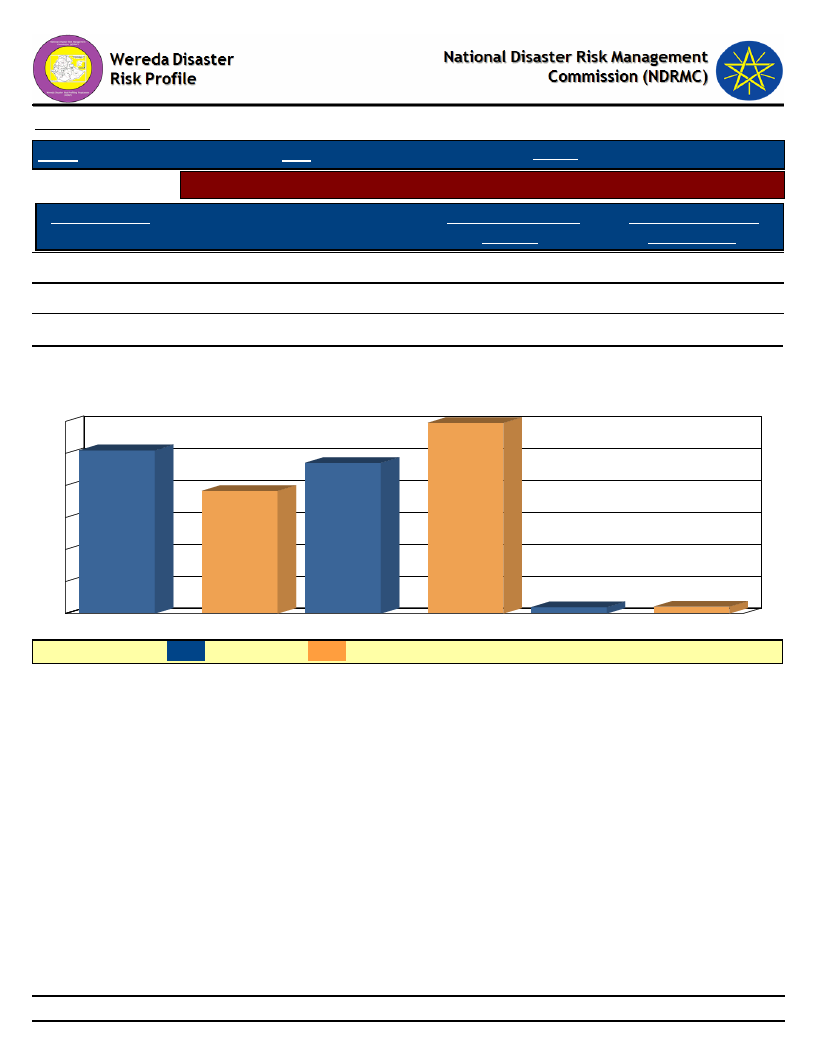
Data_Collected_Date
Region S.N.N.P
Selected Indicator
Major Crop Type
Maize
Sorghum
Wheat
Zone SOUTH OMO
Wereda
Friday, July 12, 2019
NYANGATOM
Economic Vulnerability: Crops Grown - Types of crops grown by households
Type of Crops Grown
Last Year
50.98
Type of Crops Grown
Five Years Ago
38.30
47.06
59.57
1.96
2.13
Types of Crops Grown - Percent Responses of HHs for Last Year as compared to
Five Years Ago
60
60
51
50
47
40
38
30
20
10
0
LEGEND :
Maize
Last year
Sorghum
Five Years Ago
2
2
Wheat
119
Page 1 of 1
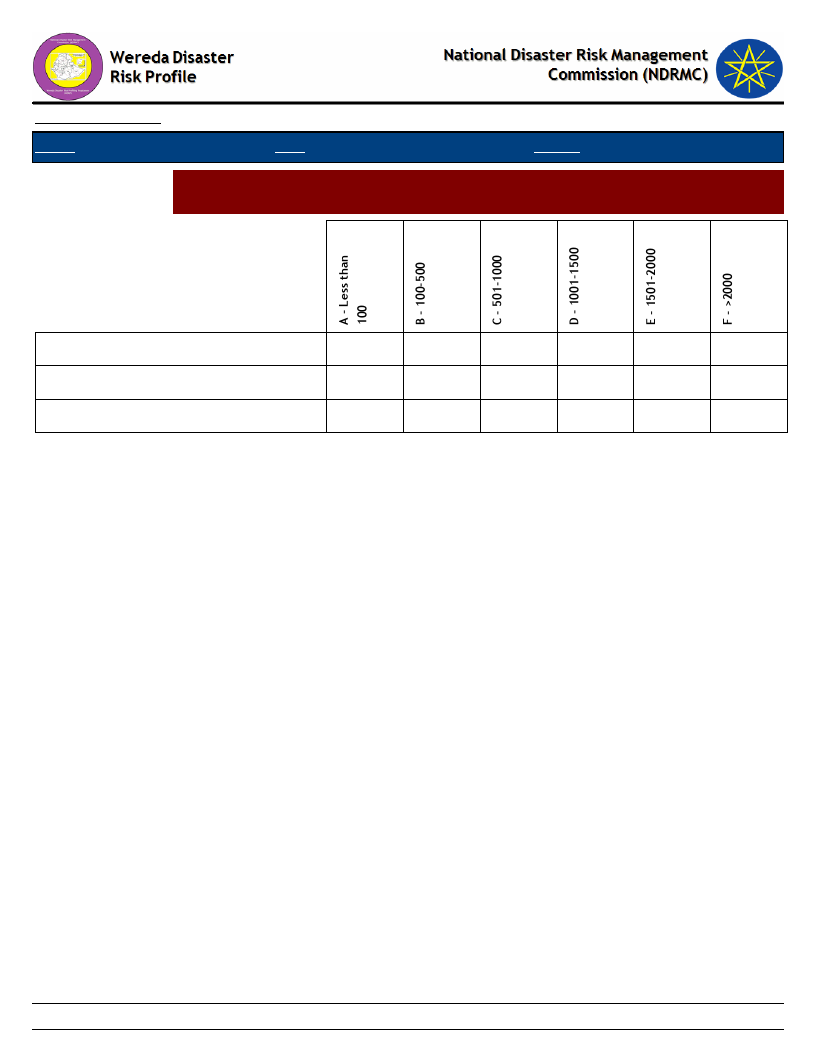
Data_Collected_Date
Region S.N.N.P
Zone SOUTH OMO
Friday, July 12, 2019
Wereda NYANGATOM
Selected Indictor:
Economic Vulnerability: Crops Grown - Proportion of households by amount of
yield of major crops (last year)
Maize
Sorghum
Wheat
96.15
3.85
79.17
20.83
100.00
120
Page 1 of 1

Data_Collected_Date
Region S.N.N.P
Zone SOUTH OMO
Wereda
Friday, July 12, 2019
NYANGATOM
Selected Indictor:
Economic Vulnerability: Crops Grown - Proportion of households by amount of
yield of major crops (Five Years Ago)
Types of Major Crops
Category of Yield used to be obtained five years ago
Maize
Sorghum
Wheat
88.89
75.00
100.00
25.00
11.11
121
Page 1 of 1
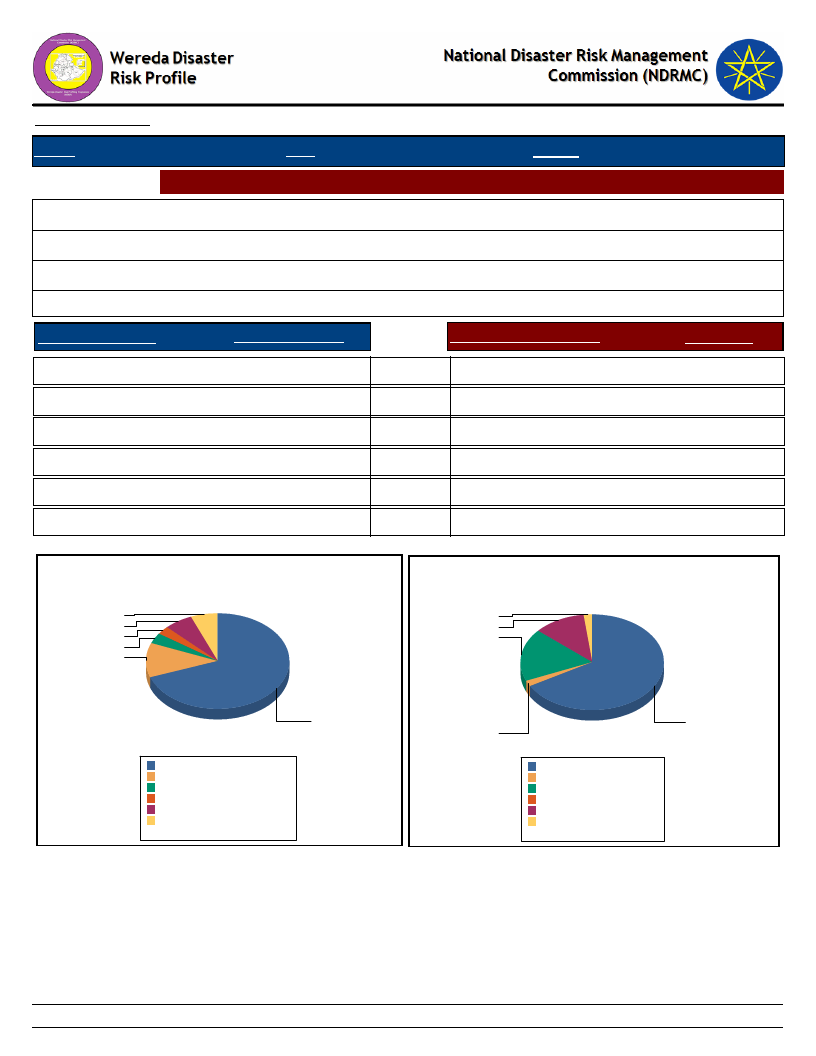
Data_Collected_Date
Friday, July 12, 2019
Region S.N.N.P
Zone SOUTH OMO
Wereda NYANGATOM
Selected Indictor: Economic Vulnerability: Land Ownership and Quality - Landownership of HHs
Households owning land (%)
Average landholding (in Hectares)s
Households cultivating land in last 12 months (%)
Average quantity of land cultivated (in hectares)
97.96
0.50
12.53
0.34
Range Land Holding
Percent_Response
Range of Cultivated Land
% Response
A - Less than 0.25 ha
69.0
B - 0.25 - 0.50 ha
12.0
C - 0.5 - 0.75 ha
4.0
D - 0.75 - 1 ha
3.0
E - 1 - 2 ha
7.0
F - More than 2 ha
6.0
IMPORTANT: ha = Hectars
Household Responses to Range Land Holding
A - Less than 0.25 ha
9.0
B - 0.25 - 0.50 ha
0.0
C - 0.5 - 0.75 ha
2.0
D - 0.75 - 1 ha
0.0
E - 1 - 2 ha
2.0
F - More than 2 ha
0.0
Household Responses to Range Cultivated Land
6.0
0.3
6.5
1.6
2.6
2.3
3.6
11.7
69.0
A - Less than 0.25 ha
B - 0.25 - 0.50 ha
C - 0.5 - 0.75 ha
D - 0.75 - 1 ha
E - 1 - 2 ha
F - More than 2 ha
Total:
69.4%
11.8%
3.7%
2.6%
6.5%
6.0%
100.0%
8.8
0.3
A - Less than 0.25 ha 8.8
B - 0.25 - 0.50 ha
0.3
C - 0.5 - 0.75 ha
2.3
D - 0.75 - 1 ha
0
E - 1 - 2 ha
1.6
F - More than 2 ha
0.3
Total:
13.3
122
Page 1 of 1
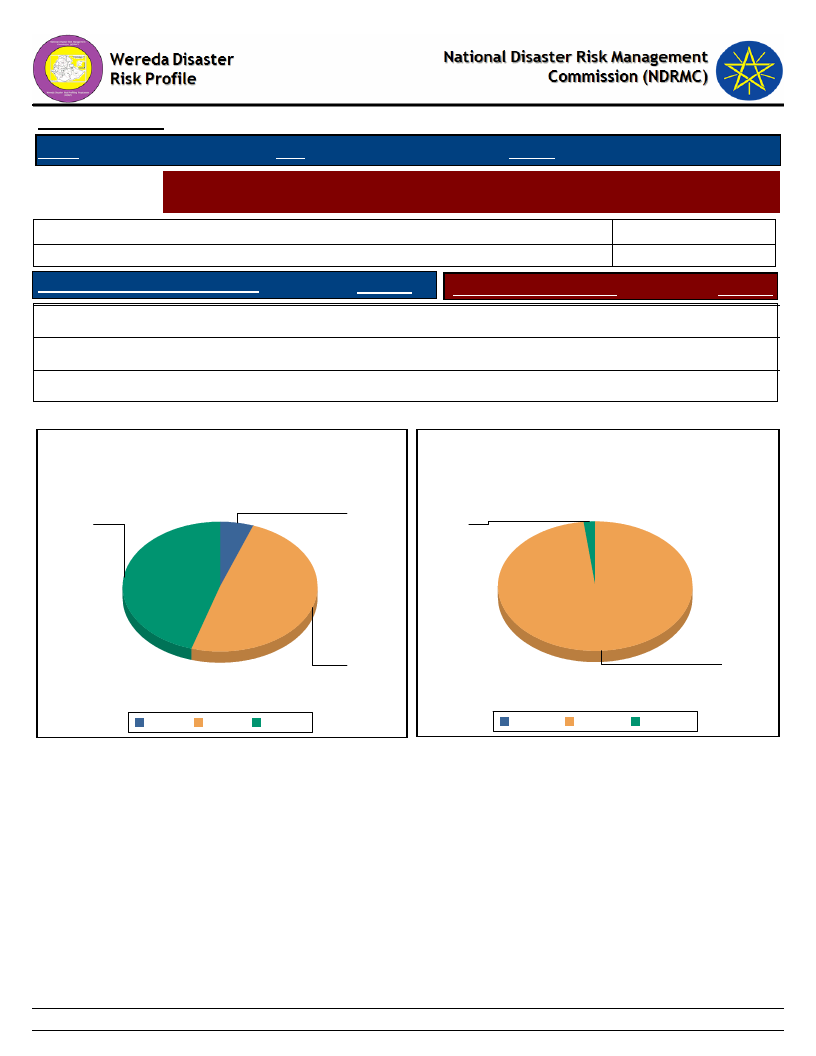
Data_Collected_Date
Region S.N.N.P
Zone SOUTH OMO
Friday, July 12, 2019
Wereda NYANGATOM
Selected Indictor:
Economic Vulnerability: Land Ownership and Quality - Farmers’ perception on the
quality of their agricultural land
Cropping_Intensity *
Households with enough land for farming
1.58
54.72
HHs with favourable location of farm
Response
Households with fertile soil
Response
Yes
45.28
Fertile
98.11
Partially
49.06
Not fertile
1.89
No
5.66
* Cropping Intensity = (Gross Cropped Area / Net Cropped Area )x 100%
Household responses to the type of farm
location
Household responses tp the type of soil
fertility
6
45
2
49
No
Partially Yes
Gross Cropped Area = Irrigated Area + Unirrigated
Area
98
Fertile
Not fertile
Net Cropped Area = Total Cultivated Area in last
12 months
123
Page 1 of 1
Data_Collected_Date
Friday, July 12, 2019
Region S.N.N.P
Selected Indictor:
KebeleName
AYEPA
KAJAMAKEN
KEBELE 01
KOPEREYA
KUCHURU
LOKAMEGNAN
LOKORLEM
LOPAKOR
LORENKACHAWE
LOTOMEN
NAPATOKOYET
NAROGOY
NATEKER
NAWEYAPE
SHENKORA
TERGA
KOWTEM
LEBERE
NAKARMAN
Zone SOUTH OMO
Wereda NYANGATOM
Agricultural Situation: Access to Inputs - Perception of the community on access
to improved agricultural inputs
Current_Level
Change_In_Last_Decade
Comments
Poor
Poor
Poor
Poor
Good
Poor
Poor
Poor
Poor access
No access
Some times we get improve
seeds
No change
No change
No change
Increased
No change
Increasing
No change
Increased
Its fluctuating
We are not focused in
agriculture input
No agricultural activities
Not used agricultural input
We use agriculture
fertilizer but not enough
Used modern variety crop
We are not consider to
take agriculture input
The kebele did not
practice crop farming
They did not use the
provided seed because of
shortage of rain and
irrigation access
Poor
Poor accessible
Poor
Poor
Poor
Poor
Poor
No change
No change
No change
No change
No change
Increased
No change
No agricultural activities
are practiced
No agriculture fruit
We are not consider the
input of agriculture
We are not take
agricultural input because
we have no experience
No agricultural activities
are practice
No focus in general
agriculture input
124
Page 1 of 2

Data_Collected_Date
Friday, July 12, 2019
Region S.N.N.P
Selected Indictor:
KebeleName
NAPUSUMERYA
Zone SOUTH OMO
Wereda NYANGATOM
Agricultural Situation: Access to Inputs - Perception of the community on access
to improved agricultural inputs
Current_Level
Change_In_Last_Decade
Comments
Poor
No change
Low access
125
Page 2 of 2
Data_Collected_Date
Region S.N.N.P
Zone SOUTH OMO
Friday, July 12, 2019
Wereda NYANGATOM
Selected Indictor:
Agricultural Situation: Water for irrigation - Access to water for irrigation in the
community
KebeleName
Current_Level
Change_In_Last_Decade
Comments
AYEPA
KAJAMAKEN
KEBELE 01
KOPEREYA
KUCHURU
LOKAMEGNAN
LOKORLEM
LOPAKOR
LORENKACHAWE
LOTOMEN
NAPATOKOYET
NAROGOY
NATEKER
NAWEYAPE
SHENKORA
TERGA
KOWTEM
LEBERE
NAKARMAN
NAPUSUMERYA
Poor
No access for irrigation
Poor
Poor
Poor
No access
Poor
Poor
Poor accessibility
No access
Lower access to irrigation
Poor
No access of irrigation
No access for irrigation
Poor
Poor accessibility
No access
No access
Poor
Poor
No change
No change
Increased
No change
Decreasing
Decreased
Decreasing
Decreasing
No change
No change
No change
No change
Decreasing
Shortage of Omo river and rain
fall
Observe of irrigation pump and
tools
No optional irrigation access
Because of absence of irrigation
input
Shortage of irrigation pump
No river and other water source
around
We have land near to rive Omo
There is a big river but not
irrigation pump and tools
Absence of overflow of Omo
river
Shortage of irrigation pump and
tools
126
Page 1 of 1

Data_Collected_Date
Friday, July 12, 2019
Region S.N.N.P
Zone SOUTH OMO
Wereda NYANGATOM
Selected Indictor:
Kebele Name
Agricultural Situation: Soil Fertility - Perception of the community on soil fertility
and its change over time
Current_Level
Change_In_Last_Decade
Comments
AYEPA
KAJAMAKEN
Fertile soil
Decreased
Decreased
Decreased
The community face high
wind erosion
Fertility and moisture
KEBELE 01
Good
KOPEREYA
Fertile soil
Decreased
Because of high wind
KUCHURU
Fertile
Increased
High wind erosion
LOKAMEGNAN
Decreasing
LOKORLEM
LOPAKOR
Poor
Good
Increasing
Decreasing
Due to the sucking tree
coverage
High wind erosion
LORENKACHAWE
Fertile
Decreased
High wind erosion
LOTOMEN
NAPATOKOYET
NAROGOY
Poor fertility
Partially good
Decreased
No change
The poisons tree suck its
fertility
Drought and high radiation
reduce its fertility
NATEKER
NAWEYAPE
SHENKORA
Decreased
Decreased
Poor
Decreased
Decreasing
Increased
Source of income prosophis
tree sucks its fertility and
moisture
Free suck its fertility
moisture
High wind erosion
TERGA
Good
Decreased
There is high wind erosion
KOWTEM
Decreased
Decreased
The tree/prosophis sucks
its fertility and moisture
127
Page 1 of 2
Data_Collected_Date
Friday, July 12, 2019
Region S.N.N.P
Zone SOUTH OMO
Wereda NYANGATOM
Selected Indictor:
Kebele Name
Agricultural Situation: Soil Fertility - Perception of the community on soil fertility
and its change over time
Current_Level
Change_In_Last_Decade
Comments
LEBERE
NAKARMAN
Poor
Good
Decreased
Decreased
Lower quality cause poorer
productivity and shortage
of food
High wind erosion
NAPUSUMERYA
Good
Decreasing
Continuous wind erosion
remove the upper fertile
soil
128
Page 2 of 2
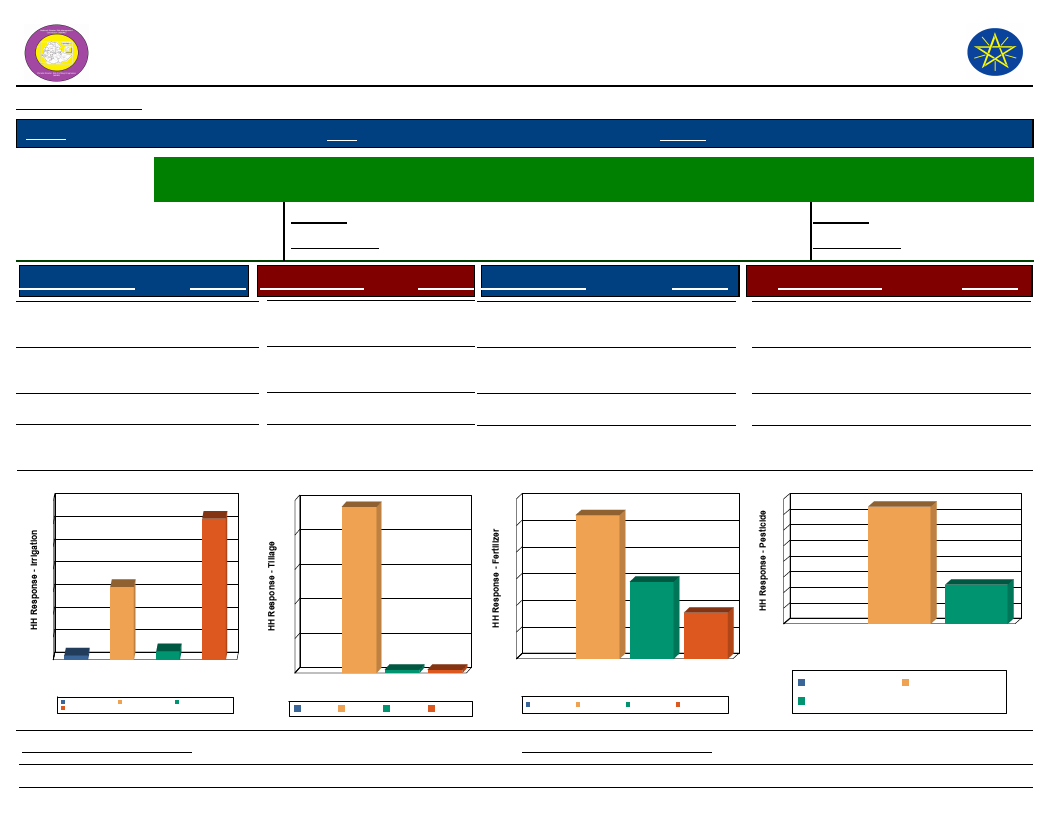
Wereda Disaster
Risk Profile
Data_Collected_Date
Region S.N.N.P
Zone SOUTH OMO
National Disaster Risk Management
Commission (NDRMC)
Friday, July 12, 2019
Wereda NYANGATOM
Selected Indictor:
Economic Vulnerability: Status of Agriculture - Methods of tillage, Irrigation and other agricultural input utilization
by households
Percentage of
Irrigated Area
Last Year
Five Years Ago
Percentage of households
with irrigated area
Last Year
Five Years Ago
55.33
5.88
Source of Irrigation
Response Method of Tillage
Response Type of Fertilizer
Response
Type of Pesticide
Response
River/Lake/Pond
Birkas (tanks)
Other (specify)
62.26 Tractor
1.89 Manual
3.77 None
1.89 Chemical
96.23
1.89
Both Chemical and
Natural
None
28.85
53.85
Chemicals (insecticides,
fungicide, etc)
None
17.31
75.00
25.00
No Irrigation
(Rain-fed)
32.08
Source of Irrigation
Method of Tillage
70
100
96
60
62
60
50
80
50
40
40
60
32
30
30
40
20
20
10
20
2
4
0
Birkas (tanks)
Other (specify)
No Irrigation (Rain-fed)
River/Lake/Pond
0
Source of Irrigation
Birkas (tanks)
River/Lake/Pond
No Irrigation (Rain-fed)
Other (specify)
10
0
2
2
Manual
None
Method of Tillage
Tractor
Manual None
Tractor
Type of Fertilizer
54
29
17
Both
Chemical
Chemical and
NaTtyuprael of Fertilizer
Both Chemical and
Natural
Chemical
None
None
Type of Pesticide
80
75
70
60
50
40
30
25
20
10
0
Chemicals
None
(insecticides,
fungicide, etc)
Type of Pesticide
None
Chemicals (insecticides,
fungicide, etc)
Proportion_Improved_Seeds
76.09
Proportion_Agriculture_Service
129
89.58
Page 1 of 1
Data_Collected_Date
Region S.N.N.P
Zone SOUTH OMO
Wereda NYANGATOM
Friday, July 12, 2019
Selected Indictor:
Economic Vulnerability: Change in Agricultural Situation - Households perception
on changes of crop type, size of cultivated area and crop yields
Proportion of households reporting change in crops grown
Adequate fertilizer
34.69
%
1st
2nd
3rd
5.88
5.88
9.09
Adequate irrigation available
29.41
5.88
Adequate rainfall
5.88
Insufficient fertilizer
45.45
Insufficient irrigation available
52.94
Less rainfall
41.18
More pest resistant crop
5.88
23.53
More yielding crop
17.65
9.09
Other
5.88
Proportion of households reporting change in size of area cultivated
1st
Addition of area
26.53 %
2nd
3rd
8.33
Adequate fertilizer
30.77
Adequate irrigation available
46.15
Insufficient fertilizer
41.67
Insufficient irrigation available
46.15
8.33
Insufficient rainfall
46.15
Landslides
8.33
130
Page 1 of 2
Data_Collected_Date
Region S.N.N.P
Zone SOUTH OMO
Wereda NYANGATOM
Friday, July 12, 2019
Selected Indictor:
Economic Vulnerability: Change in Agricultural Situation - Households perception
on changes of crop type, size of cultivated area and crop yields
1st
2nd
3rd
Loss of area
8.33
More yielding crop
7.69
25.00
Other
7.69
Salinity problem
7.69
Water logging
7.69
Proportion of households reporting change in crop yield
Adequate fertilizer
Adequate irrigation available
Better yielding crop
Improved variety of seeds
Insufficient fertilizer
Insufficient irrigation available
Insufficient rainfall
Other
97.96
%
1st
2nd
3rd
20.83
31.71
25.00
12.50
9.76
4.17
19.51
12.20
28.00
20.83
2.44
16.67
21.95
2.44
131
Page 2 of 2
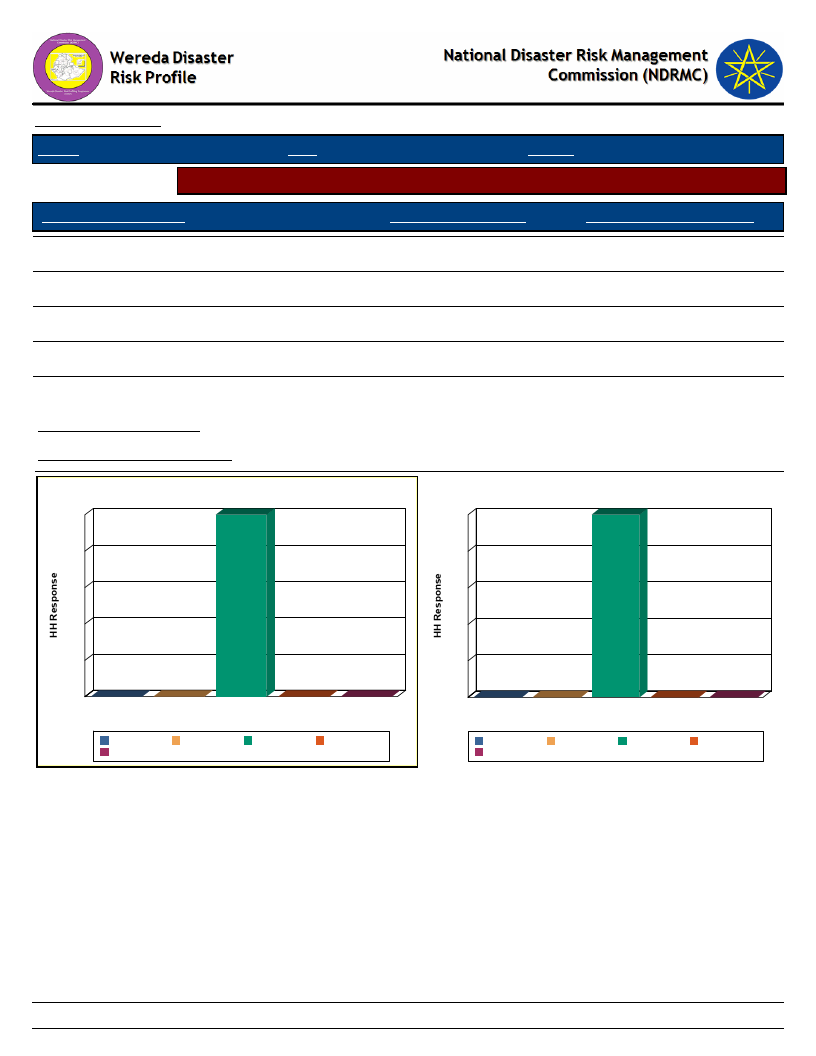
Data_Collected_Date
Region S.N.N.P
Zone SOUTH OMO
Friday, July 12, 2019
Wereda NYANGATOM
Selected Indicator
Economic Vulnerability: Crops Grown - Number of crops grown by households
Number of Crops Grown
Crops Grown Last Year
Crops Grown Five Years Ago
One type
100.00
100.00
Two types
0.00
0.00
Three types
0.00
0.00
Four types
0.00
0.00
Five types
0.00
0.00
Avg Crops Grown Last Year
Avg Crops Grown Five Years Ago
0.13
0.12
Number of Crops Grown Last Year
100
100
Number of Crops Grown five years ago
100
100
80
80
60
60
40
40
20
0
0
Five types
0
0
Four types One type Three types
Number of Crops Grown
0
Two types
Five types
Two types
Four types
One type
Three types
20
0
0
Five types
0
0
Four types One type Three types
Number of Crops Grown
0
Two types
Five types
Two types
Four types
One type
Three types
132
Page 1 of 1
WDRP Indicators
Livestock Production Characteristics
133

Data_Collected_Date
Friday, July 12, 2019
Region S.N.N.P
Zone SOUTH OMO
Wereda NYANGATOM
Selected Indictor:
Kebele Name
AYEPA
KAJAMAKEN
KEBELE 01
Agricultural Situation: Status of Livestock Disease - Change in Livestock Disease
Status
Current_Level
Change_Over_Last_Decade
Comment
CCPP, black leg, CBPP,
Anthrax
CCPP, CBPP, FMD
Black leg, CBPP
Increased
Increased
Community environmental
favorable for disease
causing agent
Food shortage, livestock
disease, drought
KOPEREYA
KUCHURU
CCBP, Anthrax, foot and
mouth disease
Increased
No change
Favorable environment
Have no livestock
LOKAMEGNAN
LOKORLEM
LOPAKOR
LORENKACHAWE
LOTOMEN
NAPATOKOYET
NAROGOY
NATEKER
NAWEYAPE
SHENKORA
TERGA
CCPP, CBPP, Black leg,
foot and mouth disease
CCPP, CBPP, foot and
mouth disease, anthrax
Poor
CCPP, CBPP, Anthrax,
Foot and mouth disease
CCPP, CBPP, Foot and
mouth disease, Black
leg, Anthrax
CCPP, CBPP, Anthrax,
Foot and moth disease,
Blackleg
CCPP, CBPP, Anthrax,
Black leg, Foot and
mouth disease
CCPP, CBPP, Foot and
mouth disease
CCPP, CBPP, Foot
mouth disease
CCPP, CBPP, Black leg,
Anthrax
CCBP, CCPP, Anthrax,
Foot and mouth disease
Increased
Increasing
No change
Increasing
Increased
Increased
Increasing
Increased
Increasing
Increased
Decreased
134
Sever livestock loss and
genetic effect
Low access before and
after
Massive animal lost
It causes animal loss and
higher expense for drop
Increases the animal
susceptibility for disease
Poor veterinary service
Shortage of pasture and
water
Poor veterinary service
Page 1 of 2
Data_Collected_Date
Friday, July 12, 2019
Region S.N.N.P
Zone SOUTH OMO
Wereda NYANGATOM
Selected Indictor:
Kebele Name
KOWTEM
LEBERE
NAKARMAN
Agricultural Situation: Status of Livestock Disease - Change in Livestock Disease
Status
Current_Level
Change_Over_Last_Decade
Comment
CCPP, CBPP, Foot and
mouth disease
CCPP, CBPP, Black leg,
Foot and mouth disease,
PPR, Anthrax
CCPP,CBPP, Black leg
Increased
Increased
Increased
Shortage of pasture
Poor veterinary service
NAPUSUMERYA
Anthrax, CCPP, CBPP,
Foot and mouth disease
Increasing
Drought
135
Page 2 of 2
Data_Collected_Date
Friday, July 12, 2019
Region S.N.N.P
Zone SOUTH OMO
Wereda NYANGATOM
Selected Indictor: Livestock Diseases Prevalece
Type of livestock diseases affected households in the last five years (households reporting in %)
1st
2nd
3rd
African horse disease
0.76
1.29
0.80
Anthrax affecting cattle
7.83
5.93
2.94
Black leg
22.47
14.95
10.43
CBPP
1.01
1.29
0.53
Contagious Caprine PLeuropneumonia (CCPP)
13.64
20.62
8.56
DK
0.51
0.26
0.27
Faciolosis
3.03
10.31
4.81
Foot and mouth disease
1.77
2.32
2.41
Heart water
0.25
0.26
Internal & External Parasites (Tick, mange, helminthiasis, fasci
1.29
0.27
Liverfluke (Sheep and cattle)
3.28
8.51
9.89
Lumpy Skin Disease (LSD)
1.01
1.55
0.27
Lymphangitis
0.52
Newcasle disease (Chicken)
1.26
9.02
4.28
No Disease
0.76
7.22
9.63
Pasteurellosis
1.55
2.67
PPR
22.73
11.34
35.56
Sheep pox
0.27
Tick born diseases
2.41
Trypanosomiasis
19.70
1.80
4.01
136
Page 1 of 1
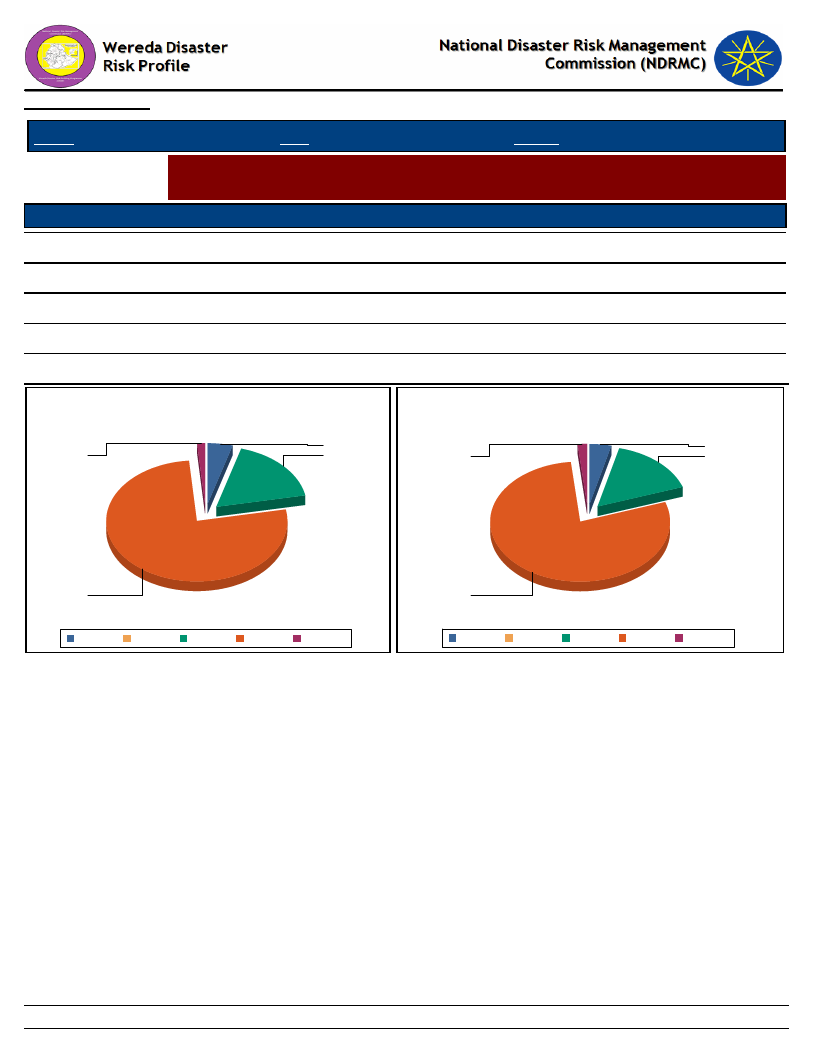
Data_Collected_Date
Friday, July 12, 2019
Region S.N.N.P
Selected Indictor:
Level of Access
Excellent
Good
Adequate
Poor
Very poor
Zone SOUTH OMO
Wereda NYANGATOM
Evaluation of Access to Veternary Services and Livestock Drugs
Households’ evaluation on access to drugs and veterinary services
Veternary Service
Livestock_Drugs
17.47
4.56
76.71
1.27
15.99
3.81
78.43
1.78
Level of Access to Veternary Services
Access Level of Livestock Drugs
5
4
1
17
2
16
77
Adequate Excellent
Good
Poor
Very poor
78
Adequate Excellent
Good
Poor
Very poor
137
Page 1 of 1

Data_Collected_Date
Friday, July 12, 2019
Region S.N.N.P
Selected Indictor:
Zone SOUTH OMO
Wereda NYANGATOM
Agricultural Situation: Water Availability for Livestock - Water availability for
livestock in the community
KebeleName
Current_Level
Change_In_Last_Decade
Comments
AYEPA
KAJAMAKEN
KEBELE 01
KOPEREYA
KUCHURU
LOKAMEGNAN
LOKORLEM
LOPAKOR
LORENKACHAWE
LOTOMEN
NAPATOKOYET
Poor
Extremely poor access
Poor
Poor
Decreased
Poor
CCPP, CBPP, foot and
mouth disease
Poor
Poor access to water for
domestic
Poor access
No change
Decreased
No change
No change
Decreased
Decreasing
Decreased
Decreasing
Decreasing
Decreasing
NAROGOY
Poor
No change
NATEKER
NAWEYAPE
SHENKORA
TERGA
KOWTEM
LEBERE
Extremely poor
accessibility
Poor
Poor
Poor access
Poor accessibility
Poor access
Decreasing
Decreasing
No change
No change
Decreased
Decreasing
Frequent drought
Shortage of rain fall
No livestock
Conflict
Shortage of rainfall,
drought
Drought
There is river near but
congruent with the pasture
land
Frequent drought and
lower rain fall reduce
accessibility of water for
livestock
Frequent drought aggravate
Frequent drought
Shortage of rain fall
Frequent drought
Water harvesting structure
should be construct to
resolve this problem
138
Page 1 of 2

Data_Collected_Date
Friday, July 12, 2019
Region S.N.N.P
Selected Indictor:
Zone SOUTH OMO
Wereda NYANGATOM
Agricultural Situation: Water Availability for Livestock - Water availability for
livestock in the community
KebeleName
Current_Level
Change_In_Last_Decade
Comments
NAKARMAN
NAPUSUMERYA
Good
Poor
Increased
Decreasing
Mainly grazing land nearest
to river
Shortage of fall, shortage
of water
139
Page 2 of 2
Data_Collected_Date
Friday, July 12, 2019
Region S.N.N.P
Zone SOUTH OMO
Wereda NYANGATOM
Selected Indictor:
Agricultural Situation: Livestock Diversity - Type of livestock and their economic
importance in the community
Kebele Name
AYEPA
Type of Livestock
Sheep
Avg_Number Economic_Importance_Rank
12
Donkeys
2
Cattle: Female
2
Cattle: Male bulls
2
Goats
15
KAJAMAKEN
Goats
10 Source of income
Cattle: Mature Male
2
For meat production, source of income
Cattle: Female
Donkeys
2
For milk and meat production, source of
income
3
For transportation
Sheep
7
Source of income
KEBELE 01
Sheep
20 source of income
Donkeys
6
For transportation
Cattle: Female
30 For consumption and source of income
Cattle: Mature Male
25 Source of income
Goats
20 source of income
KOPEREYA
Goats
8
Source of income
Cattle: Mature Male
2
Source of income
Cattle: Female
1
Source of income
Donkeys
1
For transportation
Sheep
10 Source of income
KOWTEM
Cattle: Mature Female
Cattle: Mature Male
3
For reproduction, milk production,
source of income
2
Source of income
140
Page 1 of 5

Data_Collected_Date
Friday, July 12, 2019
Region S.N.N.P
Zone SOUTH OMO
Wereda NYANGATOM
Selected Indictor:
Agricultural Situation: Livestock Diversity - Type of livestock and their economic
importance in the community
Kebele Name
KOWTEM
Type of Livestock
Goats
Avg_Number
8
Economic_Importance_Rank
Source of income
Sheep
6
For consumption, source of income
Donkeys
2
Dowry payment, transportation
KUCHURU
Camels: Female
0
Camels: Female
0
Camels: Female
0
Camels: Female
0
Camels: Female
0
LEBERE
Donkeys
2
Dowry payment, for transportation
Sheep
4
For consumption, source of income
Donkeys
8
Source of income
Cattle: Mature Male
3
Source of income
LOKAMEGNAN
Cattle: Mature Female
Goats
3
For reproduction, milk production,
source of income
8
Source of income
Cattle: Mature Male
3
Source of income
Cattle: Mature Female
3
Source of income
Donkeys
2
Transportation
Sheep
4
Source of income
LOKORLEM
Sheep
5
Source of income
Donkeys
3
For transportation
Cattle: Female
3
Source of income
Cattle: Mature Male
3
Source of income
Goats
6
Source of income
141
Page 2 of 5

Data_Collected_Date
Friday, July 12, 2019
Region S.N.N.P
Zone SOUTH OMO
Wereda NYANGATOM
Selected Indictor:
Agricultural Situation: Livestock Diversity - Type of livestock and their economic
importance in the community
Kebele Name
LOPAKOR
Type of Livestock
Goats
Avg_Number Economic_Importance_Rank
6
Cattle: Mature Male
2
Cattle: Mature Female
1
Donkeys
1
Sheep
10
LORENKACHAWE
Sheep
10 For consumption and source of income
Donkeys
1
For transportation
Cattle: Mature Female
1
For reproduction
Cattle: Mature Male
2
Source of income
Goats
8
Source of income
LOTOMEN
Goats
7
Source of income
Cattle: Mature Male
2
Source of income
Cattle: Mature Female
3
For reproduction, source of income
Donkeys
2
Transportation
Sheep
4
For consumption, source of income
NAKARMAN
Cattle: Mature Female
Cattle: Mature Male
2
For reproduction, milk production,
source of income
1
Source of income
Goats
9
For consumption, source of income
Sheep
7
For consumption, source of income
Donkeys
1
For transportation
NAPATOKOYET
Sheep
6
For consumption, source of income
Donkeys
3
Transportation
Cattle: Mature Female
3
For reproduction, source of income
142
Page 3 of 5

Data_Collected_Date
Friday, July 12, 2019
Region S.N.N.P
Zone SOUTH OMO
Wereda NYANGATOM
Selected Indictor:
Agricultural Situation: Livestock Diversity - Type of livestock and their economic
importance in the community
Kebele Name
NAPATOKOYET
Type of Livestock
Cattle: Mature Male
Avg_Number
2
Economic_Importance_Rank
Source of income
Goats
8
Source of income
NAPUSUMERYA
Donkeys
3
Dowry payment and transportation
Sheep
6
For consumption, source ofi ncome
Goats
8
Source of income
Cattle: Mature Female
Cattle: Mature Male
2
For mil production, reproduction and
source of income
2
Source of income
NAROGOY
Goats
15 Source of income
Cattle: Mature Male
1
Source of income
Cattle: Mature Female
2
For reproduction, source of income
Donkeys
3
For transportation, dower payment
Sheep
20 For consumption, source of income
NATEKER
Sheep
7
For consumption and source of income
Donkeys
3
Dowry payment
Cattle: Mature Female
2
For reproduction and source of income
Cattle: Mature Male
2
Source of income
Goats
10 Source of income
NAWEYAPE
Goats
10 Source of income
Cattle: Mature Male
2
Source of income
Cattle: Mature Female
2
For reproduction and source of income
Donkeys
3
Dowry payment
Sheep
7
For consumption, source of income
SHENKORA
Sheep
15 For consumption, source of income
143
Page 4 of 5
Data_Collected_Date
Friday, July 12, 2019
Region S.N.N.P
Zone SOUTH OMO
Wereda NYANGATOM
Selected Indictor:
Agricultural Situation: Livestock Diversity - Type of livestock and their economic
importance in the community
Kebele Name
SHENKORA
Type of Livestock
Donkeys
Avg_Number
1
Economic_Importance_Rank
For transportation
Cattle: Mature Male
1
For reproduction, source of income
Cattle: Mature Female
Goats
2
For reproduction, milk production and
source of income
10 For consumption, source of income
TERGA
Goats
5
Source of income
Cattle: Mature Male
2
Source of income
Cattle: Mature Female
1
For reproduction, milk production,
Donkeys
2
For transportation
Sheep
10 For consumption, source of income
144
Page 5 of 5
Wereda Disaster
Risk Profile
Data_Collected_Date
National Disaster Risk Management
Commission (NDRMC)
Friday, July 12, 2019
Region S.N.N.P
Zone SOUTH OMO
Wereda NYANGATOM
Selected Indictor:
Economic Vulnerability: Livestock Ownership and Changes - Percentage of households by number and type of
livestock owned
Bee keeping
A - None
93.70
B - 1 to 5
0.25
C - 6 to 10
0.25
D - 11 to 50
0.50
E - 51 to 100
0.50
F - More
than 100
1.26
Camels: Female
100.00
Camels: Male
100.00
Camels: Young Female
100.00
Camels: Young Male
100.00
Cattle: Female
18.89
19.90
19.40
15.62
9.07
4.53
Cattle: Male bulls
18.89
18.89
23.93
13.10
8.31
4.79
Cattle: Mature Female
11.59
13.35
18.64
16.37
10.33
11.59
Cattle: Mature Male
28.72
22.42
22.42
6.80
5.29
2.52
Cattle: under 1 year
15.87
23.93
24.69
14.11
8.82
4.79
Donkeys
24.43
27.71
19.90
10.33
5.54
3.02
Goats
2.02
2.27
2.52
5.04
6.05
18.14
Horses
99.24
0.50
0.25
145
Page 1 of 2
Wereda Disaster
Risk Profile
Data_Collected_Date
National Disaster Risk Management
Commission (NDRMC)
Friday, July 12, 2019
Region S.N.N.P
Zone SOUTH OMO
Wereda NYANGATOM
Selected Indictor:
Economic Vulnerability: Livestock Ownership and Changes - Percentage of households by number and type of
livestock owned
A - None
B - 1 to 5
C - 6 to 10
D - 11 to 50
E - 51 to 100
Mules
98.49
0.76
0.25
0.50
F - More
than 100
Poultry
54.66
3.78
14.36
7.81
4.79
5.29
Sheep
4.03
4.53
11.08
8.56
16.88
13.35
146
Page 2 of 2
Data_Collected_Date
Region S.N.N.P
Zone SOUTH OMO
Friday, July 12, 2019
Wereda NYANGATOM
Selected Indicator
Economic Vulnerability: Livestock Ownership and Changes - Households
perception on changes in livestock number in the last five years (response in %)
Type of Livestock Owned
Changes Observed By Households
Bee keeping
A - Decreased
44.44
B - Remained the Same
29.63
C - Increased
25.93
Camels: Female
100.00
Camels: Male
100.00
Camels: Young Female
100.00
Camels: Young Male
100.00
Cattle: Female
44.76
36.83
18.41
Cattle: Male bulls
52.66
30.09
17.24
Cattle: Mature Female
67.62
17.19
15.19
Cattle: Mature Male
62.95
20.14
16.91
Cattle: under 1 year
50.46
31.19
18.35
Donkeys
40.14
35.37
24.49
Goats
83.07
7.81
9.11
Horses
40.00
60.00
Mules
44.44
44.44
11.11
Poultry
61.58
16.95
21.47
Sheep
66.85
12.40
20.75
147
Page 1 of 3
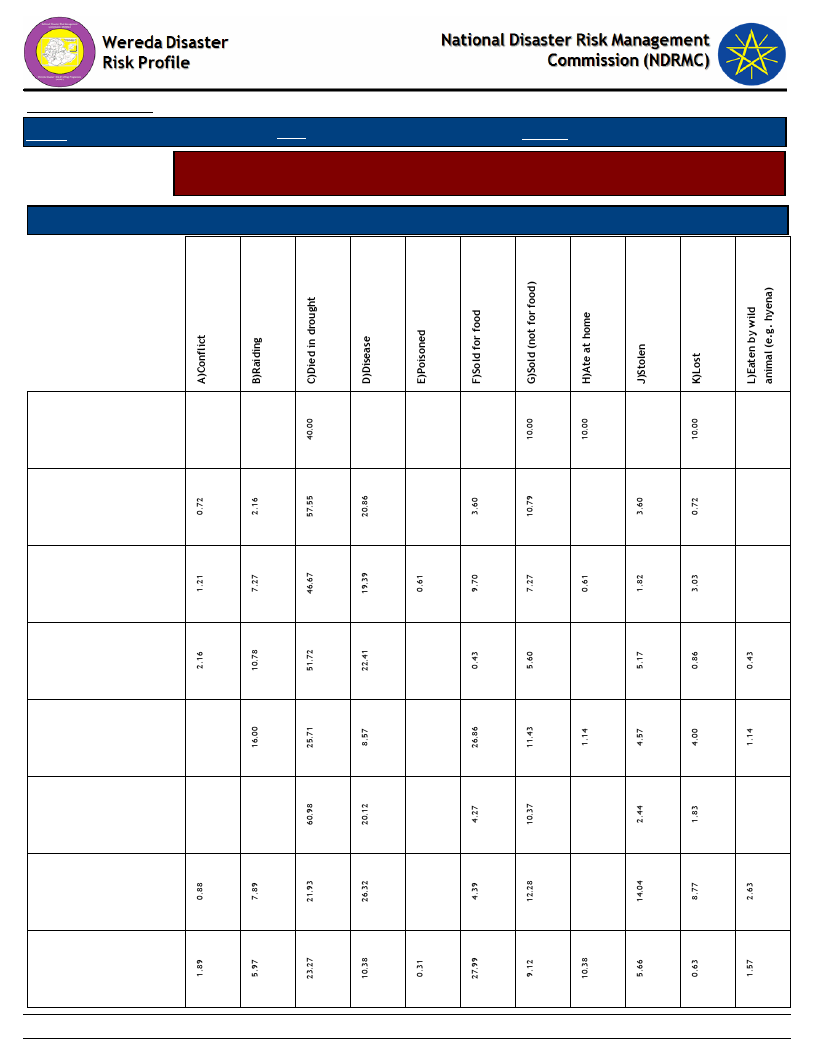
Page 2 of 3
Bee keeping
Cattle: Female
Cattle: Male bulls
Cattle: Mature
Female
Cattle: Mature
Male
Cattle: under 1
year
Donkeys
Goats
148
Reason for Decrease in Livestock Number
Type of Livestock Owned
Economic Vulnerability: Livestock Ownership and Changes - Households
perception on changes in livestock number in the last five years (response in %)
Selected Indicator
Friday, July 12, 2019
Wereda NYANGATOM
Zone SOUTH OMO
Data_Collected_Date
Region S.N.N.P
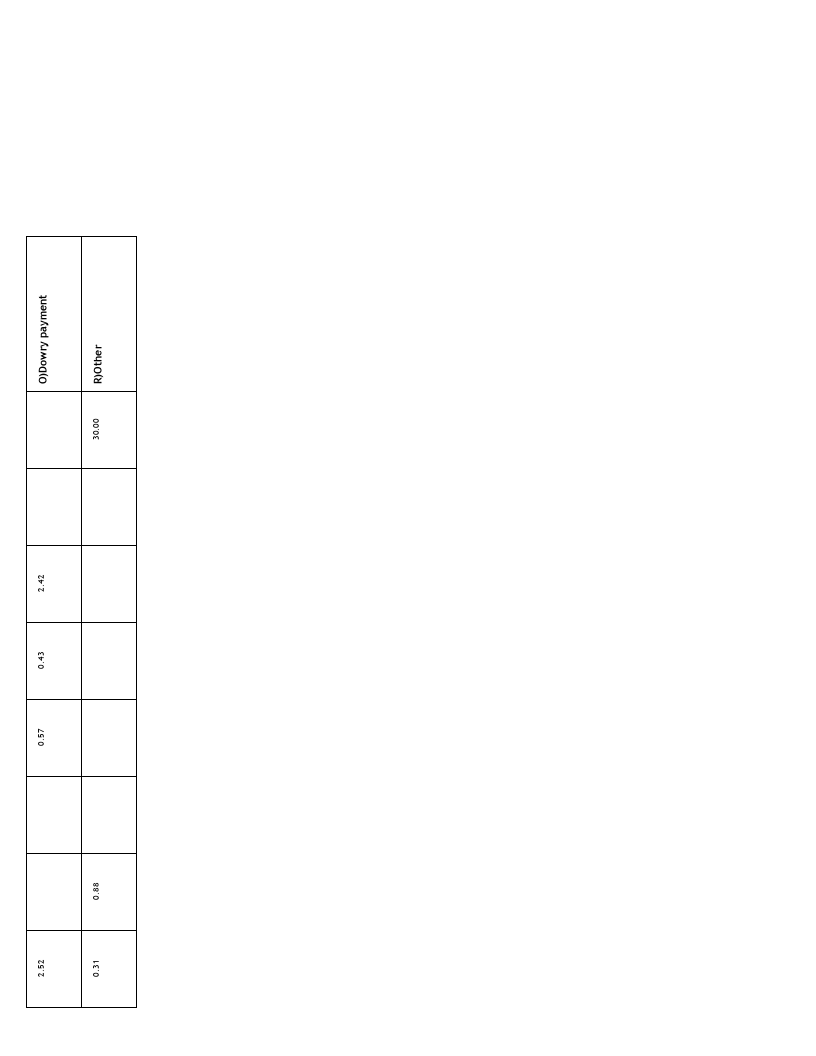
149
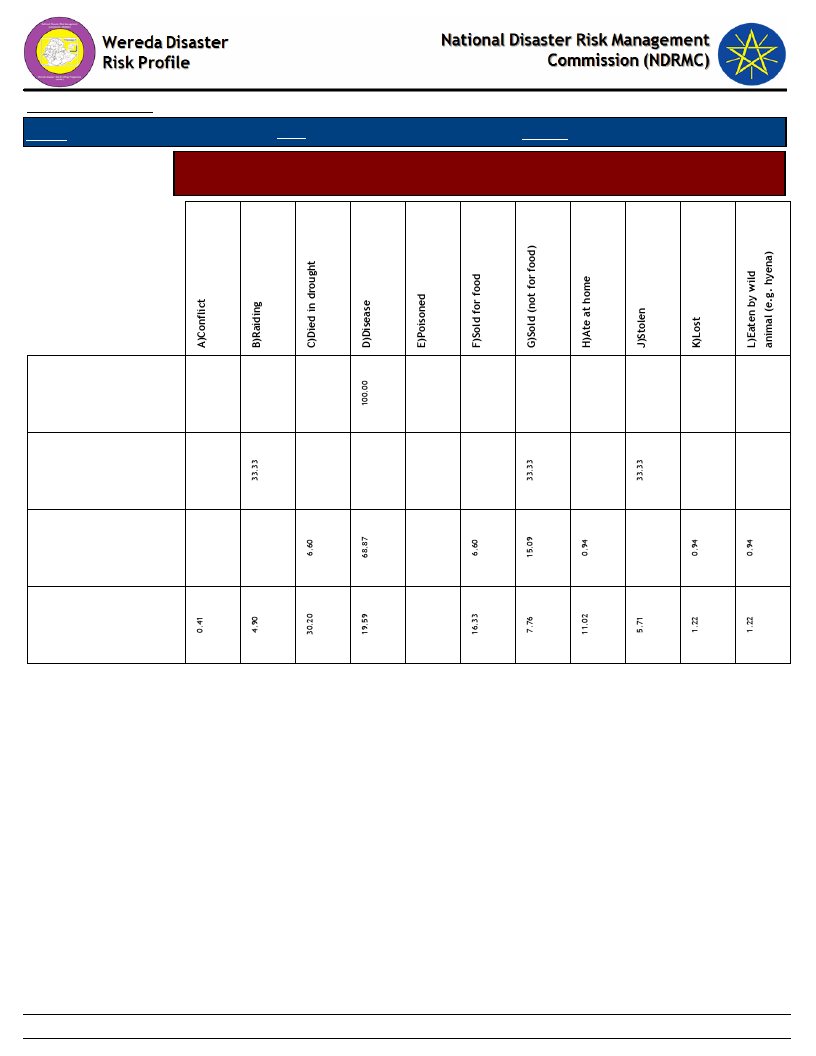
Data_Collected_Date
Region S.N.N.P
Zone SOUTH OMO
Friday, July 12, 2019
Wereda NYANGATOM
Selected Indicator
Economic Vulnerability: Livestock Ownership and Changes - Households
perception on changes in livestock number in the last five years (response in %)
Horses
Mules
Poultry
Sheep
150
Page 3 of 3
151
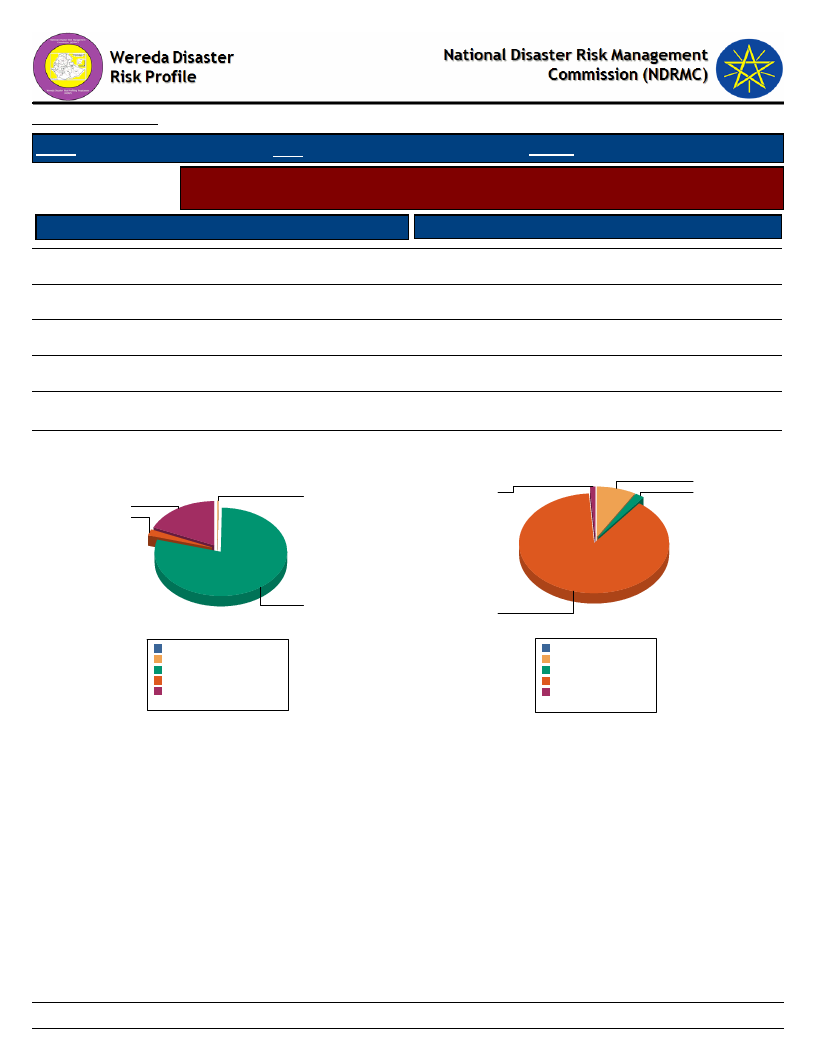
Data_Collected_Date
Friday, July 12, 2019
Region S.N.N.P
Zone SOUTH OMO
Wereda NYANGATOM
Selected Indicator
Agriculture (Livestock): Pasture Availability - Households perception on access
and quality of pasture
Access to Pasture
Response Percent
Quality of Pasture
Response Percent
Occasionally
79.09
B - Good
8.40
Seldom available
18.39
C - Adequate
1.78
Never available
0.25
D - Poor
88.55
E - Very poor
1.02
Regularly available
2.27
Household responses to Access to Pasture for
Livestock
0.3
18.4
2.3
Household responses to Quality of Pasture
8.4
1.0
1.8
79.1
Never available
0.0%
0.3%
Occasionally
79.1%
Regularly available 2.3%
Seldom available 18.4%
Total:
100.0%
88.5
B - Good
0.0%
8.4%
C - Adequate 1.8%
D - Poor
88.8%
E - Very poor 1.0%
Total:
100.0%
152
Page 1 of 1

Data_Collected_Date
Region S.N.N.P
Zone SOUTH OMO
Friday, July 12, 2019
Wereda NYANGATOM
Selected Indicator
Agriculture (Livestock): Pasture Availability - Households perception on
problematic months for pasture availability
Problematic Months
Order of Severity
A - Sep (Meskerem)
B - Oct (Tikimt)
C - Nov (Hidar)
D - Dec (Tahsas)
E - Jan (Tir)
F - Feb (Yekatit)
G - Mar (Megabit)
H - Apr (Meazea)
I - May (Ginbot)
K - Jul (Hamle)
1st
0.25
4.28
23.17
49.87
6.55
15.11
0.25
0.25
0.25
2nd
0.25
4.28
25.19
56.17
7.30
6.55
0.25
3rd
0.26
0.26
10.74
25.83
50.64
6.65
5.63
153
Page 1 of 1
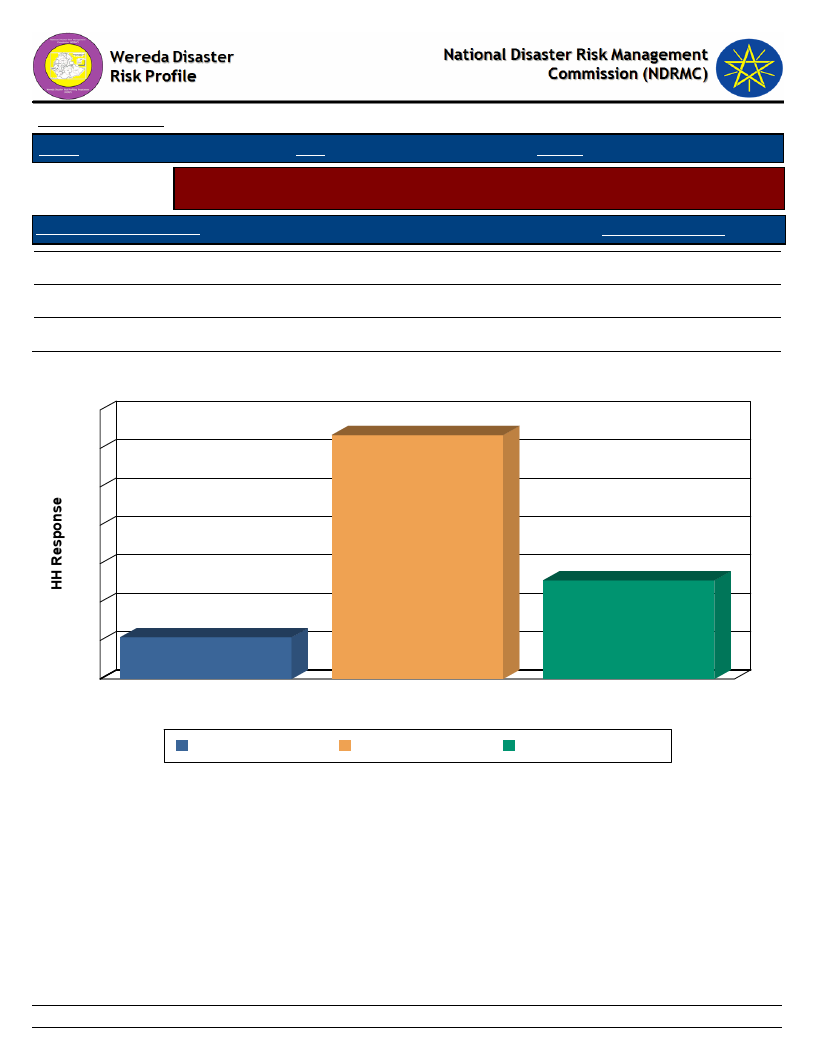
Data_Collected_Date
Region S.N.N.P
Zone SOUTH OMO
Friday, July 12, 2019
Wereda NYANGATOM
Selected Indicator
Agriculture (Livestock): Water Availability - Households response on water
availability for livestock
Access to Water - Livestock
Household Response
A - Regularly available
B - Occasionally
C - Seldom available
10.86
63.49
25.66
Household Access to Water for Livestock
70
63
60
50
40
30
26
20
11
10
0
A - Regularly available
B - Occasionally
Access to Water - Livestock
C - Seldom available
A - Regularly available B - Occasionally
C - Seldom available
154
Page 1 of 1

Data_Collected_Date
Friday, July 12, 2019
Region S.N.N.P
Zone SOUTH OMO
Wereda NYANGATOM
Selected Indicator
Agriculture (Livestock): Water Availability - Households perception on
problematic months for water availability for Livestock
Problematic Months
Order of Severity
A - Sep (Meskerem)
B - Oct (Tikimt)
C - Nov (Hidar)
D - Dec (Tahsas)
E - Jan (Tir)
F - Feb (Yekatit)
G - Mar (Megabit)
H - Apr (Meazea)
I - May (Ginbot)
1st
0.25
7.89
19.34
50.64
6.11
14.50
0.76
0.51
2nd
0.25
7.89
20.10
57.51
6.36
6.87
1.02
3rd
0.26
1.04
13.51
22.08
52.73
6.23
4.16
155
Page 1 of 1

Data_Collected_Date
Region S.N.N.P
Zone SOUTH OMO
Friday, July 12, 2019
Wereda NYANGATOM
Selected Indicator
Sources of water for livestock (households response in %)
Type of Livestock Owned
Changes Observed By Households
Birka
Communal tap (Bono)
Other
Pond or lake (fenced)
Pond or lake (open access)
Rainwater harvesting
River, stream
Dry Season
44.78
0.25
0.25
0.51
4.83
0.25
49.11
Wet Season
19.69
0.26
1.02
49.10
8.44
21.48
50
45
40
Household Responses to Type of Water Source and Season for Livestock
49
30
20
20
10
0
Birka
0
Communal tap
(Bono)
5
0
0
1
1
Other
Pond or lake
(fenced)
Pond or lake (open
access)
Type of Water Source & Season
Dry Season
Wet Season
8
0
Rainwater
harvesting
49
21
River, stream
156
Page 1 of 1
WDRP Indicators
Access to Market and Credit
157
Wereda Disaster
Risk Profile
Data_Collected_Date
National Disaster Risk Management
Commission (NDRMC)
Friday, July 12, 2019
Region S.N.N.P
Zone SOUTH OMO
Wereda NYANGATOM
Selected Indictor:
KebeleName
AYEPA
Economic Vulnerability: Proportion of Produce Sold and Market - Proportion of crops and livestock sold from total
production and markets
Market_For_Crops
Market_For_Livestock_Produce
Percent
Livestock_Sold
Total_% Comments
Sold
Kansaten
10
KAJAMAKEN
Nyngatom
10
KEBELE 01
Nyngatom
10
KOPEREYA
Nyangatom
10
KUCHURU
LOKAMEGNAN
Nyangatom
10
We are selling only honey
production
LOKORLEM
Kongaten
10
LOPAKOR
15
LORENKACHAWE
Nyngatom
15
LOTOMEN
Kangaten
10
NAPATOKOYET
Kanpaten
10
NAROGOY
Kangaten
15
NATEKER
Nangaten
10
NAWEYAPE
Nangaten
10
158
Page 1 of 2

Wereda Disaster
Risk Profile
Data_Collected_Date
National Disaster Risk Management
Commission (NDRMC)
Friday, July 12, 2019
Region S.N.N.P
Zone SOUTH OMO
Wereda NYANGATOM
Selected Indictor:
KebeleName
SHENKORA
Economic Vulnerability: Proportion of Produce Sold and Market - Proportion of crops and livestock sold from total
production and markets
Market_For_Crops
Market_For_Livestock_Produce
Percent
Livestock_Sold
Total_% Comments
Sold
Kangaten
10
TERGA
Kangaton
15
KOWTEM
kangaten
10
LEBERE
Kangaton
10
NAKARMAN
Kangaten
10
NAPUSUMERYA
Kangaten
10
159
Page 2 of 2
Data_Collected_Date
Region S.N.N.P
Selected Indicator
Kebele Name
AYEPA
KAJAMAKEN
KEBELE 01
KOPEREYA
KUCHURU
LOKAMEGNAN
LOKORLEM
LOPAKOR
LORENKACHAWE
LOTOMEN
NAPATOKOYET
NAROGOY
NATEKER
NAWEYAPE
SHENKORA
TERGA
KOWTEM
LEBERE
NAKARMAN
NAPUSUMERYA
Zone SOUTH OMO
Friday, July 12, 2019
Wereda NYANGATOM
Economic Vulnerability: Kebele Access to Markets - Access to market by Kebele
Market_Access_Comments
Poor access and linage of market
There is no market access and market linkage
Some what good because at this time they are have awareness how to sell their cattle
and live in good manner
No access and linkage of market
No access and linkage of market
No access and linkage of market
No access and linkage of market
Poor road and market access
No market access and linkage
No market and market linkage
No market and linkage of market
No market and market linkage
No market and market linkage
No market access and linkage
Poor access and linkage of market
Poor access of market and linkage
No market access and linkage
No market access and linkage
Poor access and linkage of market
No access and linkage of market
160
Page 1 of 1
Data_Collected_Date
Region S.N.N.P
Zone SOUTH OMO
Friday, July 12, 2019
Wereda NYANGATOM
Selected Indicator
Economic Vulnerability: Formal & Informal Transfers - Percentage of
households reporting received formal transfers
Type of Formal Transfer
Food aid
HH Response Type of Informal Transfer
Formal
47.48
HH Response
Food-for-Work project
56.54
Cash-for-Work project
55.61 Other cash gift
1.01
Faffa
0.27 Cash loan (no interest)
1.01
Free cash
1.37 Food or grain gift
6.55
Seeds
22.04 Grain loan (no interest)
3.02
Credit support
0.27 Seed gift
4.79
Livestock
Seed loan
0.50
Tools
39.30 Free labour
10.08
Gift of livestock to newly-weds
1.76
Donation or loan of milking animals to a relative or
0.25
friend
Dowry given to bride’s parents
2.02
Donations of cash or animals to disaster stricken
2.77
people
Blood money – compensation
0.76
Free use of oxen or plough
0.25
Free use of pack animals (camels or donkeys)
6.05
Restocking of poorer relatives
0.25
Distribution of meat to neighbours after a slaughter
takes place
Sacrifice made to feed the poor
11.59
0.25
Cash or kind gift to married daughters when they
2.27
visit parents or relatives
161
Page 1 of 2
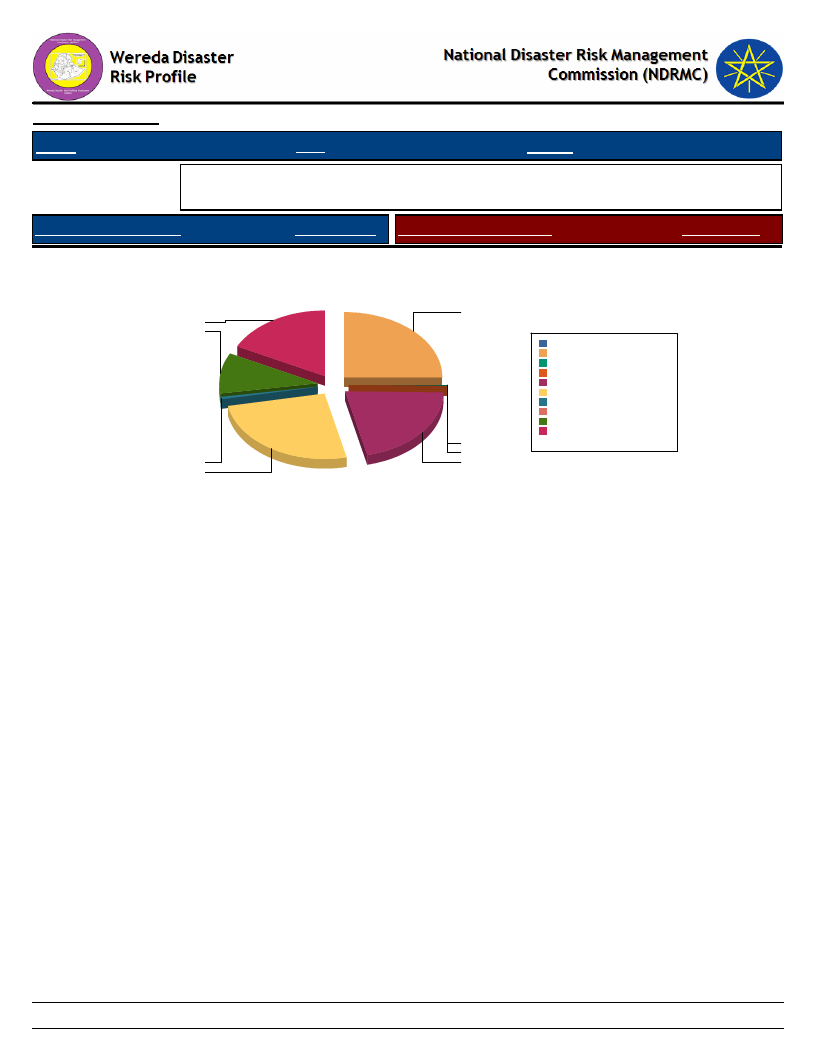
Data_Collected_Date
Region S.N.N.P
Zone SOUTH OMO
Friday, July 12, 2019
Wereda NYANGATOM
Selected Indicator
Economic Vulnerability: Formal & Informal Transfers - Percentage of
households reporting received formal transfers
Type of Formal Transfer
HH Response Type of Informal Transfer
Formal
Type of Formal Transfer Received By Households
HH Response
39.3
22.0
1.4
56.5
55.6
0.3
0.3
47.5
0.0%
Cash-for-Work project 25.0%
Credit support
0.1%
Faffa
0.1%
Food aid
21.3%
Food-for-Work project 25.4%
Free cash
0.6%
Livestock
0.0%
Seeds
9.9%
Tools
17.6%
Total:
100.0%
162
Page 2 of 2
Data_Collected_Date
Region S.N.N.P
Zone SOUTH OMO
Friday, July 12, 2019
Wereda NYANGATOM
Selected Indicator
Capacity: Access to Credit Facilities - Households access to credit facilities
Type of Access To Credit Facilities
Indicator_Value
Households who borrowed any money in the last one year (%)
Households who tried to borrow 1-2
Households who managed to get credit 1-2
Households with membership in any credit /micro finance society (%)
Households who tried to borrow 3-4
Average No. of HHs Tried to get Credit
Average No. HHs Managed to get Credit
5.99
96.30
100.00
22.14
3.70
0.81
1.48
163
Page 1 of 1

Data_Collected_Date
Region S.N.N.P
Zone SOUTH OMO
Wereda NYANGATOM
Friday, July 12, 2019
Selected Indicator
Capacity: Access to Credit Facilities - Percentage of households by major
reasons of borrowing money
Type of Borrowing Reason
Degree of Importance of the Borrowing Reasons - HH Respones
Buy agricultural input
Buy food
Buy or rent land
Others (specify)
Pay for health care
Pay for social event
1st
Important
4.55
54.55
9.09
31.82
2nd
Important
40.00
50.00
10.00
3rd
Important
40.00
40.00
20.00
164
Page 1 of 1
Data_Collected_Date
Friday, July 12, 2019
Region S.N.N.P
Zone SOUTH OMO
Wereda NYANGATOM
Selected Indicator
Capacity: Access to Credit Facilities - Percentage of households by major
sources of credit
Major Sources of Credit for Households
Degree of Importance of the Credit Source
Bank/formal lending institution
1st
Important
19.05
2nd
Important
Friends/relatives
Neighbors
Others (specify)
28.57
9.52
42.86
50.00
50.00
165
Page 1 of 1
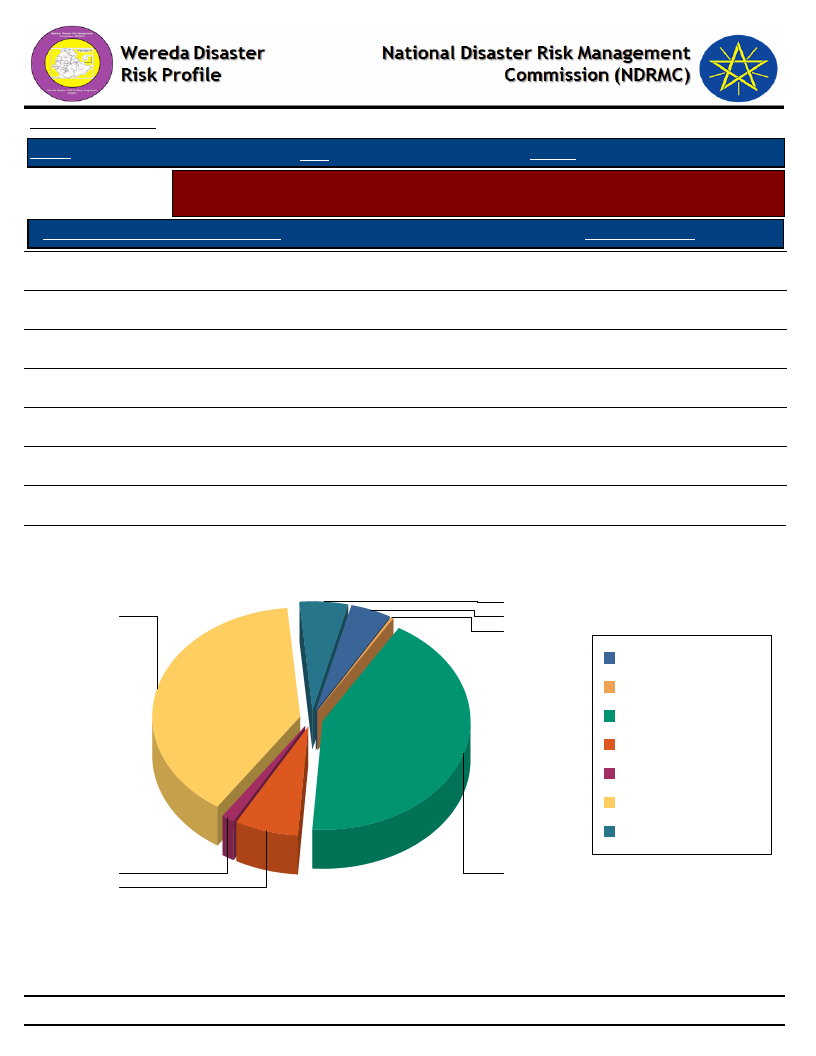
Data_Collected_Date
Friday, July 12, 2019
Region S.N.N.P
Zone SOUTH OMO
Wereda NYANGATOM
Selected Indicator
Capacity: Access to Credit Facilities - Percent of households with ability to raise
500 birr in one week
HH Ability To Raise 500 Br in One Week
Response_Percent
Yes, we would use our savings
5.49
Yes, by selling asset or livestock
41.04
No, it would be impossible
44.51
DK
4.62
Yes, by borrowing money
1.45
Perhaps, but I doubt it
7.51
NA
0.29
Households' Ability To Raise 500 Br in One Week
5
41
5
0
DK
NA
No, it would be
impossible
Perhaps, but I doubt it
Yes, by borrowing
money
Yes, by selling asset or
livestock
Yes, we would use our
savings
1
45
8
166
Page 1 of 1
WDRP Indicators
Health and Sanitation
Characteristics
167
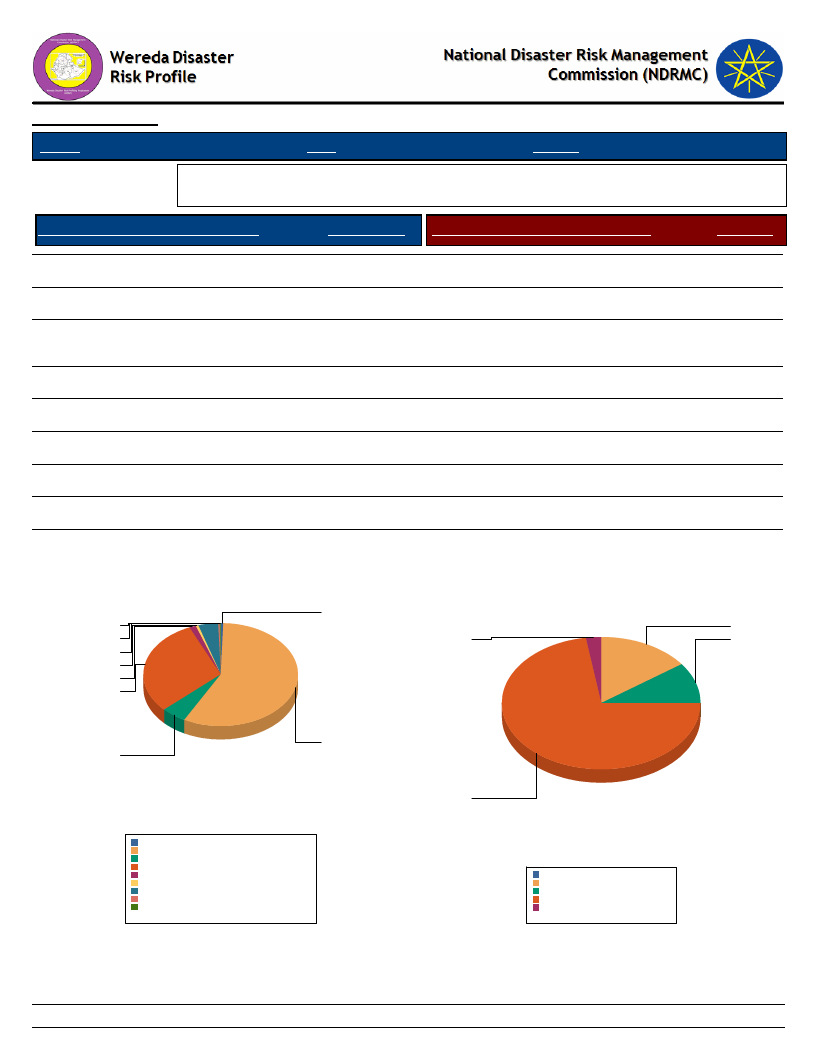
Data_Collected_Date
Region S.N.N.P
Zone SOUTH OMO
Friday, July 12, 2019
Wereda NYANGATOM
Selected Indicator
Household Access to Health Facilities - Where do patients go for health care?
Constraints to adequate healthcare
Where do Patients Go for Healthcare
HH Response Constraints to Adequate Health Care
Response
Did not get Health Care
Central Hospital
District/Municipal hospital/health
centre/ clinic
Other public
Traditional healer
Spiritual healer
Community health worker
Private hospital/clinic
Pharmacy
5.33
0.62
30.24
1.36
0.25
0.25
57.13
4.21
0.62
No money for treatment costs
No money for travel
Shortage of health professionals
Health facilities are too distant
72.50
10.00
2.50
15.00
Where Do Patients go for Health care?
1
0
0
4
1
1
30
Constraints to Adequate Health Care
15
3
10
57
5
Central Hospital
Community health worker
Did not get Health Care
District/Municipal hospital/health centre/ clinic
Other public
Pharmacy
Private hospital/clinic
Spiritual healer
Traditional healer
0.6%
57.1%
5.3%
30.2%
1.4%
0.6%
4.2%
0.2%
0.2%
Total:
100.0%
73
Health facilities are too distant
No money for travel
No money for treatment costs
Shortage of health professionals
0.0%
15.0%
10.0%
72.5%
2.5%
Total:
100.0%
168
Page 1 of 1

Data_Collected_Date
Region S.N.N.P
Zone SOUTH OMO
Friday, July 12, 2019
Wereda NYANGATOM
Selected Indicator
Hazards: Health problems and changes over the last decade
Kebele Name
Health_Problems
Changes_In_Last_Decade
AYEPA
KAJAMAKEN
KEBELE 01
KOPEREYA
KUCHURU
LOKAMEGNAN
LOKORLEM
LOPAKOR
LORENKACHAWE
LOTOMEN
NAPATOKOYET
NAROGOY
NATEKER
NAWEYAPE
SHENKORA
TERGA
KOWTEM
LEBERE
NAKARMAN
Malaria Caused By
Malaria Caused By Environmental hygiene, stagnant
water
Malaria Caused By Stagnant water
Malaria, diarrhea Caused By Environmental problem
Malaria, diarrhea Caused By Pollution of Omo river
Malaria Caused By Short period rain fall, stagnant water
Malaria Caused By Drinking unclean water
Malaria, diarrhea Caused By
Malaria, diarrhea Caused By Shortage of rain make
disease outbreak, stagnant water
Malaria, water born disease Caused By Favorable
environment mosquito reproduction, no water
purification habit and access
Malaria Caused By Rain in April, stagnant water
Malaria Caused By Seasonal rain in short period of April
Malaria Caused By Environmental condition, reproduction
of mosquito bit
Malaria Caused By Mosquito reproduction
Malaria, diarrhea Caused By Favorable environment for
outbreak disease
Malaria, diarrhea Caused By Shortage of drinking water
Malaria Caused By Short period of rain in April, poor
health service, reproduction of mosquito
Malaria, malnutrition Caused By Shortage of period rain
in April, shortage of of food
Malaria Caused By Shortage office, stagnant water
169
Increased
Increased
Decreased
Decreased
Decreased
Decreased
Increasing
Decreased
Decreased
Increasing
Decreased
Decreased
Increased
Increasing
Decreased
Decreased
Decreased
Increased
Decreased
Page 1 of 2

Data_Collected_Date
Region S.N.N.P
Zone SOUTH OMO
Friday, July 12, 2019
Wereda NYANGATOM
Selected Indicator
Hazards: Health problems and changes over the last decade
Kebele Name
Health_Problems
Changes_In_Last_Decade
NAPUSUMERYA
Malaria Caused By Short period rain in May, mosquito
reproduction
Decreased
170
Page 2 of 2
Wereda Disaster
Risk Profile
Data_Collected_Date
National Disaster Risk Management
Commission (NDRMC)
Friday, July 12, 2019
Region S.N.N.P
Zone SOUTH OMO
Wereda NYANGATOM
Selected Indicator
Household Health Status - Households health condition and major health problems
Health Condition
HH Response Population Sickness
HH Response Children Sickness
HH Response
Good health
Ill for <3 months
Ill for more than three months
57.59
35.36
7.05
Chronic fever
Malaria
Diarrhea
Back ache
HIV/AIDS
Stomach pain
Asthma
Mental illness
Others
Headache
Tuberculosis
Meningitis
Pneumonia/ lung problem
Hyper tension
Eye problems
14.35
31.16
21.94
2.57
0.23
2.68
0.12
0.12
2.45
15.64
3.38
0.93
0.82
0.23
3.38
Chronic fever
Malaria
Diarrhea
Stomach pain
Others
Headache
Tuberculosis
Meningitis
Pneumonia/ lung problem
Eye problems
Back ache
22.01
29.77
24.92
0.32
1.62
15.53
1.62
0.32
0.97
2.27
0.65
171
Page 1 of 2
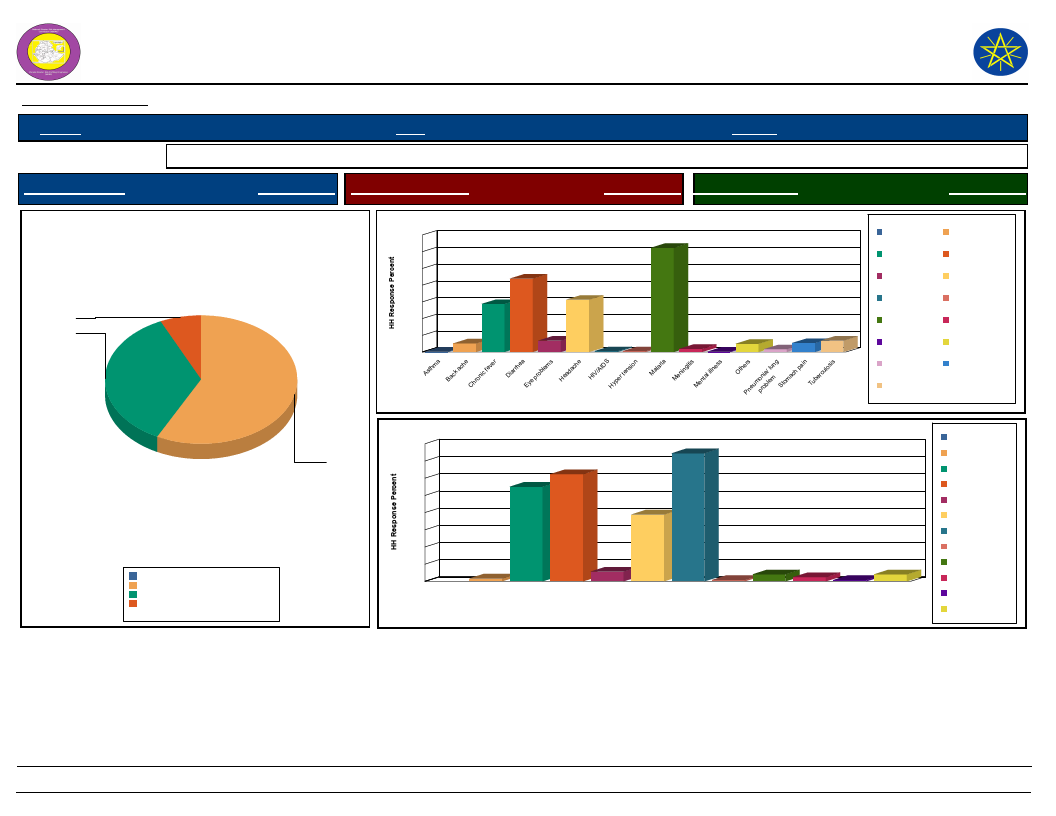
Wereda Disaster
Risk Profile
Data_Collected_Date
National Disaster Risk Management
Commission (NDRMC)
Friday, July 12, 2019
Region S.N.N.P
Zone SOUTH OMO
Wereda NYANGATOM
Selected Indicator
Household Health Status - Households health condition and major health problems
Health Condition
HH Response Population Sickness
HH Response Children Sickness
HH Response
Health Condition of the Community
7.0
35.4
57.6
Good health
Ill for <3 months
Ill for more than three months
0.0%
57.6%
35.4%
7.0%
Total:
100.0%
Population Sickness in the Community
35
31
30
25
22
20
16
15
14
10
5
3
0
0
3
2
3
3
0
0
1
0
1
Population Sickness
Asthma
Chronic fever
Eye problems
HIV/AIDS
Malaria
Mental illness
Pneumonia/ lung
problem
Tuberculosis
Back ache
Diarrhea
Headache
Hyper tension
Meningitis
Others
Stomach pain
Children Sickness in the Community
32
30
28
25
24
22
20
16
16
Back ache
Chronic fever
Diarrhea
Eye problems
Headache
12
Malaria
8
Meningitis
4
1
2
0
2
1
0
2
Others
Pneumonia/ lung
0
problem
Back ache Chronic
fever
Diarrhea
Eye
Headache
problems
Malaria
Children Sickness
Meningitis
Others
Pneumonia/
lung
problem
Stomach
pain Tuberculosis
Stomach pain
Tuberculosis
172
Page 2 of 2

Data_Collected_Date
Friday, July 12, 2019
Region S.N.N.P
Zone SOUTH OMO
Wereda NYANGATOM
Selected Indicator
Household Access to Sanitation - Percentage of households with access to
different kind of toilet facilities
Type of Toilet Facility
HH Response
Modern water closet
Outdoors latrine/hole on plot
No facilities/Open Space
HH Sharing Toilet
0.50
3.27
96.22
0.25
Household Responses to the type of toilet facilities in the community
0.5
3.3
96.2
Modern water closet
No facilities/Open Space
Outdoors latrine/hole on
plot
173
Page 1 of 1
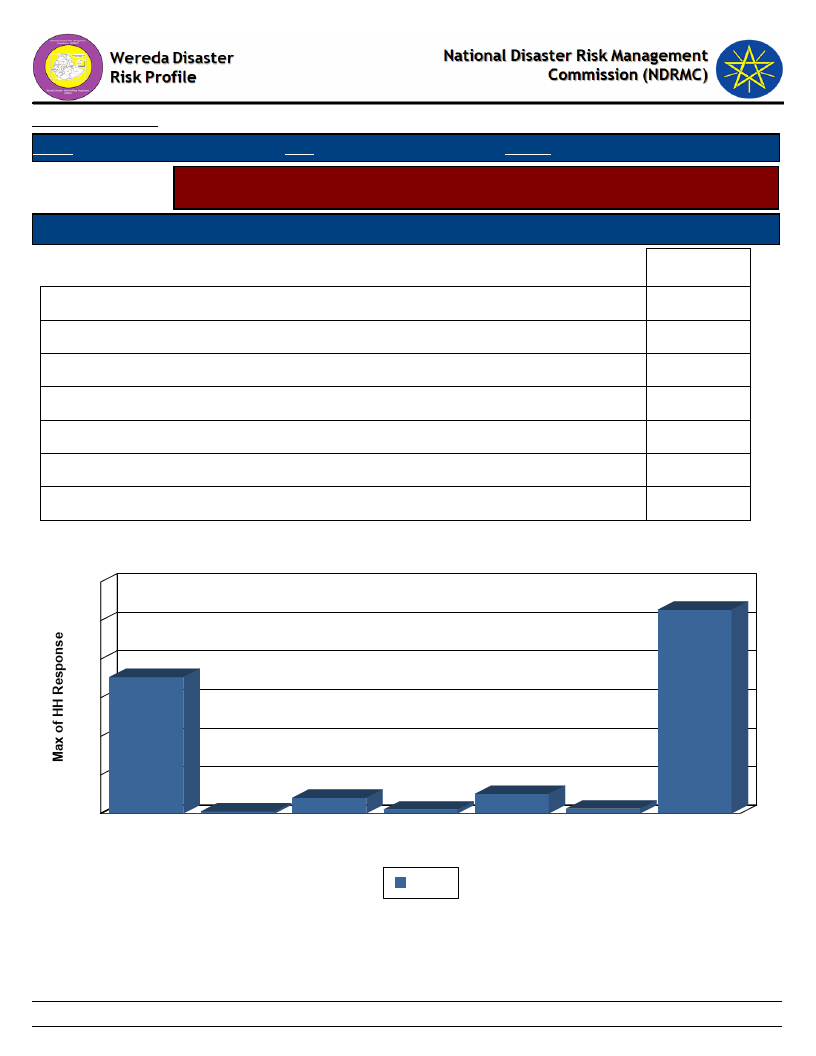
Data_Collected_Date
Region S.N.N.P
Zone SOUTH OMO
Friday, July 12, 2019
Wereda NYANGATOM
Selected Indicator
Household Access to Drinking Water - Sources of drinking water for households
(response in %)
Sources of drinking water for Households
Priority of the Water Source
Main
Birka
Communal tap (Bono)
Other
Piped water outside the house
Pond or lake (fenced)
Pond or lake (open access)
River, stream
35.35
0.51
4.04
1.01
5.05
1.26
52.78
Source of Drinking Water & Type of Source
60
53
50
40
35
30
20
10
4
1
0
Birka
Communal tap
Other
(Bono)
1
Piped water
outside the
house
Main
5
1
Pond or lake Pond or lake River, stream
(fenced) (open access)
174
Page 1 of 1
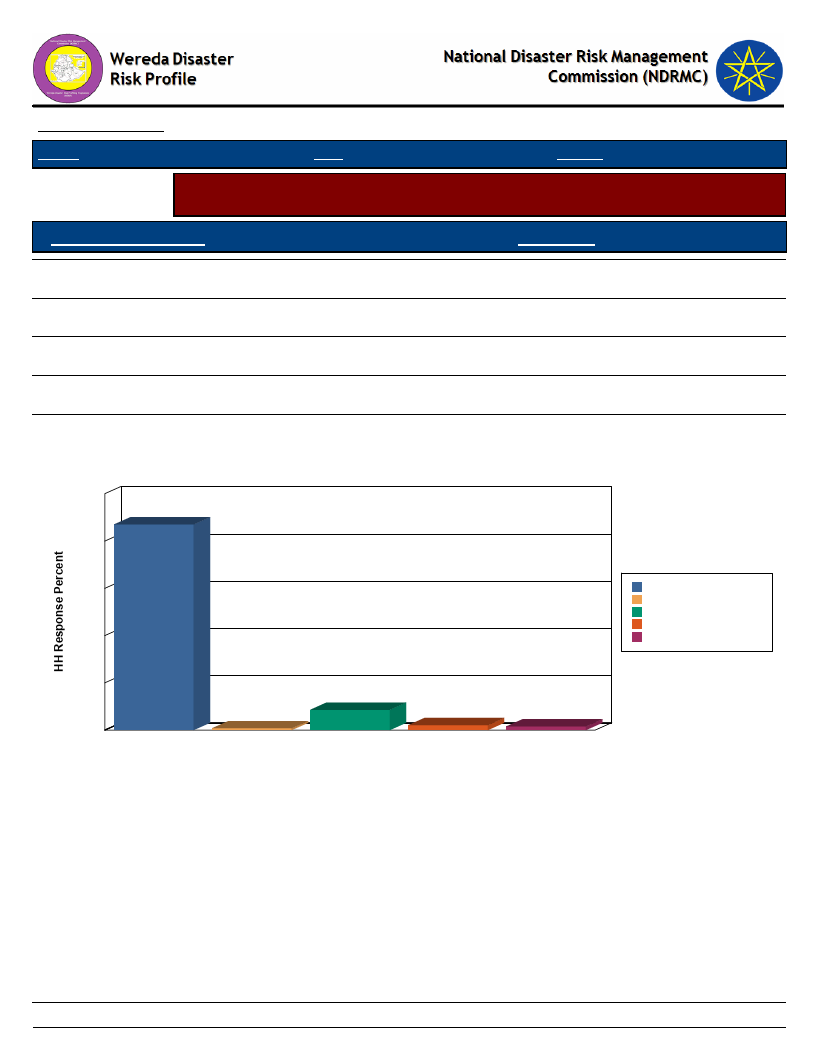
Data_Collected_Date
Region S.N.N.P
Zone SOUTH OMO
Wereda
Friday, July 12, 2019
NYANGATOM
Selected Indicator
Household Access to Drinking Water - Households methods of treating drinking
water
Method of Treating Water
HH Response
Water Guard
1.56
Use filter
2.08
Other chemicals
0.78
Other Method (specify)
8.57
None
87.01
100
87
80
Method of Treating Water by Households
60
None
Other chemicals
Other Method (specify)
Use filter
40
Water Guard
20
0
None
9
1
2
Other chemicals
Other Method
(specify)
Use filter
Water Treatment Method
2
Water Guard
175
Page 1 of 1
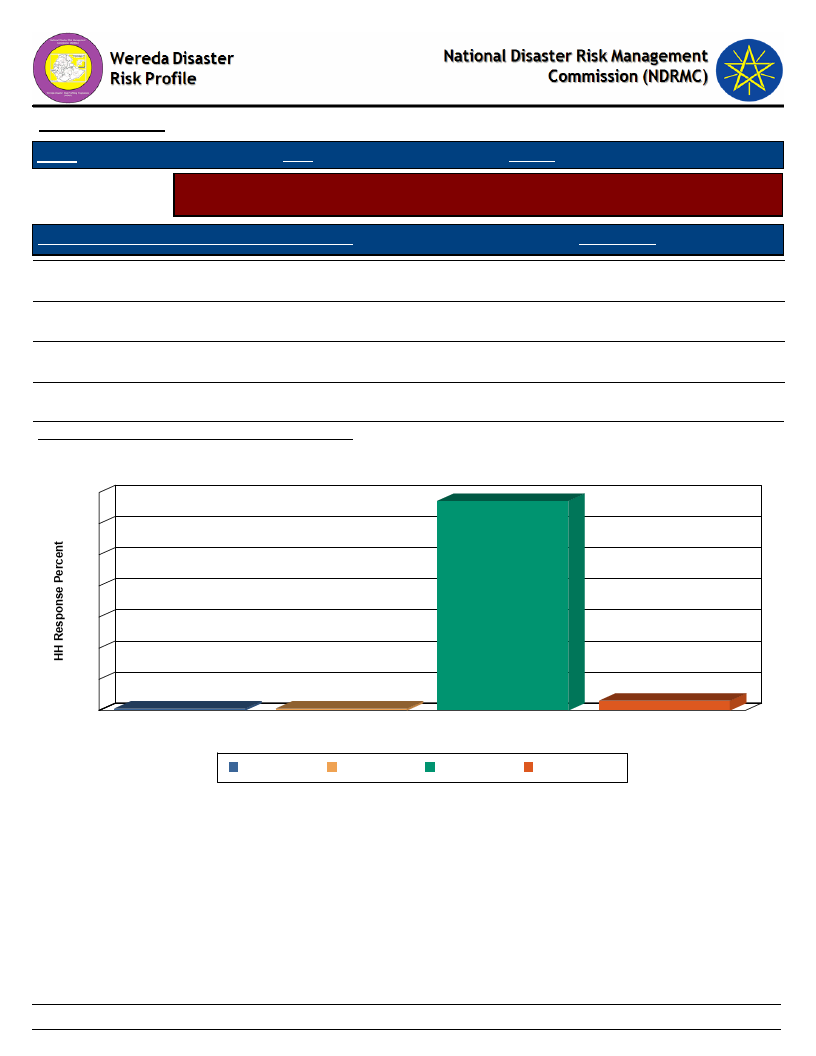
Data_Collected_Date
Friday, July 12, 2019
Region S.N.N.P
Zone SOUTH OMO
Wereda NYANGATOM
Selected Indicator
Household Access to Drinking Water - Number of times households fetch water
in a week
Number of Times Households Fetch Water in a Week
HH Response
Twice
1.26
Four times
0.25
Seven times
26.95
Eight and more
Average Number of Times HH Fetch Water Per Week
Number of Times HH Fetch Water in a Week
28
27
24
20
16
12
8
4
0
0
Eight and more
0
Four times
Seven times
Number of Times HH Fetch Water in a Week
Eight and more Four times
Seven times
Twice
0.25
13.13
1
Twice
176
Page 1 of 1
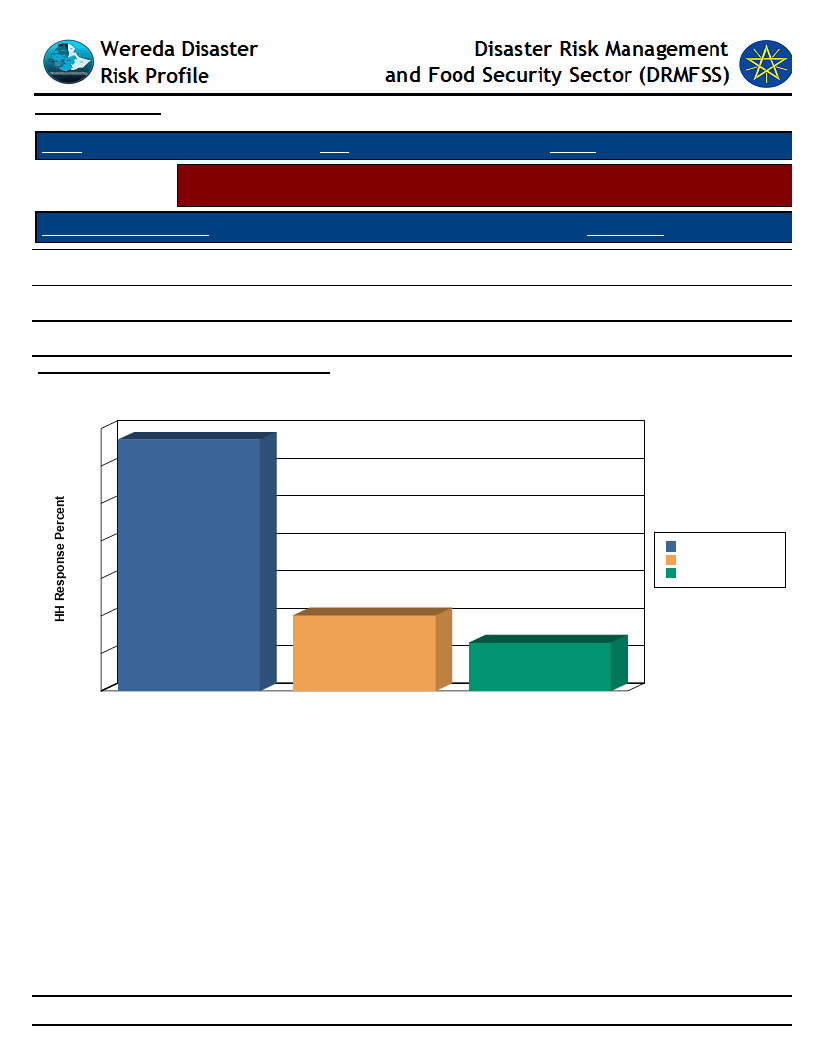
Data_Collected_Date
Friday, July 12, 2019
Region S.N.N.P
Zone SOUTH OMO
Wereda NYANGATOM
Selected Indicator
Household Access to Drinking Water - Time taken per day to fetch water for
households
Time Taken To Fetch Water
HH Response
Less than 30 min
12.85
30 min - 1 hr
20.15
1 hr and Above
Average Number of Times Taken To Fetch Water
67.00
127.48
Time Taken To Fetch Water for the HH
70
67
60
50
40
1 hr and Above
30 min - 1 hr
30
Less than 30 min
20
20
13
10
0
1 hr and Above
30 min - 1 hr
Less than 30 min
Time Taken To Fetch Water
177
Page 1 of 1
WDRP Indicators
Coping Mechanisms and
Preparedness
178
Wereda Disaster Risk
Profile
Data_Collected_Date
Region S.N.N.P
Zone SOUTH OMO
Selected Indicator
KebeleName
Capacity: Community Preparedness against Sudden Onset Disasters
Precaution_1
Comment_1
Precaution_2
AYEPA
KAJAMAKEN
KEBELE 01
KOPEREYA
KUCHURU
LOKAMEGNAN
LOKORLEM
Reporting to
government offices
Migrate away from
disaster suffered
area
Awareness creation
Report to
government bodies
Report to
government office
Report to
government
Migration
We have no past
experience how to
cope up with a
sudden disaster
occurrence rather
than migration
Prepare training
regarding awareness
creation
The community not
have preparedness
We have no
preparedness
measure
Unable to know how
to manage such
sudden onset
disaster occurrence
The community
always practice such
measurement during
sedan conflict
occurrence
Preparedness
works
Migration
Migrate
Migration
179
National Disaster Risk Management
Commission (NDRMC)
Friday, July 12, 2019
Wereda NYANGATOM
Comment_2
Precaution_3
Comment_3
Training
The only option
To save live
Vaccination
Pre medical
work
To save life
Page 1 of 3

Wereda Disaster Risk
Profile
Data_Collected_Date
Region S.N.N.P
Zone SOUTH OMO
Selected Indicator
KebeleName
Capacity: Community Preparedness against Sudden Onset Disasters
Precaution_1
Comment_1
Precaution_2
LOPAKOR
LORENKACHAWE
LOTOMEN
NAPATOKOYET
NAROGOY
Report to
government office
Reporting to
government office
Reporting for kebele
management
Reporting to
government
Migration
To preparedness
time take any
measure
To get response for
sudden onset
disaster
Not train how to
take any measure
environment during
sudden disaster
occurrence
To save life
Migration
Migration
Migration
Move away form
the disaster area
NATEKER
Migration
NAWEYAPE
Migration
Have no past
experience how to
cope with a sudden
disaster occurrence
rather than
migration
SHENKORA
Report to
government
No other
preparedness
Migration
180
National Disaster Risk Management
Commission (NDRMC)
Friday, July 12, 2019
Wereda NYANGATOM
Comment_2
Precaution_3
Comment_3
Searching water
and pasture
To escape from the
disaster
Not need to loss our
life and asset to
cope up
To sustain our life
Page 2 of 3

Wereda Disaster Risk
Profile
Data_Collected_Date
Region S.N.N.P
Zone SOUTH OMO
Selected Indicator
KebeleName
Capacity: Community Preparedness against Sudden Onset Disasters
Precaution_1
Comment_1
Precaution_2
TERGA
KOWTEM
Reporting
government office
Migration
To get response
To save life
Migration
LEBERE
NAKARMAN
NAPUSUMERYA
Reporting to
government bodies
Report to
government
Reporting to
government
Unable to know how
to manage such
sudden onset
disaster
To get help
Migration
The community will
not have
preparedness time
to take any measure
Migration
National Disaster Risk Management
Commission (NDRMC)
Friday, July 12, 2019
Wereda NYANGATOM
Comment_2
Precaution_3
Comment_3
To save life
If the government
did not give
responsive
attention
181
Page 3 of 3

Wereda Disaster
Risk Profile
Data_Collected_Date
Region S.N.N.P
Zone SOUTH OMO
National Disaster Risk Management
Commission (NDRMC)
Friday, July 12, 2019
Wereda NYANGATOM
Selected Indicator
Capacity: Community Preparedness against Increase in Disaster Intensity
KebeleName
Precaution_1
Comment_1
Precaution_2
Comment_2
Precaution_3
Comment_3
AYEPA
KAJAMAKEN
KEBELE 01
KOPEREYA
KUCHURU
LOKAMEGNAN
LOKORLEM
LOPAKOR
LORENKACHAWE
Changing farming
system
Manage the
livestock
Awareness of
disaster
Changing the
farmin system
Changing farming
system
Changing farming
system
Managing livestock
and natural
resource
Changing farming
system
Changing fearming
system
Because awarness
play a vital rok
Replacing cattle
with small ruminant
cattles
Exchange longer
ruminants with
small ruminants
Changing to new
vareity
Abolition on the
foreing plants
Report to wereda
when thing go
wrong
Remove prosphis
free from the area
Because reporting is
mandatory
Becasue to improve
pasture prodcutive
Mobilizing
developemntal
agent
Developmental
agent paly a
significnat role
182
Page 1 of 3

Wereda Disaster
Risk Profile
National Disaster Risk Management
Commission (NDRMC)
Data_Collected_Date
Region S.N.N.P
Zone SOUTH OMO
Wereda NYANGATOM
Friday, July 12, 2019
Selected Indicator
Capacity: Community Preparedness against Increase in Disaster Intensity
KebeleName
LOTOMEN
NAPATOKOYET
NAROGOY
NATEKER
NAWEYAPE
SHENKORA
TERGA
Precaution_1
No adaptive
measure to be
taken for conflict
Trying to produce
animnal feed
Changing farming
system
Managing livetock
in balance with
pasture
availaibility in our
area
Minimizing our
livestock in
balance with feed
avaialility
Changing livestock
species
Changing farming
system
Comment_1
Main impact of
drought is feed
shortage
It is possible option
to rearing disaster
resistant livestock
species
Frequent occurence
of conflict for
shortage of water
and pasture on the
border of the area
There is conflict
To improve
prodcutivity
Precaution_2
Changing farming
system
Make the area for
and raizing land
Temporary
migration
Comment_2
Replacing livestock
bread, irigation
Shortage of food
Precaution_3
Comment_3
183
Page 2 of 3

Wereda Disaster
Risk Profile
National Disaster Risk Management
Commission (NDRMC)
Data_Collected_Date
Region S.N.N.P
Zone SOUTH OMO
Wereda NYANGATOM
Friday, July 12, 2019
Selected Indicator
Capacity: Community Preparedness against Increase in Disaster Intensity
KebeleName
KOWTEM
LEBERE
NAKARMAN
NAPUSUMERYA
Precaution_1
Managing our
livestock in
balance
Chaning farming
sysstem
Changing farming
system
Changing farming
sytem
Comment_1
Exchanging larter to
small ruminnats
To get beter
prodcution
Replacing variety of
livestock
Precaution_2
Abolitio on the
foreign plant
prosophis in our
kebele
Removing prosophis
tree
Comment_2
It reduce pasture
prodcutivity
Precaution_3
Comment_3
184
Page 3 of 3

Wereda Disaster
Risk Profile
Data_Collected_Date
Region S.N.N.P
Zone
SOUTH OMO
Selected Indicator
Capacity: Community Preparedness against Disasters
Kebele Name
Precaution 1
Comment 1
Precaution 2
AYEPA
Migration
KAJAMAKEN
KEBELE 01
Apply to the
government for
help
No potential to design
and implement such
other preventive
strategies
Migrate
temporarily
away from the
disaster
occurrence area
KOPEREYA
KUCHURU
Migration
Migration
To get water and
pasture
To save live
LOKAMEGNAN
Migration
No option
Exchange cattle
specie
LOKORLEM
Preparing for
struggle against
LOPAKOR
LORENKACHAWE
Migration
Migration
Feed and water
availability around the
border and no other
option
To save live
To save human and
livestock
Migration
185
National Disaster Risk Management
Commission (NDRMC)
Friday, July 12, 2019
Wereda NYANGATOM
Comment 2
Precaution 3
Comment 3
The government
will return up to
our farmer
habitation
Reduce feed and
water
requirement for
larger cattle
To save the life
Page 1 of 3

Wereda Disaster
Risk Profile
Data_Collected_Date
Region S.N.N.P
Zone
SOUTH OMO
Selected Indicator
Capacity: Community Preparedness against Disasters
Kebele Name
Precaution 1
Comment 1
Precaution 2
LOTOMEN
Reporting for
wereda
management
Seeking of solution
before human death
and migration
Struggling
against
NAPATOKOYET
NAROGOY
Migration
Reporting to
government
To save human and
livestock
Government have good
potential to resolve
such problem
Reporting to
government
Migration
NATEKER
NAWEYAPE
SHENKORA
TERGA
KOWTEM
Asking help from
government
Report to
government for
help
Migration
Migration
Report to
government
No potential and
implement such other
preventive strategies
Migration
Migrate
temporarily
away from the
disaster
occurrence area
To save live
To get help
Migration
186
National Disaster Risk Management
Commission (NDRMC)
Friday, July 12, 2019
Wereda NYANGATOM
Comment 2
Need to use the
resource
available on the
area of conflict
occurrence
Precaution 3
Migration
Comment 3
To escape from
the negative
impact
No option to
coping
mechanism to
prevent form the
impact
Government will
returns to over
farmers habit
Page 2 of 3

Wereda Disaster
Risk Profile
Data_Collected_Date
Region S.N.N.P
Zone
SOUTH OMO
Selected Indicator
Capacity: Community Preparedness against Disasters
Kebele Name
Precaution 1
Comment 1
Precaution 2
LEBERE
NAKARMAN
Temporary
migration
Migration
To reduce loss of
livestock
There is no option
Exchanging
larger cattle
species with
small ruminate
NAPUSUMERYA
Migration
To save life
National Disaster Risk Management
Commission (NDRMC)
Friday, July 12, 2019
Wereda NYANGATOM
Comment 2
Reduce pasture
and water
requirement
Precaution 3
Comment 3
187
Page 3 of 3

Wereda Disaster
Risk Profile
Data_Collected_Date
Region S.N.N.P
Zone
SOUTH OMO
Selected Indicator
Kebele Name
Hazard: Coping and recovering during last Disaster
AYEPA
Type of Disaster(s)
Coping_Strategy
Drought
Migrate the place where pasture land
Description
There is no other operational rather than migration
Recovery_Strategy
Community are not recover after incident
National Disaster Risk Management
Commission (NDRMC)
Friday, July 12, 2019
Wereda NYANGATOM
Description
Community
Participation_Ways
Description
Providing cattle and other basic materials for affected
To protect social life of the community loss of income for house hold to recover incident
Kebele Name
Type of Disaster(s)
Coping_Strategy
Description
Recovery_Strategy
Description
Community
Participation_Ways
Description
KAJAMAKEN
Conflict
Community elders and wereda administration
Not effective
No recover for human death
During incident the kebele younger fight cooperatively on their enemies
Supplying water track and protect the cattle, some one who died of the conflict giving cattle for some one who lost their cattle
during the conflict or due to stolen
188
Page 1 of 10

Wereda Disaster
Risk Profile
Data_Collected_Date
Region S.N.N.P
Zone
SOUTH OMO
Selected Indicator
Kebele Name
Hazard: Coping and recovering during last Disaster
KEBELE 01
Type of Disaster(s)
Coping_Strategy
Drought
Migration
Description
To get food
Recovery_Strategy
Through aid from government and NGOS
Description
Community
Participation_Ways
Description
By the tools that for from government and NGOs
Through sharing resource and aid from government
They were helped by the government food and medication
Kebele Name
Type of Disaster(s)
Coping_Strategy
Description
Recovery_Strategy
Description
Community
Participation_Ways
Description
KOPEREYA
Drought
Migration
To get water and pasture
Providing cattle for some one who lost his cattle by disaster
Helping each other
189
National Disaster Risk Management
Commission (NDRMC)
Friday, July 12, 2019
Wereda NYANGATOM
Page 2 of 10

Wereda Disaster
Risk Profile
Data_Collected_Date
Region S.N.N.P
Zone
SOUTH OMO
Selected Indicator
Kebele Name
Hazard: Coping and recovering during last Disaster
KOWTEM
Type of Disaster(s)
Coping_Strategy
Conflict
Report to wereda administration
Description
Not effective
Recovery_Strategy
No recovery for human death
National Disaster Risk Management
Commission (NDRMC)
Friday, July 12, 2019
Wereda NYANGATOM
Description
Community
Participation_Ways
Description
During incident the kebele youngsters fight cooperatively
Kebele resident elders allowing to remaining herd keepers to keep and protect the cattle of some one who died on conflict
Kebele Name
Type of Disaster(s)
Coping_Strategy
Description
Recovery_Strategy
Description
Community
Participation_Ways
Description
KUCHURU
Drought
Migration
To cope faced incident
Providing house hold tools
Helping each other
190
Page 3 of 10

Wereda Disaster
Risk Profile
Data_Collected_Date
Region S.N.N.P
Zone
SOUTH OMO
Selected Indicator
Kebele Name
Hazard: Coping and recovering during last Disaster
LEBERE
Type of Disaster(s)
Coping_Strategy
Drought
Migration
Description
To save human and livestock life
Recovery_Strategy
Incident is frequent and no recovery
Description
Community
Participation_Ways
Description
Sharing of cattle of whom los their livestock
Recovering the damage one to protect them from food insecurity
Kebele Name
Type of Disaster(s)
Coping_Strategy
Description
Recovery_Strategy
Description
Community
Participation_Ways
Description
LOKAMEGNAN
Drought
Migration
To save live and escape from hazard
Incident is frequent and no recovery
Sharing cattle
Helping each other
191
National Disaster Risk Management
Commission (NDRMC)
Friday, July 12, 2019
Wereda NYANGATOM
Page 4 of 10

Wereda Disaster
Risk Profile
Data_Collected_Date
Region S.N.N.P
Zone
SOUTH OMO
Selected Indicator
Kebele Name
Hazard: Coping and recovering during last Disaster
LOKORLEM
Type of Disaster(s)
Coping_Strategy
Conflict
Chaining feed searching destination, far from the conflict occurrence
Description
To save life
Recovery_Strategy
Description
Community
Participation_Ways
Description
Sharing resource
Improve strength
Kebele Name
Type of Disaster(s)
Coping_Strategy
Description
Recovery_Strategy
Description
Community
Participation_Ways
Description
LOPAKOR
Drought
Migration
Provide cattle for who has lost their livestock
Helping each other
192
National Disaster Risk Management
Commission (NDRMC)
Friday, July 12, 2019
Wereda NYANGATOM
Page 5 of 10
Wereda Disaster
Risk Profile
Data_Collected_Date
Region S.N.N.P
Zone
SOUTH OMO
Selected Indicator
Kebele Name
Hazard: Coping and recovering during last Disaster
LORENKACHAWE
Type of Disaster(s)
Coping_Strategy
Drought
Migration
Description
To save human and livestock
Recovery_Strategy
Description
Community
Participation_Ways
Description
Providing cattle for someone who lost their cattle
Helping each other
National Disaster Risk Management
Commission (NDRMC)
Friday, July 12, 2019
Wereda NYANGATOM
Kebele Name
Type of Disaster(s)
Coping_Strategy
Description
Recovery_Strategy
Description
Community
Participation_Ways
Description
LOTOMEN
Conflict
Migration, short period instability
To save live
No recovery for human death
The incident the kebele youngsters and adult fight against together
It strengthen the cooperation of community member, maximize the moral condition of disaster stricken
193
Page 6 of 10

Wereda Disaster
Risk Profile
Data_Collected_Date
Region S.N.N.P
Zone
SOUTH OMO
Selected Indicator
Kebele Name
Hazard: Coping and recovering during last Disaster
NAKARMAN
Type of Disaster(s)
Coping_Strategy
Drought
Migration
Description
To get pasture and water
Recovery_Strategy
Description
Community
Participation_Ways
Description
Providing cattle
Helping each other
Kebele Name
Type of Disaster(s)
Coping_Strategy
Description
Recovery_Strategy
Description
Community
Participation_Ways
Description
NAPATOKOYET
Drought
Migration
No other option
They did not recover from the incident
Providing cattle for whom lost their livestock
Helping each other
194
National Disaster Risk Management
Commission (NDRMC)
Friday, July 12, 2019
Wereda NYANGATOM
Page 7 of 10

Wereda Disaster
Risk Profile
Data_Collected_Date
Region S.N.N.P
Zone
SOUTH OMO
Selected Indicator
Kebele Name
Hazard: Coping and recovering during last Disaster
NAPUSUMERYA
Type of Disaster(s)
Coping_Strategy
Drought
Migration
Description
To get food, pasture and water
Recovery_Strategy
National Disaster Risk Management
Commission (NDRMC)
Friday, July 12, 2019
Wereda NYANGATOM
Description
Community
Participation_Ways
Description
Provide cattle for someone who lost their cattle due to shortage of water, food and disease
Helping each other
Kebele Name
Type of Disaster(s)
Coping_Strategy
Description
Recovery_Strategy
Description
Community
Participation_Ways
Description
NAROGOY
Livestock disease
Migration, purchasing drugs for livestock and treat them
Not effective
Giving livestock to who lost their livestock due to disease incidence
Helping each other
195
Page 8 of 10

Wereda Disaster
Risk Profile
Data_Collected_Date
Region S.N.N.P
Zone
SOUTH OMO
Selected Indicator
Kebele Name
Hazard: Coping and recovering during last Disaster
NATEKER
Type of Disaster(s)
Coping_Strategy
Conflict
Reporting to community elders and wereda administration
Description
Not effective
Recovery_Strategy
Description
Community
Participation_Ways
Description
Kebele Name
Type of Disaster(s)
Coping_Strategy
Description
Recovery_Strategy
Description
Community
Participation_Ways
Description
NAWEYAPE
Conflict
Community elder and administration
Not effective
During the intermediation fight cooperatively
Protect the cattle, give cattle for some one who lost their cattle
196
National Disaster Risk Management
Commission (NDRMC)
Friday, July 12, 2019
Wereda NYANGATOM
Page 9 of 10

Wereda Disaster
Risk Profile
Data_Collected_Date
Region S.N.N.P
Zone
SOUTH OMO
Selected Indicator
Kebele Name
Hazard: Coping and recovering during last Disaster
SHENKORA
Type of Disaster(s)
Coping_Strategy
Drought
Temporary migrate
Description
Not effective
Recovery_Strategy
Description
Community
Participation_Ways
Description
Provide cattle
Helping each other
Kebele Name
Type of Disaster(s)
Coping_Strategy
Description
Recovery_Strategy
Description
Community
Participation_Ways
Description
TERGA
Drought
Migration
No option
Providing cattle
Helping each other
197
National Disaster Risk Management
Commission (NDRMC)
Friday, July 12, 2019
Wereda NYANGATOM
Page 10 of 10
Data_Collected_Date
Region S.N.N.P
Zone SOUTH OMO
Selected Indicator
Capacity: Type Community Participation
Kebele Name
Levels_Comm_Participation
AYEPA
KAJAMAKEN
KEBELE 01
KOPEREYA
KUCHURU
LOKAMEGNAN
LOKORLEM
LOPAKOR
LORENKACHAWE
LOTOMEN
NAPATOKOYET
NAROGOY
NATEKER
NAWEYAPE
SHENKORA
TERGA
KOWTEM
LEBERE
NAKARMAN
NAPUSUMERYA
Good
Good
Good
Good
Good
Good
Good
Good
Good
Good
Good
Good
Good
Good
Good
Good
Good
Good
Good
Good
198
Friday, July 12, 2019
Wereda NYANGATOM
Changes_In_Last_Decade
Increased the last decade
Increased
Increased
Increased
Increased
Decreasing
Increasing
Increased
Increased
Increased
Increasing
Increased
Increased
Increased
Increased
Increased
Increased
Increasing
Increasing
Decreased
Page 1 of 1
Data_Collected_Date
Region S.N.N.P
Zone SOUTH OMO
Wereda NYANGATOM
Friday, July 12, 2019
Selected Indicator
Capacity: Recovery from Losses from Disasters - Percentage of Households who
have managed to recover from losses of disasters
Percentage of households who have managed to recover from losses of disasters
Comments
22.22 %
199
Page 1 of 1
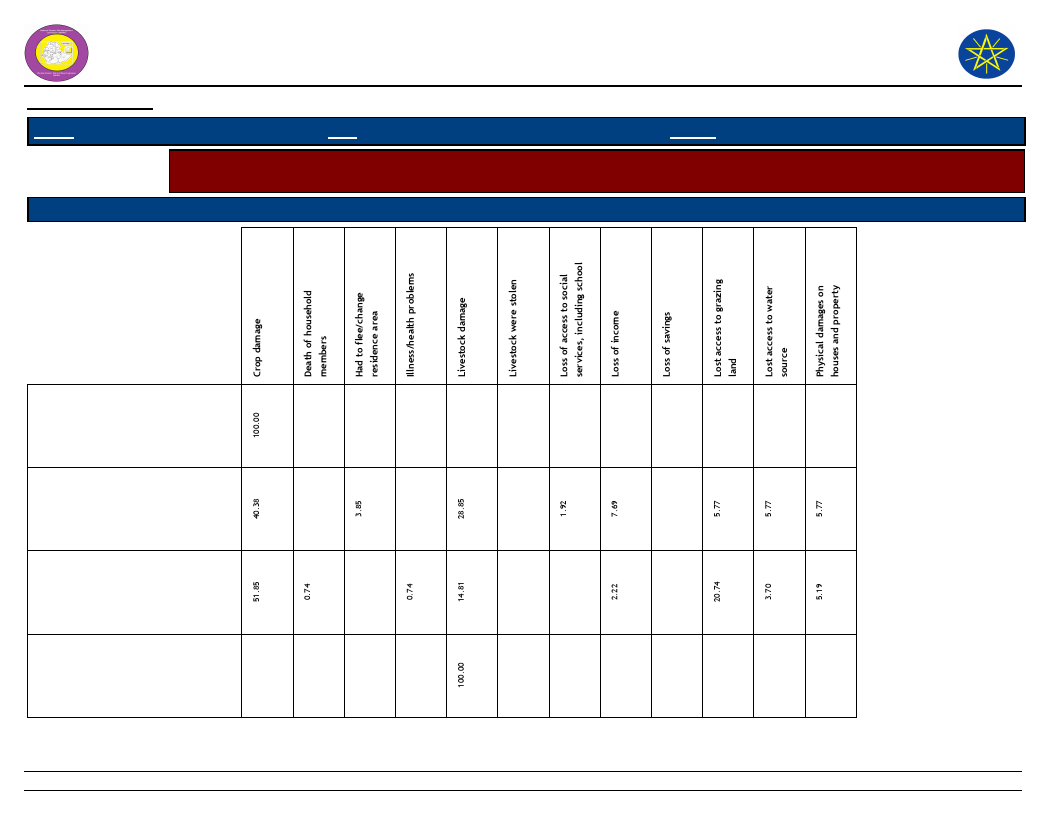
Wereda Disaster
Risk Profile
National Disaster Risk Management
Commission (NDRMC)
Data_Collected_Date
Region S.N.N.P
Zone SOUTH OMO
Wereda NYANGATOM
Friday, July 12, 2019
Selected Indicator
Capacity: Coping Strategies Adopted by Households - Main coping strategies adopted by households to recover
from respective losses
Type of Coping Strategy Adopted
Type of Loss
Begging for money or for food
Borrowing of food or cash
(including purchasing food on
credit)
Consumption rather than sale
of crop surplus
Increased working hours
200
Page 1 of 4

Wereda Disaster
Risk Profile
National Disaster Risk Management
Commission (NDRMC)
Data_Collected_Date
Region S.N.N.P
Zone SOUTH OMO
Wereda NYANGATOM
Friday, July 12, 2019
Selected Indicator
Capacity: Coping Strategies Adopted by Households - Main coping strategies adopted by households to recover
from respective losses
Type of Coping Strategy Adopted
Type of Loss
Limit portion size at meals
Long-term / permanent
migration (including distress
migration of whole families)
Others -
Reduce number of meals eaten
in a day
201
Page 2 of 4

Wereda Disaster
Risk Profile
National Disaster Risk Management
Commission (NDRMC)
Data_Collected_Date
Region S.N.N.P
Zone SOUTH OMO
Wereda NYANGATOM
Friday, July 12, 2019
Selected Indicator
Capacity: Coping Strategies Adopted by Households - Main coping strategies adopted by households to recover
from respective losses
Type of Coping Strategy Adopted
Type of Loss
Reduced expenditure on
non-essential items (beer,
cigarettes, clothes, meat, etc.)
Rely on less preferred and less
expensive food
Sell more livestock than usual
Sending children of household
for work
202
Page 3 of 4
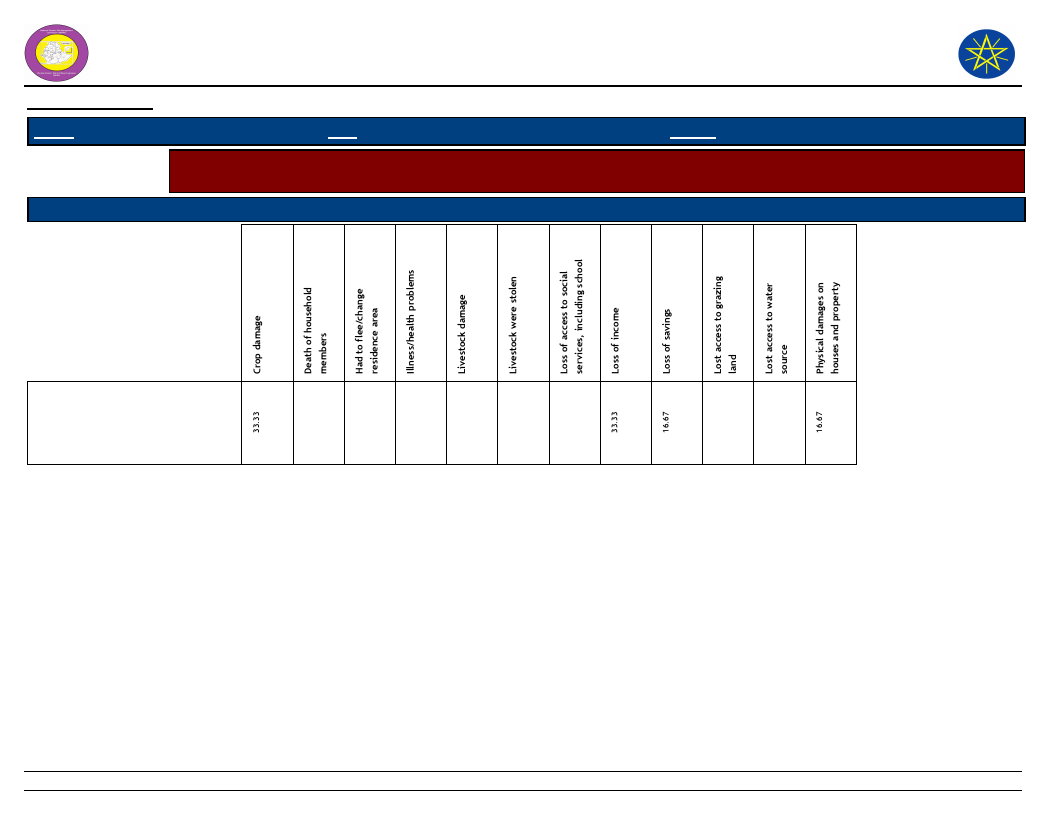
Wereda Disaster
Risk Profile
National Disaster Risk Management
Commission (NDRMC)
Data_Collected_Date
Region S.N.N.P
Zone SOUTH OMO
Wereda NYANGATOM
Friday, July 12, 2019
Selected Indicator
Capacity: Coping Strategies Adopted by Households - Main coping strategies adopted by households to recover
from respective losses
Type of Coping Strategy Adopted
Type of Loss
Short-term / seasonal labor
migration
203
Page 4 of 4
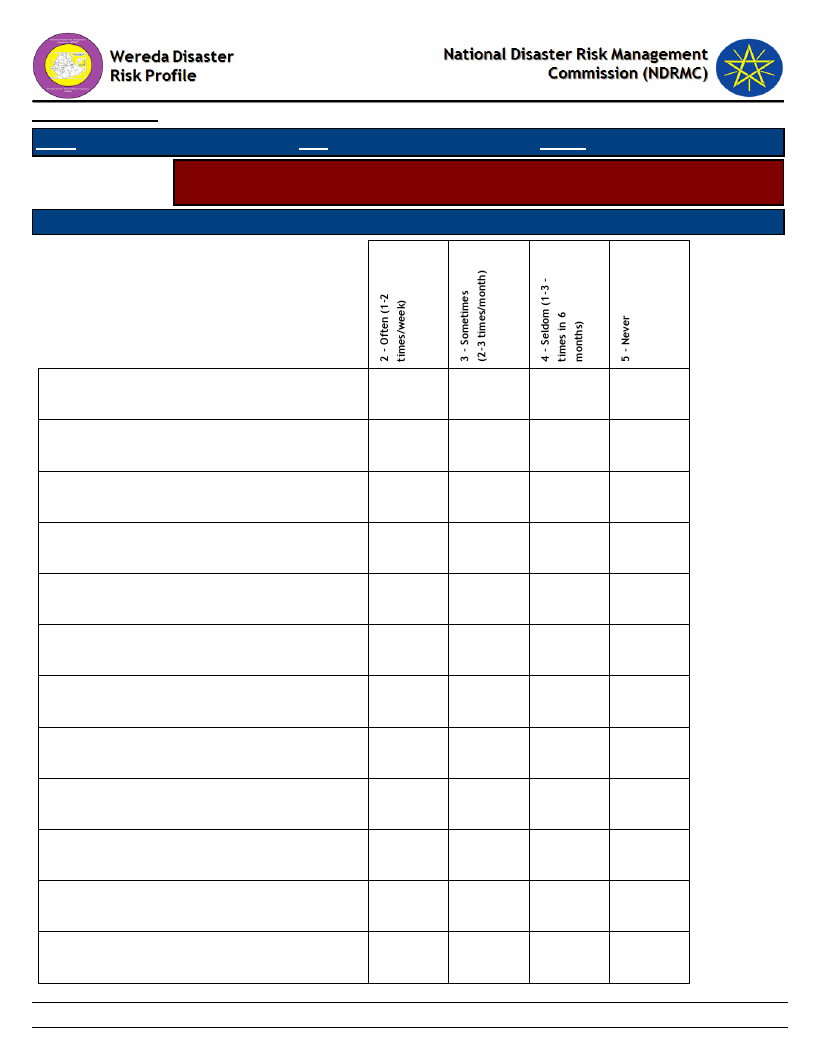
Data_Collected_Date
Region S.N.N.P
Zone SOUTH OMO
Friday, July 12, 2019
Wereda NYANGATOM
Selected Indicator
Capacity: Coping Strategies Adopted by Households - Percentage of households
by frequency of main coping strategies adopted
Type of Coping Strategy Adopted
Frequency of Adoption
Begging for money or for food
Borrowing of food or cash (including purchasing
food on credit)
Consumption rather than sale of crop surplus
Increased working hours
Limit portion size at meals
Long-term / permanent migration (including
distress migration of whole families)
Others -
Reduce number of meals eaten in a day
Reduced expenditure on non-essential items
(beer, cigarettes, clothes, meat, etc.)
Rely on less preferred and less expensive food
Sell more livestock than usual
Sending children of household for work
1.92
16.42
40.00
81.25
16.22
35.71
30.77
66.67
3.85
3.73
22.22
25.00
7.21
14.29
100.00
94.23
77.61
100.00
60.00
66.67
100.00
75.00
67.57
50.00
61.54
33.33
2.24
11.11
9.01
7.69
204
Page 1 of 2
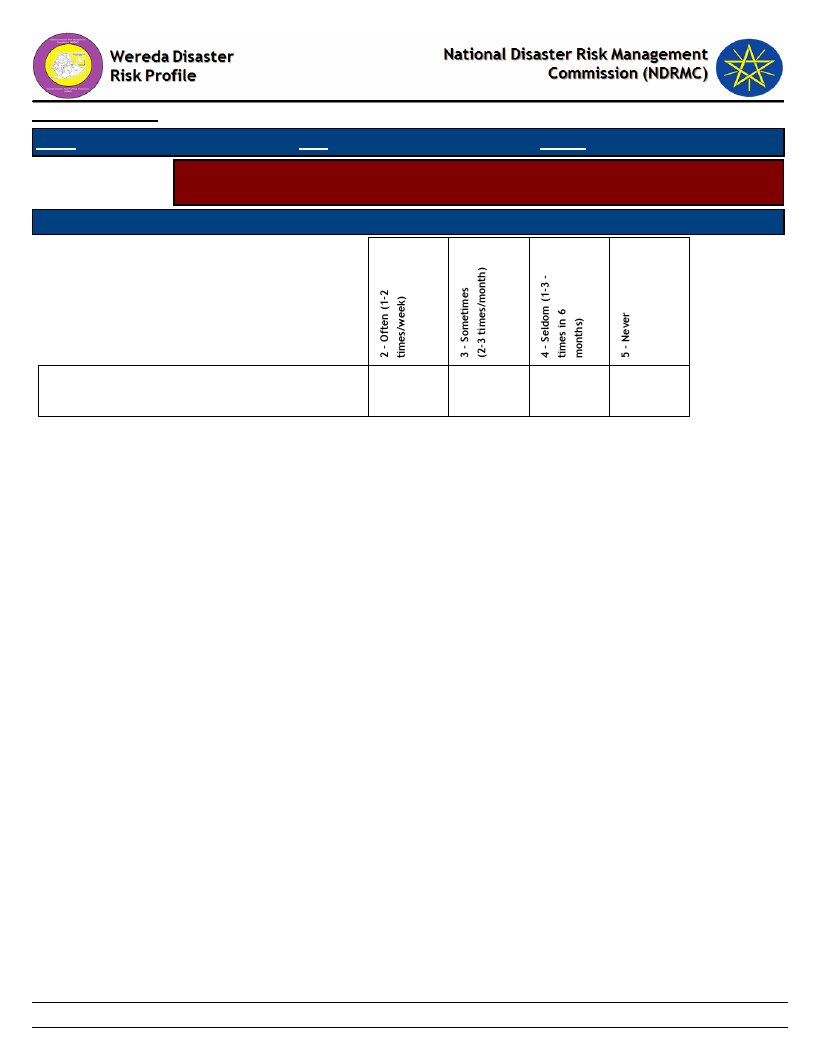
Data_Collected_Date
Region S.N.N.P
Zone SOUTH OMO
Friday, July 12, 2019
Wereda NYANGATOM
Selected Indicator
Capacity: Coping Strategies Adopted by Households - Percentage of households
by frequency of main coping strategies adopted
Type of Coping Strategy Adopted
Frequency of Adoption
Short-term / seasonal labor migration
100.00
205
Page 2 of 2

Wereda Disaster
Risk Profile
Data_Collected_Date
National Disaster Risk Management
Commission (NDRMC)
Friday, July 12, 2019
Region S.N.N.P
Zone SOUTH OMO
Wereda NYANGATOM
Selected Indicator
Kebele Name
AYEPA
KAJAMAKEN
KEBELE 01
KOPEREYA
KUCHURU
LOKAMEGNAN
LOKORLEM
LOPAKOR
LORENKACHAWE
LOTOMEN
NAPATOKOYET
NAROGOY
NATEKER
NAWEYAPE
SHENKORA
TERGA
KOWTEM
Capacity: Alternative Livelihood Sources - Alternative livelihood sources suggested by the community
Work_Option_1
Comment_1
Work_Option_2
Comment_2
Work_Option_3
There is no
optional type
No option work
No option
No option
No option
Participate in
prosphes avoid
implemented
No option
No other option
No option
No option
No option
No option
No option
No option
Migration
No option
No option
Comment_3
206
Page 1 of 2
Wereda Disaster
Risk Profile
Data_Collected_Date
National Disaster Risk Management
Commission (NDRMC)
Friday, July 12, 2019
Region S.N.N.P
Zone SOUTH OMO
Wereda NYANGATOM
Selected Indicator
Kebele Name
LEBERE
NAKARMAN
NAPUSUMERYA
Capacity: Alternative Livelihood Sources - Alternative livelihood sources suggested by the community
Work_Option_1
Comment_1
Work_Option_2
Comment_2
Work_Option_3
Participated in
prosophis
avoidance
implementation
by RPLRP
Change type of
farming
No option
Income generating
and clearing a huge
canopy tree
Have a chance
irrigation land
Comment_3
207
Page 2 of 2
Data_Collected_Date
Region S.N.N.P
Zone SOUTH OMO
Wereda NYANGATOM
Friday, July 12, 2019
Selected Indicator
Type of Disaster
Capacity: Recovery from Losses from Disasters - Percentage of households
recovered from past disasters by type of Disasters
Recovered Percentage
Drought
72.73
Crop diseases
1.14
Livestock diseases
2.27
Heat waves/ High temp
3.41
Conflicts
20.45
208
Page 1 of 1
Data_Collected_Date
Region S.N.N.P
Zone SOUTH OMO
Wereda NYANGATOM
Selected Indicator:
Capacity: Recovery from Losses from Disasters - Proportion of households
recovered by type of Losses
Friday, July 12, 2019
Type of Loss
Percentage
Physical damages on houses and property
7.95
Crop damage
36.36
Livestock damage
11.36
Death of household members
3.41
Illness/health problems
3.41
Loss of income
2.27
Loss of savings
2.27
Livestock were stolen
11.36
Lost access to grazing land
12.50
Lost access to water source
3.41
Had to flee/change residence area
5.68
209
Page 1 of 1

Data_Collected_Date
Region S.N.N.P
Zone SOUTH OMO
Friday, July 12, 2019
Wereda NYANGATOM
Selected Indicator
Capacity: Coping Options if More Resources Available - What coping strategy
could be adopted if more resource were available?
Coping Strategy To Be Adopted
Response (%)
Adaptation of economic activities to hazards season (e.g. cropping cycle, short term
crops, etc.)
Storage of food and other necessities
28.61
44.81
Physical protection of buildings and property
25.32
Changing residence area/migration
0.51
Others (specify)
0.25
None
0.51
210
Page 1 of 1
Data_Collected_Date
Friday, July 12, 2019
Region S.N.N.P
Selected Indictor:
Zone SOUTH OMO
Wereda NYANGATOM
Capacity: Coping Strategies Adopted by Households - Percentage of households by
major type of coping strategies adopted (at least once)
Coping Strategy Adopted
Main Strategy
Secondary Strategy
Reduced expenditure on non-essential items (beer, cigarettes,
clothes, meat, etc.)
Consumption rather than sale of crop surplus
28.35
34.18
3.06
20.92
Sell more livestock than usual
6.58
12.76
Borrowing of food or cash (including purchasing food on credit)
13.16
12.76
Sending children of household for work
0.76
Short-term / seasonal labor migration
1.52
0.51
Long-term / permanent migration (including distress migration of
whole families)
Increased working hours
2.28
0.51
0.25
1.02
Rely on less preferred and less expensive food
3.54
Limit portion size at meals
3.80
2.55
Begging for money or for food
0.25
24.49
Reduce number of meals eaten in a day
1.01
1.53
Others -
4.05
16.84
Others -
0.25
Others -
0.51
211
Page 1 of 1

Wereda Disaster
Risk Profile
National Disaster Risk Management
Commission (NDRMC)
Data_Collected_Date
Region S.N.N.P
Zone SOUTH OMO
Wereda NYANGATOM
Selected Indicator
Capacity: Coping Strategies Adopted by Households - Main coping strategies adopted by households for respective
disasters
Coping Strtegies Adopted
Types of disaters for which HHs in the community adopt the listed
Coping Strtegies
Friday, July 12, 2019
Begging for money or for
food
Borrowing of food or cash
(including purchasing food
on credit)
Consumption rather than
sale of crop surplus
212
Page 1 of 5
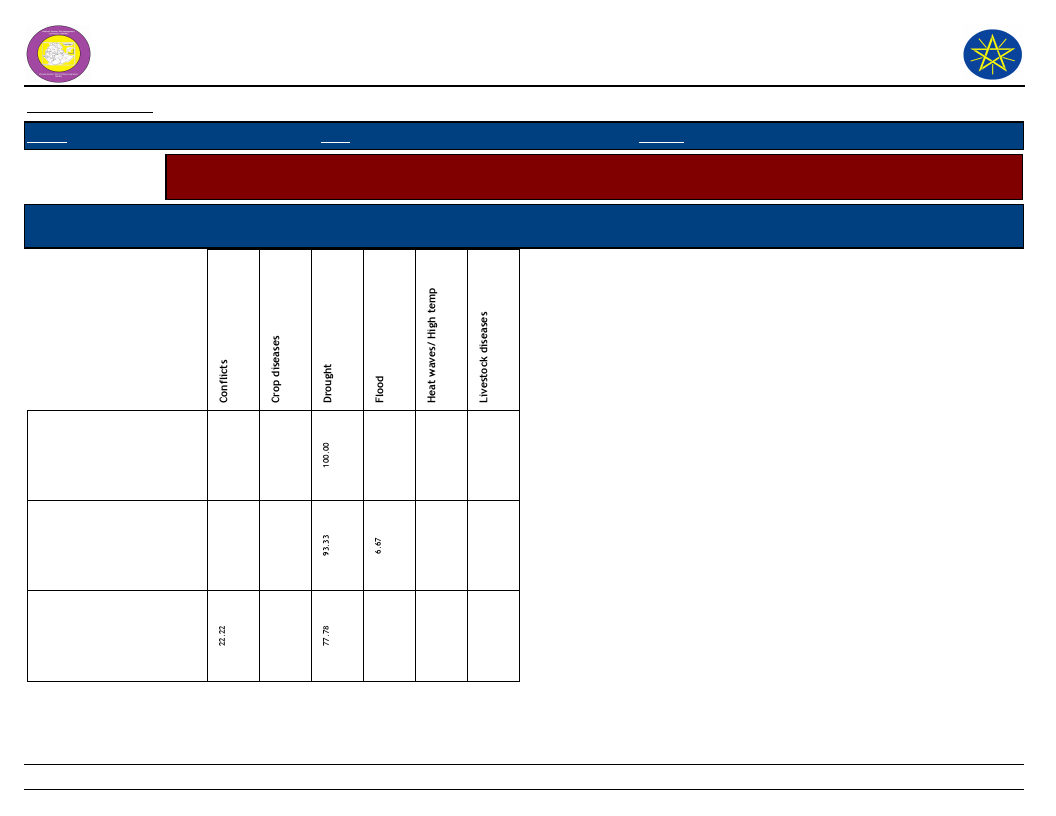
Wereda Disaster
Risk Profile
National Disaster Risk Management
Commission (NDRMC)
Data_Collected_Date
Region S.N.N.P
Zone SOUTH OMO
Wereda NYANGATOM
Selected Indicator
Capacity: Coping Strategies Adopted by Households - Main coping strategies adopted by households for respective
disasters
Coping Strtegies Adopted
Types of disaters for which HHs in the community adopt the listed
Coping Strtegies
Friday, July 12, 2019
Increased working hours
Limit portion size at meals
Long-term / permanent
migration (including
distress migration of
whole families)
213
Page 2 of 5
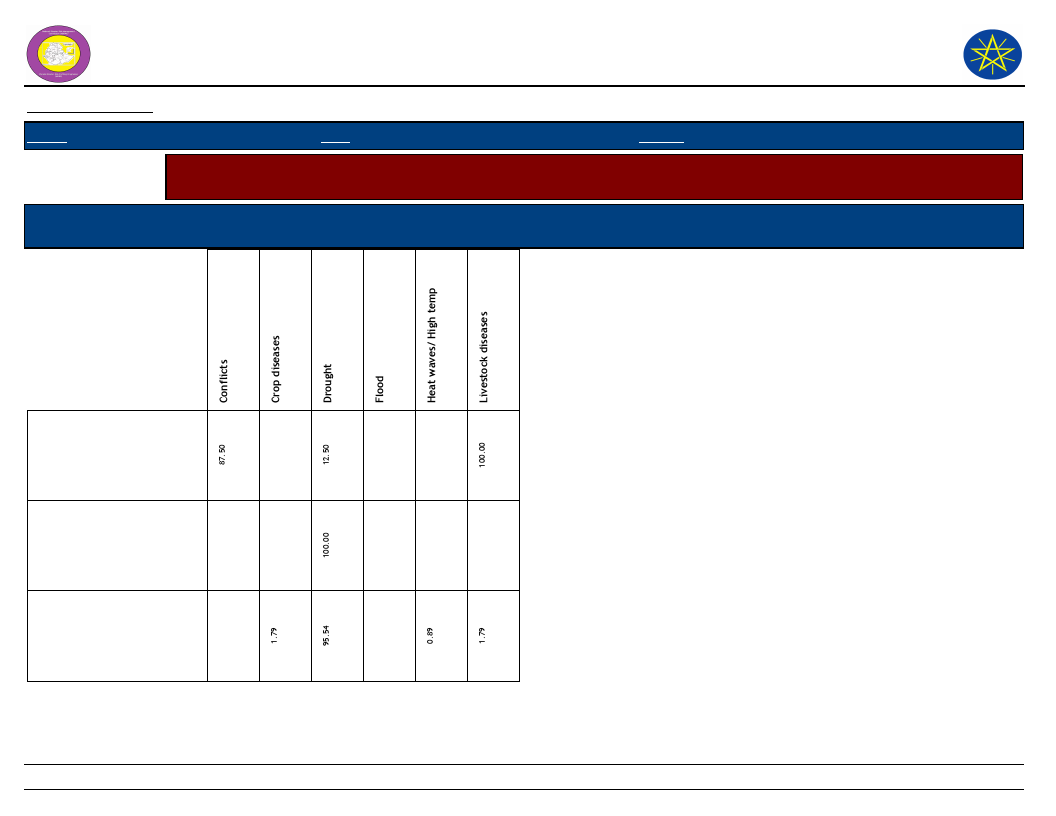
Wereda Disaster
Risk Profile
National Disaster Risk Management
Commission (NDRMC)
Data_Collected_Date
Region S.N.N.P
Zone SOUTH OMO
Wereda NYANGATOM
Selected Indicator
Capacity: Coping Strategies Adopted by Households - Main coping strategies adopted by households for respective
disasters
Coping Strtegies Adopted
Types of disaters for which HHs in the community adopt the listed
Coping Strtegies
Friday, July 12, 2019
Others -
Reduce number of meals
eaten in a day
Reduced expenditure on
non-essential items (beer,
cigarettes, clothes, meat,
etc.)
214
Page 3 of 5

Wereda Disaster
Risk Profile
National Disaster Risk Management
Commission (NDRMC)
Data_Collected_Date
Region S.N.N.P
Zone SOUTH OMO
Wereda NYANGATOM
Selected Indicator
Capacity: Coping Strategies Adopted by Households - Main coping strategies adopted by households for respective
disasters
Coping Strtegies Adopted
Types of disaters for which HHs in the community adopt the listed
Coping Strtegies
Friday, July 12, 2019
Rely on less preferred and
less expensive food
Sell more livestock than
usual
Sending children of
household for work
215
Page 4 of 5
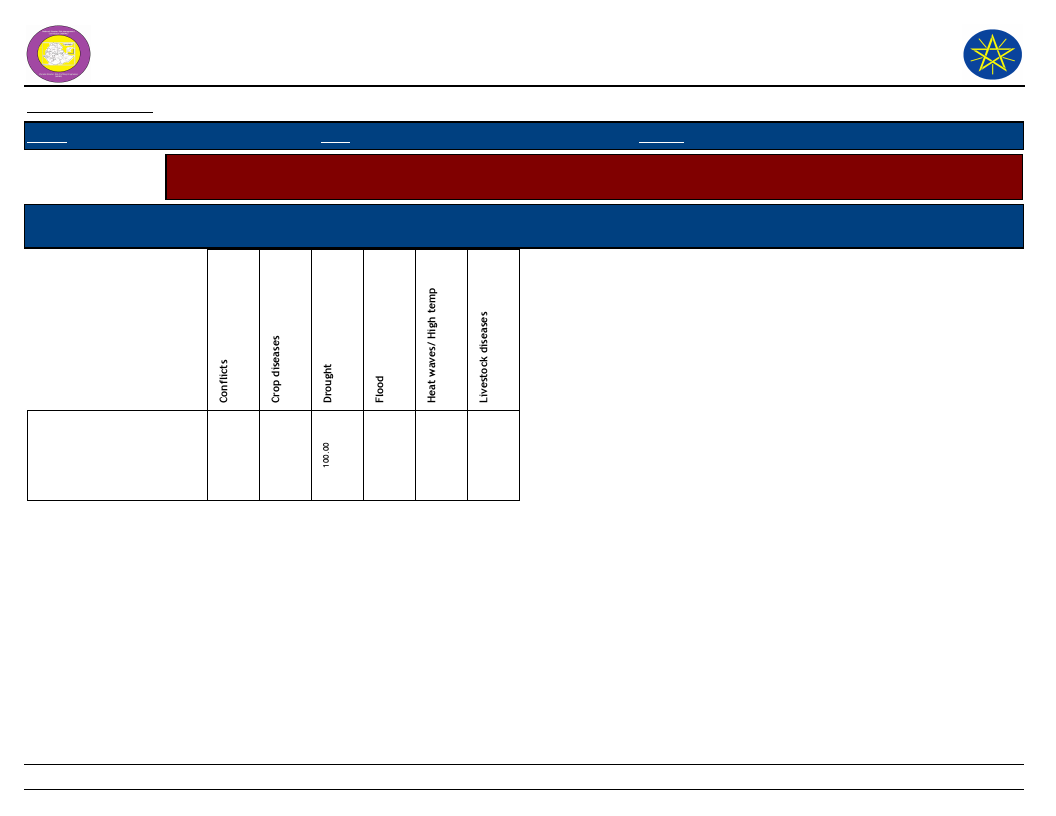
Wereda Disaster
Risk Profile
National Disaster Risk Management
Commission (NDRMC)
Data_Collected_Date
Region S.N.N.P
Zone SOUTH OMO
Wereda NYANGATOM
Selected Indicator
Capacity: Coping Strategies Adopted by Households - Main coping strategies adopted by households for respective
disasters
Coping Strtegies Adopted
Types of disaters for which HHs in the community adopt the listed
Coping Strtegies
Friday, July 12, 2019
Short-term / seasonal
labor migration
216
Page 5 of 5
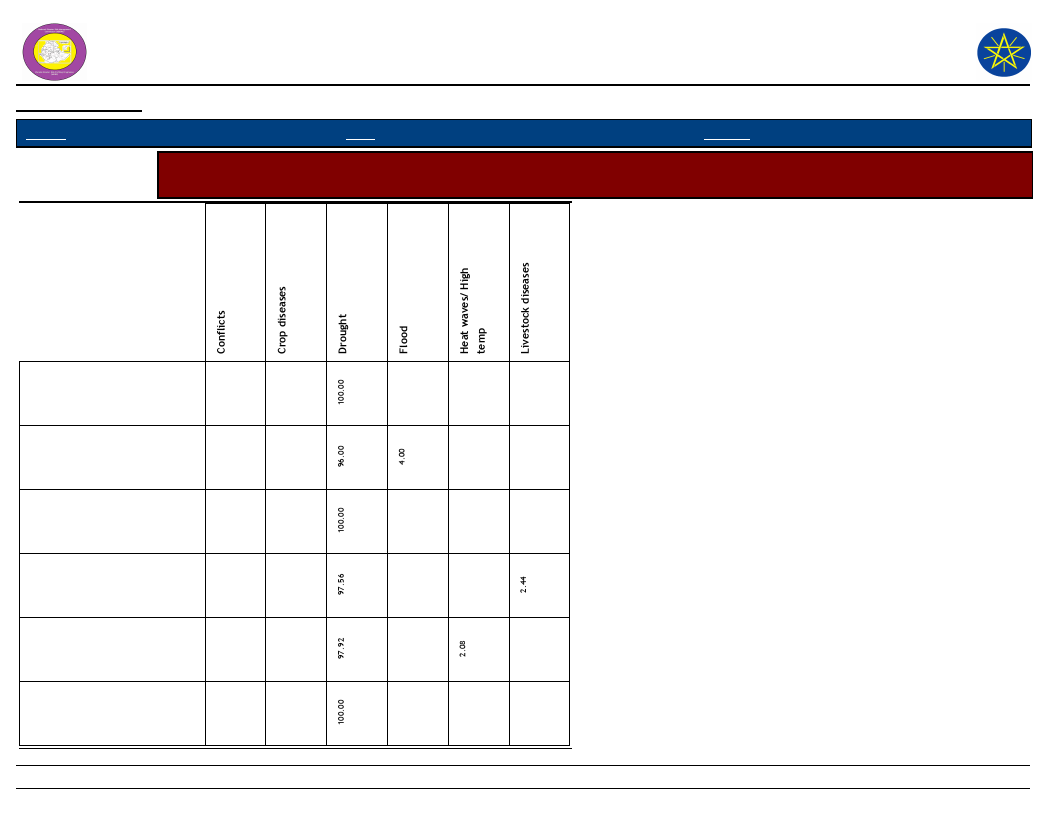
Wereda Disaster Risk
Profile
National Disaster Risk Management
Commission (NDRMC)
Data_Collected_Date
Region S.N.N.P
Zone
SOUTH OMO
Wereda NYANGATOM
Friday, July 12, 2019
Selected Indicator
Capacity: Coping Strategies Adopted by Households - Secondary coping strategies adopted by households for
respective disasters
Begging for money or for
food
Borrowing of food or cash
(including purchasing food
on credit)
Collection of wild food
Consumption rather than
sale of crop surplus
Limit portion size at meals
Long-term / permanent
migration (including
distress migration of whole
217
Page 1 of 3

Wereda Disaster Risk
Profile
National Disaster Risk Management
Commission (NDRMC)
Data_Collected_Date
Region S.N.N.P
Zone
SOUTH OMO
Wereda NYANGATOM
Friday, July 12, 2019
Selected Indicator
Capacity: Coping Strategies Adopted by Households - Secondary coping strategies adopted by households for
respective disasters
Others -
Reduce number of meals
eaten in a day
Reduced expenditure on
non-essential items (beer,
cigarettes, clothes, meat,
Rely on less preferred and
less expensive food
Sale of non-productive
assets (Jewelry, clothing,
etc.)
Sell more livestock than
usual
218
Page 2 of 3
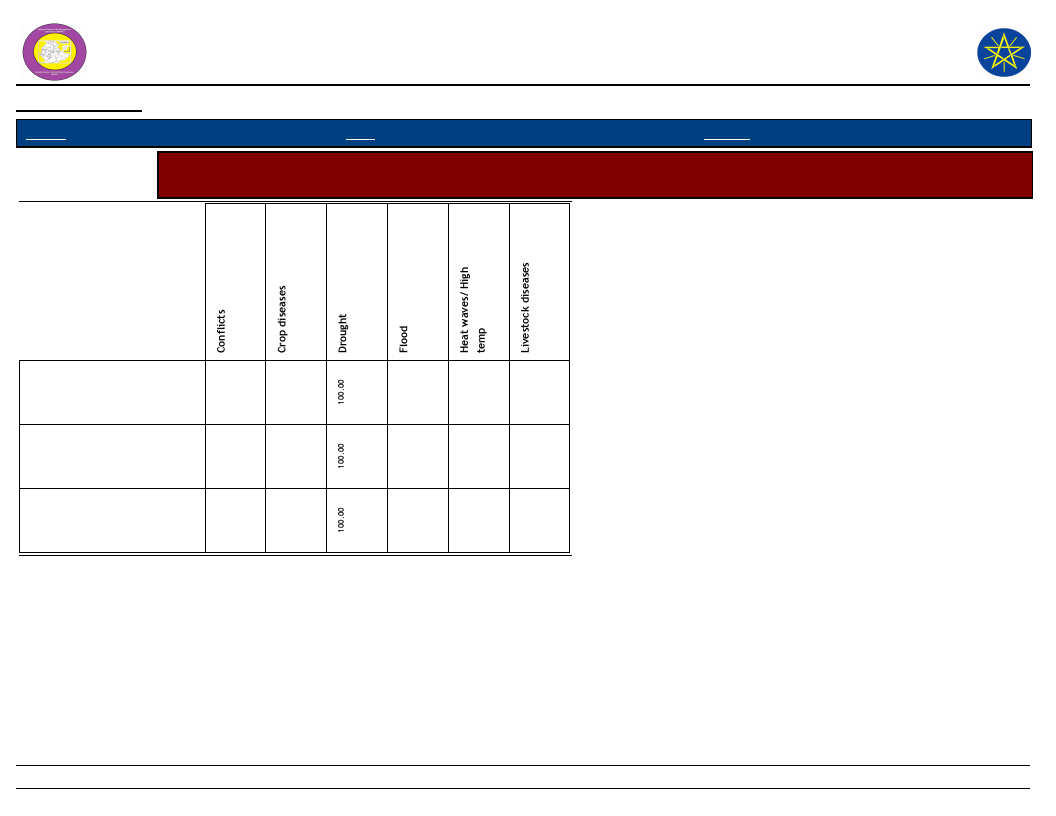
Wereda Disaster Risk
Profile
National Disaster Risk Management
Commission (NDRMC)
Data_Collected_Date
Region S.N.N.P
Zone
SOUTH OMO
Wereda NYANGATOM
Friday, July 12, 2019
Selected Indicator
Capacity: Coping Strategies Adopted by Households - Secondary coping strategies adopted by households for
respective disasters
Sending children of
household for work
Short-term / seasonal labor
migration
Skip entire day without
eating
219
Page 3 of 3
WDRP Indicators
Community
Perceptions and Suggestions
220

Wereda Disaster
Risk Profile
Data_Collected_Date
National Disaster Risk Management
Commission (NDRMC)
Friday, July 12, 2019
Region S.N.N.P
Zone
SOUTH OMO
Wereda NYANGATOM
Selected Indicator
Kebele Name
Interventions: Community Perception on Mediums to Influence DRM Actors - Community perception on the
effectiveness of institutional channels to use to influence DRM actors
Institution_1
Process_Description
Institution_2 Process_Description
Institution_3
Process_Description
AYEPA
KAJAMAKEN
KEBELE 01
KOPEREYA
Agriculture
extension
Kebele
administrator
office
Reporting any
question to
extension workers
and governmental
office
Reporting any
disaster occurrence
in order to transfer
our issue to the
wereda
administration
Wereda
administration
To facilitate works
for kebele
Kebele extension
workers
Reporting any
question to
extension workers
and transfer to
wereda
Government 1
to 5 structure
For those structure
the community raised
question reporting in
to responsible office
Kebele health
extension
workers
Reporting any disease
occur and trying to
get drug and
treatment service
Wereda early
warning
committee
Kebele 1 to 5
and village
team
To conduct
monitoring and
evaluation
Through kebele
community discussion
and kebele
Kebele
community
livestock
health worker
NGOs
Displaying animals
disease occurrence for
CHAW and reporting
our the ereda
livetsockand fishery
development reporting
over the wereda
livestock and fishery
development office
To help in conducting
some works
221
Page 1 of 5

Wereda Disaster
Risk Profile
Data_Collected_Date
National Disaster Risk Management
Commission (NDRMC)
Friday, July 12, 2019
Region S.N.N.P
Zone
SOUTH OMO
Wereda NYANGATOM
Selected Indicator
Interventions: Community Perception on Mediums to Influence DRM Actors - Community perception on the
effectiveness of institutional channels to use to influence DRM actors
Kebele Name
KUCHURU
LOKAMEGNAN
LOKORLEM
LOPAKOR
Institution_1
Extension workers
Kebele
administration
Kebele clan
leaders
Process_Description
Any question raised
from the kebele
member they
reporting in to
government offices
Expressing and
display any disaster
occurrence to
reporting for wereda
decision makers or
to solve themselves
Reporting any
disaster occurrence
in order to resolve it
Agricultural
extension
The government
extend new
technologies troughs
the structural
organization
Institution_2
1 to 5
government
structure
Process_Description
Any question raised
form the kebele
Institution_3
Kebele cabin
Report any social
issue in the
community for
discussion and
resolving it
Kebele
management
bodies
1 to 5
organization
Informing for kebele
chair man and
manager to request to
wereda
administration and
other management
class when conflict is
occurred
The department
structure to
pastoralist
Process_Description
222
Page 2 of 5

Wereda Disaster
Risk Profile
Data_Collected_Date
National Disaster Risk Management
Commission (NDRMC)
Friday, July 12, 2019
Region S.N.N.P
Zone
SOUTH OMO
Wereda NYANGATOM
Selected Indicator
Kebele Name
Interventions: Community Perception on Mediums to Influence DRM Actors - Community perception on the
effectiveness of institutional channels to use to influence DRM actors
Institution_1
Process_Description
Institution_2 Process_Description
Institution_3
Process_Description
LORENKACHAWE
LOTOMEN
NAPATOKOYET
NAROGOY
Kebele extension
workers
Kebele
management
bodies
Kebele
administration
Kebele
management
bodies
Report to kebele
then to wereda
decision makers
Trying to push these
bodies to transfer
our problems for
wereda
administration
Responsible to
transfer our
suggestion and
question to the
wereda decision
makeres to resolve
any problems and
disaster in the
kebele
Making kebele
meeting to identify
problems with in the
community and
reflecting ideas for
wereda management
offices
1 to 5
structure
Report to kebele then
to wereda decision
makers
Kebele
government
staff
representative
s
Give response as
much as they do and
trying to pass to their
upper implementer
and management
bodies
223
Page 3 of 5
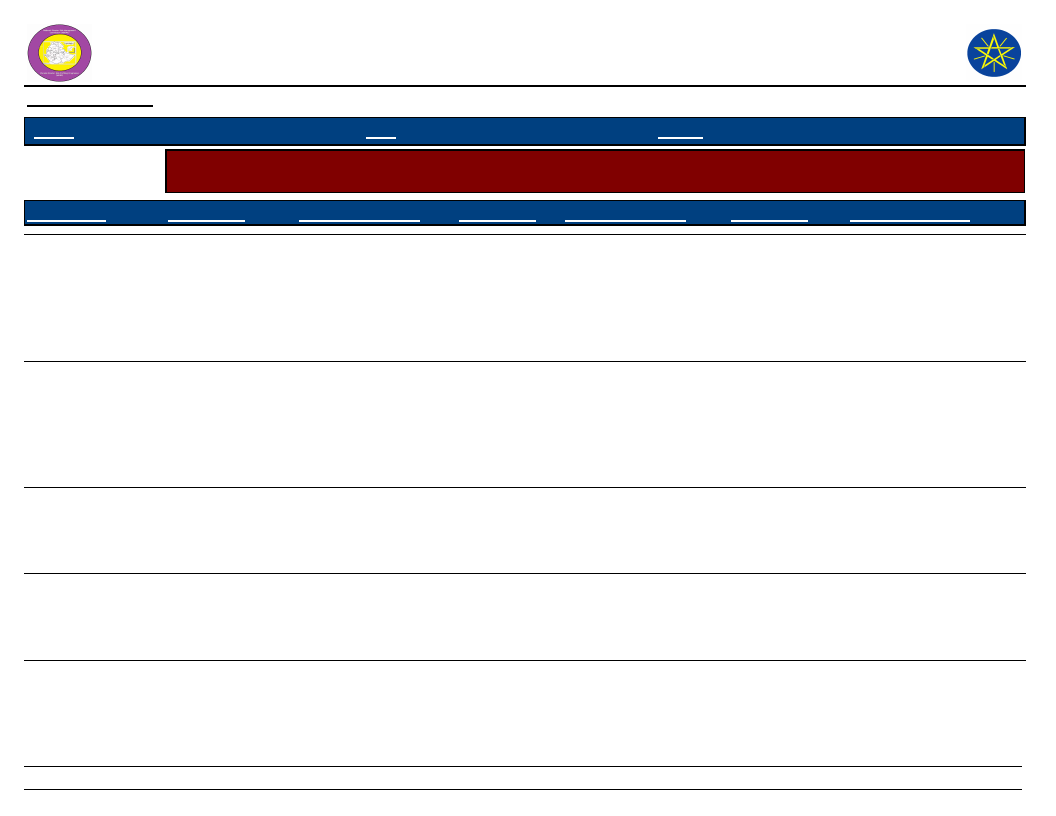
Wereda Disaster
Risk Profile
Data_Collected_Date
National Disaster Risk Management
Commission (NDRMC)
Friday, July 12, 2019
Region S.N.N.P
Zone
SOUTH OMO
Wereda NYANGATOM
Selected Indicator
Kebele Name
Interventions: Community Perception on Mediums to Influence DRM Actors - Community perception on the
effectiveness of institutional channels to use to influence DRM actors
Institution_1
Process_Description
Institution_2 Process_Description
Institution_3
Process_Description
NATEKER
NAWEYAPE
SHENKORA
TERGA
Kebele
administration
Kebele
administration
1 to 5 structure
Agricultural
extension
Reporting any
disaster occurrence
in order to transfer
our issue to the
wereda
administration
Report any disaster
occurrence in order
to transfer our issue
to the wereda
administration
Discussing 1 to 5
structure then
report to other
responsible office
Community
reporting to
extension worker
and then to wereda
Kebele health
extension
workers
Reporting any disease
occurrence and trying
to get drug and
treatment service
Kebele health
extension
worker
Reporting any disease
occurrence and trying
to get drug and
treatment service
Agricultural
extension
To extend the new
technologies of
agriculture
Kebele
community ,
livestock
health worker
Kebele
community
health worker
Displaying livestock
disease occurrence and
reporting over to the
wereda livestock and
fishery development
office
Displaying livestock
disease occurrence for
CHAWS and reporting
over to the wereda
livestock and fishery
development office
1 to 5
structure
Community reporting
to wereda decision
makers
224
Page 4 of 5

Wereda Disaster
Risk Profile
Data_Collected_Date
National Disaster Risk Management
Commission (NDRMC)
Friday, July 12, 2019
Region S.N.N.P
Zone
SOUTH OMO
Wereda NYANGATOM
Selected Indicator
Interventions: Community Perception on Mediums to Influence DRM Actors - Community perception on the
effectiveness of institutional channels to use to influence DRM actors
Kebele Name
KOWTEM
LEBERE
NAKARMAN
NAPUSUMERYA
Institution_1
Kebele
administration
Kebele
administration
Agriculture and
health extension
Kebele extension
workers
Process_Description
Reporting any
disaster occurrence
on order to transfer
our issue to the
wereda
administration
Expressing and
display an disaster
occurrence to
reporting for wereda
discussion makers or
to solve themselves
if they do
Reporting to
extension workers
Reporting to
extension workers
and they transfer to
wereda decision
makers
Institution_2
Kebele health
extension
worker
Process_Description
Reporting any disease
occurrence and trying
to get drug and
treatment service
Kebele cabin
Social issue in the
community for
discussion and
resolving it
Developmental
agent
1 to 5
Discuses type of
problems then report
to responsible office
to solve the problem
Through kebele
community decision
and kebele field days
Institution_3
Kebele
community
livestock
health worker
Process_Description
225
Page 5 of 5
Data_Collected_Date
Region S.N.N.P
Zone
SOUTH OMO
Friday, July 12, 2019
Wereda NYANGATOM
Selected Indicator
Interventions: Community Perception on their Knowledge used in DRM Process -
Perception of the community on how their knowledge influences the priorities
and measures of DRM actors
KebeleName
Community_Suggestions
AYEPA
It can influence the priorities and measure taken by the authorities
KAJAMAKEN
KEBELE 01
KOPEREYA
KUCHURU
LOKAMEGNAN
LOKORLEM
LOPAKOR
LORENKACHAWE
LOTOMEN
NAPATOKOYET
NAROGOY
Influence on the management institution to take any measure during disaster
occurrence
If influence well because unless information gathered from community is vital,
nothing can be achieved
Yes, the institution are knowledge influence the priorities any measure taken by
the authorities and other risk management institution
Yes suggestion and knowledge influence the priorities and measures taken by the
authorities and other risk management institution
Our influence on such institution to take any measurement during disaster
occurrence but we did not get enough response as much as we need
We are dissertation from the previous disaster occurrence and unable to get
response we did not think that our suggestion is influential
Suggestion and knowledge influence the priorities and measure taken by the
authorities and other risk management
Yes, suggestion and knowledge influence the priorities and measures taken by the
authorities and other risk management institution
Trying to push management institution to resolve our problems before but we did
not get rapid response so we did not hope that further to get rapid response due to
our suggestion
Our suggestion are influential for those management institution, but most of the
time we are not influencing for them
NATEKER
NAWEYAPE
Influence on the management institutional to take nay measure during disaster
occurrence but still we did not get an enough response, so our suggestion will
influence on those management institution further
Influence on the management institution to take any measure during disaster
SHENKORA
Influence the priorities and measure taken by the authorities other risk
management
226
Page 1 of 2
Data_Collected_Date
Region S.N.N.P
Zone
SOUTH OMO
Friday, July 12, 2019
Wereda NYANGATOM
Selected Indicator
Interventions: Community Perception on their Knowledge used in DRM Process -
Perception of the community on how their knowledge influences the priorities
and measures of DRM actors
KebeleName
Community_Suggestions
TERGA
KOWTEM
LEBERE
Our suggestion and knowledge influence the priorities and measure teach by the
authorizes and other risk management institution
Influence on the management institution to take any measure during disaster
occurrence
Influence on such institutions to take any measurement during disaster occurrence
NAKARMAN
NAPUSUMERYA
Influence priorities and measures that are taken by the authorities and other risk
management
Trying to influence on management institution to resolve such disaster risk but we
did not get any benefit rather than relief
227
Page 2 of 2
Wereda Disaster Risk
Profile
National Disaster Risk Management
Commission (NDRMC)
Data_Collected_Date
Region S.N.N.P
Zone SOUTH OMO
Wereda NYANGATOM
Friday, July 12, 2019
Selected Indicator
Interventions: Suggestions to DRM Actors in the Area - Community suggested measures to DRM actors in the area
for effective DRM actions
Kebele Name
AYEPA
Measure 1
Supplying human
and livestock drugs
KAJAMAKEN
KEBELE 01
Settling security
forecast on the
border where
frequent conflict is
occurred
Support the
community by food
KOPEREYA
KUCHURU
Providing human
and livestock drug
Providing irrigation
pump
Comment 1
Occurrence of
human and
animals disease
The suffrage from
conflict on the
border area
human life loss
Measure 2
Supplying irrigation
pump
Construct water
delivery points around
the kebele resident
It is vital
especially for
women, children
and elders
No supply drugs
Effective CMDRR
training for community
Providing pure drink
water access
We have accessed
of irrigational not
have no potential
to buy irrigation
Providing pure drinking
water
Comment 2
We have scarcities
of pump
Water shortage is
the other main
problem for
livestock death
and conflict
For preparedness
Measure 3
Providing pure
drinking water
tank
Mentoring and
evaluation for
kebele
Comment 3
We have low
supply of pure
tracking water
It is used for
early warning
system
We have scarcity
of water for human
and livestock
We time drinking
polluted water
from the Omo river
Supplying
agriculture input
We have health
to work irrigation
not have no
enough
agriculture input
so we want to
these material
228
Page 1 of 4

Wereda Disaster Risk
Profile
National Disaster Risk Management
Commission (NDRMC)
Data_Collected_Date
Region S.N.N.P
Zone SOUTH OMO
Wereda NYANGATOM
Friday, July 12, 2019
Selected Indicator
Interventions: Suggestions to DRM Actors in the Area - Community suggested measures to DRM actors in the area
for effective DRM actions
Kebele Name
LOKAMEGNAN
Measure 1
Construct extra
more water and
water harvesting
structures in the
kebele
LOKORLEM
Settling security
force on the border
of our community
and Turkana
LOPAKOR
LORENKACHAW
E
Providing human
and livestock drug
Providing pure
drinking water
LOTOMEN
Create peace
making conference
between kebele
resident and
Turkana tribs
Comment 1
Since drought and
water shortage
are the main
reason of the
kebele
Measure 2
Creating peace making
conference among the
border sharing tribes at
the tow countries
Since there is a
frequent conflict
on border areas
cause human
death and
livestock stolen
There is high
level of scarcity
Constructing water
delivery points
Providing pure drinking
water
Providing human and
livestock drug
Suffer from
conflict
occurrence early
dry season of the
year
Providing settlement
for kebele community
around feed and water
availability are
Comment 2
Frequent conflict
Because of water
shortage is the
main cause for
conflict and animal
death
Measure 3
Constructing
livestock and
human health
center
Constructing
animal health
post and fulfilling
animal health
service
Comment 3
Livestock disease
cause massive
animals death
and human
disease face the
community for
extravagant
Animal disease
occurrence is
frequent and
cause massive
lost of cattle
Supply drug and
treatment
Conflict comes
form shortage of
water and pasture
Providing modern
irrigation tools
Construct water
points around to
the kebele
We have access
of irrigation but
not potential
Reduce conflict
impact for search
of water
229
Page 2 of 4
Wereda Disaster Risk
Profile
National Disaster Risk Management
Commission (NDRMC)
Data_Collected_Date
Region S.N.N.P
Zone SOUTH OMO
Wereda NYANGATOM
Friday, July 12, 2019
Selected Indicator
Interventions: Suggestions to DRM Actors in the Area - Community suggested measures to DRM actors in the area
for effective DRM actions
Kebele Name
NAPATOKOYET
Measure 1
Supplying irrigation
pump
NAROGOY
Supplying human
and livestock drugs
and regular
vaccination service
Comment 1
Having fertile and
good structure
irrigation land
near to river Omo
The frequent
occurrence of
human and
livestock disaster
Measure 2
Creating peace
Give priority and
special support for
disabled community
members
NATEKER
NAWEYAPE
SHENKORA
Settling security
force on the border
where frequent
conflict is occurred
Settling security
force on the border
where frequent
conflict is occurred
Supplying human
and livestock drug
To control loss of
human life
Construct water
delivery points around
the kebele
Loss of human
Constructing water
points
There is shortage
of drug
Supplying irrigation
pump
Comment 2
Suffering from
frequent conflict
with neighboring
weredas and tribes
They have no
income sources
and unable to work
to lead their life
Measure 3
Sustainable
delivery of pure
drinking water
Supplying enough
irrigation pump
To prevent
shortage of water
Comment 3
Seasonal water
pollution on river
Omo
Availability of
fertile irrigation
land and
shortage of
motor pump
Water shortage is
cause of death of
livestock and
conflict
Have no capacity
to buy irrigation
pump
Providing pure
drinking water
There is no pure
and suitable
water for
drinking
230
Page 3 of 4
Wereda Disaster Risk
Profile
National Disaster Risk Management
Commission (NDRMC)
Data_Collected_Date
Region S.N.N.P
Zone SOUTH OMO
Wereda NYANGATOM
Friday, July 12, 2019
Selected Indicator
Interventions: Suggestions to DRM Actors in the Area - Community suggested measures to DRM actors in the area
for effective DRM actions
Kebele Name
TERGA
Measure 1
Providing pure
drinking water
Comment 1
There is scarcity
of drinking water
Measure 2
Provide human and
livestock drugs
KOWTEM
LEBERE
Settling security
forces on the border
where frequent
conflict is occurred
Construct extra
more water point
and water
harvesting structure
NAKARMAN
NAPUSUMERYA
Supplying of
irrigation pump
Supply pure drinking
water
To control loss of
human
Drought and
water shortage
are the main
reason to face
migration and
conflict
Increasing
productivity
There is high
water shortage
for drinking
Construct water points
Creating peace making
conference among the
border sharing tribs of
the two communities
Providing Pure drinking
water
Supplying human and
livestock health service
Comment 2
There is good
construction but
no service
To control the
problem shortage
of water
Measure 3
Providing
agricultural
input/tools
Frequent conflict
with border
sharing leads to
sever human death
and livestock
Constructing
animal and
livestock health
center
To get drinking
water
Frequent
occurrence of
animal and human
disease
Providing farm
mechanism
Irrigation pump
and farm tools
Comment 3
There is fertile
soil
Livestock
diseases cause a
massive livestock
death and human
disease face
Increasing
productivity
Good access of
irrigation land
and water
231
Page 4 of 4

Wereda Disaster Risk
Profile
National Disaster Risk Management
Commission (NDRMC)
Data_Collected_Date
Region S.N.N.P
Zone SOUTH OMO
Wereda NYANGATOM
Friday, July 12, 2019
Selected Indicator
Economic Vulnerability: Community Suggestions to Improve Economic Situation - Community suggested measures
to improve the economic situation of the area
KebeleName
Measure 1
Comment 1
Measure 2
Comment 2
Measure 3 Comment 3
AYEPA
KAJAMAKEN
KEBELE 01
KOPEREYA
KUCHURU
LOKAMEGNAN
LOKORLEM
Improve livestock
breading to more
adaptive
Settling security force
on the border of the
kebele to resolve
conflict impacts
Intensive farming
system
Changing farming
system
Channing farming
system
Constructing water
harvesting structure
Shortage of feed
Intermediation
To increase livestock
production
Creating peace with two
tribes of Ethiopia and
Kenya
Conflict is the main cause
of migration
Improve pasture
land by keeping
area closure
Constructing water
points on the
kebele
Shortage of
pasture among the
area
Shortage of water
is the main cause
of human death
Abolition the
foreign tree
The tree
destroy every
grass
Establish market
linkage
To increase
livelihood
Agro
pastoralist
To increase
livelihood
Making peace
conference and
resolving conflict
problems
permanently
Constructing water
harvesting
structure
To decreased
shortage of water
Construct
human and
livestock
health serivce
Supply water
purification
service
There is
water born
disease
232
Page 1 of 4
Wereda Disaster Risk
Profile
National Disaster Risk Management
Commission (NDRMC)
Data_Collected_Date
Region S.N.N.P
Zone SOUTH OMO
Wereda NYANGATOM
Friday, July 12, 2019
Selected Indicator
Economic Vulnerability: Community Suggestions to Improve Economic Situation - Community suggested measures
to improve the economic situation of the area
KebeleName
LOPAKOR
Measure 1
Providing pure drinking
water
Comment 1
Shortage of drinking
water
Measure 2
Resource
development and
livestock health
service
Comment 2
Continuous
drought and
shortage of
pasture
Measure 3 Comment 3
LORENKACHAWE
Provision of pure
drinking water
Shortage of drinking
water
Food resource
development
LOTOMEN
Construct livestock
health posts and health
delivery for human and
livestock
To resolve livestock
disease impact
Construct water
harvesting
structure and water
delivery service
To resolve conflict
problems
NAPATOKOYET
Creating peace making
conference among
border sharing weredas
Frequent conflict with
border weredas
Practicing small
scale irrigation for
crop production as
well as feed
Loss of crops and
shortage of
pasture with
drought
Focuses on
animal quality
not on
quantity
Poor access
of livestock
health
service and
feed
shortage,
reduce
number of
livestock
NAROGOY
Focus on pasture
production
Continuous feed shortage
leads to animal loss
Improve livestock
beads to more
adaptive species
Improve
alternative
income
generating
233
Page 2 of 4

Wereda Disaster Risk
Profile
National Disaster Risk Management
Commission (NDRMC)
Data_Collected_Date
Region S.N.N.P
Zone SOUTH OMO
Wereda NYANGATOM
Friday, July 12, 2019
Selected Indicator
Economic Vulnerability: Community Suggestions to Improve Economic Situation - Community suggested measures
to improve the economic situation of the area
KebeleName
Measure 1
Comment 1
Measure 2
Comment 2
Measure 3 Comment 3
NATEKER
NAWEYAPE
SHENKORA
TERGA
KOWTEM
LEBERE
NAKARMAN
Settling security forces
on the border of the
kebele
Security forces on the
border of the kebele
resolve conflict impact
Improved livestock
variety
Changing farming
system
Settling security force
on the border on the
kebele
Construction water
harvesting structure in
the kebele
To make peace
conference
To get high production
and productivity
To improve productivity
Constructing water
points on the
kebele
Constructing water
points
Improved pasture
land by keeping
area closure
To prevent
shortage of water
To control water
shortage and
death of livestock
Abolition the
foreign tree
around the
kebele
Abolition the
foreign tree
The tree
destroy every
grass species
The tree
destroy every
grass species
To make peace
Constructing of
water point
To control
shortage of water
Abolition the
foreign tree
It destroys
every grass
Frequent drought and
water shortage leads then
for conflict
Making peace
conference and
resolving their
conflict
They lost their life
with conflict
Construct
human and
livestock
health
institution
Frequent
occurrence of
human and
livestock
disease
234
Page 3 of 4

Wereda Disaster Risk
Profile
National Disaster Risk Management
Commission (NDRMC)
Data_Collected_Date
Region S.N.N.P
Zone SOUTH OMO
Wereda NYANGATOM
Friday, July 12, 2019
Selected Indicator
Economic Vulnerability: Community Suggestions to Improve Economic Situation - Community suggested measures
to improve the economic situation of the area
KebeleName
Measure 1
Comment 1
Measure 2
Comment 2
Measure 3 Comment 3
NAPUSUMERYA
Provision of pure
drinking water
Shortage of drinking
water cause social
problem
Feed resource
development and
livestock health
service
Continuous
drought and
shortage of food
235
Page 4 of 4

Wereda Disaster
Risk Profile
Data_Collected_Date
Region S.N.N.P
Zone SOUTH OMO
Selected Indicator
Community Awareness of Disaster Risk Management System and Actors
Kebele Name
AYEPA
Institution 1
Responsibility
Activity
Agriculture office
Improving agriculture portative, improve productive livestock
Introducing new technologies, supply new variety
Institution 2
Responsibility
Activity
Healthy office
Improving the health preparedness
Supplying drugs
Institution 3
Responsibility
Activity
Kebele Name
KAJAMAKEN
Institution 1
Responsibility
Activity
Agricultural office
Increasing agricultural productivity
Supply improved seed and extension service
Institution 2
Responsibility
Activity
Disaster risk management and food security sector
Early warning and rapid response system
Rapid response
Institution 3
Responsibility
Activity
Water and irrigation office
Improve drinking water accessibility
Supply pure drinking water
National Disaster Risk
Management Comission (NDRMC)
Friday, July 12, 2019
Wereda NYANGATOM
236
Page 1 of 10

Wereda Disaster
Risk Profile
Data_Collected_Date
Region S.N.N.P
Zone SOUTH OMO
Selected Indicator
Community Awareness of Disaster Risk Management System and Actors
Kebele Name
KEBELE 01
Institution 1
Responsibility
Activity
Disaster risk management
To manage disaster
Institution 2
Responsibility
Activity
Wereda administration
To manage disaster
Institution 3
Responsibility
NGOs
To help communities
Activity
Kebele Name
KOPEREYA
Institution 1
Responsibility
Activity
Agriculture office
Increasing agriculture production
Providing extension service
Institution 2
Responsibility
Activity
Disaster risk management
Creating early warning
Forecasting disaster occurrence
Institution 3
Responsibility
Activity
Livestock and fishery
Increasing productive livestock
Provision of drug and well as vaccination
National Disaster Risk
Management Comission (NDRMC)
Friday, July 12, 2019
Wereda NYANGATOM
237
Page 2 of 10

Wereda Disaster
Risk Profile
Data_Collected_Date
Region S.N.N.P
Zone SOUTH OMO
Selected Indicator
Community Awareness of Disaster Risk Management System and Actors
Kebele Name
KOWTEM
Institution 1
Responsibility
Activity
Agriculture and natural resource office
Increasing agricultural production
Deliver improved seed and extension, provide modern farming system
Institution 2
Responsibility
Activity
Disaster risk management
Create early warning and repaid response
Forecasting disaster occurrence
Institution 3
Responsibility
Activity
Kebele Name
Water, mineral and irrigation
Improve pure drinking water
Delivery pure drinking water
KUCHURU
Institution 1
Responsibility
Activity
Agriculture office
Increased productivity
Introducing new variety of crop
Institution 2
Responsibility
Activity
Livestock and fishery
Increasing productive of livestock
Provision of drug and treatment
Institution 3
Responsibility
Activity
Disaster risk management
Create early warning and response
Forecasting the disaster
National Disaster Risk
Management Comission (NDRMC)
Friday, July 12, 2019
Wereda NYANGATOM
238
Page 3 of 10

Wereda Disaster
Risk Profile
Data_Collected_Date
National Disaster Risk
Management Comission (NDRMC)
Friday, July 12, 2019
Region S.N.N.P
Zone SOUTH OMO
Selected Indicator
Community Awareness of Disaster Risk Management System and Actors
Kebele Name
LEBERE
Institution 1
Responsibility
Activity
Agriculture and natural resource office
Increasing agricultural productivity
providing extension service and improved technologies introduce modern farming system
Institution 2
Responsibility
Activity
Disaster risk management office
Crate early warning and rapid responding system
Forecasting disaster occurrence and giving rapid, response for whom in sudden shock
Institution 3
Responsibility
Activity
Kebele Name
Water, mineral and irrigation office
Improve pure drinking water accessibility
Deliver pure drinking water, introduce modern irrigation tools and system
LOKAMEGNAN
Institution 1
Responsibility
Activity
Agricultural development office
Increasing agricultural productivity
Providing extension service and improved technique, introduce farming system
Institution 2
Responsibility
Activity
Disaster risk management
Create early warning and rapid response system
Forecast disaster occurrence and early response
Institution 3
Responsibility
Activity
Water and irrigation office
Improve pure water accessibility
Introduce modern irrigation tools and system, supply drinking water
Wereda NYANGATOM
239
Page 4 of 10

Wereda Disaster
Risk Profile
Data_Collected_Date
Region S.N.N.P
Zone SOUTH OMO
Selected Indicator
Community Awareness of Disaster Risk Management System and Actors
Kebele Name
LOKORLEM
Institution 1
Responsibility
Activity
Agriculture office
Increasing agricultural productivity
Provide extension service and improve technologies
Institution 2
Responsibility
Activity
Disaster risk management
Early warning and response
Forecast and give rapid response
Institution 3
Responsibility
Activity
Kebele Name
Water and irrigation
Improve drinking water accessibility
Supply drinking water and modern irrigation system
LOPAKOR
Institution 1
Responsibility
Activity
Agriculture and natural resource office
Increasing agricultural production
Providing extension service to pastoralist
Institution 2
Responsibility
Activity
Disaster risk management
Early warning and response
Institution 3
Responsibility
Livestock and fishery
Improve production and and take care of livestock
Activity
National Disaster Risk
Management Comission (NDRMC)
Friday, July 12, 2019
Wereda NYANGATOM
240
Page 5 of 10

Wereda Disaster
Risk Profile
Data_Collected_Date
Region S.N.N.P
Zone SOUTH OMO
Selected Indicator
Community Awareness of Disaster Risk Management System and Actors
Kebele Name
LORENKACHAWE
Institution 1
Responsibility
Activity
Agriculture and natural resource office
Increasing agricultural production
Providing extension service
Institution 2
Responsibility
Activity
Disaster risk management office
Create early warning and rapid response
For cast the disaster occurrence time
Institution 3
Responsibility
Activity
Kebele Name
Livestock and fishery
Improved production and health care of livestock
Medical treatment live vaccination
LOTOMEN
Institution 1
Responsibility
Activity
Agriculture and natural resource office
Improve agricultural productivity
Provide extension service,
Institution 2
Responsibility
Activity
Disaster risk management office
Create early warning and rapid response system
Forecast disaster occurrence and give rapid response
Institution 3
Responsibility
Activity
Water, mining and irrigation office
Improve drinking water accessibility
Delivering drinking water and modern irrigation tools
National Disaster Risk
Management Comission (NDRMC)
Friday, July 12, 2019
Wereda NYANGATOM
241
Page 6 of 10
Wereda Disaster
Risk Profile
Data_Collected_Date
National Disaster Risk
Management Comission (NDRMC)
Friday, July 12, 2019
Region S.N.N.P
Zone SOUTH OMO
Selected Indicator
Community Awareness of Disaster Risk Management System and Actors
Kebele Name
NAKARMAN
Wereda
Institution 1
Responsibility
Activity
Agricultural and natural resource office
Increasing productivity
Provide new technologies
Institution 2
Responsibility
Activity
Livestock and fishery
Increasing productivity
To improve livestock production
Institution 3
Responsibility
Activity
Kebele Name
Health office
Protect health performance
Supplying vaccination and treatment
NAPATOKOYET
Institution 1
Responsibility
Activity
Agricultural and natural resource office
Increase agricultural productivity
Providing extension service and improved technology, introducing modern farming system and farm tools
Institution 2
Responsibility
Activity
Disaster risk management office
Create early warning and rapid response system
Forcast disaster occurrence, giving response for communities facing disaster
Institution 3
Responsibility
Activity
Livestock and fishery
Improve production and health care system for livestock
Introduce improved animal bread and pasture source
NYANGATOM
242
Page 7 of 10

Wereda Disaster
Risk Profile
Data_Collected_Date
National Disaster Risk
Management Comission (NDRMC)
Friday, July 12, 2019
Region S.N.N.P
Zone SOUTH OMO
Selected Indicator
Community Awareness of Disaster Risk Management System and Actors
Kebele Name
NAPUSUMERYA
Wereda
Institution 1
Responsibility
Activity
Agriculture and natural resource office
Increasing agricultural productivity
Providing extension service and improving technologies introducing modern farming system
Institution 2
Responsibility
Activity
Disaster risk management office
Create early warning and rapid response system
Forecast disaster and give response
Institution 3
Responsibility
Activity
Kebele Name
Livestock and fishery
Improve production and health care system of livestock
Vaccination, improve pasture availability
NAROGOY
Institution 1
Responsibility
Activity
Agriculture and natural resource office
Increasing production and productivity
Providing new extension and technologies, providing improved farm tools and varieties, extension service
Institution 2
Responsibility
Activity
Disaster risk management
Early warning and supporting house hold having food security problems
Forecast disaster occurrence and threats and give preparedness and prevention measures
Institution 3
Responsibility
Activity
Water, mining and irrigation office
Extending modern irrigation system tools
Provide water harvesting tools and deliver pure drinking water
NYANGATOM
243
Page 8 of 10

Wereda Disaster
Risk Profile
Data_Collected_Date
National Disaster Risk
Management Comission (NDRMC)
Friday, July 12, 2019
Region S.N.N.P
Zone SOUTH OMO
Selected Indicator
Community Awareness of Disaster Risk Management System and Actors
Kebele Name
NATEKER
Institution 1
Responsibility
Activity
Agriculture and natural resource office
Increasing agricultural productivity
deliver improved seed and extension service, provide modern farming system and tools
Institution 2
Responsibility
Activity
Disaster risk management office
Create early warning and rapid response system
Forecast disaster occurrence and give rapid response
Institution 3
Responsibility
Activity
Kebele Name
Water, mineral, energy and irrigation office
Improve pure drinking water accessibility and modern irrigation system
Deliver pure drinking water, provide modern irrigation pump and tools
NAWEYAPE
Institution 1
Responsibility
Activity
Agriculture and natural resource
Increasing agricultural productivity
Providing improved agricultural inputs and extension service
Institution 2
Responsibility
Activity
Disaster risk management
Create early warning, rapid response system
Forecast disaster occurrence and give rapid response
Institution 3
Responsibility
Activity
Water, mineral and irrigation office
Improved pure dinking water accessibility, modern irrigation system
Deliver pure drinking water
Wereda NYANGATOM
244
Page 9 of 10

Wereda Disaster
Risk Profile
Data_Collected_Date
Region S.N.N.P
Zone SOUTH OMO
Selected Indicator
Community Awareness of Disaster Risk Management System and Actors
Kebele Name
SHENKORA
Institution 1
Responsibility
Activity
Agriculture and natural resource office
Improving agricultural production
Introducing new technologies
Institution 2
Responsibility
Activity
Livestock and fishery
Improving productive of livestock
Improving new variety of livestock
Institution 3
Responsibility
Activity
Kebele Name
Health office
Improving health preparedness
Supply drug and treatment
TERGA
Institution 1
Responsibility
Activity
Agricultural and natural resource office
Increasing productivity
Provision of extension service
Institution 2
Responsibility
Activity
Livestock and fishery
Increasing livestock production
Provision of drug and treatment
Institution 3
Responsibility
Activity
Disaster risk management
Creating early warning
Forecasting occurrence of disaster
National Disaster Risk
Management Comission (NDRMC)
Friday, July 12, 2019
Wereda NYANGATOM
245
Page 10 of 10
Wereda Disaster
Risk Profile
National Disaster Risk Management
Commission (NDRMC)
Data_Collected_Date
Friday, July 12, 2019
Region S.N.N.P
Zone SOUTH OMO
Wereda NYANGATOM
Selected Indicator
Community Perception of DRM System and Actors - Perception of the community on the effectiveness of DRM
system in helping them to prevent, cope and recover from disasters
KebeleName
Prevention
Coping
Recovery
Overall_Effectiveness
AYEPA
KAJAMAKEN
KEBELE 01
KOPEREYA
Not effective
All staffs are not effective to
prevent us from every
disaster we lost our cattle
with disease, we lost our
youngsters with conflict, we
lost our life with disease
Not accurate
Not effective
Not effective
We always migrate place to
place when disaster are
occurred
Since it is not accurate, the
effective will happen
Not effective
Not recover from
disaster
No recovery from
disasters because of poor
intervention of these
staffs during disaster
emergency
The organizational structure
less the staff to be weak
Poor intention to resource
our problems and to save us
is the main reason of the
staffs not be effective
Not accurate
Not effective
Poor understanding
KUCHURU
LOKAMEGNAN
LOKORLEM
Not effective
Not effective
Not effective
Not effective
Not effective
Not effective
We are faced every year
and not recover from the
disaster
Not effective
Not effective
Poor understanding
Unable to understanding our
problems as much as we
face s the main reason of
these staffs to be unable to
intervene
Shortage of resource,
minimizing human resource
in such staffs
246
Page 1 of 3

Wereda Disaster
Risk Profile
National Disaster Risk Management
Commission (NDRMC)
Data_Collected_Date
Friday, July 12, 2019
Region S.N.N.P
Zone SOUTH OMO
Wereda NYANGATOM
Selected Indicator
Community Perception of DRM System and Actors - Perception of the community on the effectiveness of DRM
system in helping them to prevent, cope and recover from disasters
KebeleName
LOPAKOR
LORENKACHAWE
Prevention
Not effective
Not effective
Coping
Not effective
Not effective
Recovery
Their activities not help
to recover
Not effective
Overall_Effectiveness
Poor understanding
Poor understanding
LOTOMEN
NAPATOKOYET
NAROGOY
NATEKER
NAWEYAPE
SHENKORA
Most of staffs are poor to
prevent us from any disaster
rather than trying to give
response after the incidence
Not effective
Not effective
Not effective
Not effective
Not effective
We are trying to cope every
disaster by ourselves and
we did not get any copping
option form such staff
Not effective
Not effective
Not effective
Not effective
Not effective
We are not recover from
every disaster due to
frequent occurrence and
lost of efforts
No recovering activities
performed rather than
small amounts of relief is
distributed
Not effective
No recovery from
disaster because of poor
intervention of those
staffs
No recovery from
disaster
Not effective
Unavailability of responsible
kebele management body to
interpreted our problems
for the wereda decision
makers is the main problem
Absence of continuous
assessment on disaster
occurrence
The organization structure
is leads those staff to be
ineffective
Poor intension to resolve
our problems
Poor intervention to resolve
our problems
Weakness of organizational
structure
247
Page 2 of 3

Wereda Disaster
Risk Profile
National Disaster Risk Management
Commission (NDRMC)
Data_Collected_Date
Friday, July 12, 2019
Region S.N.N.P
Zone SOUTH OMO
Wereda NYANGATOM
Selected Indicator
Community Perception of DRM System and Actors - Perception of the community on the effectiveness of DRM
system in helping them to prevent, cope and recover from disasters
KebeleName
Prevention
Coping
Recovery
Overall_Effectiveness
TERGA
KOWTEM
LEBERE
Not effective
Not effective
Not effective
NAKARMAN
NAPUSUMERYA
Not effective
Not effective
Not effective
Not effective
Not effective
Not effective
Not effective
There is activities but
have not effective help t
recover from disaster
No recovery because of
poor intervention
We are not recover from
drought animal disease
conflict and human
disease due to frequent
occurrence of each
disaster
Not effective
Not recover
Poor intention to resolve our
problem
Unable to understanding our
problems as much as we
face is the main reason of
those staffs to be unable to
intervene
Absence of organization
structure and professionals
Poor understanding
248
Page 3 of 3
Data_Collected_Date
Region S.N.N.P
Zone SOUTH OMO
Wereda NYANGATOM
Friday, July 12, 2019
Selected Indicator
Major Public Interventions Desired - Percentage of households by type of
intervention desired
Major public interventions desired by the community
Degree of Importance for the community
Access to markets
1st
2nd
3rd
0.25
0.25
1.34
Agricultural inputs (fertilizer, improved seeds, etc.)
0.51
1.26
4.01
Better job
4.55
2.78
8.56
Cash transfers/social assistance
0.00
23.74
3.21
Cash-for-work activities (not employment)
0.00
0.25
0.00
Enhance access to schools / School feeding for children
1.26
33.59
15.51
Food-for-work activities
4.29
2.53
2.14
Medical assistance / access to health facilities
0.00
1.01
1.60
Micro-credit programmes
0.25
0.51
0.27
Rental subsidies
0.25
0.00
0.00
Subsidized food
0.00
0.51
0.00
Subsidized health care
2.78
5.05
31.55
Supplementary feeding for women and young children
3.54
26.26
24.06
Veterinary facilities
0.51
0.00
2.14
249
Page 1 of 2

Data_Collected_Date
Region S.N.N.P
Zone SOUTH OMO
Wereda NYANGATOM
Friday, July 12, 2019
Selected Indicator
Major Public Interventions Desired - Percentage of households by type of
intervention desired
Major public interventions desired by the community
Degree of Importance for the community
Food aid
1st
2nd
3rd
81.82
2.27
5.61
250
Page 2 of 2
WDRP Indicators
Other Community Characteristics
251
Wereda Disaster
Risk Profile
Data_Collected_Date
National Disaster Risk Management
Commission (NDRMC)
Friday, July 12, 2019
Region S.N.N.P
Zone SOUTH OMO
Wereda NYANGATOM
Selected Indicator
Capacity: Community Based Organizations in the Wereda
Name_Of_Organization
Est._Year
Formal/Informal
Type of Members
Activity
Kebele Name AYEPA
Women association
2007
Formal
Youth
Kebele Name KUCHURU
Balutone Association
2009
Formal
Youth
Fish production
Ashuqa Association
2009
Formal
Youth
Fattening
Arizebo Association
2009
Formal
Youth
Small scale irrigation
Kebele Name LEBERE
Lebere Women saving and credit
association
Kebele Name LOKAMEGNAN
Saving and credit association
2009
2009
Formal
Formal
Women
Female
Saving and credit activities
Saving and credit activities
Kebele Name NAKARMAN
Saving and credit association
2006
Formal
Both
Saving and credit service
Kebele Name NAPATOKOYET
Women saving and credit
association
Youth association
2006
2006
Formal
Formal
Females
Youth
Saving and credit service
Small scale trading
Kebele Name NAPUSUMERYA
252
Page 1 of 2
Wereda Disaster
Risk Profile
Data_Collected_Date
Region S.N.N.P
Zone SOUTH OMO
Selected Indicator
Capacity: Community Based Organizations in the Wereda
Name_Of_Organization
Est._Year
Formal/Informal
Napusumariya women association
2005
Formal
Kebele Name NAROGOY
Norgoy youth association
2007
Formal
National Disaster Risk Management
Commission (NDRMC)
Friday, July 12, 2019
Wereda NYANGATOM
Type of Members
Women
Youth
Activity
Vegetable and fruit production with pump
irrigation
Small scale irrigation
253
Page 2 of 2
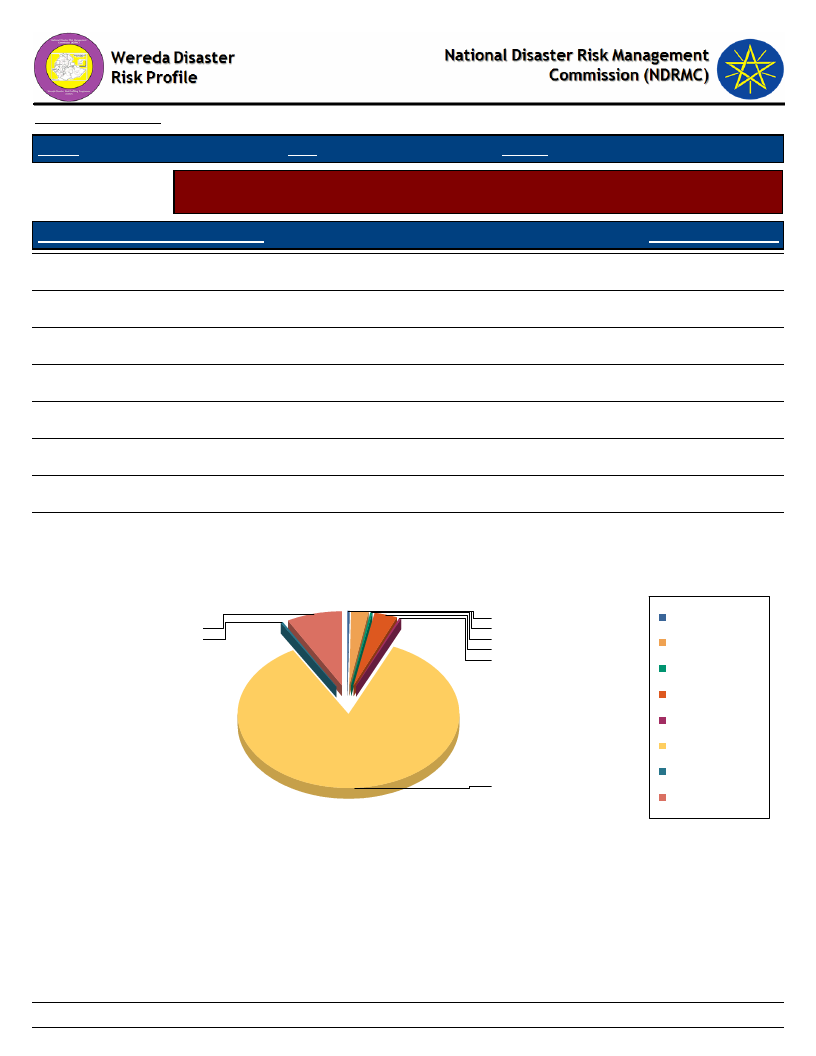
Data_Collected_Date
Region S.N.N.P
Zone SOUTH OMO
Wereda NYANGATOM
Friday, July 12, 2019
Selected Indicator
Supporting Agencies against Disasters - Percentage of households by supporting
institutions to handle or recover from disaster damages
Supporting Agencies Against Disasters
Response_Percentage
National or local authorities
85.10
International NGOs (e.g. UN organizations, ICRC, etc.)
3.28
Local NGOs
0.25
Family members in the same community
0.25
Friends and neighbors in the same community
0.25
Family members outside the community
2.53
Support via contacts working for the authorities
8.08
Support via contacts working for NGOs
0.25
Supporting Agencies Against Disasters
Family members in the
0.3
same community
8.1
2.5
0.3
0.3
Family members outside
3.3
the community
0.3
Friends and neighbors in
the same community
International NGOs (e.g.
UN organizations, ICRC,
etc.)
Local NGOs
85.1
National or local
authorities
Support via contacts
working for NGOs
Support via contacts
working for the
authorities
254
Page 1 of 1
Data_Collected_Date
Region S.N.N.P
Zone SOUTH OMO
Friday, July 12, 2019
Wereda NYANGATOM
Selected Indicator
Types of support received by households during disasters
Type of Support Provided By Supporting Agencies
Response_Percentage
Emergency aid (food, water, shelter, etc.)
97.96
Capital for re-construction of house and property
1.27
New house
0.25
Assets such as livestock replenishment
0.25
DK
0.25
Type of Support Provided By Supporting Agencies
0
0
1
0
Assets such as livestock
replenishment
Capital for
re-construction of house
and property
DK
Emergency aid (food,
water, shelter, etc.)
New house
98
255
Page 1 of 1

Wereda Disaster
Risk Profile
Data_Collected_Date
National Disaster Risk Management
Commission (NDRMC)
Friday, July 12, 2019
Region S.N.N.P
Zone SOUTH OMO
Wereda NYANGATOM
Selected Indicator
Government Actors in the Field of Disaster Risk Management - Government actors and their activities in the field
of Disaster Risk Managements
Government Institution
Wereda Administration Office
Activity
Description
Effective monitoring and evaluation
The office undertakes effective monitoring and evaluation for all kebeles regarding disaster risk reduction
Activity
Description
Leading all sectors of the wereda
The office manages all sectors found in the wereda
Activity
Description
Activity
Description
Budget allocation
Allocates budget for all sectors
Government Institution
Wereda Agriculture Office
Activity
Description
Collecting and dissemination of early warning information
Through provision of awareness to utilize adaptive crop and livestock species
Activity
Description
Provision of relief food and target
Targeting and distribution of relief foods to the affected community groups
Activity
Description
Activity
Description
256
Page 1 of 3

Wereda Disaster
Risk Profile
Data_Collected_Date
National Disaster Risk Management
Commission (NDRMC)
Friday, July 12, 2019
Region S.N.N.P
Zone SOUTH OMO
Wereda NYANGATOM
Selected Indicator
Government Actors in the Field of Disaster Risk Management - Government actors and their activities in the field
of Disaster Risk Managements
Government Institution
Wereda Disaster Preparedness and Prevention Office (DPPO)
Activity
Description
Early warning
Collecting and distribution of early warning information, provision of reliefs to affected population
Activity
Description
Asset building
Building of livelihood resilience of the affected community, through provision of credit access.
Activity
Description
Activity
Description
Protection of household and community asset
Through engaging the beneficiaries on public work and social/ community building social institutions
Government Institution
Wereda Health Office
Activity
Description
Prevention
Prevention of hazard before its happen and after happening
Activity
Description
Preparedness
Prepare emergency preparedness plan
Activity
Description
Activity
Description
Response
Undertake mitigation measure
257
Page 2 of 3
Wereda Disaster
Risk Profile
Data_Collected_Date
National Disaster Risk Management
Commission (NDRMC)
Friday, July 12, 2019
Region S.N.N.P
Zone SOUTH OMO
Wereda NYANGATOM
Selected Indicator
Government Actors in the Field of Disaster Risk Management - Government actors and their activities in the field
of Disaster Risk Managements
Government Institution
Wereda Water Resource Development Office
Activity
Description
Irrigation
Existing irrigation structures functionalize
Activity
Description
Water supply
Maintaining non functional water schemes, training of water users committee
Activity
Description
Activity
Description
Government Institution
Wereda Women and Children Office
Activity
Description
Activity
Targeting of vulnerable community groups
After targeting/ identifying these risky/ vulnerable groups among the community do and stakeholder to support them in capacity
building activities
Description
Activity
Description
Activity
Description
258
Page 3 of 3
Data_Collected_Date
Friday, July 12, 2019
Region S.N.N.P
Zone SOUTH OMO
Wereda NYANGATOM
Selected
Indicator
Non-Government Actors in the Field of Disaster Risk Management - Non-government
actors and their activities in the field of Disaster Risk Management
Non Governmental Actors
in the Wereda
Activities
Save the children
Emergency nutrition
AMREF (African Medical
and research Foundation)
Works on health, provision of medicine, CHD
Work in maternal health
Participate in emergency preparedness plan
ACTION FOR
DEVELOPMENT
Maintaining water schemes
Provision of vaccination and livestock medication, support and livestock
development gaps
Grazing land closure ( forage development)
AFD
To conduct CMDRR works in selected kebeles
Support livestock vaccination campaign, disseminating of veterinary tools
Works in livestock development, small scale irrigation
PCDP
Save The Children
Works infrastructures in selected kebeles
New water schemes construction
Children right and protection, provision of meal to under 5 children
Maintaining water schemes
VITA/RTI
conduct health related works
Seed provision, agricultural inputs
Development of small scale irrigation to diversify farming system of the
community
259
Page 1 of 1
Wereda Disaster Risk
Profile
Data_Collected_Date
National Disaster Risk Management
Commission (NDRMC)
July 12, 2019
Region S.N.N.P
Selected Indicator:
Zone
SOUTH OMO
Interventions: Community Suggestions to Development Actors
Wereda NYANGATOM
Kebele Name
Type Of Disaster 1
Early Warning Indicator
Preparedness Measure
Type Of Disaster 2
AYEPA
Conflict
Resource sharing
Drought
Type Of Disaster 3
Early Warning Indicator
Preparedness Measure
Type Of Disaster 4
Human disease
Medial treatment
Early Warning Indicator
Preparedness Measure
Migrate
Early Warning Indicator
Preparedness Measure
Kebele Name
Type Of Disaster 1
Early Warning Indicator
Preparedness Measure
Type Of Disaster 2
Early Warning Indicator
Preparedness Measure
KAJAMAKEN
Drought
Shortage of rain
Temporary migrate
Conflict
Prepared for fighting against
Type Of Disaster 3
Early Warning Indicator
Preparedness Measure
Type Of Disaster 4
Early Warning Indicator
Preparedness Measure
260
Page 1 of 10

Region S.N.N.P
Selected Indicator:
Zone
SOUTH OMO
Interventions: Community Suggestions to Development Actors
Wereda NYANGATOM
Kebele Name
Type Of Disaster 1
Early Warning Indicator
KEBELE 01
Drought
Reading goat intestine
Type Of Disaster 3
Early Warning Indicator
Conflict
Preparedness Measure
Type Of Disaster 2
Early Warning Indicator
Livestock disease
Reading goat intestine
Preparedness Measure
Type Of Disaster 4
Early Warning Indicator
Preparedness Measure
Preparedness Measure
Kebele Name
Type Of Disaster 1
Early Warning Indicator
Preparedness Measure
Type Of Disaster 2
Early Warning Indicator
Preparedness Measure
KOPEREYA
Drought
Reading animals intestine
Migration
Conflict
Reading animals intestine
Migration
Type Of Disaster 3
Early Warning Indicator
Preparedness Measure
Type Of Disaster 4
Early Warning Indicator
Preparedness Measure
Human disease
Traditional treatment
261
Page 2 of 10

Region S.N.N.P
Selected Indicator:
Kebele Name
Type Of Disaster 1
Zone
SOUTH OMO
Interventions: Community Suggestions to Development Actors
KUCHURU
Drought
Type Of Disaster 3
Wereda NYANGATOM
Early Warning Indicator
Early Warning Indicator
Preparedness Measure
Type Of Disaster 2
Early Warning Indicator
Human disease
Preparedness Measure
Type Of Disaster 4
Early Warning Indicator
Preparedness Measure
Preparedness Measure
Kebele Name
Type Of Disaster 1
Early Warning Indicator
Preparedness Measure
Type Of Disaster 2
Early Warning Indicator
Preparedness Measure
LOKAMEGNAN
Conflict
Reading animal intestine
Prepare to escape from the conflict
Drought
Migration
Type Of Disaster 3
Early Warning Indicator
Preparedness Measure
Type Of Disaster 4
Early Warning Indicator
Preparedness Measure
Hunan disease
Increasing number of patient
Medical treatment
262
Page 3 of 10

Region S.N.N.P
Selected Indicator:
Zone
SOUTH OMO
Interventions: Community Suggestions to Development Actors
Wereda NYANGATOM
Kebele Name
Type Of Disaster 1
Early Warning Indicator
LOKORLEM
Conflict
Reading animal intestine
Type Of Disaster 3
Early Warning Indicator
Preparedness Measure
Type Of Disaster 2
Early Warning Indicator
Preparedness Measure
Preparing for fight or advising herd keepers to
take core of conflict occurrence
Drought
Watching frying direction
Migration
Preparedness Measure
Type Of Disaster 4
Early Warning Indicator
Preparedness Measure
Kebele Name
Type Of Disaster 1
Early Warning Indicator
Preparedness Measure
Type Of Disaster 2
Early Warning Indicator
Preparedness Measure
LOPAKOR
Conflict
Reading animal intestine
Migration
Drought
Reading animal intestine
Migration, report to government
Type Of Disaster 3
Early Warning Indicator
Preparedness Measure
Type Of Disaster 4
Early Warning Indicator
Preparedness Measure
263
Page 4 of 10

Region S.N.N.P
Selected Indicator:
Zone
SOUTH OMO
Interventions: Community Suggestions to Development Actors
Wereda NYANGATOM
Kebele Name
Type Of Disaster 1
Early Warning Indicator
Preparedness Measure
LORENKACHAWE
Drought
Reading livestock intestine
Migration
Type Of Disaster 3
Early Warning Indicator
Preparedness Measure
Human disease
Medical treatment
Type Of Disaster 2
Early Warning Indicator
Preparedness Measure
Conflict
Reading livestock intestine
Discuss with kebele to keep community youth
from conflict
Type Of Disaster 4
Early Warning Indicator
Preparedness Measure
Kebele Name
Type Of Disaster 1
Early Warning Indicator
Preparedness Measure
Type Of Disaster 2
Early Warning Indicator
Preparedness Measure
LOTOMEN
Conflict
Reading livestock intestine
Giving advice for hard keepers to take care and
prepare for fight
Drought
Wind direction
Migration
Type Of Disaster 3
Early Warning Indicator
Preparedness Measure
Type Of Disaster 4
Early Warning Indicator
Preparedness Measure
Human disease
Increasing number of affected
Traditional treatment
264
Page 5 of 10
Region S.N.N.P
Selected Indicator:
Zone
SOUTH OMO
Interventions: Community Suggestions to Development Actors
Wereda NYANGATOM
Kebele Name
Type Of Disaster 1
Early Warning Indicator
NAPATOKOYET
Drought
Wind direction
Type Of Disaster 3
Early Warning Indicator
Preparedness Measure
Migration
Preparedness Measure
Type Of Disaster 2
Early Warning Indicator
Preparedness Measure
Conflict
Reading livestock intestine
Advice the adult to keep themselves from conflict
Type Of Disaster 4
Early Warning Indicator
Preparedness Measure
Kebele Name
Type Of Disaster 1
Early Warning Indicator
Preparedness Measure
Type Of Disaster 2
Early Warning Indicator
Preparedness Measure
NAROGOY
Drought
Reading livestock intestine
Migration
Human disease
Medial treatment, migration
Type Of Disaster 3
Early Warning Indicator
Preparedness Measure
Type Of Disaster 4
Early Warning Indicator
Preparedness Measure
265
Page 6 of 10

Region S.N.N.P
Selected Indicator:
Zone
SOUTH OMO
Interventions: Community Suggestions to Development Actors
Wereda NYANGATOM
Kebele Name
Type Of Disaster 1
Early Warning Indicator
NATEKER
Drought
Reading livestock intestine
Type Of Disaster 3
Early Warning Indicator
Preparedness Measure
Temporary migration
Preparedness Measure
Type Of Disaster 2
Early Warning Indicator
Conflict
Reading livestock intestine
Type Of Disaster 4
Early Warning Indicator
Preparedness Measure
Preparedness Measure
Kebele Name
Type Of Disaster 1
Early Warning Indicator
Preparedness Measure
Type Of Disaster 2
Early Warning Indicator
Preparedness Measure
NAWEYAPE
Drought
Reading animal intestine
Temporary migration
Conflict
Reading animal intestine
Prepared for fighting against
Type Of Disaster 3
Early Warning Indicator
Preparedness Measure
Type Of Disaster 4
Early Warning Indicator
Preparedness Measure
266
Page 7 of 10

Region S.N.N.P
Selected Indicator:
Zone
SOUTH OMO
Interventions: Community Suggestions to Development Actors
Wereda NYANGATOM
Kebele Name
Type Of Disaster 1
Early Warning Indicator
Preparedness Measure
Type Of Disaster 2
Early Warning Indicator
Preparedness Measure
SHENKORA
Conflict
Reading goat intestine
Community elders discussed how to solve
problems
Drought
Reading goat intestine
Migration
Type Of Disaster 3
Early Warning Indicator
Preparedness Measure
Type Of Disaster 4
Early Warning Indicator
Preparedness Measure
Human disease
Medical treatment
Kebele Name
Type Of Disaster 1
Early Warning Indicator
Preparedness Measure
Type Of Disaster 2
Early Warning Indicator
Preparedness Measure
TERGA
Conflict
Reading animal intestine
Migration
Drought
Reading animal intestine
Migration
Type Of Disaster 3
Early Warning Indicator
Preparedness Measure
Type Of Disaster 4
Early Warning Indicator
Preparedness Measure
Human disease
Medical treatment
267
Page 8 of 10

Region S.N.N.P
Selected Indicator:
Zone
SOUTH OMO
Interventions: Community Suggestions to Development Actors
Wereda NYANGATOM
Kebele Name
Type Of Disaster 1
Early Warning Indicator
KOWTEM
Drought
Reading animal intestine
Type Of Disaster 3
Early Warning Indicator
Preparedness Measure
Temporarily migration
Preparedness Measure
Type Of Disaster 2
Early Warning Indicator
Conflict
Reading animal intestine
Type Of Disaster 4
Early Warning Indicator
Preparedness Measure
Preparedness Measure
Kebele Name
Type Of Disaster 1
Early Warning Indicator
Preparedness Measure
Type Of Disaster 2
Early Warning Indicator
Preparedness Measure
LEBERE
Conflict
Reading animal intestine
Migration, prepare to escape from conflict
Drought
Reading animal intestine
Temporary migration
Type Of Disaster 3
Early Warning Indicator
Preparedness Measure
Type Of Disaster 4
Early Warning Indicator
Preparedness Measure
Human disease
Increasing number of patient
Medical treatment
268
Page 9 of 10

Region S.N.N.P
Selected Indicator:
Zone
SOUTH OMO
Interventions: Community Suggestions to Development Actors
Wereda NYANGATOM
Kebele Name
Type Of Disaster 1
Early Warning Indicator
Preparedness Measure
NAKARMAN
Conflict
Reading goat intestine
Making peace
Type Of Disaster 3
Early Warning Indicator
Preparedness Measure
Human disease
Tradition and medical treatment
Type Of Disaster 2
Early Warning Indicator
Preparedness Measure
Drought
Reading goat intestine
Migration
Type Of Disaster 4
Early Warning Indicator
Preparedness Measure
Kebele Name
Type Of Disaster 1
Early Warning Indicator
Preparedness Measure
Type Of Disaster 2
Early Warning Indicator
Preparedness Measure
NAPUSUMERYA
Drought
Reading animal intestine
Migration
Conflict
Reading animal intestine
Advice the kebele youth to keep themselves from
conflict
Type Of Disaster 3
Early Warning Indicator
Preparedness Measure
Type Of Disaster 4
Early Warning Indicator
Preparedness Measure
Human disease
Medical treatment
269
Page 10 of 10

Wereda Disaster Risk
Profile
Data_Collected_Date
Region S.N.N.P
Zone
SOUTH OMO
National Disaster Risk Management
Commission (NDRMC)
Friday, July 12, 2019
Wereda NYANGATOM
Selected Indicator
Wereda Strengths, weaknesses, opportunites and treats (SWOT) Analysis
Kebele Name
AYEPA
KAJAMAKEN
Strength
- Good cooperative habit
- Strong community elders
- Literate people
- Good interaction
- Stronger community
elders
Weakness
- Improper use of
infrastructure
- Irrigation land are not
capable to work
- Migration
- Unable to recover the
foreign tree
KEBELE 01
- Literate people
- Lack of awareness
Opportunity
- Irrigation land
- Construction of human health
center
- Opening of Omo Kuraz sugar
factory in the wereda
- Road
Threat
- Nearest wereda borders
- Increasing scarcity of
pure drinking water
- Human and livestock
disease
- The location of the
kebele on the border of
Kenya
- Lack of funding
KOPEREYA
KUCHURU
LOKAMEGNAN
- Good cooperative habit
- Strong community elders
- Property use of
infrastructure
- Good cooperation
- Strong community elders
- Presence of literate
community
- Strong community elders
- No enough strategies to
cope
- No strategy to cope the
disaster
- No cooperation as much as
other high kebeles
- Constructing school, health
post
- Having goad road in to their
kebele
- Access irrigation land
- Building school, health post
- Implement governmental
program (PCDP and PSNP)
- Settlement far away
from the wereda
- Shortage of pasture land
- Lack of livestock
- Human disease, conflict
270
Page 1 of 5

Wereda Disaster Risk
Profile
Data_Collected_Date
Region S.N.N.P
Zone
SOUTH OMO
National Disaster Risk Management
Commission (NDRMC)
Friday, July 12, 2019
Wereda NYANGATOM
Selected Indicator
Wereda Strengths, weaknesses, opportunites and treats (SWOT) Analysis
Kebele Name
LOKORLEM
Strength
- Strong community elders
- Acceptance of migrant
LOPAKOR
- Presence of Somali
- Good cooperative habit
- Strong community elders
LORENKACHAWE
- Literate people
- Strong community elders
LOTOMEN
- Able to sustain in the
harsh environment of the
kebele
- Presence of strong
community elders
Weakness
- Unable to plant instead
prosophis tree
- Waiting government to
resolve every disaster
- Tendency of revenge
- No structure to cope
- Improperly use of
infrastructure
- Unable to resolve internal
conflict by themselves
- They have no strategies to
cope any disaster
- Unable to create any soling
mechanism drying disaster
occurrence
Opportunity
- Presence of high population
- Construction of road
- Beginning of Omo Kuraz
sugar factory
- Fertile soil
- Main road
- Settlement nearest the
wereda
- Having fertile irrigation land
- They are settle nearest to
main road
- Starting of sugar factory it
the wereda
Threat
- Conflict
- Increasing prosophis
tree
- Shortage of water and
pasture
- Low pasture
- Settlement for away
from the Omo rive
- Absence of over flow of
Omo
- Low pasture land
- Settlement is far away
from river
- In migration
271
Page 2 of 5

Wereda Disaster Risk
Profile
Data_Collected_Date
Region S.N.N.P
Zone
SOUTH OMO
National Disaster Risk Management
Commission (NDRMC)
Friday, July 12, 2019
Wereda NYANGATOM
Selected Indicator
Wereda Strengths, weaknesses, opportunites and treats (SWOT) Analysis
Kebele Name
NAPATOKOYET
Strength
- Presence of good decision
makers kebele elders
NAROGOY
- Availability of strong
community elders
- High social interaction
NATEKER
- Good cooperation habit
during disaster occurrence
- Presence of stronger
community elders
Weakness
- Not able to coping
mechanism during disaster
occurrence
- Unable to protect and use
their social institutions from
damage
- Waiting for governemntal
push to practice small scale
irrigation
- Unable to make own coping
stragety of disaster before
they report to government
office
- Unable to work and
produce crop on their
irrigation land
- Taking migration a problem
solving mechanism
- Unable to remove the
foreign tree
Opportunity
- Having good and fertile
irrigation land near to the river
Omo
- Implementation of
government program in the
kebele
- Inclusion of the kebele in
resettlement program
- Accessibility of main road
- Having fertile irrigation near
to river
- Availability of grand project
like sugar factory
- Construction of human health
center
- Starting of Omo Kuraz sugar
factory in wereda
- Implementation of
government programs /PSNP
and PCDP
Threat
- Border sharing with
other wereda and tribs will
face them for conflict
again
- Construction of Gilgel
Gibe 3 hydro electric
power station on river Omo
- Migration, decreasing
pasture resource
- Settlement of the river
will face drinking water
shortage
- Migration
- The location of the
wereda is border of
Ethiopia and Kenya may
lead to conflict
- Increasing
environmental
temperature
272
Page 3 of 5
Wereda Disaster Risk
Profile
Data_Collected_Date
Region S.N.N.P
Zone
SOUTH OMO
National Disaster Risk Management
Commission (NDRMC)
Friday, July 12, 2019
Wereda NYANGATOM
Selected Indicator
Wereda Strengths, weaknesses, opportunites and treats (SWOT) Analysis
Kebele Name
NAWEYAPE
SHENKORA
TERGA
KOWTEM
Strength
- Good cooperation habit
during disaster occurrence
- Presence of strong
community elders
- Good cooperative
- Strong community elders
- Good cooperative
- Properly using
construction of school,
health
- Presence of strong elders
- Presence of literate
- Good cooperative habit
- Presence of strong
community elders
Weakness
- Taking migration a problem
solving mechanism
- Unable to remove the
foreign tree
- There is irrigation land but
not capable to work farming
system of agriculture
- Improperly use of
construction like school,
health post and toilet
- No enough strategies to
cope
- The settlement is
scattered
Opportunity
- Construction of human health
center
- Starting Omo Kuraz sugar
factory
- Implementation of
government program /PSNP and
PCDP
- Irrigation land nearest to
Omo river
- Having school, health post
- Road
- School and health
- Taking migration as a
problem solving mechanism
- Unable to recover foreign
tree
- Construction of human health
center
- Starting Omo Kuraz sugar
factory
Threat
- Across border disease
- Increasing temperature
- Settlement away the
wereda town
- Settlement nearest to
other trib such ash
Dasenech
- Migration
- Shortage of pure
drinking water
- Migration
- High temperature
273
Page 4 of 5

Wereda Disaster Risk
Profile
Data_Collected_Date
Region S.N.N.P
Zone
SOUTH OMO
National Disaster Risk Management
Commission (NDRMC)
Friday, July 12, 2019
Wereda NYANGATOM
Selected Indicator
Wereda Strengths, weaknesses, opportunites and treats (SWOT) Analysis
Kebele Name
LEBERE
NAKARMAN
NAPUSUMERYA
Strength
- Elders forecasting disaster
- Good kebele managers
- High social interaction
- Some literate people
- Strong Community elders
- Literate people
- Presence of strong
community elders
Weakness
- No cooperation
- Lack of awareness
- There is access of
irrigation but not able to use
- Un proper use of
infrastructure
- Unable to resolve internal
conflict
- Unable to design their
strategic mechanisms to cope
any disasters
- Unable to work on their
irrigation land
Opportunity
- Impelentation of government
program in the PCDP and PSNP
- Starting of sugar factory in
the wereda
- Irrigation land
- Building construction of
school and health post
- Fertile irrigation land nearest
to Omo river
- Main road
- Settlement near to the
wereda center to get extra
social service
Threat
- Human disease
- Settlement of
community
- Conflict
- Over flow of Omo river
- Shortage of pasture
- Far settlement for the
rive
- Omo river over flow
274
Page 5 of 5