


NATIONAL
DISASTER RISK MANAGEMENT COMMISSION
(NDRMC)
WOREDA DISASTER RISK PROFILE (WDRP)
REGION: S.N.N.P
ZONE: HALABA SPECIAL
WEREDA: HALABA SPECIAL
December, 2020
Addis Ababa

About the National Disaster Risk Management Commission (NDRMC)
The National Disaster Risk Management Commission (NDRMC) was reestablished in
December 2015 and recognized by an act of Council of Ministers (Regulation No.
363/2015) as an autonomous Federal Government office mandated to conduct
appropriate activities for the comprehensive implementation and realization of
the objectives of the National Disaster Risk Management Policy and Strategy and
to coordinate, monitor and provide appropriate support with respect to activities
carried out by the lead sector institutions.
Address: Kirkos Sub-city Behind Dembel City Center, Addis Ababa, Ethiopia.
P.O.Box: 5686
Tele: 0115524259/4272
Website: www.dppc.gov.et
© 2020 National Disaster Risk Management Commission. All rights reserved
Printed in Addis Ababa, Ethiopia.
Citation- This Document May be Cited as Follows:
National Disaster Risk Management Commission (2020),Halaba Special Woreda
Disaster Risk Profile, Addis Ababa, Ethiopia.

PREFACE
Ethiopia is well aware of the impact that disasters can have on the
development goals that we are rigorously pursuing through our
Growth and Transformation Plan II. With this recognition we
started a paradigm shift a few years ago, largely triggered by the
revised National Policy and Strategy on Disaster Risk Management.
To make the DRM programme implementation in the country well-informed, a
comprehensive information management system is required. We have been
undertaking a comprehensive risk assessment exercise under which Disaster Risk
Profiles are being prepared for each district and at sub-district levels in the country.
This Wereda Disaster Risk Profile establishes an extensive database on disaster risk
elements that will help decision makers at all levels to be better informed at
community and Wereda level about the characteristics of potential hazards, their
potential exposure, vulnerabilities of communities, capacities and that can also be an
input for Wereda Disaster Risk Reduction Plans and area specific early warning tools.
Wereda Disaster Risk Profiles developed are publically available here for the use of all
development partners and government sectors at all levels. Also, other data sources
of NDRMC, such as Desinventar, Livelihood Baseline and the Early Warning information
will be integrated and harmonized with this Information Management System.
Finally, we need to acknowledge the support of partners who have funded this
programme and we also look for the support of donors and all development partners
in order to achieve the ambitious indicators of this risk information and providing
every district with the disaster risk profile and their respective risk-informed plans.
H.E. Ato Mitiku Kassa
Commissioner
National Disaster Risk Management Commission (NDRMC)
The Federal Democratic Republic of Ethiopia (FDRE)

PREFACE
Woreda Disaster Risk Profiling (WDRP) is a government owned
programme undertaken by the National Disaster Risk
Management Commission (NDRMC) in collaboration with
regional DRM offices and development partners to provide
baseline information for disaster risk management practices
and activities in the country. The programme is designed by
taking into account the experiences gained from the implementation of pervious
strategies and actions like the Hygo Framework for Action (2000-2015) and the Sendai
Framework for Disaster Risk Reduction (2015-2030).
WDRP is composed of diversified indicators including hazard related issues, crop and
livestock production, landholding and environmental issues, human and livestock
health issues, education and social issues at wereda and kebele level. It provides
basic and detailed indicators with both quantitative and qualitative information which
obtained from both primary and secondary data sources.
Moreover, two pages summary of profiles is also prepared to help users easily
understand WDRP results for each wereda without going into detail for all indicators.
In addition to this booklet, developed profiles are uploaded on WDRP website
(http://profile.ndrmc.gov.et) to be viewed by all users; we encourage all DRM actors
at all levels to use this profile as baseline information for all DRM initiatives.
This WDRP booklet was produced through exemplary collaboration of all concerned
bodies and I would like to give my deepest gratitude to all who directly or indirectly
contribute for the success of the programme particularly for data enumerators and
supervisors, data encoders and profile development teams, consultants and advisors,
partner ministries and all DRM stakeholders.
Abraham Abebe
Director
Disaster Risk Reduction and Rehabilitation Directorate (DRRRD)
National Disaster Risk Management Commission (NDRMC)
Contents
No. Indicator Name
Page
Preliminary Information
I.
Preface
II.
Wereda Location in Ethiopian Map
III.
Methodology
IV.
Summary Profile
Hazard Related Characteristics
1
1.
Biological Hazards of the Wereda
2
2.
Geological Hazards of the Wereda
3
3.
Hydro Metrological Hazards of the Wereda
4
4.
Socio Economic Hazards of the Wereda
5
5.
Technological Hazards of the Wereda
6
6.
Disaster Characteristics By Kebele
7
7.
Hazards: Conflict as an Issue
45
8.
Hazard Situation During Last Disaster - Characteristics of most recent disaster that
affected the community
47
9.
Frequency of Disaster Occurrence
52
10.
Household Exposure to Hazards
53
11.
Months of Occurrence of Frequent Disasters
54
Conflicts: Perception of households on conflict issues - Is conflict an issue in this
12.
community?
55
13.
Conflicts: Perception of households on conflict issues - Who do you turn to in case
of a conflict?
56
14.
Losses from Disasters - Losses from all disasters (household response in %)
57
No. Indicator Name
Page
15.
Losses from Disasters - Main Losses by Type of Disasters (household response in %) 58
16.
Losses from Disasters - Secondary Losses by Type of Disasters (household response
in %)
61
17.
Seasonal Calendar for Hazards, Activities and Income Level By Kebele
64
Infrastructure Access Characteristics
18.
Physical Vulnerability: Access to Roads & Urban Centres - Households access to
road and urban centre
94
Physical Vulnerability: Access to Electricity - Households’ access and utilization of
19.
electricity
95
20.
Physical Vulnerability: Type of Dwelling Units - Households’ type of dwelling houses 96
Socio Demographic Characteristics
21.
Economic Vulnerability: Level of Migration - Migration level and its characteristics
by Kebele
98
22.
Economic Vulnerability: Household Migration - Household migration and reason for 99
migration
23.
Economic Vulnerability: Household Migration - Disasters as a triggering factor for
migration (households response in %)
100
24.
Demography: Population Structure
101
25.
Demography: Population Trends and Ethnic Groups
107
Social Vulnerability: Household Demographic Characteristics - Demographic
26.
characteristics of households
109
Social Vulnerability: Level of Educational Attainment - Education status of
27.
household members
110
28.
Social Vulnerability: Gender Parity - Gender parity in education level (7+ years)
and household heading
111
Environmental Characteristics
29.
Environmental Situation: Environmental Problems - Major environmental problems
by Kebele
113
No. Indicator Name
30.
Environmental Situation: Deforestation - Observed changes over levels of
deforestation by the community and its problems
Environmental Situation: Natural Resources Availability - Natural resources
31.
available and changes observed by the community
Page
115
117
32.
Environmental Situation: Reasons for Environmental Changes
132
33.
Environmental Situation: Soil Erosion - Observed changes on levels of soil erosion
133
by the community
Livelihood, Occupation and Source of food
Economic Vulnerability: Major Occupational Categories - Major categories of
34.
occupation and percent of population engaged in the occupation by Kebele
138
Economic Vulnerability: Livelihoods - Households important sources of
35.
livelihood (response in %)
141
36.
Economic Vulnerability: Occupational Categories - Percent of population above 15
years age by occupation categories
143
37.
Economic Vulnerability: Sources of Food - Households source for different food
items (response in %)
144
Crop Production
38.
Hazards: Change in Crop Damages - Proportion of total crop damage (percentage
response by households)
149
39.
Hazards: Change in Crop Damages - Major reasons for crop damage (percentage
response by households)
150
Hazards: Change in Crop Damages - Proportion of Damage for Major Crops
40.
(percentage response by households)
151
Hazards: Change in Crop Damages - Reasons for Damage of Major Crops
41.
(percentage response by households)
153
Agricultural Situation: Change in Crops Grown - Five major crops grown by
42.
proportion of total cultivated land
155
43.
Economic Vulnerability: Crops Grown - Types of crops grown by households
166
Economic Vulnerability: Crops Grown - Proportion of households by amount of yield
44.
of major crops (last year)
167
45.
Economic Vulnerability: Crops Grown - Proportion of households by amount of yield
of major crops (Five years ago)
168
No. Indicator Name
Page
46.
Economic Vulnerability: Land Ownership and Quality - Landownership of households 170
47.
Economic Vulnerability: Land Ownership and Quality - Farmers’ perception on the
quality of their agricultural land
171
48.
Environmental Situation: Land-Use other than crop production - Types of land use
other than crop production across Kebeles
172
49.
Economic Vulnerability: Status of Agriculture - Methods of tillage, Irrigation and
other agricultural input utilization by households
164
50.
Environment Situation: land use other than crop production-types of land use other
than crop production across kebles
172
51.
Economic Vulnerability: Crops Grown - Number of crops grown by households
165
Livestock Production
52.
Agricultural Situation: Status of Livestock Disease - Change In Livestock Disease
Status By Kebele
175
Livestock Prevalent of Diseases & Veterinary Facility - Livestock Diseases
53.
Prevalence
177
Livestock Prevalent of Diseases & Veterinary Facility - Evaluation of Access to
54.
Veterinary Services and Livestock Drugs
178
55.
Agricultural Situation: Livestock Diversity - Type of livestock and their economic
importance in the community
184
Economic Vulnerability: Livestock Ownership and Changes - Percentage of
56.
households by number and type of livestock owned
185
57.
Economic Vulnerability: Livestock Ownership and Changes - Households’ perception
on changes in livestock number in the last five years (response in %)
187
58.
Economic Vulnerability: Livestock Ownership and Changes - Households
perception on changes in livestock number in the last five years (response in %)
189
59.
Agriculture (Livestock): Pasture Availability - Households’ perception on access and
quality of pasture
190
No. Indicator Name
Page
Agriculture (Livestock): Pasture Availability - Households’ perception on
60.
problematic months for pasture availability
191
Agriculture (Livestock): Water Availability - Households’ response on water
61.
availability for livestock
192
62.
Agriculture (Livestock): Water Availability - Households’ perception on problematic
months of water availability for livestock
193
Agriculture (Livestock): Water Availability - Sources of water for livestock
63.
(households response in %)
194
Access to Markets and Credit
Economic Vulnerability: Proportion of Produce Sold and Market - Proportion of
64.
crops and livestock sold from total production and markets
196
65.
Economic Vulnerability: Kebele Access to Markets - Access to market by Kebele
200
Economic Vulnerability: Formal & Informal Transfers - Percentage of households
66.
reporting received formal transfers
202
67.
Capacity: Access to Credit Facilities - Households access to credit facilities
206
68.
Capacity: Access to Credit Facilities - Percentage of households by major reasons
of borrowing money
207
69.
Capacity: Access to Credit Facilities - Percentage of households by major sources
of credit
208
70.
Capacity: Access to Credit Facilities - Percent of households with ability to raise
500 birr in one week
209
Health and Sanitation Characteristics
71.
Household Access to Health Facilities - Where do patients go for health care?
211
72.
Hazards: Health problems and changes over the last decade
212
73.
Household Health Status - Households’ health condition and major health problems 214
74.
Household Access to Sanitation - Percentage of households with access to different
kind of toilet facilities
216
No. Indicator Name
Page
Household Access to Drinking Water - Sources of drinking water for households
75.
(response in %)
217
76.
Household Access to Drinking Water - Households’ methods of treating drinking
water
218
77.
Household Access to Drinking Water - Number of times households fetch water in a
week
219
Household Access to Drinking Water - Time taken per day to fetch water for
78.
households
220
Coping Mechanisms and Preparedness Measures
79.
Capacity: Community Preparedness against Sudden Onset Disasters
222
80.
Capacity: Community Preparedness against Increase in Disaster Intensity
227
81.
Capacity: Community Preparedness against Disasters
231
82.
Hazard: Coping and recovering during last Disaster
238
83.
Capacity: Type Community Participation
268
Capacity: Recovery from Losses from Disasters - Percentage of Households who
84.
have managed to recover from losses of disasters
270
Capacity: Coping Strategies Adopted by Households - Main coping strategies
85.
adopted by households to recover from respective losses
283
86.
Capacity: Coping Strategies Adopted by Households - Percentage of households
by frequency of main coping strategies adopted
286
87.
Capacity: Alternative Livelihood Sources - Alternative livelihood sources suggested
by the community
288
88.
Capacity: Recovery from Losses from Disasters - Percentage of households
recovered from past disasters by type of Disasters
271
Capacity: Recovery from Losses from Disasters - Proportion of households
89.
recovered by type of Losses
272
90.
Capacity: Coping Options if More Resources Available - What coping strategy could
be adopted if more resource were available?
273
No. Indicator Name
Page
91.
Capacity: Coping Strategies Adopted by Households - Percentage of households by
major type of coping strategies adopted (at least once)
274
Capacity: Coping Strategies Adopted by Households - Main coping strategies
92.
adopted by households for respective disasters
275
93.
Capacity: Coping Strategies Adopted by Households - Secondary coping strategies
adopted by households for respective disasters
277
94.
Agricultural Situation: Access to Inputs - Perception of the community on access
to improved agricultural inputs
296
95.
Agricultural Situation: Water for irrigation - Access to water for irrigation in the
297
community
96.
Agricultural Situation: Water Availability for Livestock - Water availability for
livestock in the community
298
Community Perception and Suggestions
97.
Agricultural Situation: Access to Extension - Perception of the community on
Access to Agricultural extension Services
300
98.
Agricultural Situation: Soil Fertility - Perception of the community on soil fertility
and its change over time
301
99.
Economic Vulnerability: Change in Agricultural Situation - Households
perception on changes of crop type, size of cultivated area and crop yields
302
Environmental Situation: General Land Quality - Perceptions of the community
100.
on changes in the general quality of land over a decade
305
Environmental Situation: Changes in Landscape - Changes observed by the
101.
community on landscape and the problems due to the changes
306
Interventions: Community Perception on Mediums to Influence DRM Actors -
102. Community perception on the effectiveness of institutional channels to use to
308
influence DRM actors
No. Indicator Name
Page
Interventions: Community Perception on their Knowledge used in DRM Process -
103. Perception of the community on how their knowledge influences the priorities and 313
measures of DRM actors
Interventions: Suggestions to improve preparedness - Interventions suggested by
104.
the community to development actors to improve preparedness in the area
315
Interventions: Suggestions to DRM Actors in the Area - Community suggested
105.
measures to DRM actors in the area for effective DRM actions
319
106.
Economic Vulnerability: Community Suggestions to Improve Economic Situation -
Community suggested measures to improve the economic situation of the area
324
107. Community Awareness of Disaster Risk Management System and Actors
328
Community Perception of DRM System and Actors - Perception of the community on
108. the effectiveness of DRM system in helping them to prevent, cope and recover
335
from disasters
Major Public Interventions Desired - Percentage of households by type of
109.
intervention desired
338
Others
110. Capacity: Community Based Organizations
341
Supporting Agencies against Disasters - Percentage of households by supporting
111.
institutions to handle or recover from disaster damages
345
112.
Type of Support Received From Supporting Agencies – Household responses of types
of support received from supporting agencies
346
113.
Government Actors in the Field of Disaster Risk Management - Government actors
and their activities in the field of Disaster Risk Managements
347
114.
Non-Government Actors in the Field of Disaster Risk Management - Non-government
actors and their activities in the field of Disaster Risk Management
349
115. Wereda SWOT Analysis
350
Supplementary Information from Secondary Sources
116. Wereda Livelihood Zone Information
355
117. Wereda General Information
356
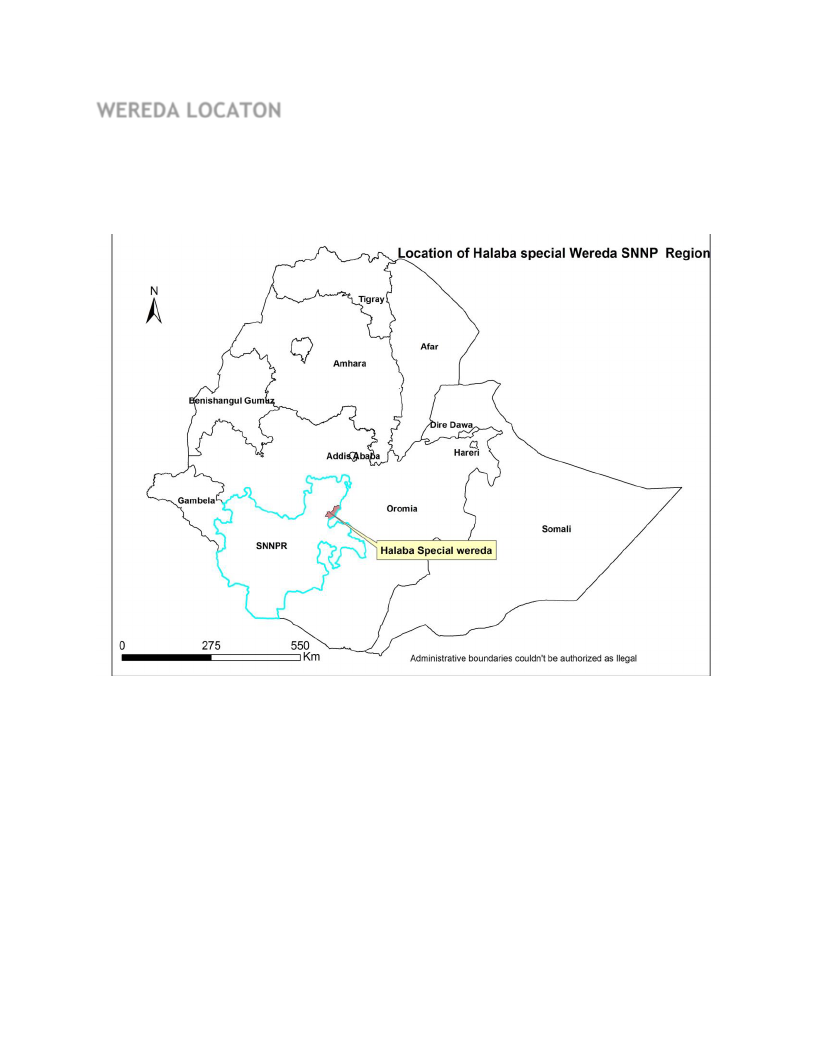
WEREDA LOCATON

METHODOLOGY
WDRP Content :
• Comprehensive information on disaster risk components
(Hazards, Vulnerability and Capacity)
• Multi-sectoral and multi-hazard information.
Research Approach:
• Mixed Approach
• Both quantitative and qualitative information
Data Sources:
• Primary Data:
Household Questionnaires: statistically significant number
(around 400 households).
Focus Groups Discussions: One per kebele
Key Informant Interviews: with major woreda level government
and non-government DRM actors
Problem Tree Analyses : to see the cause and effect of disasters
• Secondary Data:
collected relevant to WDRP indicators:
LIU, SERA Project, Risk baseline, other ministries…
Sampling Technique:
• Multistage cluster sampling
• Both Probability and Non-probability sampling
Methods of Analysis:
• Descriptive Statistics
• Textual Analysis
• Cispro and SPSS
• Automate WDRP software
WEREDA
SUMMARY DISASTER RISK PROFILE
INFORMATION
Wereda Disaster Risk Profiling Programme: SNNP
Disaster Risk Profile: Halaba special Wereda
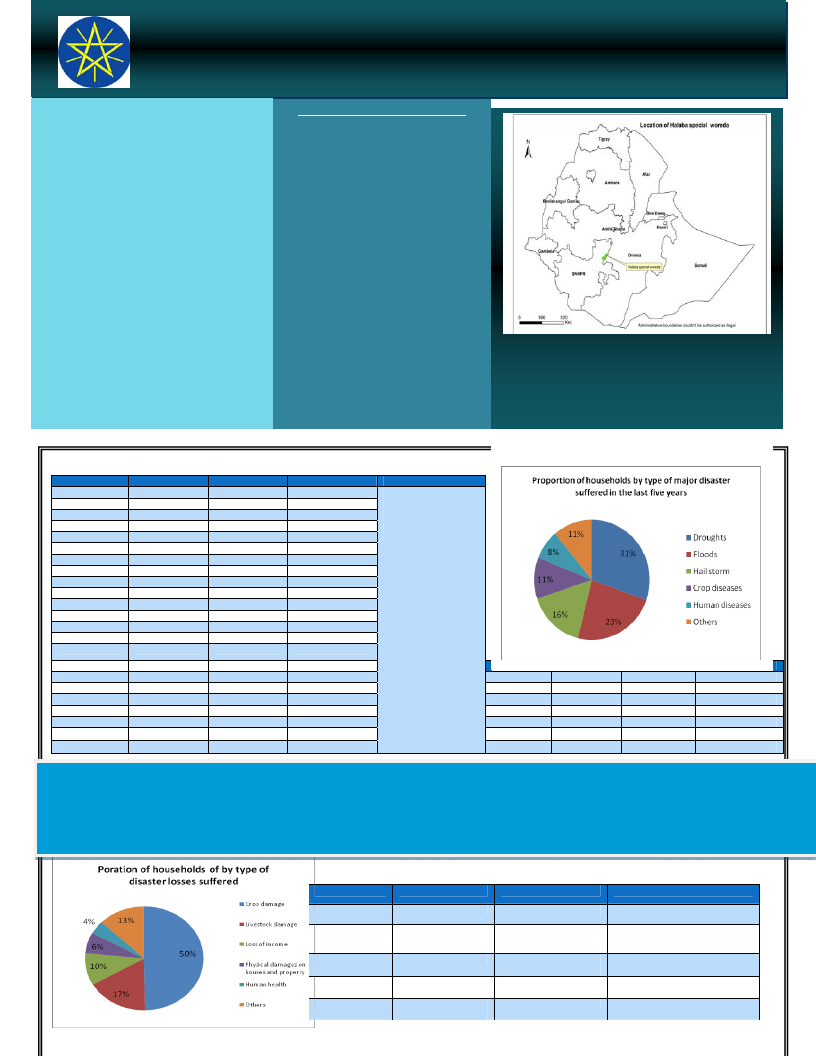
SUMMARY OF WEREDA PROFILE
Drought, Flood and hailstorm are the major
disasters in the woreda. Effects and frequencies
of these hazards are reported increasing in most
kebels
The major environmental problem challenging
agricultural production in the woreda are flood,
shortage of rain, high temperature and
deforestation which resulted in soil erosion, land
degradation and low production.
Lack of enough farming land, use of free oxen
for tillage, deforestation, lack of soil and water
conservation, population growth and lack of
infrastructures such as road and electricity are
factors which make the community vulnerable
to disaster in the woreda.
Policy implication for this woreda include use of
drought resistant varieties of seed,
reforestation, soil and water conservation
activities, water harvesting technology and
strengthen health services for human and
livestock’s
LIVELIHOOD ZONE SUMMARY
Alaba-Mareko Lowland
Pepper Livelihood Zone
This relatively food secure zone has a valuable
cash crop industry that attracts migrant la borers
from other zones. The population is relatively
sparse and land-holdings are large enough to allow
even poor households to grow nearly 60%of their
food needs, and to earn 60% of their cash earnings
through the sale of peppers. Livestock production,
especially cattle, is important including for the poor
through butter sales. Rain failure has affected
production in recent years, but floods from the
neighbouring highlands are also a frequent
problem although at the same time as causing
damage they deposit fertile silt.
Alaba-Mareko Lowland
Badewacho-Alaba Maize Livelihood Zone Low
population density, relatively large landholdings per
household, flat and fertile soils, and a woina dega
agroecologytogether provide a conducive environment for
agricultural production in this zone. However, production
failure in recent years has meant that food aid is an
important source of food for poorer households even in a
non-crisis year. The basic staple is maize while teff and
maize are the main marketed crops, with good road access
to main markets, including Shashamene. However, for the
better-off livestock sales are the highest income earner.
Beyond selling some crops and livestock, poor households
make ends meet by a variety of economic activities,
including casual labour, selling firewood, and petty trade.
MAJOR DISASTERS REPORTED IN WEREDA
Kebele
E/Gortancho
Kobo Geto
TefoChufo
Mito Dubela
HabiboFurana
Sinbito
Chambula
WojagoYato
1st Teho
Sorge
BulkoTimbame
Holagaba
WetetaFeten
AndegnaQonichia
Kuluto
Disaster 1
Drought
Drought
Erosion
Flood
Erosion
Flood
Drought
Drought
Erosion
Erosion
Flood
Drought
Drought
Water shortage
Erosion
Disaster 2
Erosion
Erosion
Drought
Drought
Drought
Water shortage
Erosion or Flood
Erosion
Drought
No road
Drought
Flood erosion
Water shortage
Drought
Drought
Disaster 3
Snow
Snow
Water shortage
Snow
Water shortage
Animal disease
Snow
Water shortage
Human disease
Snow
Water pollution
Animal disease
Erosion
Water problem
Upper Lenda
TachignawBedene
2nd Mekala 'A'
2nd Tuka
NegeileWadelsha
Handazo
Aymele
1st Tuka
Drought
Soil Erosion
Water shortage
Drought
Drought
Water Shortage
Drought
Drought
Flood
Drought
Flood
Flood
Water shortage
Erosion
Flood
Flood
Water shortage
Crop pest
Drought
Water shortage
Flood
Drought
Water shortage
Water shortage
LIU Info
Chronic Hazards:
Drought
Flood
Malaria
Kebele
Mesla
Anshokolabutu
Yambo
Hamata
Gilme
Bubisa
Disaster 1
Drought
Drought
Water shortage
Drought
Drought
Flood
Drought
Disaster 2
Water shortage
Water shortage
Drought
Flood
Water shortage
Drought
Flood
Disaster 3
Flood
Animal Disease
Human Disease
Water Shortage
Flood
Water shortage
Water shortage
SHORT NARRATIVE ON MAJOR DISASTERS:
Drought, flood, hailstorm, crop disease, and human disease are the major disaster in the woreda. Drought is caused by shortage of rainfall, deforestation and soil degradation.
The major impacts of drought are crop damage, food insecurity (hunger) shortage of water and pasture and outbreak of human and livestock disease. Flood which is
caused by High Rainfall, Topography and deforestation resulting in Crop loss, Soil loss, Gully expansion on farm land, Breaking Road, displacement and disease outbreak ( human and livestock).
Crop disease has impact on loss of income and production. Human disease such as Intestinal Parasite and Diarrhea, respiratory throat Infection and eye disease are mainly caused by poor sanitation
and suffocation. Malaria is also the other Disease caused by Untimely Rainfall, Water Drainage Problem and Poor Awareness in Bed net Use.
Disasters
Drought
Flood
Hailstorm
Crop disease
Human disease
EFFECT OF DISASTERS
Loss 1
Loss 2
Loss 3
Crop damage
Livestock damage
Losses access to water source
Crop damage
Crop damage
Crop damage
Loss of income
Physical damages on
houses and property
Loss of income
Physical damages on houses and
property
Loss of income
Loss of saving
Death of household
members
Illness
Loss of saving
Wereda Disaster Risk Profiling Programme: SNNP
Disaster Risk Profile: Halaba special woreda
HOUSEHOLD AND COMMUNITY
VULNERABILITY
The livelihood of the community mainly depends on crop production
such as maize sorghum, teff, haricot bean and also pepper as cash
crop also Livestock production such as cattle poultry, shoats and
equines. Selling cereal food crops, agricultural labourer and selling
animals are the main source of income in the woreda.
Lack of enough farming land which is the cause for family conflict is
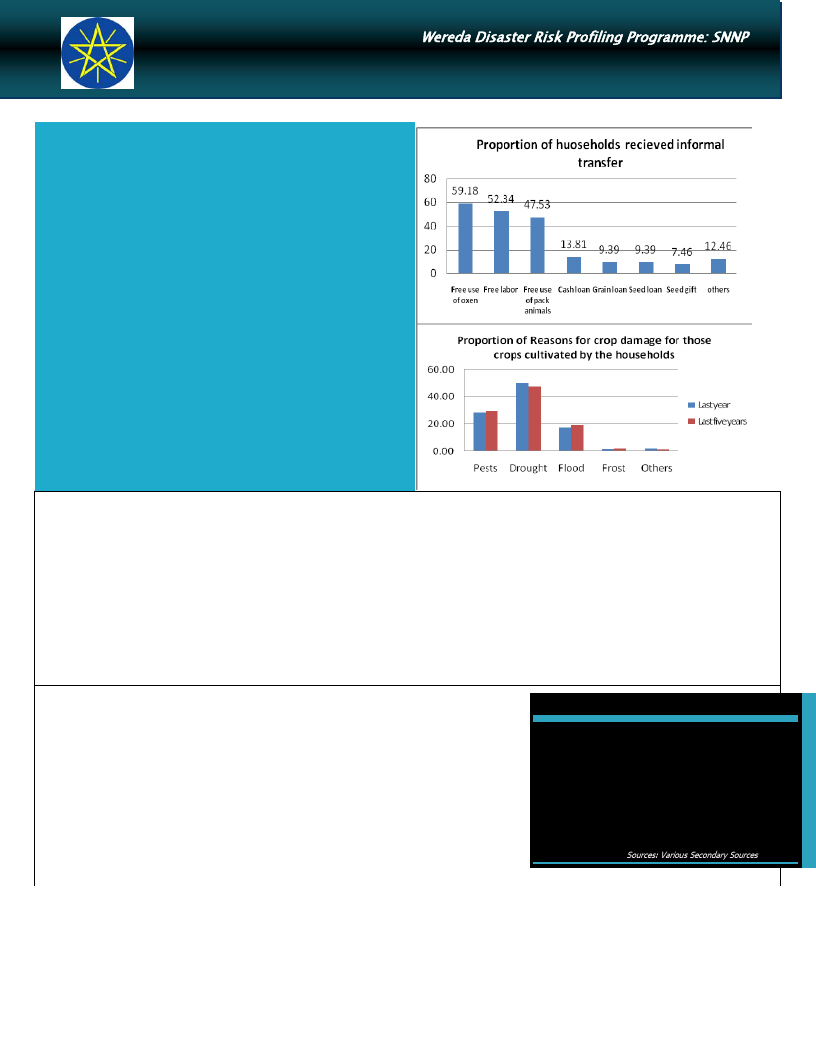
the main problem in the area. Even if they use oxen for tillage (99%),
59% of the surveyed households do not have their own oxen.
Drought (the main reason to crop damage), deforestation ,animal
disease , shortage of rain , high temperature, poor family planning,
are the major factors which make the community vulnerable to
disaster
Poor sanitation, lack of clean potable drinking water, lack of
infrastructure such as road and electricity, lack of soil and water
conservation activities are additional vulnerability factors in the
woreda.
Almost half of the households reported that it would be impossible to
raise Birr 500 in one week implying their vulnerability to a sudden on‐
set of disaster
Accessibility:
Access to road and urban centre: 57% of the household reported that they have dirty road which is difficult for vehicle leading to their houses, while 23% of the
household do not have road. The average time to reach the nearest paved road is 36 minutes, the average time to reach to the nearest urban centre is 2 hours and 10
minutes
Access to market: Almost 50% of the house hold reported that they have poor access to market due to lack of road
Electricity: None of the surveyed households are connected to electricity
Access to agricultural extension service: is reported to be good and out of the surveyed households 87% of them received agricultural extension service
Access to fertilizer, pesticides and improved seeds: Of the total household surveyed in the woreda 96% used both chemical, chemical and natural fertilizers, 82% of the
household used improved Varity of seeds.
Access to water and sanitation: About 46% of the households surveyed reported that the main source of drinking water is communal tap where 40 % obtain from birka
and rivers. 85% of them use the water without making any type of treatment. With regard to sanitation 73% of the households use outdoor latrine, while 26% of them do
not have toilet facility at all.
Access to health service: 84% of the household surveyed reported that they have no money for treatment coast.
Access to credit: only 7% of the surveyed households have borrowed money, most of them from their friends and relatives to buy food.
Level of Awareness and Institutional Development
Literacy level: The literacy rate is low in the woreda. The proportion of literate population above 7 years old is
only 3%, out of which 52% completed 1st grade and 35% primary school only. The proportion of those who can
read and write text easily is 2%. The gender parity in education is more favour of males in all level. From the total
number of households surveyed, 13% of them are female house‐headed.
Community awareness about disaster risk management system and actors is good, and the level of awaring the
community about disaster and cooperation and participation among the community during disaster is strong.
There is a good institutional development and social network as well as cooperation among people in the kebeles
of the woreda namely youth association, farmers association and women associations helping each other during
disaster, in time of farming, wedding, death, where there is hazard like fire, conflict, etc.
Availability of UNICF, Water action, Farm Africa, FHE, People in need, LVI, Save the children and WFP is a good
potential capacity towards disaster risk management activities of the woreda
InfoBits:
Population
Sex ratio
Urban Population
Mean Altitude
Mean Slope
Road density
Measles caseload
: 232,241(2007)
: 981F/1000 M
:26850 (2007)
:1852 m
: 2.13%
:16.88 %
: 28 (2004-2009)
Sources: Various Secondary Sources
COMMUNITY CAPACITY TO COPE
.
Major coping mechanisms: Consumption rather than sale of crop surplus, reduce expenditure on non‐ essential items, increase working hours, seek alternative or
additional jobs and also selling more live stocks than usual , rent lands during drought seasons are major coping mechanisms used in the woreda
Adaptation (Preparedness) strategies: 65% of the household’s choice is adaptation of economic activities to hazards season and 34% of them is
storage of food and other necessities.
In the woreda only 49% of the households have managed to recover from disaster
During disaster 52% of the households are able to raise Birr 500 in one week through saving, borrowing and doubt from other persons.
Crop and livestock diversity: : The most commonly grown crops in the woreda are Maize, sorghum, Teff, Harricot bean, wheat, pepper and finger millet, while the
major types of livestock reared in the woreda are cattle, poultry, shoats and equines.
WDRP Indicators
Hazard Related Characteristics
1
Wereda
Disaster Risk
Data_Collected_Date
December 2011
Disaster Risk Management
and Food Security Sector (DRMFSS)
Wednesday, September 3, 2014
Region S.N.N.P
Selected Indicator
Zone
ALABA SPECIAL
Biological Hazards of the Wereda
Wereda
ALABA SPECIAL
Hazard_Name
Hazard_Sub_Type
Cause_Of_Hazard
Animal disease
Anthrax
Faculiasis
Black leg
Foot and Mouth Disease
(FMD)
Drought, Seed Shortage and Unclean
water
Poor management and low Feed
Drought and Feed shortage
Absence of animal health centre
Lack of vaccination
Hazard_Sub_Type
Crop pests and diseases
Crop pests and diseases
Rainfall shortage
Lack of crop rotation
Hazard_Sub_Type
Human Disease
Malaria
Intestinal Parasite and
Diarrhea
Respiratory Throat
Infection
Eye disease
Untimely Rainfall, Water Drainage
Problem and Poor Awareness in Bed net
Use
Water Shortage (lack of pure water)
Suffocation and Poor ventilation
Poor sanitation
Effects_Of_Hazard
Low Animal Production and Human
Disease
Animal Death and Low yield
Livestock death, Extra cost and water
Born disease
Crop damage (decrease productivity)
Loss of income
Food shortage
Illness/health problems
Extra cost for medication
Death of humans
Page 1 of 1
2

Wereda
Disaster Risk
Data_Collected_Date
December 2011
Disaster Risk Management
and Food Security Sector (DRMFSS)
Wednesday, September 3, 2014
Region S.N.N.P
Selected Indicator
Zone
ALABA SPECIAL
Geological Hazards of the Wereda
Wereda
ALABA SPECIAL
Hazard_Name
Hazard_Sub_Type
Cause_Of_Hazard
Geological Hazards
No Geological hazard has
been reported in the area
Effects_Of_Hazard
Page 1 of 1
3
Wereda
Disaster Risk
Data_Collected_Date
December 2011
Disaster Risk Management
and Food Security Sector (DRMFSS)
Wednesday, September 3, 2014
Region S.N.N.P
Selected Indicator
Zone
ALABA SPECIAL
Hydro Metrological Hazards of the Wereda
Wereda
ALABA SPECIAL
Hazard_Name
Hazard_Sub_Type
Flooding
Snow (hailstorm)
Cause_Of_Hazard
Hydro-Meteorological Hazards
• Forest removal and Topography, bad
location
Forest removal and bad farming
topography
Forest loss, Deforestation and
Erratic Rainfall
• High Rainfall or storm
• Erratic Rainfall forest Degrade
Drought
• Erratic rainfall distribution
• Deforestation
Effects_Of_Hazard
• Soil loss and Crop failure
• Soil loss, low yield, Degradation and
Large gully
Soil loss, Poor Yield, Poor Animal Yield,
Hunger and Disease
Physical damage on houses and
property
• Crop Damage
• Crop loss, Livestock loss, Hunger and
Disease
• Physical damage on houses and
property
• Crop damage
• Livestock damage
• Food shortage (hunger)
• Occurrence of diseases (crop, human
and animals)
Page 1 of 1
4
Wereda
Disaster Risk
Data_Collected_Date
December 2011
Disaster Risk Management
and Food Security Sector (DRMFSS)
Wednesday, September 3, 2014
Region S.N.N.P
Selected Indicator
Zone
ALABA SPECIAL
Socio Economic Hazards of the Wereda
Wereda
ALABA SPECIAL
Hazard_Name
Hazard_Sub_Type
Cause_Of_Hazard
Social Hazards
No Socio Economical hazard
has been reported in the
area
Effects_Of_Hazard
Page 1 of 1
5

Wereda
Disaster Risk
Data_Collected_Date
December 2011
Disaster Risk Management
and Food Security Sector (DRMFSS)
Wednesday, September 3, 2014
Region S.N.N.P
Selected Indicator
Zone
ALABA SPECIAL
Technological Hazards of the Wereda
Wereda
ALABA SPECIAL
Hazard_Name
Hazard_Sub_Type
Cause_Of_Hazard
Technological Hazards
No technological hazard has
been reported in the area
Effects_Of_Hazard
Page 1 of 1
6

Wereda Disaster
Risk Profile
Data_Collected_Date
December 2011
Region S.N.N.P
Zone ALABA SPECIAL
Selected Indictor: Disaster Characteristics By Kebele
Kebele Name
Disaster_Type
Common Period
Year Occured
ANDEGNA TEFO
Floods
April, June,
July and August
1998, 2001
and 2003
Droughts
May and March
2000, 1977
and 2001
Human diseases
May and
October
1977, 2000
and 2003
Disaster Risk Management
and Food Security Sector (DRMFSS)
Wednesday, September 3, 2014
Wereda ALABA SPECIAL
Worst_Year
Trends of
Effects
2003
Increased
1977
Increased
1977
Decreased
Root Causes Effects
Vulnerability
Forest
removal and
Bad farming
Practice
Forest
Removal and
Erosion
Nutrition and
Poor
sanitation
Crop
failure,
soil loss,
Erosion
and
Displaces
farmers
Crop
Failure
Disease
and
Hunger
Unproduc
tive Force
and Death
Unfavourabl
e Location
Unfavourabl
e Location,
Population
Increase and
Forest
Removal
Low hygiene
and Poor
Nutrition
Coping
Strategy
Terracing
and
Diversion
Canal
Land Rent,
Livestock
sell and
Food
sharing
Treatment,
Improve
Sanitation
and
Nutrition
education
7
Page 1 of 38

Wereda Disaster
Risk Profile
Data_Collected_Date
December 2011
Region S.N.N.P
Zone ALABA SPECIAL
Selected Indictor: Disaster Characteristics By Kebele
Kebele Name
Disaster_Type
Common Period
Year Occured
HULETEGNA
MEKALA
Shortage of
Water
November to
March
1977 and
2000
Floods
June, July and
August
2001 and
1999
Droughts
February and
May
1977, 1986
and 2000
Disaster Risk Management
and Food Security Sector (DRMFSS)
Wednesday, September 3, 2014
Wereda ALABA SPECIAL
Worst_Year
1977
Trends of
Effects
Decreased
Root Causes Effects
Vulnerability
Drought and
No Borehole
Water
Boren
disease,
Miscarriag
e, Time
and
Labour
Loss and
Livestock
Productivi
ty
Decreasin
g
1999
1977
Decreased
Increased
High Rainfall
Erratic
rainfall
Soil loss,
Crop loss,
Breaking
road and
Gully
formation
Crop loss,
Livestock
loss and
Disease
Poor
Farming
Practice
Poor
Farming
System
Coping
Strategy
Water
Purchase
from
Distance
area,
Consumptio
n reduction
specially
for
Livestock
drinking
two times
within a
Week
Replanting ,
Ditch and
Governmen
t Aid
Selling of
Livestock,
Renting of
land and
Governmen
t aid
8
Page 2 of 38
Wereda Disaster
Risk Profile
Data_Collected_Date
December 2011
Region S.N.N.P
Zone ALABA SPECIAL
Selected Indictor: Disaster Characteristics By Kebele
Kebele Name
Disaster_Type
Common Period
Year Occured
HULETEGNA
MEKALA
Snow
June, July and
August
1979 and
2001
ANDEGNA
KONCHA
Shortage of
Water
November Up
to March
1977, 2000
and 1995
Droughts
May, March and
February
1977, 2000
and 1995
Soil Erosion
June and
August
2001 and
2003
Disaster Risk Management
and Food Security Sector (DRMFSS)
Wednesday, September 3, 2014
Wereda ALABA SPECIAL
Worst_Year
Trends of
Effects
1979
Decreased
2000
Decreased
2000
Increased
2001
Increased
Root Causes Effects
Vulnerability
High Rainfall
Crop
Failure
No borehole
water
Disease,
Poor
sanitation
and Low
Livestock
stand
Unfavourabl
e location
Deforestation
and Soil
degradation
Crop loss,
Hunger,
Disease
and
Livestock
Death
Deforestatio
n, Bad
Location and
Population
Deforestation
, Bad
location and
Bad farming
System
Crop loss,
Soil loss
and
Degradati
on
Unfavourabl
e location
and
Deforestatio
n
Coping
Strategy
Replanting
and
Governmen
t aid
Water
purchase
and long
Hours
Journey in
Search of
water
Land rent,
Livestock
sale,
Governmen
t aid and
Community
help
Diversion
canal
constructio
n and
Terracing
9
Page 3 of 38

Wereda Disaster
Risk Profile
Data_Collected_Date
December 2011
Region S.N.N.P
Zone ALABA SPECIAL
Selected Indictor: Disaster Characteristics By Kebele
Kebele Name
Disaster_Type
Common Period
Year Occured
AYMELE
Droughts
February,
March and April
1977, 1986,
1991 and
2000
Floods
June, July and
August
Every Year
Disaster Risk Management
and Food Security Sector (DRMFSS)
Wednesday, September 3, 2014
Wereda ALABA SPECIAL
Worst_Year
1977
Trends of
Effects
Decreased
2001
Decreased
Root Causes Effects
Vulnerability
Erratic
rainfall and
forest
degradation
Crop loss,
Livestock
loss,
Hunger
and
Disease
Poor farming
System and
Forest
Removal
High rainfall,
Topography
and
Deforestation
Crop loss,
soil loss,
Gully
expansion
on farm
land and
Breaking
Road
Forest
Removal,
Poor
Farming
practice and
Poor Land
Management
Coping
Strategy
By Selling
of
livestock,
By selling of
Firewood,
Governmen
t food aid
and by
renting land
Replanting
and Ditch
10
Page 4 of 38

Wereda Disaster
Risk Profile
Data_Collected_Date
December 2011
Region S.N.N.P
Zone ALABA SPECIAL
Selected Indictor: Disaster Characteristics By Kebele
Kebele Name
Disaster_Type
Common Period
Year Occured
AYMELE
Shortage of
Water
December up
to March
Every Year
Snow
July and August
1998 and
2001
Disaster Risk Management
and Food Security Sector (DRMFSS)
Wednesday, September 3, 2014
Wereda ALABA SPECIAL
Worst_Year
2000
Trends of
Effects
Decreased
Root Causes Effects
Vulnerability
Erratic
Rainfall,
Insufficient
water point
and No river
Time and
Labour
loss,
Livestock
performa
nce of
productivi
ty
decreasin
g
1998
Decreased
High rainfall
Crop
Damage
Poor Agro
Forestry
Practice
Coping
Strategy
Consumptio
n Reduction
especially
for
livestock
drinking
two times
per week
and
Traveling
Long
distance to
search
water.
Because
Consumptio
n which
means
Locally so
called
"Teibisa"
(1/3) One
times per
three days
Replanting
and Ditch
11
Page 5 of 38
Wereda Disaster
Risk Profile
Data_Collected_Date
December 2011
Region S.N.N.P
Zone ALABA SPECIAL
Selected Indictor: Disaster Characteristics By Kebele
Kebele Name
Disaster_Type
Common Period
Year Occured
BUKET BAME
Floods
June and
August
1997, 1999
and 2001
Droughts
May and
September
1977, 2000,
1995 and
2003
MESERAK
GORTANCHO
Droughts
May, March and
February
1992, 2000
and 2003
Disaster Risk Management
and Food Security Sector (DRMFSS)
Wednesday, September 3, 2014
Wereda ALABA SPECIAL
Worst_Year
Trends of
Effects
1999
Decreased
1977
Decreased
2000
Increased
Root Causes Effects
Vulnerability
Deforestation
Crop
Failure
and High
Erosion
Forest
removal,
Farm land
Expansion
and
Increasing
Population
Deforestation
Crop
Failure
and
Livestock
loss
Forest
removal,
Farm land
Expansion
and Increase
Population
Forest
removal and
Rain
Shortage
Crop
Failure,
Animal
Disease
and Food
Shortage
Unfavourabl
e Location
Coping
Strategy
Community
Help,
Relatives
aid,
Governmen
t Aid and
Plantation
of Forest
Community
help,
Relatives
help,
Governmen
t Aid and
Plantation
of Forest
Firewood
sell, Straw
sell, land
Rent and
Food Aid
12
Page 6 of 38

Wereda Disaster
Risk Profile
Data_Collected_Date
December 2011
Region S.N.N.P
Zone ALABA SPECIAL
Selected Indictor: Disaster Characteristics By Kebele
Kebele Name
Disaster_Type
Common Period
Year Occured
MESERAK
GORTANCHO
Soil Erosion
April, June,
July and August
2001, 2002
and 2003
Snow
August and
June
1995 and
2001
HABIBO FURANA
Soil Erosion
April, June,
July and August
Every Year
Disaster Risk Management
and Food Security Sector (DRMFSS)
Wednesday, September 3, 2014
Wereda ALABA SPECIAL
Worst_Year
2001
Trends of
Effects
Increased
1995
Decreased
Increased
Root Causes Effects
Vulnerability
Forest
removal and
Topography
Soil loss
and Crop
failure
Topography
Unfavourabl
e Location
Crop
damage
and
animal
Death
Forest loss,
Deforestation
and Erratic
Rainfall
Soil loss,
Poor
Yield,
Poor
Animal
Yield,
Hunger
and
Disease
Bad
Topography,
Poor Soil and
Water
protection
work
Coping
Strategy
Tracing,
Diversion
canal and
Water Shed
developmen
t
Replanting
and Sowing,
Food Aid
and
Community
help
Conservatio
n
structures,
Governmen
t Aid,
Livestock
sell and
Community
Help
13
Page 7 of 38

Wereda Disaster
Risk Profile
Data_Collected_Date
December 2011
Region S.N.N.P
Zone ALABA SPECIAL
Selected Indictor: Disaster Characteristics By Kebele
Kebele Name
Disaster_Type
Common Period
Year Occured
HABIBO FURANA
Droughts
February,
March and May
1977, 1996
and 2000
HANTEZO
Shortage of
Water
December up
to April
1977, 1996
and 2000
Shortage of
Water
December to
April
2000
Disaster Risk Management
and Food Security Sector (DRMFSS)
Wednesday, September 3, 2014
Wereda ALABA SPECIAL
Worst_Year
1977
Trends of
Effects
Increased
2000
Increased
2000
Increased
Root Causes Effects
Vulnerability
Shortage of
Rain and
Forest
Removal
No Borehole
Water
No borehole
and Drought
Soil loss,
Poor
Yield,
Poor
Animal
Yield,
Hunger
and
Disease
Disease,
Women
Burden
and Poor
sanitation
Time and
Labour
loss,
Health
Problem
and
Decrease
Livestock
Productio
n
Bad
Topography,
Poor Soil and
Water
protection
work
Bad Location
Coping
Strategy
Conservatio
n
structures,
Governmen
t Aid,
Livestock
sell and
Community
Help
Water
Purchase
and Use of
Pond water
Traveling
long
distance to
search
water,
consumptio
n reduction
and
Purchasing
Water
14
Page 8 of 38

Wereda Disaster
Risk Profile
Data_Collected_Date
December 2011
Region S.N.N.P
Zone ALABA SPECIAL
Selected Indictor: Disaster Characteristics By Kebele
Kebele Name
Disaster_Type
Common Period
Year Occured
HANTEZO
Soil Erosion
June, July and
August
Every year
Droughts
December to
April
1977 and
2000
Livestock
diseases
September and
April
1977 and
2000
Disaster Risk Management
and Food Security Sector (DRMFSS)
Wednesday, September 3, 2014
Wereda ALABA SPECIAL
Worst_Year
1998
Trends of
Effects
Increased
1977 and
2000
Increased
2000
Decreased
Root Causes Effects
Vulnerability
Lack of
conservation
structure on
farm land,
Flood and
High Rainfall
Erratic
rainfall
Crop loss,
Soil loss
or
Degradati
on
Livestock
death,
crop
failure
and poor
animal
stand
Deforestatio
n, Forest
removal,
poor farming
and poor
land
Management
Poor farming
System
Drought
Livestock
loss
Poor
livestock
management
and poor
vaccination
awareness
Coping
Strategy
Ditch and
replanting
Selling of
firewood,
Renting Of
land,
government
Aid and
Selling of
Livestock
Governmen
t
vaccination
, Treatment
and Food
purchase
15
Page 9 of 38

Wereda Disaster
Risk Profile
Data_Collected_Date
December 2011
Region S.N.N.P
Zone ALABA SPECIAL
Selected Indictor: Disaster Characteristics By Kebele
Kebele Name
Disaster_Type
Common Period
Year Occured
KOBO GETO
Droughts
February,
March and May
1977, 1996,
2000 and
2003
Soil Erosion
April, June,
July and August
Every Year
Snow
July and August
1998, 2001
and 2002
Disaster Risk Management
and Food Security Sector (DRMFSS)
Wednesday, September 3, 2014
Wereda ALABA SPECIAL
Worst_Year
2000
Trends of
Effects
Increased
,
Increased
2001
Decreased
Root Causes Effects
Vulnerability
Rainfall
shortage,
deforestation
and Soil
Degradation
Crop loss,
Livestock
loss,
Disease
and
Hunger
Low
Replantation
Habit, Low
Conservation
work and
Bad Farming
Forest
removal bad
farming
topography
Soil loss,
low yield,
Degradati
on and
Large
gully
Low
Replantation
Habit, Low
Conservation
work and
Bad Farming
Crop
Damage
Coping
Strategy
Community
help,
Governmen
t Aid, Asset
sell, Soil
and Water
conservatio
n Work
Community
help,
Governmen
t Aid, Asset
sell, Soil
and Water
conservatio
n Work
Replanting
and
Re_sowing
Crop and
Governmen
t aid
16
Page 10 of 38

Wereda Disaster
Risk Profile
Data_Collected_Date
December 2011
Region S.N.N.P
Zone ALABA SPECIAL
Selected Indictor: Disaster Characteristics By Kebele
Kebele Name
Disaster_Type
Common Period
Year Occured
MEJA
Droughts
February,
March, April
and May
1977, 1986
and 2000
Shortage of
Water
December,
June, February
and March
Every year
Disaster Risk Management
and Food Security Sector (DRMFSS)
Wednesday, September 3, 2014
Wereda ALABA SPECIAL
Worst_Year
1977
Trends of
Effects
Decreased
2000
Increased
Root Causes Effects
Vulnerability
Erratic
rainfall and
Forest
Degradation
Hunger,
Crop
failure,
Livestock
loss and
Human
Disease
Poor farming
System and
Degrading
forest
Insufficient
Borehole
construction
and Erratic
rainfall
Time and
Labour
loss,
Health
Problem,
and
Livestock
productio
n
Decrease
Coping
Strategy
By selling of
firewood,
On
government
food aid, By
renting land
and By
selling of
livestock
Water
Purchase
from
Distance
area and
Consumptio
n reduction
specially
livestock
drinking
two time
within a
week
17
Page 11 of 38

Wereda Disaster
Risk Profile
Data_Collected_Date
December 2011
Region S.N.N.P
Zone ALABA SPECIAL
Selected Indictor: Disaster Characteristics By Kebele
Kebele Name
Disaster_Type
Common Period
Year Occured
MEJA
Floods
June, August
and July
Every Year
Livestock
diseases
September and
April
1977 and
2000
Snow
July and August
1993 and
2001
Disaster Risk Management
and Food Security Sector (DRMFSS)
Wednesday, September 3, 2014
Wereda ALABA SPECIAL
Worst_Year
1998
Trends of
Effects
Decreased
2000
Decreased
1998
Decreased
Root Causes Effects
Vulnerability
High Rainfall
and Forest
Degradation
Absence of
animal Local
centre
Crop
damage,
Soil loss,
Breaking
good and
Gully
expansion
on farm
land
Livestock
loss
Poor
Farming
Practice and
Forest
Degrading
Poor
Management
and Poor
awareness of
Vaccination
High Rainfall
Crop
damage
loss
Coping
Strategy
Governmen
t aid,
Replanting
or sowing
and Ditch
Governmen
t
vaccination
support,
Feed
Purchase
and
Treatment
Replanting
and
Governmen
t aid
18
Page 12 of 38

Wereda Disaster
Risk Profile
Data_Collected_Date
December 2011
Region S.N.N.P
Zone ALABA SPECIAL
Selected Indictor: Disaster Characteristics By Kebele
Kebele Name
Disaster_Type
Common Period
Year Occured
NEGELE WEDESH
Shortage of
Water
December,
January,
February and
March
Every Year
Disaster Risk Management
and Food Security Sector (DRMFSS)
Wednesday, September 3, 2014
Wereda ALABA SPECIAL
Worst_Year
2000
Trends of
Effects
Increased
Root Causes Effects
Vulnerability
No borehole
construction
and erratic
rainfall
Time and
Labour
loss,
Health
Problem
and
Decrease
Livestock
Productio
n
Coping
Strategy
Consumptio
n Limiting
meaning
livestock
drinking
two times
within a
week,
water
purchase
distance
area and
Traveling
long
distance to
search
Water
19
Page 13 of 38

Wereda Disaster
Risk Profile
Data_Collected_Date
December 2011
Region S.N.N.P
Zone ALABA SPECIAL
Selected Indictor: Disaster Characteristics By Kebele
Kebele Name
Disaster_Type
Common Period
Year Occured
NEGELE WEDESH
Floods
June, August
and July
1998 and
2001
Livestock
diseases
September and
April
1977 and
2000
Snow
July and August
every year
Disaster Risk Management
and Food Security Sector (DRMFSS)
Wednesday, September 3, 2014
Wereda ALABA SPECIAL
Worst_Year
1998
Trends of
Effects
Decreased
2000
Decreased
1998 and
2001
Decreased
Root Causes Effects
Vulnerability
Topography
and Forest
Degradation
Absence of
animal
health centre
and Drought
Crop
damage,
Soil loss,
Breaking
Road,
Livestock
loss,
Gully
Formation
and
expansion
on farm
land
Livestock
loss
Poor farming
practice,
Forest
Degradation
or Removal,
Poor soil and
water
conservation
Practice or
soil and
water
conservation
and (50+1)%
bare farm
land
Poor
management
, Poor
Vaccination
trained or
Awareness
High Rainfall
or Storm
Crop loss
or
Damage
Coping
Strategy
Governmen
t Aid,
Replanting,
Migration,
Diversion
canal water
way
constructio
n
Governmen
t
Vaccination
Support,
Feed
Purchase
and
Treatment
Replanting
and
Governmen
t Aid
20
Page 14 of 38

Wereda Disaster
Risk Profile
Data_Collected_Date
December 2011
Region S.N.N.P
Zone ALABA SPECIAL
Selected Indictor: Disaster Characteristics By Kebele
Kebele Name
Disaster_Type
Common Period
Year Occured
SORGE DARGOSA
Floods
June, July and
August
1998, 2001
and 2003
Snow
April and
August
1963 and
2001
TEFO CHUFO
Soil Erosion
April, June,
July and August
1998, 2001
and 2003
Droughts
February,
March and May
1977, 2000,
1995 and
2001
Disaster Risk Management
and Food Security Sector (DRMFSS)
Wednesday, September 3, 2014
Wereda ALABA SPECIAL
Worst_Year
Trends of
Effects
1998
Decreased
2001
Increased
2001
Increased
1977
Decreased
Root Causes Effects
Vulnerability
Topography
and
Deforestation
Crop
failure
and
Hunger
Crop
failure
and
Hunger
Deforestatio
n and
Population
Increase
Forest
removal and
Bad farming
Method
Forest
removal, Bad
farming,
Erosion and
Shortage of
Rain
Crop
Damage,
Soil Loss
and Food
Shortage
Crop
damage,
Animal
Death,
Hunger
and
Disaster
Unfavourabl
e Condition
Unfavourabl
e Location,
Forest
Removal and
Population
Growth
Coping
Strategy
Conservatio
n structure
Constructio
n
Re_sowing
and
Replacing
the farm by
fast
Growing
crop
Terracing,
Diversion
canal Work
and
Plantation
Livestock
sell, Land
rent,
Community
help and
Governmen
t aid
21
Page 15 of 38

Wereda Disaster
Risk Profile
Data_Collected_Date
December 2011
Region S.N.N.P
Zone ALABA SPECIAL
Selected Indictor: Disaster Characteristics By Kebele
Kebele Name
Disaster_Type
Common Period
Year Occured
TEFO CHUFO
Shortage of
Water
December,
February,
March and April
1977, 2000
and 1995
LAYEGNAWO
LENDA
Droughts
February,
March and April
1977, 1986,
1991 and
2000
Floods
June, July and
August
Every Year
Disaster Risk Management
and Food Security Sector (DRMFSS)
Wednesday, September 3, 2014
Wereda ALABA SPECIAL
Worst_Year
2000
Trends of
Effects
Increased
1977
Decreased
2001
Decreased
Root Causes Effects
Vulnerability
No Borehole
Water, Poor
pond and
Low access
Erratic
Rainfall and
Forest
Degradation
Water
Born
disease,
Woman
Burden
and Low
sanitation
Crop loss,
Livestock
loss,
Hunger
and
Disease
Unfavourabl
e Location
Poor farming
system and
Forest
Removal
High Rainfall,
Topography
and
deforestation
Crop loss,
Soil loss,
Gully
expansion
on farm
land and
Breaking
Road
Forest
removal,
poor farming
Practice and
Poor land
Management
Coping
Strategy
Water
Purchase
from 1st
Teho
Kebele and
Pond
Excavation
By selling of
livestock,
by selling of
firewood
and
Governmen
t food aid
by Renting
Land
Re_planting
, Construct
Diversion
canal or
Water ways
22
Page 16 of 38

Wereda Disaster
Risk Profile
Data_Collected_Date
December 2011
Region S.N.N.P
Zone ALABA SPECIAL
Selected Indictor: Disaster Characteristics By Kebele
Kebele Name
Disaster_Type
Common Period
Year Occured
LAYEGNAWO
LENDA
Shortage of
Water
December Up
to March
Every Year
WEJEGO YATO
Snow
Droughts
July and August
February,
March, April
and May
1998 and
2001
1977, 1991,
1996 and
2000
Disaster Risk Management
and Food Security Sector (DRMFSS)
Wednesday, September 3, 2014
Wereda ALABA SPECIAL
Worst_Year
2000
Trends of
Effects
Decreased
Root Causes Effects
Vulnerability
Erratic
Rainfall,
Insufficient
water point
and No river
Time and
Labour
loss,
Livestock
performa
nce or
productivi
ty
decreasin
g
1998
1977
Decreased
Increased
High Rainfall
or storm
No land
cover, No
rainfall and
Deforestation
Crop
Damage
Crop
Failure,
Animal
Death,
Hunger
and Sever
water
Problem
Unfavourabl
e location
and Forest
Clearing
Coping
Strategy
Consumptio
n limiting
meaning
specially
livestock
drinking
two times
within a
week and
Community
pond
Constructio
n
Replanting
Asset sell,
Governmen
t Aid,
Community
help, Food
Sharing and
Meal
Reduction
23
Page 17 of 38

Wereda Disaster
Risk Profile
Data_Collected_Date
December 2011
Region S.N.N.P
Zone ALABA SPECIAL
Selected Indictor: Disaster Characteristics By Kebele
Kebele Name
Disaster_Type
Common Period
Year Occured
WEJEGO YATO
Soil Erosion
June, July,
August and
April
Every Year
Shortage of
Water
Snow
December,
February,
June, March
and April
1977, 1996
and 2000
July and August
1998, 2001
and 1994
Disaster Risk Management
and Food Security Sector (DRMFSS)
Wednesday, September 3, 2014
Wereda ALABA SPECIAL
Worst_Year
Trends of
Effects
Increased
Root Causes Effects
Vulnerability
Forest
Removal, No
land Cover,
No
conservation
work and Bad
Farming
Soil Loss,
Poor
Harvest,
Hunger
and Low
animal
Feed
Unfavourabl
e location
and Forest
Clearing
2000
1994
Increased
Decreased
No Borehole
water supply
and Poor
pond
Disease
and Poor
Hygiene
Crop
Damage,
Poor
Harvest,
Livestock
death and
Homes
Damage
No good
community
pond and No
Borehole
Water
Coping
Strategy
Asset sell,
Governmen
t Aid,
Community
help, Food
Sharing and
Meal
Reduction
Water
Purchase
and use
Djjo River
Seed Aid by
Governmen
t,
Re_sowing
and
Community
Help
24
Page 18 of 38

Wereda Disaster
Risk Profile
Data_Collected_Date
December 2011
Region S.N.N.P
Zone ALABA SPECIAL
Selected Indictor: Disaster Characteristics By Kebele
Kebele Name
Disaster_Type
Common Period
Year Occured
ANDEGNA TUKA
Droughts
February,
March, April
and May
1977, 1986,
1991 and
2000
Floods
June, August
and July
Every Year
Disaster Risk Management
and Food Security Sector (DRMFSS)
Wednesday, September 3, 2014
Wereda ALABA SPECIAL
Worst_Year
1977
Trends of
Effects
Increased
1998 and
2001
Decreased
Root Causes Effects
Vulnerability
Erratic
rainfall
distribution
and Forest
Degradation
Hunger,
Crop
failure,
Livestock
loss and
Disease
Poor
Farming
System and
Forest
Removal
Topography
and Forest
Degradation
Crop
damage,
Soil loss
and Gully
expansion
on farm
land
Poor
Farming
Practice,
Forest
Degradation
or removal
and Poor
Land
Management
Coping
Strategy
Selling of
Livestock,
Selling of
Firewood,
Governmen
t aid,
Renting
land and
Migrating to
Better
Families
Replanting,
Governmen
t Aid,
Cannot
Diversion
water way
and Ditch
25
Page 19 of 38
Wereda Disaster
Risk Profile
Data_Collected_Date
December 2011
Region S.N.N.P
Zone ALABA SPECIAL
Selected Indictor: Disaster Characteristics By Kebele
Kebele Name
Disaster_Type
Common Period
Year Occured
ANDEGNA TUKA
Shortage of
Water
December,
January,
February and
March
1977 and
2000
HULETEGNA
TUKA
Snow
Droughts
July and August
February,
March, April
and May
1998 and
2001
1977, 1986,
1991 and
2000
Disaster Risk Management
and Food Security Sector (DRMFSS)
Wednesday, September 3, 2014
Wereda ALABA SPECIAL
Worst_Year
2000
Trends of
Effects
Decreased
Root Causes Effects
Vulnerability
Insufficient
Borehole
Construction,
No river and
Erratic
Rainfall
Time and
Labour
loss,
Health
Problem
and
Livestock
productivi
ty
decreasin
g
1998
1977
Decreased
Decreased
High rainfall
or Storm
Erratic
Rainfall
forest
Degrade
Crop
Damage
Crop loss,
Livestock
loss,
Hunger
and
Disease
Poor
Farming
System and
Forest
Removal
Coping
Strategy
Traveling
Long
distance to
search
water or
purchase,
Consumptio
n reduction
specially
for
livestock
drinking
two times
per week
Replanting
By selling of
Livestock,
By selling of
firewood,
Governmen
t Aid and
26
Page 20 of 38

Wereda Disaster
Risk Profile
Data_Collected_Date
December 2011
Region S.N.N.P
Zone ALABA SPECIAL
Selected Indictor: Disaster Characteristics By Kebele
Kebele Name
Disaster_Type
Common Period
Year Occured
HULETEGNA
TUKA
Floods
June, July and
August
Every Year
Shortage of
Water
December up
to March
Every year
Snow
July and August
1998 and
2001
Disaster Risk Management
and Food Security Sector (DRMFSS)
Wednesday, September 3, 2014
Wereda ALABA SPECIAL
Worst_Year
2001
Trends of
Effects
Decreased
2000
Decreased
1998
Decreased
Root Causes Effects
Vulnerability
High Rainfall,
Topography
and
Deforestation
Erratic
rainfall,
Insufficient
water point
and No River
Crop
Loss, Soil
loss,
Gully
expansion
on farm
Land and
Breaking
Road
Time and
Labour
loss,
Livestock
productivi
ty
decreasin
g
Poor land
Management
and Poor
farming
Practice
High Rainfall
Crop
Damage
Coping
Strategy
Replanting
and Ditch
Consumptio
n Limiting
meaning
specially
livestock
drinking
two times
within a
week and
Community
Pond
Constructio
n
Replanting
and Ditch
27
Page 21 of 38

Wereda Disaster
Risk Profile
Data_Collected_Date
December 2011
Region S.N.N.P
Zone ALABA SPECIAL
Selected Indictor: Disaster Characteristics By Kebele
Kebele Name
Disaster_Type
Common Period
Year Occured
ASHEKORA BOTI
Droughts
February,
March, April
and May
1977, 1986
and 2000
Shortage of
Water
December,
June, February
and March
Every year
Disaster Risk Management
and Food Security Sector (DRMFSS)
Wednesday, September 3, 2014
Wereda ALABA SPECIAL
Worst_Year
1977
Trends of
Effects
Increased
2000
Increased
Root Causes Effects
Vulnerability
Erratic
rainfall and
Forest
Degradation
Hunger,
Crop
failure,
Livestock
loss and
Human
Disease
Poor farming
System and
Degrading
forest
Insufficient
Borehole
construction
and Erratic
rainfall
Time and
Labour
loss,
Health
Problem,
and
Livestock
productio
n
Decrease
Coping
Strategy
By selling of
firewood,
On
government
food aid, By
renting land
and By
selling of
livestock
Water
Purchase
from
Distance
area and
Consumptio
n reduction
specially
livestock
drinking
two time
within a
week
28
Page 22 of 38

Wereda Disaster
Risk Profile
Data_Collected_Date
December 2011
Region S.N.N.P
Zone ALABA SPECIAL
Selected Indictor: Disaster Characteristics By Kebele
Kebele Name
Disaster_Type
Common Period
Year Occured
ASHEKORA BOTI
Floods
June, August
and July
Every Year
Livestock
diseases
September and
April
1977 and
2000
Snow
July and August
1993 and
2001
Disaster Risk Management
and Food Security Sector (DRMFSS)
Wednesday, September 3, 2014
Wereda ALABA SPECIAL
Worst_Year
1998
Trends of
Effects
Decreased
2000
Decreased
1998
Decreased
Root Causes Effects
Vulnerability
High Rainfall
and Forest
Degradation
Absence of
animal Local
centre
Crop
damage,
Soil loss,
Breaking
good and
Gully
expansion
on farm
land
Livestock
loss
Poor
Farming
Practice and
Forest
Degrading
Poor
Management
and Poor
awareness of
Vaccination
High Rainfall
Crop
damage
loss
Coping
Strategy
Governmen
t aid,
Replanting
or sowing
and Ditch
Governmen
t
vaccination
support,
Feed
Purchase
and
Treatment
Replanting
and
Governmen
t aid
29
Page 23 of 38

Wereda Disaster
Risk Profile
Data_Collected_Date
December 2011
Region S.N.N.P
Zone ALABA SPECIAL
Selected Indictor: Disaster Characteristics By Kebele
Kebele Name
Disaster_Type
Common Period
Year Occured
BUBESA
Droughts
February,
March, April
and May
1977, 1986,
1991 and
2000
Floods
June, August
and July
Every year
Disaster Risk Management
and Food Security Sector (DRMFSS)
Wednesday, September 3, 2014
Wereda ALABA SPECIAL
Worst_Year
1977
Trends of
Effects
Increased
1998
Decreased
Root Causes Effects
Vulnerability
Erratic
rainfall
distribution
and forest
degradation
Hunger,
crop
failure,
livestock
and
disease
Poor farming
system and
Forest
removal
Topography,
forest and
Degradation
Crop
damage,
soil loss,
Gully
expansion
on farm
land
Poor farming
practice,
forest
degradation
or remove
and poor
land
management
Coping
Strategy
Selling of
livestock,
selling of
firewood,
Governmen
t Aid and
Renting
land
Replanting ,
Governmen
t aid and
Ditch
30
Page 24 of 38

Wereda Disaster
Risk Profile
Data_Collected_Date
December 2011
Region S.N.N.P
Zone ALABA SPECIAL
Selected Indictor: Disaster Characteristics By Kebele
Kebele Name
Disaster_Type
Common Period
Year Occured
BUBESA
Shortage of
Water
December,
January,
February and
March
1977 and
2000
CHEMBULA
Snow
Droughts
July and August
February, May
and September
1998 and
2001
1977, 1995
and 2000
Disaster Risk Management
and Food Security Sector (DRMFSS)
Wednesday, September 3, 2014
Wereda ALABA SPECIAL
Worst_Year
2000
Trends of
Effects
Decreased
Root Causes Effects
Vulnerability
No bore hole
construction
and Erratic
Rainfall
Time and
Labour
loss,
Health
problem,
Livestock
productivi
ty
decrease
1998
1977
Decreased
Decreased
High rainfall
Storm
Lack of
rainfall, Land
Degradation
and
Deforestation
Crop
damage
Crop loss,
Livestock
loss,
Hunger
and
Disease
Bad Farming
Practices,
High
Population
Growth and
Forest
removal
Coping
Strategy
Water
purchase,
Traveling
long
distance,
consumptio
n reduction
specially
livestock
drinking
two times
per week
Replanting
Community
help,
Governmen
t Aid, Land
Rent,
Livestock
sell, soil
and water
conservatio
n work
31
Page 25 of 38

Wereda Disaster
Risk Profile
Data_Collected_Date
December 2011
Region S.N.N.P
Zone ALABA SPECIAL
Selected Indictor: Disaster Characteristics By Kebele
Kebele Name
Disaster_Type
Common Period
Year Occured
CHEMBULA
Floods
June, July,
August and
September
1994, 2003
and 1998
GERME
Floods
June and
August
Every year
Droughts
February to
April
1977, 1986,
1991 and
2000
Disaster Risk Management
and Food Security Sector (DRMFSS)
Wednesday, September 3, 2014
Wereda ALABA SPECIAL
Worst_Year
1994
Trends of
Effects
Decreased
2001
Increased
1977
Decreased
Root Causes Effects
Vulnerability
Lack of
rainfall, Land
Degradation
and
Deforestation
Poor
Yield, Soil
loss and
Large
Gully
Bad Farming
Practices,
High
Population
Growth and
Forest
removal
Deforestation
, Topography
and High
rainfall
Erratic
rainfall and
Forest
Degradation
Crop loss,
soil or
land loss,
Gully
expansion
and
Breaking
Road
Crop loss,
Livestock
loss,
hunger
and death
Deforestatio
n, poor
farming
practice and
Poor land
management
Forest
Removal and
Poor farming
System
Coping
Strategy
Community
help,
Governmen
t Aid, Land
Rent,
Livestock
sell, soil
and water
conservatio
n work
Ditch or
Diversion
Canal and
Replanting
Selling of
Livestock,
Governmen
t food aid,
Renting
land and
Selling of
firewood
32
Page 26 of 38
Wereda Disaster
Risk Profile
Data_Collected_Date
December 2011
Region S.N.N.P
Zone ALABA SPECIAL
Selected Indictor: Disaster Characteristics By Kebele
Kebele Name
Disaster_Type
Common Period
Year Occured
GERME
Shortage of
Water
December and
March
Every year
Snow
Livestock
diseases
July to August
1998 and
2001
October to May
2000
Disaster Risk Management
and Food Security Sector (DRMFSS)
Wednesday, September 3, 2014
Wereda ALABA SPECIAL
Worst_Year
Trends of
Effects
2000
Increased
1998
Decreased
Root Causes Effects
Vulnerability
No river,
erratic
rainfall and
No borehole
High rainfall
time and
labour
loss,
livestock
productivi
ty
decreasin
g and
Health
Problem
Crop
damage
2000
Decreased
Water
shortage and
Forage
shortage
Livestock
loss
No enough
food supply
Coping
Strategy
Purchasing
water from
distance
area and
Consumptio
n reduction
Replanting
and
Governmen
t aid
Treatment,
Improve
supply of
food and
Pond
Constructio
n
33
Page 27 of 38

Wereda Disaster
Risk Profile
Data_Collected_Date
December 2011
Region S.N.N.P
Zone ALABA SPECIAL
Selected Indictor: Disaster Characteristics By Kebele
Kebele Name
Disaster_Type
Common Period
Year Occured
AMATA
Droughts
February,
March, April
and May
1977, 1986,
1991 and
2000
Floods
June, July and
August
Every year
Disaster Risk Management
and Food Security Sector (DRMFSS)
Wednesday, September 3, 2014
Wereda ALABA SPECIAL
Worst_Year
1977
Trends of
Effects
Decreased
2001
Increased
Root Causes Effects
Vulnerability
Erratic
rainfall
distribution
Crop loss,
Livestock
loss,
Hunger
and
Disease
Poor farming
system and
forest
removal
Topography,
Deforestation
and High
rainfall
Crop
failure,
Gully
expansion
on farm
land and
Soil loss
Poor
Farming
Practice,
Forest
removal and
Poor Land
Management
Coping
Strategy
By selling of
livestock,
Selling of
firewood,
Governmen
t aid,
Renting
land and
Migrating
with in
Wereda to
Border
Replanting,
Constructin
g diversion
water way,
Governmen
t aid and
Ditch
34
Page 28 of 38

Wereda Disaster
Risk Profile
Data_Collected_Date
December 2011
Region S.N.N.P
Zone ALABA SPECIAL
Selected Indictor: Disaster Characteristics By Kebele
Kebele Name
Disaster_Type
Common Period
Year Occured
AMATA
Snow
December,
January,
February and
March
2000
Snow
July, August
and June
1979 and
2001
Disaster Risk Management
and Food Security Sector (DRMFSS)
Wednesday, September 3, 2014
Wereda ALABA SPECIAL
Worst_Year
2000
Trends of
Effects
Decreased
Root Causes Effects
Vulnerability
No borehole,
No river,
Erratic
rainfall
Time and
Labour
loss,
Health
Problem,
and
Livestock
productio
n
Decrease
2001
Decreased
High rain or
Storm
Crop loss
and Crop
damage
Coping
Strategy
Water
Purchase
from
Distance
area,
Consumptio
n Limiting
specially
livestock
drinking
two time
with in a
week, Pond
constructio
n, Traveling
long
distance to
search
water
Seed
replanting
35
Page 29 of 38

Wereda Disaster
Risk Profile
Data_Collected_Date
December 2011
Region S.N.N.P
Zone ALABA SPECIAL
Selected Indictor: Disaster Characteristics By Kebele
Kebele Name
Disaster_Type
Common Period
Year Occured
HOLUGEB KUKE
Droughts
May, February
and
September
1977, 2003,
1995 and
2000
Floods
July, August
and April
1954, 1994
and 2003
Water Pollution
January,
February and
March
Every Year
Livestock
diseases
May and
September
1977, 1995
and 2000
Disaster Risk Management
and Food Security Sector (DRMFSS)
Wednesday, September 3, 2014
Wereda ALABA SPECIAL
Worst_Year
2000
Trends of
Effects
Increased
1994
Decreased
Decreased
2000
Decreased
Root Causes Effects
Vulnerability
Deforestation
, Land
Degradation
and Increase
in Population
Crop
Failure,
Livestock
Death and
Hunger
Forest
Removal,
Bad Farming
Practice and
Increase in
Population
Deforestation
and Bad
Farming
System
Soil loss,
Crop loss
and Low
Yield
Forest
Removal,
Bad Farming
Practice and
Increase in
Population
Dead animals
Flesh Which
is thrown
near river
Poor
management
and low Feed
Disease
Animal
Death and
Low yield
Dead
animals
disposal
system is
poor
Backward
Management
Coping
Strategy
Community
Help,
Governmen
t Aid, Land
Rent and
Livestock
sell
Community
Help,
Governmen
t Aid, Land
Rent and
Livestock
sell
Water
Boiling
Treatment
and
Improve
Feed supply
36
Page 30 of 38

Wereda Disaster
Risk Profile
Data_Collected_Date
December 2011
Region S.N.N.P
Zone ALABA SPECIAL
Selected Indictor: Disaster Characteristics By Kebele
Kebele Name
Disaster_Type
Common Period
Year Occured
KULFO
Soil Erosion
April, June and
July
Every year
Droughts
March, April
and May
1977, 1996
and 2000
Shortage of
Water
February,
March, April
and May
1977, 1996,
2000 and
2001
METO DUBALE
Floods
June, August
and July
1997, 1999
and 2001
Disaster Risk Management
and Food Security Sector (DRMFSS)
Wednesday, September 3, 2014
Wereda ALABA SPECIAL
Worst_Year
Trends of
Effects
Increased
1977
Decreased
2000
Increased
1999
Increased
Root Causes Effects
Vulnerability
Degradation
and Forest
removal
Degradation
and Forest
removal
No Borehole
water and
poor pond
Soil loss,
Poor
Harvest
and
Drought
Livestock
death,
Crop loss,
Hunger
and Death
Disease,
Low
productivi
ty and
Extra cost
Unfavorable
Location
Unfavorable
Location
Unfavorable
Location
Forest
Removal
Crop
Damage,
Human
Displacem
ent and
Asset loss
Unfavourabl
e or flood
line Location
Coping
Strategy
Soil and
Water
conservatio
n Works
Asset sell,
Governmen
t Aid and
Community
help
Water
Purchase
from far
areas,
water
sharing and
use of pond
water
Community
help,
Governmen
t Aid and
Diversion
canal
37
Page 31 of 38

Wereda Disaster
Risk Profile
Data_Collected_Date
December 2011
Region S.N.N.P
Zone ALABA SPECIAL
Selected Indictor: Disaster Characteristics By Kebele
Kebele Name
Disaster_Type
Common Period
Year Occured
METO DUBALE
Droughts
February, May
and
September
1977, 1996,
and 2000
Snow
July and August
2001 and
1998
SINBITA
Floods
June, July and
August
1998, 2000,
2001 and
2003
Snow
December Up
to March
Every Year
Disaster Risk Management
and Food Security Sector (DRMFSS)
Wednesday, September 3, 2014
Wereda ALABA SPECIAL
Worst_Year
1977
Trends of
Effects
Increased
1998
Decreased
2001
Increased
Root Causes Effects
Vulnerability
Degradation
and
Deforestation
Water from
the
Surrounding
High land
Crop loss,
Livestock
loss and
Disease
Crop
damage
and Yield
Reduction
Crop
Damage,
Human
Displacem
ent and
Disease
Unfavourabl
e location
and
Deforestatio
n
Bad
Topography
2001
Increased
No clean
Water Supply
Disease,
Poor
Sanitation
and Low
Productivi
ty
Absence of
Borehole
water and
Poor Pond
Coping
Strategy
Governmen
t aid,
community
help and
Asset sell
Migrating to
high land
area,
Evacuation
and
Governmen
t Aid
Fetch from
Pond,
Distant area
travel in
search of
water
38
Page 32 of 38

Wereda Disaster
Risk Profile
Data_Collected_Date
December 2011
Region S.N.N.P
Zone ALABA SPECIAL
Selected Indictor: Disaster Characteristics By Kebele
Kebele Name
Disaster_Type
Common Period
Year Occured
SINBITA
Livestock
diseases
June and
September
2000 and
2002
Droughts
May, February
and April
1977, 1996
and 2000
TACHEGNAWO
BEDANE
Soil Erosion
June, July and
August
Droughts
February and
May
2000
Crop Pest
July and June
2001
Disaster Risk Management
and Food Security Sector (DRMFSS)
Wednesday, September 3, 2014
Wereda ALABA SPECIAL
Worst_Year
2000
Trends of
Effects
Decreased
1977
Decreased
Increased
1977 and
2000
Increased
2001
Decreased
Root Causes Effects
Vulnerability
Drought,
Seed
Shortage and
Unclean
water
Deforestation
and
Degradation
Low
Animal
Productio
n and
Human
Disease
Crop
Failure
and
Hunger
Disease
Poor food
supply and
Mismanagem
ent
Unfavourabl
e location
Topography,
Erratic
Rainfall and
Deforestation
Deforestation
Erratic
rainfall
Crop
Failure
and Soil
loss
Crop
Failure,
Livestock
loss and
Soil loss
Poor
Harvest
High
farming,
population
pressure and
less land
Holding
Forest
removal
Coping
Strategy
Treatment,
Using crop
residue as
feed
Food
sharing,
Livestock
sale and
Governmen
t
Livestock,
Daily labour
and Land
Renting
Livestock,
Daily labour
and Land
Renting
Using
Pesticide
39
Page 33 of 38

Wereda Disaster
Risk Profile
Data_Collected_Date
December 2011
Region S.N.N.P
Zone ALABA SPECIAL
Selected Indictor: Disaster Characteristics By Kebele
Kebele Name
Disaster_Type
Common Period
Year Occured
TACHEGNAWO
BEDANE
Human diseases
October to May
2000 to 2001
Snow
July and August
2001
TETALI BITORA
Droughts
February,
March, April
and May
1977, 1986
and 2002
Disaster Risk Management
and Food Security Sector (DRMFSS)
Wednesday, September 3, 2014
Wereda ALABA SPECIAL
Worst_Year
Trends of
Effects
Decreased
2001
Increased
1977
Increased
Root Causes Effects
Vulnerability
Poor
sanitation
and Poor
Water supply
Erratic
rainfall
Distribution
and forest
degradation
Death,
Limits
labour
force
Crop
damage
and Low
Productio
n
Hunger,
Crop
failure,
Livestock
loss and
Human
Disease
No pure
water supply
and Poor
Hygiene
Poor
Farming
System,
Degrading
Forest and
Charcoal
making
Coping
Strategy
Treatment,
Using Clean
water and
Sanitation
Replanting
or Sowing
By selling of
firewood,
On
government
food aid, By
Renting
Land and By
selling of
livestock
40
Page 34 of 38

Wereda Disaster
Risk Profile
Data_Collected_Date
December 2011
Region S.N.N.P
Zone ALABA SPECIAL
Selected Indictor: Disaster Characteristics By Kebele
Kebele Name
Disaster_Type
Common Period
Year Occured
TETALI BITORA
Shortage of
Water
December,
January,
February and
March
Every Year
Disaster Risk Management
and Food Security Sector (DRMFSS)
Wednesday, September 3, 2014
Wereda ALABA SPECIAL
Worst_Year
2000
Trends of
Effects
Increased
Root Causes Effects
Vulnerability
Insufficient
borehole
Construction
and Erratic
rainfall
Time and
Labour
loss,
Health
problem
and
Livestock
productivi
ty
decreasin
g
Coping
Strategy
Water
Purchase
from
Distance
area,
Consumptio
n Limiting
specially
livestock
drinking
two time
within a
week,
Traveling
long
distance to
search
water
41
Page 35 of 38

Wereda Disaster
Risk Profile
Data_Collected_Date
December 2011
Region S.N.N.P
Zone ALABA SPECIAL
Selected Indictor: Disaster Characteristics By Kebele
Kebele Name
Disaster_Type
Common Period
Year Occured
TETALI BITORA
Floods
June, August
and July
Every Year
WETETA
Droughts
April and May
1977, 2000
and 1996
Shortage of
Water
December and
March
1977, 2000
and 1996
Disaster Risk Management
and Food Security Sector (DRMFSS)
Wednesday, September 3, 2014
Wereda ALABA SPECIAL
Worst_Year
1998 and
2001
Trends of
Effects
Decreased
2000
Decreased
1977
Increased
Root Causes Effects
Vulnerability
Forest
Degradation
Deforestation
No water
Point and No
river
Crop
damage,
soil loss,
Breaking
Road,
Livestock
loss,
Gully
formation
and
expansion
farm land
Animal
Death,
Crop
failure
and
Hunger
Livestock
death,
Extra cost
and water
Born
disease
Poor farming
Practice,
Forest
degrading
and Poor Soil
and Water
Conservation
Practice
Forest
Removal and
Bad
Topography
Limited
pond
excavated
and no
water point
construction
Coping
Strategy
Governmen
t aid,
Replanting
or sowing,
Displacing
or
Evacuation
and Ditch
Constructio
n
Aid from
Relative,
Animal Sell
and Land
Rent
Fetch From
pond,
Distant area
travel for
water and
They sell 20
litter water
with 20 birr
42
Page 36 of 38

Wereda Disaster
Risk Profile
Data_Collected_Date
December 2011
Region S.N.N.P
Zone ALABA SPECIAL
Selected Indictor: Disaster Characteristics By Kebele
Kebele Name
Disaster_Type
Common Period
Year Occured
WETETA
Livestock
diseases
September and
June
2000 and
2001
YAMBI
Shortage of
Water
December to
March
2000
Droughts
April, May,
March
1977 and
2000
Human diseases
October and
November
2000
Disaster Risk Management
and Food Security Sector (DRMFSS)
Wednesday, September 3, 2014
Wereda ALABA SPECIAL
Worst_Year
Trends of
Effects
2000
Decreased
2000
Increased
2000
Increased
2001
Decreased
Root Causes Effects
Vulnerability
Drought and
Feed
shortage
Livestock
death,
Extra cost
and water
Born
disease
No feed For
Animal
No borehole
water and
River
No rain and
Deforestation
Poor Hygiene
and No water
Water
born
disease,
Livestock
loss, Farm
time lose,
time and
Labour
loss
Livestock
lose and
Crop
failure
Extra cost
and No
labour for
work
Deforestatio
n, Forest
Removal and
Poor
Farming
System
Poor
Sanitation
and No pure
Water
Coping
Strategy
Treatment,
water and
food supply
from far
areas and
crop
residue use
Traveling
long
distance to
search
water or
purchase
water and
Consumptio
n reduction
Food aid,
Beg From
relative,
Livestock
sell and
land rent
Treatment
43
Page 37 of 38
Wereda Disaster
Risk Profile
Disaster Risk Management
and Food Security Sector (DRMFSS)
Data_Collected_Date
December 2011
Wednesday, September 3, 2014
Region S.N.N.P
Zone ALABA SPECIAL
Wereda ALABA SPECIAL
Selected Indictor: Disaster Characteristics By Kebele
Kebele Name
Disaster_Type
Common Period
Year Occured Worst_Year
Trends of
Effects
Root Causes
Effects
Vulnerability
Coping
Strategy
YAMBI
Crop Pest
May and June
2001
2000 and
2001
Decreased
Livestock
diseases
October and
May
2000
2000 and
2001
Decreased
IMPORTANT: The years and months mentoned in this report are according to Ethiopian Calendar (EC).
Pest attack
Crop Loss
No crop
rotation
Water
shortage and
Forage
shortage
Livestock
loss
No enough
food supply
Use of
pesticide
and weed
control
manually
Treatment
and
Improve
Supply of
feed
44
Page 38 of 38
Wereda Disaster
Risk Profile
Data_Collected_Date
December 2011
Region S.N.N.P
Zone ALABA SPECIAL
Selected Indictor: Hazards: Conflict as an Issue
KebeleName
MESERAK GORTANCHO
KOBO GETO
Description_Of_Conflict
Land Shortage
Land Shortage
TEFO CHUFO
METO DUBALE
Land Shortage
Land Shortage
HABIBO FURANA
SINBITA
CHEMBULA
WEJEGO YATO
ANDEGNA TEFO
SORGE DARGOSA
BUKET BAME
HOLUGEB KUKE
WETETA
ANDEGNA KONCHA
KULFO
NEGELE WEDESH
Land Shortage
Land Shortage
Land Shortage
Land Shortage
Land Shortage
Family Conflict Occurring
Miner Conflict with Salute Borders Due to Forage
land
Miner or lower conflict due to land shortage
Increasing Land Scarcity
Land Shortage
Land Shortage
Conflict due to land
Disaster Risk Management
and Food Security Sector
Wednesday, September 3, 2014
Wereda ALABA SPECIAL
Change_In_Last_Decade
Increasing Conflict
Increasing Conflict
Increasing Family conflict
Increasing Family Conflict
Family Conflict
Increasing
Increasing family Conflict
Increasing Conflict
Increasing Conflict
Increasing
Increasing
Increasing
Increase Scarcity
Increasing Conflict
Increasing Conflict
Increasing
Main_Causes_Of_Conflict
45
Page 1 of 2

Wereda Disaster
Risk Profile
Data_Collected_Date
December 2011
Region S.N.N.P
Zone ALABA SPECIAL
Selected Indictor: Hazards: Conflict as an Issue
KebeleName
ASHEKORA BOTI
TETALI BITORA
Description_Of_Conflict
Conflict due to Land
Conflict due to Land
Disaster Risk Management
and Food Security Sector
Wednesday, September 3, 2014
Wereda ALABA SPECIAL
Change_In_Last_Decade
Increasing
Increasing
Main_Causes_Of_Conflict
46
Page 2 of 2

Wereda Disaster
Risk Profile
Disaster Risk Management
and Food Security Sector (DRMFSS)
Data_Collected_Date
December 2011
Wednesday, September 3, 2014
Region S.N.N.P
Zone
ALABA SPECIAL
Wereda
ALABA SPECIAL
Selected Indicator: Hazard Situation During Last Disaster - Characteristics of most recent disasters that affected the community
KebeleName
Types of Disasters
Hazard_Description
Effect_Of_Disaster
Most_Severly_Affected
Reason
MESERAK
GORTANCHO
KOBO GETO
Drought
Drought
TEFO CHUFO
Drought
METO DUBALE
Floods
HABIBO FURANA
Drought
Sever, Affected the whole kebele the
Duration was February to May and
April to August Respectively
Moderately sever, Covering the whole
kebele and the Duration was February
to May
Crop Failure, Disease,
Soil loss and Hunger
Crop Failure, Hunger,
Water shortage,
Livestock Death and
Disease
Poor
Poor Households
Very sever, Affected the whole
kebele and Duration is February to
May and April to August respectively
Soil loss, Poor
Harvest, Disease,
Degradation, Hunger
and Livestock Loss
Poor Households
Moderately sever affected 60% of the
Kebele and Duration February and
May for Drought. June To September
for Flood
A Very severe Problem and Affecting
the Whole Kebele
Crop loss, Asset loss,
Food Shortage and
Disease
Poor Households
Crop Failure, Poor
Livestock Production,
Disease and Hunger
Poor Households
47
They have less
capacity or asset
The reason behind
this groups of
community have
very low asset and
hence are
vulnerable to any
shocks
This groups of
community have no
or Very low
capacity or asset
and hence are
vulnerable to any
shocks
They Have no or
low asset, they are
poor and
Vulnerable to
Shocks
Because they Have
low income and are
vulnerable to
Shocks
Page 1 of 5

Wereda Disaster
Risk Profile
Disaster Risk Management
and Food Security Sector (DRMFSS)
Data_Collected_Date
December 2011
Wednesday, September 3, 2014
Region S.N.N.P
Zone
ALABA SPECIAL
Wereda
ALABA SPECIAL
Selected Indicator: Hazard Situation During Last Disaster - Characteristics of most recent disasters that affected the community
KebeleName
Types of Disasters
Hazard_Description
Effect_Of_Disaster
Most_Severly_Affected
Reason
SINBITA
CHEMBULA
Floods
Drought
WEJEGO YATO
Drought
ANDEGNA TEFO
SORGE DARGOSA
Floods
Floods
BUKET BAME
Floods
Highly sever, affected almost 70 % of
the kebele and Duration was June to
August
Severe affecting the whole kebele
and the duration was February to May
Migration, Crop
damage and Animal
Death
Crop failure, Hunger,
Disease and Livestock
Death
Poor Households,
Children and Women
Poor Households
Sever, Covering the whole kebele and
the Duration was February Up to May
Crop Failure, Disease,
Hunger and Livestock
Death
Poor Households
Highly sever, covers 70% of the
Kebele and it is from February to May
Sever, affected almost the whole
Kebele and Mainly occurs June, July
and August
The disaster was Moderately sever,
affected 50% of the Kebele and
Duration was June to August
Erosion, crop Failure
and Asset loss
Soil Degradation and
Crop Failure
Poor Households
Poor and Middle
Households
Hunger, Asset loss and
Disease
Poor Households,
Children and Women
Are Vulnerable to
shocks, they have
no other income
and less capable
Because this groups
of community or
poor has no ability
our asset to resist
the effects of
drought
It is Because this
groups of
community have
low asset or
income, so they are
already liable to
any miner shocks
They have no or low
asset and Income
They have no or low
coping ability
Because they are
susceptible to shock
48
Page 2 of 5

Wereda Disaster
Risk Profile
Disaster Risk Management
and Food Security Sector (DRMFSS)
Data_Collected_Date
December 2011
Wednesday, September 3, 2014
Region S.N.N.P
Zone
ALABA SPECIAL
Wereda
ALABA SPECIAL
Selected Indicator: Hazard Situation During Last Disaster - Characteristics of most recent disasters that affected the community
KebeleName
Types of Disasters
Hazard_Description
Effect_Of_Disaster
Most_Severly_Affected
Reason
HOLUGEB KUKE
WETETA
Drought
Drought
ANDEGNA KONCHA
Drought
KULFO
Drought
LAYEGNAWO LENDA
Drought
TACHEGNAWO
BEDANE
HULETEGNA
MEKALA
Drought
Shortage of Water
Moderately sever, affected the whole
kebele and Duration was May to
September
Highly sever, Affected the whole
Kebele and It was April and May for
Drought and August for Snow
Highly sever, affected the whole
Kebele and Duration was May to
September
Very sever, covers the whole Kebele
and The Duration was February to
May
February to April sever
February to April and Sever
It covers almost 50% of Kebele and
Moderately severe Problem
Hunger, Disease, Poor
or Low Harvest
Hunger, Farm time
Dalliance, Water
Shortage and Poor
Harvest
Crop Failure, Asset
loss and shortage of
water
Disease, asset loss,
Hunger and Livestock
death
Hunger, Disease and
asset depletion
Poor Households,
Children and Women
Poor Households
Poor Households
Poor Households
Children, Women and
Most of Poor Households
Hunger, Disease and
asset depletion
Children, Women and
Poor Households
Water Borne disease,
Poor sanitation and
Miscarriage
Poor and Very Poor
Households
They are
Susceptible to
shock
They have no
assets, they are
already Vulnerable
Groups
They have no or low
asset
They are Vulnerable
to shocks, since
they have low
Capacity
Because they are
poor and
Susceptible to
Shock
Because they are
poor and
Susceptible to
Shock
Because they have
no income to
Purchase water
49
Page 3 of 5

Wereda Disaster
Risk Profile
Disaster Risk Management
and Food Security Sector (DRMFSS)
Data_Collected_Date
December 2011
Wednesday, September 3, 2014
Region S.N.N.P
Zone
ALABA SPECIAL
Wereda
ALABA SPECIAL
Selected Indicator: Hazard Situation During Last Disaster - Characteristics of most recent disasters that affected the community
KebeleName
Types of Disasters
Hazard_Description
Effect_Of_Disaster
Most_Severly_Affected
Reason
HULETEGNA TUKA
Drought
NEGELE WEDESH
Drought
HANTEZO
Drought
AYMELE
Drought
ANDEGNA TUKA
Drought
MEJA
Drought
February to April sever
February to April sever, Cover the
whole Kebele
From December to April sever
February and April sever and Cover
The Whole Kebele
February to April sever
From February to April and January
sever
Hunger disease asset
Depletion
Children, Women and
Most of Poor Households
Hunger, Disease and
asset depletion
Children, Women and
Most of Poor Households
Hunger, Disease, Asset
depletion and water
shortage
Children, Women and
Poor Households
Hunger, Disease and
asset depletion
Children, Women and
Most of Poor Households
Hunger, Disease and
asset depletion
Children, Women and
Most of Poor Households
Hunger, Disease and
Asset Depletion
Children, Women and
Poor Households
Because they are
poor and
Susceptible to
Shock
Because they are
poor and
Susceptible to
Shock
Because they are
poor and
Susceptible to
Shock
Because they are
poor and
Susceptible to
Shock
Because they are
poor and
Susceptible to
Shock
Because they are
poor and
Susceptible to
Shock
50
Page 4 of 5
Wereda Disaster
Risk Profile
Disaster Risk Management
and Food Security Sector (DRMFSS)
Data_Collected_Date
December 2011
Wednesday, September 3, 2014
Region S.N.N.P
Zone
ALABA SPECIAL
Wereda
ALABA SPECIAL
Selected Indicator: Hazard Situation During Last Disaster - Characteristics of most recent disasters that affected the community
KebeleName
ASHEKORA BOTI
Types of Disasters
Drought
YAMBI
AMATA
Drought
Drought
TETALI BITORA
Drought
GERME
Drought
BUBESA
Drought
Hazard_Description
February to April sever and Cover the
whole Kebele
It was a month delay of rainfall
February to April sever
From February to April sever and
Cover the whole Kebele
February to April Sever
February to April Sever
Effect_Of_Disaster
Hunger, Disease and
Asset Depletion
Hunger and Crop
failure
Hunger, Disease and
Asset Depletion
Hunger, Disease and
Asset Depletion
Hunger, Disease and
Asset Depletion
Hunger, Disease and
Asset Depletion
Most_Severly_Affected
Children, Women and
Poor Households
Poor households
Children, Women and
Poor Households
Children, Women and
Poor Households
Poor households
Children, Women and
Most of Poor Households
Reason
Because they are
poor and
Susceptible to
Shock
They are
Susceptible to
shock
Because they are
poor and
Susceptible to
Shock
Because they are
poor and
Susceptible to
Shock
Because they are
poor and
Susceptible to
Shock
Because they are
poor and
Susceptible to
Shock
51
Page 5 of 5
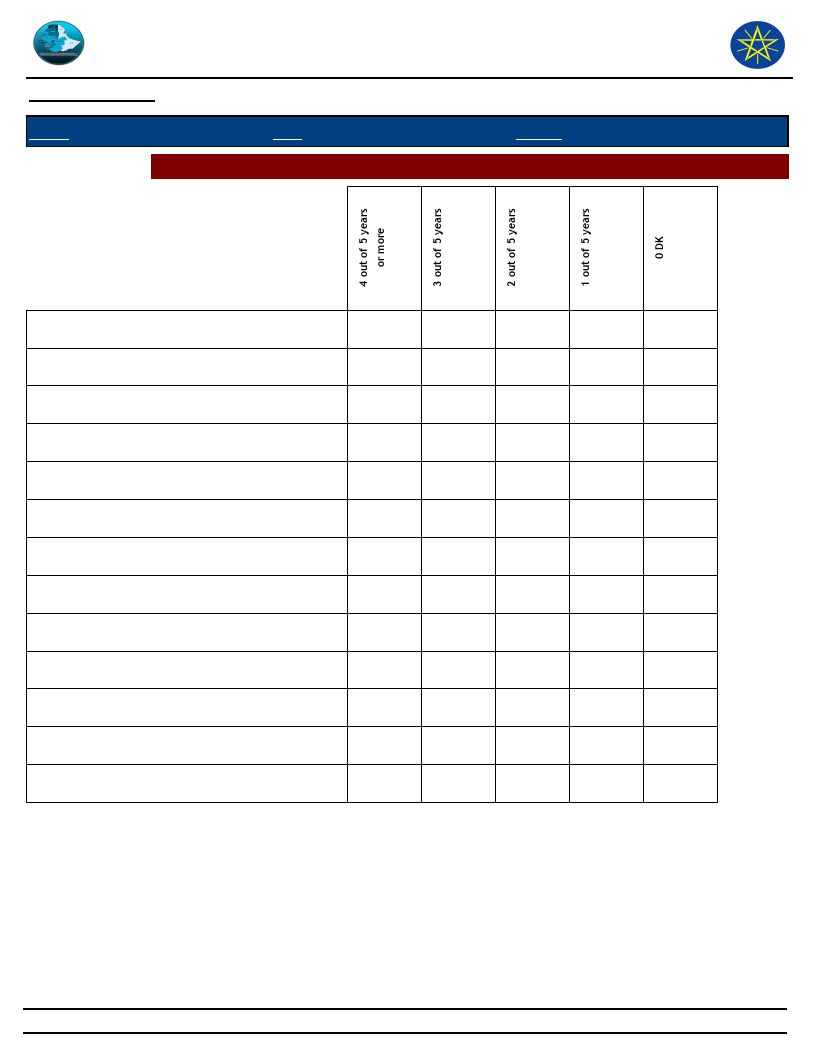
Wereda Disaster
Risk Profile
Data_Collected_Date
December 2011
Disaster Risk Management
and Food Security Sector (DRMFSS)
Wednesday, September 3, 2014
Region S.N.N.P
Zone ALABA SPECIAL
Selected Indictor: Frequency of Disaster Occurrence
Wereda ALABA SPECIAL
Conflicts
Crop diseases
Droughts
Earthquake
Economic / Price shock
Floods
Frost / Cold waves
Heat waves/ High temp
Heavy Rain
Human diseases
Landslides
Livestock diseases
Storms / Cyclone/hail storm
100.00
26.00
33.00
21.00
20.00
1.00
18.00
32.00
28.00
22.00
0.00
100.00
50.00
50.00
18.00
21.00
22.00
40.00
100.00
29.00
29.00
14.00
29.00
75.00
25.00
43.00
16.00
15.00
24.00
10.00
10.00
80.00
44.00
30.00
8.00
18.00
40.00
40.00
15.00
5.00
52
Page 1 of 1
Wereda Disaster
Risk Profile
Data_Collected_Date
December 2011
Disaster Risk Management
and Food Security Sector (DRMFSS)
Wednesday, September 3, 2014
Region
S.N.N.P
Zone
ALABA SPECIAL
Selected Indictor:
Household Exposure to Hazards
Wereda
ALABA SPECIAL
Disaster Type
Droughts
Floods
Landslides
General_Exposure
30.44
23.15
1.82
Last_Five_Years_Exposure
30.51
23.41
1.36
Crop diseases
Livestock diseases
Human diseases
Storms / Cyclone/hail storm
Heavy Rain
Frost / Cold waves
Heat waves/ High temp
11.79
7.72
7.93
15.01
0.75
0.75
11.08
7.84
7.94
15.99
0.42
0.10
0.73
Conflicts
Economic / Price shock
Earthquake
No Disaster
0.43
0.21
0.11
0.21
0.10
0.11
0.10
53
Page 1 of 1
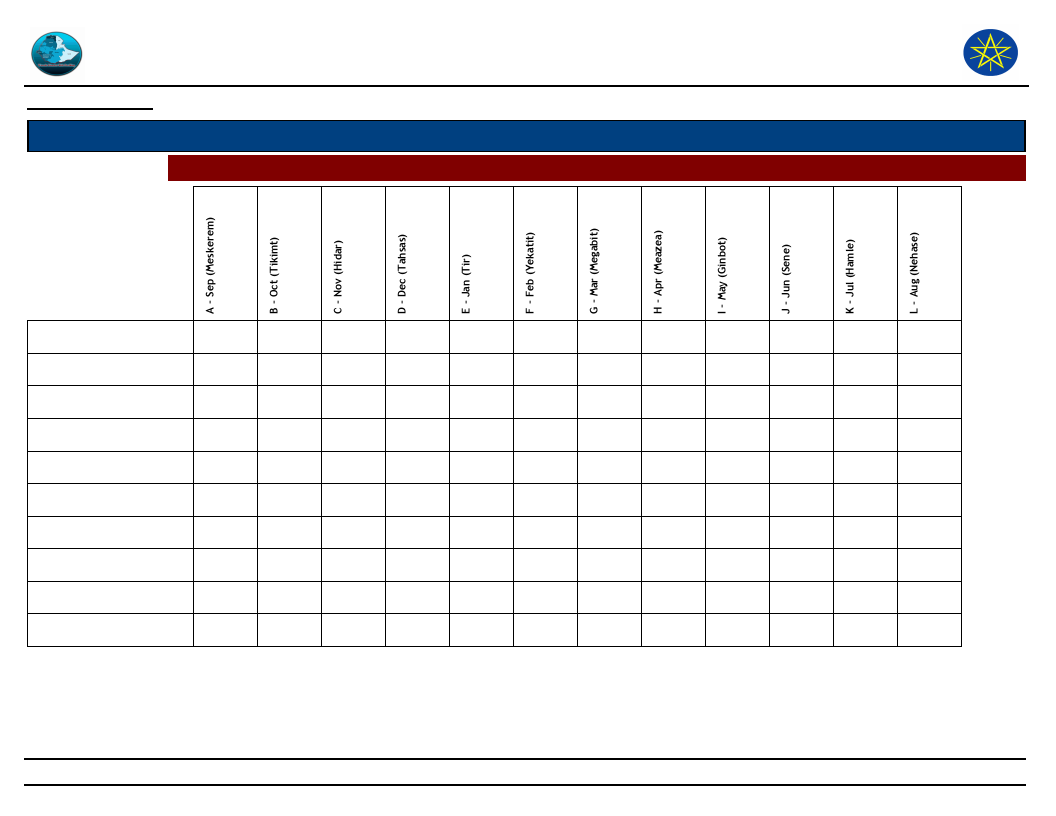
Wereda Disaster
Risk Profile
Data_Collected_Date
December 2011
Region S.N.N.P
Selected Indictor:
Zone ALABA SPECIAL
Months of Occurrence of Frequent Disasters
Disaster Risk Management
and Food Security Sector
Wednesday, September 3, 2014
Wereda ALABA SPECIAL
Crop diseases
Droughts
Earthquake
Floods
Heat waves/ High temp
Heavy Rain
Human diseases
Landslides
Livestock diseases
Storms / Cyclone/hail sto
2.06
0.37
1.10
0.74
0.37
0.92
14.29
14.29
1.56
14.06
28.13
14.06
2.09
2.09
5.66
2.09
0.73
1.46
2.06
1.03
8.25
15.46
46.39
24.74
0.74
2.94
10.66
14.34
44.12
5.51
4.41
14.71
100.00
3.23
8.76
8.76
24.88
43.78
9.68
42.86
14.29
14.29
50.00
50.00
4.69
6.25
4.69
6.25
3.13
4.69
3.13
9.38
15.38
15.38
23.08
30.77
7.69
7.69
9.53
9.53
4.17
16.67
12.10
30.62
5.45
1.46
7.30
13.14
39.42
36.50
54
Page 1 of 1
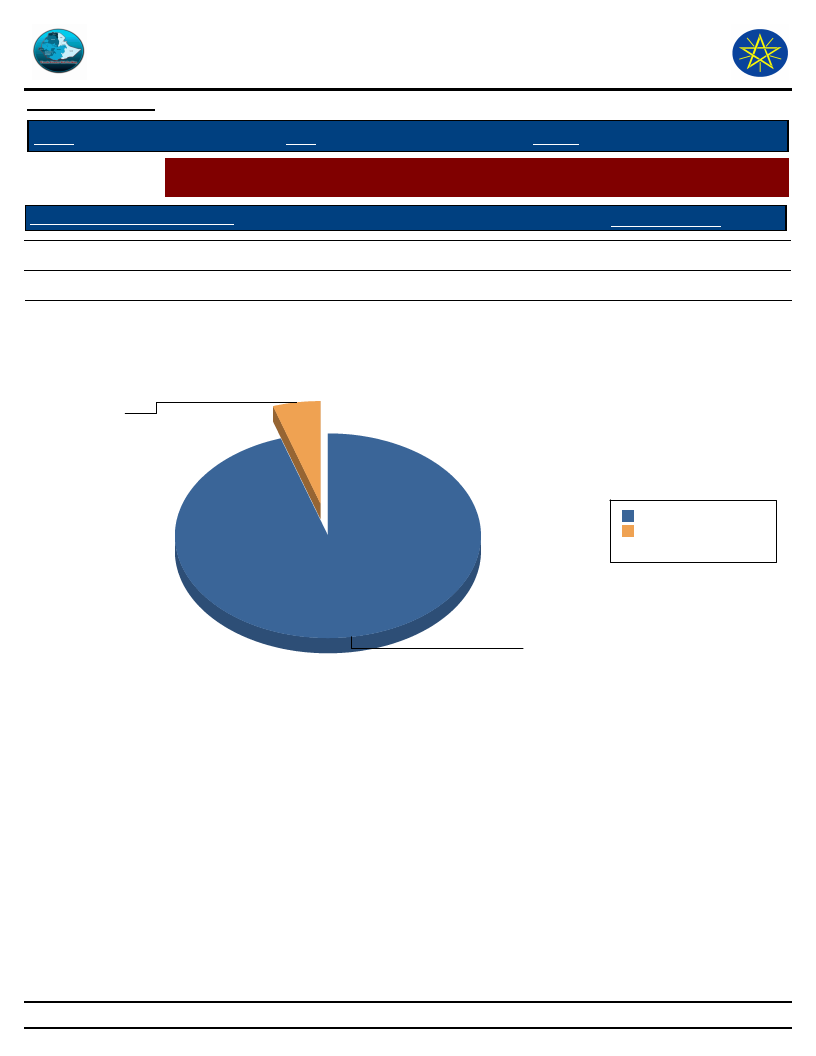
Wereda Disaster
Risk Profile
Disaster Risk Management
and Food Security Sector (DRMFSS)
Data_Collected_Date December 2011
Region S.N.N.P
Zone ALABA SPECIAL
Wednesday, September 3, 2014
Wereda ALABA SPECIAL
Selected Indictor:
Conflicts: Perception of households on conflict issues - Is conflict an issue in this
community?
Is Conflict an Issue in Community?
Response_Percent
Yes
4.97
No
95.03
Is Conflict an Issue in Community?
Yes
5.0
No
95.0
No 95.0 95.0%
Yes 5.0 5.0%
Total: 100 100.0%
55
Page 1 of 1
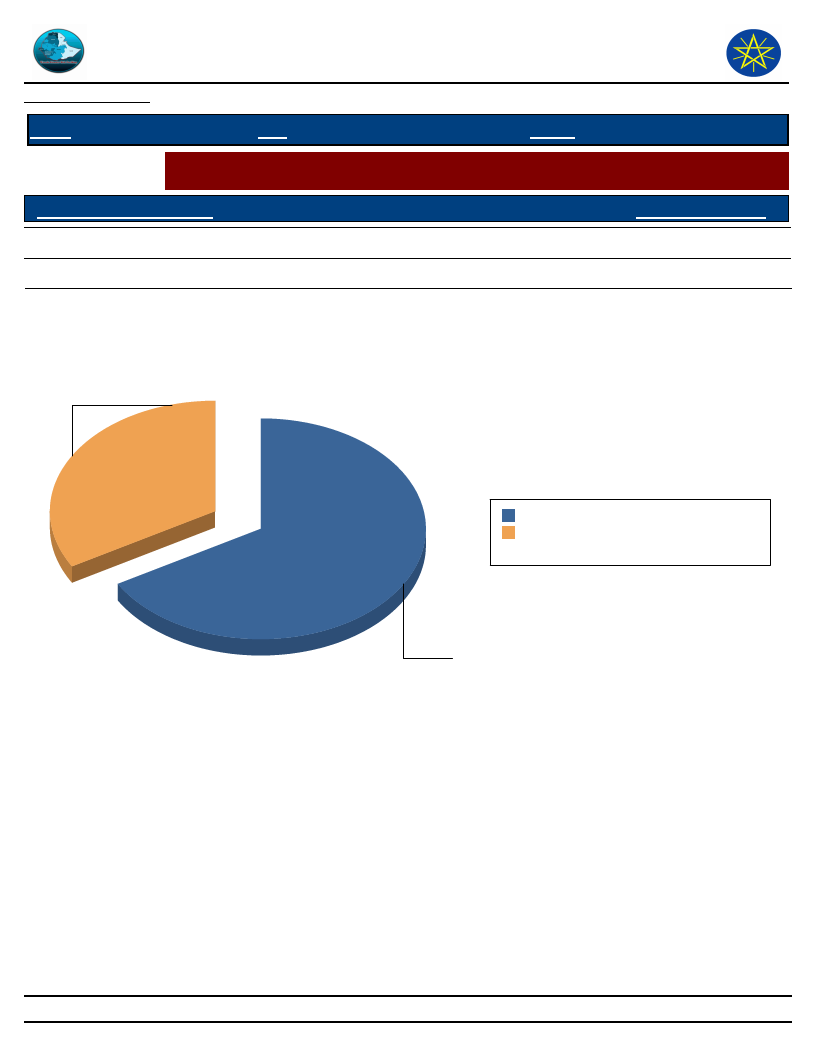
Wereda Disaster
Risk Profile
Data_Collected_Date
December 2011
Disaster Risk Management
and Food Security Sector (DRMFSS)
Wednesday, September 3, 2014
Region S.N.N.P
Zone ALABA SPECIAL
Wereda ALABA SPECIAL
Selected Indictor:
Conflicts: Perception of households on conflict issues - Who To Turn To in case of
Conflict?
Who To Turn During Conflict?
Response_Percentage
Elders
66.67
Wereda administration
33.33
Who To Turn During Conflict?
Wereda administration
33
Elders
67 66.7%
Wereda administration 33 33.3%
Total:
100 100.0%
Elders
67
56
Page 1 of 1

Wereda Disaster
Risk Profile
Data_Collected_Date
December 2011
Disaster Risk Management
and Food Security Sector (DRMFSS)
Wednesday, September 3, 2014
Region S.N.N.P
Selected Indictor:
Type of Loss
Zone ALABA SPECIAL
Wereda ALABA SPECIAL
Losses from Disasters - Losses from all disasters (household response in %)
Main_Loss_Percent
Secondary_Loss_Percent
Physical damages on houses and property
Crop damage
Livestock damage
Death of household members
Illness/health problems
Loss of access to social services, including school
Loss of income
Loss of savings
Livestock were stolen
Lost access to grazing land
Lost access to water source
Had to flee/change residence area
Other losses/damages
6.30
49.68
17.02
3.99
4.20
0.00
9.98
2.10
0.00
1.26
3.89
1.26
0.32
2.80
9.62
15.23
1.71
9.62
0.85
34.35
11.33
0.12
3.78
6.21
3.78
0.61
57
Page 1 of 1

Wereda Disaster
Risk Profile
Data_Collected_Date
December 2011
Disaster Risk Management
and Food Security Sector (DRMFSS)
Wednesday, September 3, 2014
Region S.N.N.P
Selected Indictor:
Type of Loss
Zone ALABA SPECIAL
Wereda ALABA SPECIAL
Losses from Disasters - Main Losses by Type of Disasters (household response in %)
Type of Disasters which mainly caused Listed Losses
Crop damage
51.92
48.97
Death of household
members
Had to flee/change
residence area
Illness/health problems
0.96
0.34
0.96
50.00
2.05
Livestock damage
4.81
26.71
66.37
28.57
4.93
1.79
100.00
4.04
14.29
1.32
30.77
2.70
78.29
44.74
2.70
36.84
1.32
79.73
5.26
58
Page 1 of 3
Wereda Disaster
Risk Profile
Data_Collected_Date
December 2011
Disaster Risk Management
and Food Security Sector (DRMFSS)
Wednesday, September 3, 2014
Region S.N.N.P
Selected Indictor:
Type of Loss
Zone ALABA SPECIAL
Wereda ALABA SPECIAL
Losses from Disasters - Main Losses by Type of Disasters (household response in %)
Type of Disasters which mainly caused Listed Losses
Loss of income
Loss of savings
Lost access to grazing
land
Lost access to water
source
Other losses/damages
30.77
6.16
50.00
9.42
50.00
5.77
0.68
50.00
2.69
0.96
10.27
100.00
0.45
0.90
14.29
28.57
3.95
15.38
10.81
5.92
10.53
1.35
0.66
38.46
0.66
1.32
7.69
0.66
59
Page 2 of 3

Wereda Disaster
Risk Profile
Data_Collected_Date
December 2011
Disaster Risk Management
and Food Security Sector (DRMFSS)
Wednesday, September 3, 2014
Region S.N.N.P
Selected Indictor:
Type of Loss
Zone ALABA SPECIAL
Wereda ALABA SPECIAL
Losses from Disasters - Main Losses by Type of Disasters (household response in %)
Type of Disasters which mainly caused Listed Losses
Physical damages on
houses and property
3.85
4.79
9.42
14.29
100.00
7.69
2.70
8.55
60
Page 3 of 3
Wereda Disaster
Risk Profile
Data_Collected_Date
December 2011
Disaster Risk Management
and Food Security Sector (DRMFSS)
Wednesday, September 3, 2014
Region S.N.N.P
Selected Indictor:
Zone ALABA SPECIAL
Wereda ALABA SPECIAL
Losses from Disasters - Secondary Losses by Type of Disasters (household response in %)
Type of Loss
Type of Disasters which caused Listed Secondary Losses
Crop damage
Death of household
members
Had to flee/change
residence area
Illness/health problems
Livestock damage
2.27
11.28
100.00
7.95
1.50
2.27
3.76
25.94
14.06
25.00
14.29
13.11
50.00
100.00
6.56
1.57
13.54
5.51
8.33
1.64
6.25
25.00
19.05
41.67
31.50
50.00
7.81
50.00
47.62
8.33
7.09
61
Page 1 of 3

Wereda Disaster
Risk Profile
Data_Collected_Date
December 2011
Disaster Risk Management
and Food Security Sector (DRMFSS)
Wednesday, September 3, 2014
Region S.N.N.P
Selected Indictor:
Zone ALABA SPECIAL
Wereda ALABA SPECIAL
Losses from Disasters - Secondary Losses by Type of Disasters (household response in %)
Type of Loss
Type of Disasters which caused Listed Secondary Losses
Livestock were stolen
Loss of access to social
services, including school
Loss of income
Loss of savings
Lost access to grazing land
1.14
54.55
100.00
22.73
26.69
7.14
3.76
1.56
35.94
10.94
4.17
62
1.59
0.79
9.52
62.30
16.54
8.33
6.56
0.79
7.09
1.59
16.67
1.64
Page 2 of 3
Wereda Disaster
Risk Profile
Data_Collected_Date
December 2011
Disaster Risk Management
and Food Security Sector (DRMFSS)
Wednesday, September 3, 2014
Region S.N.N.P
Selected Indictor:
Zone ALABA SPECIAL
Wereda ALABA SPECIAL
Losses from Disasters - Secondary Losses by Type of Disasters (household response in %)
Type of Loss
Type of Disasters which caused Listed Secondary Losses
Lost access to water source
Other losses/damages
Physical damages on houses
and property
3.41
16.92
3.28
1.13
5.68
1.88
1.04
0.52
25.00
4.17
25.00
8.33
8.66
1.59
50.00
4.76
8.33
4.92
20.47
63
Page 3 of 3

Wereda Disaster
Risk Profile
Data_Collected_Date
December 2011
Disaster Risk Management and
Food Security Sector (DRMFSS)
Wednesday, September 3, 2014
Region S.N.N.P
Zone ALABA SPECIAL
Wereda ALABA SPECIAL
Selected Indictor: Seasonal Calendar for Hazards, Activities and Income Level By Kebele
Month of Hazard
Kebele
AMATA
Major_Problems /Disasters
Hazard Severity
Rank
Agricultural_Activities
Income
Level Rank
A - Sep (Meskerem)
----
Livestock Production
8th
B - Oct (Tikimt)
----
Livestock Production
1st
C - Nov (Hidar)
----
Harvesting and Livestock Production
2nd
D - Dec (Tahsas)
Water shortage
2
Harvesting and Livestock Production
2nd
E - Jan (Tir)
water shortage
2
Livestock Production
3rd
F - Feb (Yekatit)
Drought and water shortage
2
Livestock Production
4th
G - Mar (Megabit)
Drought and water shortage
3
Livestock Production
5th
H - Apr (Meazea)
Drought
3
Land Preparation and Livestock Production
7th
I - May (Ginbot)
Drought
3
Sowing and Livestock production
9th
J - Jun (Sene)
Flood and Snow
3
Sowing or weeding and Livestock production
10th
K - Jul (Hamle)
Flood and Snow
3
Weeding and Livestock Production
11th
L - Aug (Nehase)
Flood and Snow
3
Weeding and Livestock Production
12th
NOTE: Hazard Severity Rank helps prioritize the more severe hazards that have occurred in the months of disaster occurrence, 3 being the worst and 1
the least severe hazards.
64
Page 1 of 29
Wereda Disaster
Risk Profile
Data_Collected_Date
December 2011
Disaster Risk Management and
Food Security Sector (DRMFSS)
Wednesday, September 3, 2014
Region S.N.N.P
Zone ALABA SPECIAL
Wereda ALABA SPECIAL
Selected Indictor: Seasonal Calendar for Hazards, Activities and Income Level By Kebele
Month of Hazard
Major_Problems /Disasters
Kebele
ANDEGNA KONCHA
Hazard Severity
Rank
Agricultural_Activities
Income
Level Rank
A - Sep (Meskerem)
Animal Disease
1
Livestock Production
8th
B - Oct (Tikimt)
Animal Disease
1
1st
C - Nov (Hidar)
----
Harvesting
2nd
D - Dec (Tahsas)
Water shortage
3
Harvesting
1st
E - Jan (Tir)
Water shortage
----
3rd
F - Feb (Yekatit)
drought
2
--
G - Mar (Megabit)
drought
2
--
H - Apr (Meazea)
----
Land Preparation
6th
I - May (Ginbot)
drought
3
Sowing
9th
J - Jun (Sene)
Erosion
2
Weeding or Planting
10th
K - Jul (Hamle)
Erosion
2
Livestock Production
11th
L - Aug (Nehase)
Erosion
2
Livestock Production
12th
NOTE: Hazard Severity Rank helps prioritize the more severe hazards that have occurred in the months of disaster occurrence, 3 being the worst and 1
the least severe hazards.
65
Page 2 of 29

Wereda Disaster
Risk Profile
Data_Collected_Date
December 2011
Disaster Risk Management and
Food Security Sector (DRMFSS)
Wednesday, September 3, 2014
Region S.N.N.P
Zone ALABA SPECIAL
Wereda ALABA SPECIAL
Selected Indictor: Seasonal Calendar for Hazards, Activities and Income Level By Kebele
Month of Hazard
Major_Problems /Disasters
Kebele
ANDEGNA TEFO
Hazard Severity
Rank
Agricultural_Activities
Income
Level Rank
A - Sep (Meskerem)
Human Disease
2
Livestock Production
9th
B - Oct (Tikimt)
Disease
2
--
C - Nov (Hidar)
----
Harvesting
4th
D - Dec (Tahsas)
----
Harvesting
1st
Kebele
ANDEGNA TUKA
A - Sep (Meskerem)
----
Weeding and Livestock Production
2nd
B - Oct (Tikimt)
----
Livestock Production
6th
C - Nov (Hidar)
----
Harvesting and Livestock Production
4th
D - Dec (Tahsas)
Water shortage
2
Harvesting and Livestock Production
1st
E - Jan (Tir)
Water shortage
2
Livestock Production
2nd
F - Feb (Yekatit)
Drought and water shortage
3
Livestock Production
3rd
G - Mar (Megabit)
Drought and water shortage
3
Livestock Production
5th
NOTE: Hazard Severity Rank helps prioritize the more severe hazards that have occurred in the months of disaster occurrence, 3 being the worst and 1
the least severe hazards.
66
Page 3 of 29
Wereda Disaster
Risk Profile
Data_Collected_Date
December 2011
Disaster Risk Management and
Food Security Sector (DRMFSS)
Wednesday, September 3, 2014
Region S.N.N.P
Zone ALABA SPECIAL
Wereda ALABA SPECIAL
Selected Indictor:
Month of Hazard
H - Apr (Meazea)
Seasonal Calendar for Hazards, Activities and Income Level By Kebele
Major_Problems /Disasters
Drought
Hazard Severity
Rank
3
Agricultural_Activities
Land Preparation and Livestock Production
Income
Level Rank
9th
I - May (Ginbot)
Drought
3
Sowing and Livestock Production
8th
J - Jun (Sene)
Flood
3
Weeding and Livestock Production
10th
K - Jul (Hamle)
Flood and Snow
3
Weeding and Sowing
11th
L - Aug (Nehase)
Flood and Snow
3
Weeding and Livestock Production
12th
Kebele
ASHEKORA BOTI
A - Sep (Meskerem)
Animal Disease
2
Livestock Production
7th
B - Oct (Tikimt)
----
Livestock Production
6th
C - Nov (Hidar)
----
Harvesting and Livestock Production
4th
D - Dec (Tahsas)
Water shortage
3
Harvesting and Livestock Production
1st
E - Jan (Tir)
water shortage
3
Livestock Production
2nd
F - Feb (Yekatit)
Drought and water shortage
3
Livestock Production
3rd
G - Mar (Megabit)
Drought and water shortage
3
Livestock Production
5th
NOTE: Hazard Severity Rank helps prioritize the more severe hazards that have occurred in the months of disaster occurrence, 3 being the worst and 1
the least severe hazards.
67
Page 4 of 29

Wereda Disaster
Risk Profile
Data_Collected_Date
December 2011
Disaster Risk Management and
Food Security Sector (DRMFSS)
Wednesday, September 3, 2014
Region S.N.N.P
Zone ALABA SPECIAL
Wereda ALABA SPECIAL
Selected Indictor:
Month of Hazard
H - Apr (Meazea)
Seasonal Calendar for Hazards, Activities and Income Level By Kebele
Major_Problems /Disasters
Drought
Hazard Severity
Rank
3
Agricultural_Activities
Land Preparation and Livestock Production
Income
Level Rank
9th
I - May (Ginbot)
Drought
3
Sowing, Weeding and Livestock Production
8th
J - Jun (Sene)
Flood
3
Weeding and Livestock Production
10th
K - Jul (Hamle)
Flood and Snow
3
Weeding and Livestock Production
11th
L - Aug (Nehase)
Flood and Snow
3
Weeding and Livestock Production
12th
Kebele
AYMELE
A - Sep (Meskerem)
----
Livestock Production
7th
B - Oct (Tikimt)
----
Livestock Production
6th
C - Nov (Hidar)
----
Harvesting and Livestock Production
4th
D - Dec (Tahsas)
Water shortage
2
Harvesting and Livestock Production
1st
E - Jan (Tir)
Water shortage
2
Livestock Production
2nd
F - Feb (Yekatit)
Drought and water shortage
3
Livestock Production
3rd
G - Mar (Megabit)
Drought and water shortage
3
Livestock Production
5th
NOTE: Hazard Severity Rank helps prioritize the more severe hazards that have occurred in the months of disaster occurrence, 3 being the worst and 1
the least severe hazards.
68
Page 5 of 29

Wereda Disaster
Risk Profile
Data_Collected_Date
December 2011
Disaster Risk Management and
Food Security Sector (DRMFSS)
Wednesday, September 3, 2014
Region S.N.N.P
Zone ALABA SPECIAL
Wereda ALABA SPECIAL
Selected Indictor:
Month of Hazard
H - Apr (Meazea)
Seasonal Calendar for Hazards, Activities and Income Level By Kebele
Major_Problems /Disasters
Drought
Hazard Severity
Rank
3
Agricultural_Activities
Land Preparation and Livestock Production
Income
Level Rank
9th
I - May (Ginbot)
Drought
3
Sowing and Livestock Production
8th
J - Jun (Sene)
Flood
3
Weeding and Livestock Production
10th
K - Jul (Hamle)
Flood and Snow
3
Weeding and Livestock Production
11th
L - Aug (Nehase)
Flood and Snow
3
Weeding and Livestock Production
12th
Kebele
BUBESA
A - Sep (Meskerem)
----
Weeding and Livestock Production
7th
B - Oct (Tikimt)
----
Livestock Production
6th
C - Nov (Hidar)
----
Harvesting and Livestock Production
4th
D - Dec (Tahsas)
Water shortage
2
Harvesting and Livestock Production
1st
E - Jan (Tir)
water shortage
2
Livestock Production
2nd
F - Feb (Yekatit)
Drought and water shortage
2
Livestock Production
3rd
G - Mar (Megabit)
Drought and water shortage
3
Livestock Production
5th
NOTE: Hazard Severity Rank helps prioritize the more severe hazards that have occurred in the months of disaster occurrence, 3 being the worst and 1
the least severe hazards.
69
Page 6 of 29

Wereda Disaster
Risk Profile
Data_Collected_Date
December 2011
Disaster Risk Management and
Food Security Sector (DRMFSS)
Wednesday, September 3, 2014
Region S.N.N.P
Zone ALABA SPECIAL
Wereda ALABA SPECIAL
Selected Indictor:
Month of Hazard
H - Apr (Meazea)
Seasonal Calendar for Hazards, Activities and Income Level By Kebele
Major_Problems /Disasters
Drought
Hazard Severity
Rank
3
Agricultural_Activities
Land Preparation and Livestock Production
Income
Level Rank
9th
I - May (Ginbot)
Flood
3
Sowing and Livestock production
8th
J - Jun (Sene)
Flood and Snow
3
weeding and Livestock production
10th
K - Jul (Hamle)
Flood and Snow
3
Weeding and Sowing
11th
L - Aug (Nehase)
----
Weeding and Livestock Production
12th
Kebele
BUKET BAME
A - Sep (Meskerem)
Human disease Malaria or Drought
1
Livestock
7th
B - Oct (Tikimt)
Animal Disease
1
Livestock
6th
C - Nov (Hidar)
----
Harvesting
4th
F - Feb (Yekatit)
Drought
3
--
H - Apr (Meazea)
3
Land Preparation
9th
I - May (Ginbot)
Drought
3
Sowing and Land Preparation
8th
J - Jun (Sene)
Snow or Flood
1
Sowing or Weeding
10th
NOTE: Hazard Severity Rank helps prioritize the more severe hazards that have occurred in the months of disaster occurrence, 3 being the worst and 1
the least severe hazards.
70
Page 7 of 29

Wereda Disaster
Risk Profile
Data_Collected_Date
December 2011
Disaster Risk Management and
Food Security Sector (DRMFSS)
Wednesday, September 3, 2014
Region S.N.N.P
Zone ALABA SPECIAL
Wereda ALABA SPECIAL
Selected Indictor:
Month of Hazard
K - Jul (Hamle)
Seasonal Calendar for Hazards, Activities and Income Level By Kebele
Major_Problems /Disasters
Flood
Hazard Severity
Rank
3
Agricultural_Activities
Weeding or Animal Production
Income
Level Rank
11th
L - Aug (Nehase)
Flood
3
Weeding or Animal Production
12th
Kebele
CHEMBULA
A - Sep (Meskerem)
Drought
3
Livestock production
9th
B - Oct (Tikimt)
----
6th
C - Nov (Hidar)
----
Harvesting
4th
D - Dec (Tahsas)
----
Harvesting
1st
F - Feb (Yekatit)
Drought
3
Land Preparation
3rd
G - Mar (Megabit)
Drought
3
Land Preparation
5th
H - Apr (Meazea)
7
Sowing
7th
I - May (Ginbot)
Drought
3
Weeding or sowing
8th
J - Jun (Sene)
Erosion or Flood and Snow
2
Weeding or Planting
11th
K - Jul (Hamle)
Erosion or Flood and Snow
2
Weeding or sowing
10th
NOTE: Hazard Severity Rank helps prioritize the more severe hazards that have occurred in the months of disaster occurrence, 3 being the worst and 1
the least severe hazards.
71
Page 8 of 29
Wereda Disaster
Risk Profile
Data_Collected_Date
December 2011
Disaster Risk Management and
Food Security Sector (DRMFSS)
Wednesday, September 3, 2014
Region S.N.N.P
Zone ALABA SPECIAL
Wereda ALABA SPECIAL
Selected Indictor:
Month of Hazard
L - Aug (Nehase)
Seasonal Calendar for Hazards, Activities and Income Level By Kebele
Major_Problems /Disasters
Erosion or Flood and Snow
Hazard Severity
Rank
2
Agricultural_Activities
Weeding or Livestock production
Income
Level Rank
12th
Kebele
GERME
A - Sep (Meskerem)
Livestock Production
----
Livestock Production
7th
B - Oct (Tikimt)
Animal Disease
1
Livestock Production
6th
C - Nov (Hidar)
----
Harvesting and Livestock Production
3rd
D - Dec (Tahsas)
Water shortage
3
Harvesting and Livestock Production
1st
E - Jan (Tir)
water shortage
3
Livestock Production
2nd
F - Feb (Yekatit)
Drought and water shortage
3
Livestock Production
4th
G - Mar (Megabit)
Drought and water shortage
3
Land Preparation and Livestock Production
5th
H - Apr (Meazea)
Drought
3
Sowing and Livestock production
9th
I - May (Ginbot)
Drought and Animal Disease
3
weeding and Livestock production
8th
J - Jun (Sene)
Flood
3
weeding and Livestock production
10th
K - Jul (Hamle)
Flood and Snow
3
Weeding and Livestock Production
11th
NOTE: Hazard Severity Rank helps prioritize the more severe hazards that have occurred in the months of disaster occurrence, 3 being the worst and 1
the least severe hazards.
72
Page 9 of 29

Wereda Disaster
Risk Profile
Data_Collected_Date
December 2011
Disaster Risk Management and
Food Security Sector (DRMFSS)
Wednesday, September 3, 2014
Region S.N.N.P
Zone ALABA SPECIAL
Wereda ALABA SPECIAL
Selected Indictor:
Month of Hazard
L - Aug (Nehase)
Seasonal Calendar for Hazards, Activities and Income Level By Kebele
Major_Problems /Disasters
Flood and Snow
Hazard Severity
Rank
3
Agricultural_Activities
Weeding and Livestock Production
Income
Level Rank
12th
A - Sep (Meskerem)
----
Livestock Production
7th
Kebele
HABIBO FURANA
A - Sep (Meskerem)
Malaria
1
Livestock Production
8th
B - Oct (Tikimt)
Animal Disease
1
--
C - Nov (Hidar)
----
Harvesting
2nd
D - Dec (Tahsas)
----
Harvesting
1st
E - Jan (Tir)
Water Problem
2
--
F - Feb (Yekatit)
Drought and Water Problem
3
--
G - Mar (Megabit)
Drought and Water Problem
3
Land Preparation
5th
H - Apr (Meazea)
Erosion and Water Problem
3
Land Preparation and Sowing
6th
I - May (Ginbot)
Drought and Malaria
3
Sowing
9th
J - Jun (Sene)
Erosion
3
Weeding or Planting
10th
NOTE: Hazard Severity Rank helps prioritize the more severe hazards that have occurred in the months of disaster occurrence, 3 being the worst and 1
the least severe hazards.
73
Page 10 of 29

Wereda Disaster
Risk Profile
Data_Collected_Date
December 2011
Disaster Risk Management and
Food Security Sector (DRMFSS)
Wednesday, September 3, 2014
Region S.N.N.P
Zone ALABA SPECIAL
Wereda ALABA SPECIAL
Selected Indictor:
Month of Hazard
K - Jul (Hamle)
Seasonal Calendar for Hazards, Activities and Income Level By Kebele
Major_Problems /Disasters
Erosion
Hazard Severity
Rank
3
Agricultural_Activities
Sowing and Weeding
Income
Level Rank
11th
L - Aug (Nehase)
Erosion
3
Weeding and Livestock
12th
Kebele
HANTEZO
A - Sep (Meskerem)
Animal Disease
2
Livestock Production
7th
B - Oct (Tikimt)
----
Livestock Production
6th
C - Nov (Hidar)
----
Harvesting and Livestock Production
2nd
D - Dec (Tahsas)
Drought and Water shortage
3
Harvesting and Livestock Production
1st
E - Jan (Tir)
Drought and water shortage
3
Livestock Production
3rd
F - Feb (Yekatit)
Drought and water shortage
3
Livestock Production
4th
G - Mar (Megabit)
Drought and water shortage
3
Livestock Production
5th
H - Apr (Meazea)
Drought, Animal Disease and water shortage
3
Land Preparation and Livestock Production
9th
I - May (Ginbot)
Drought
3
Sowing and Livestock Production
8th
J - Jun (Sene)
Erosion
2
Weeding and Livestock Production
10th
NOTE: Hazard Severity Rank helps prioritize the more severe hazards that have occurred in the months of disaster occurrence, 3 being the worst and 1
the least severe hazards.
74
Page 11 of 29

Wereda Disaster
Risk Profile
Data_Collected_Date
December 2011
Disaster Risk Management and
Food Security Sector (DRMFSS)
Wednesday, September 3, 2014
Region S.N.N.P
Zone ALABA SPECIAL
Wereda ALABA SPECIAL
Selected Indictor:
Month of Hazard
K - Jul (Hamle)
Seasonal Calendar for Hazards, Activities and Income Level By Kebele
Major_Problems /Disasters
Erosion
Hazard Severity
Rank
2
Agricultural_Activities
Weeding and Livestock Production
Income
Level Rank
11th
L - Aug (Nehase)
Erosion
2
Weeding and Livestock Production
12th
Kebele
HOLUGEB KUKE
A - Sep (Meskerem)
Animal Disease or drought
3
Livestock
9th
C - Nov (Hidar)
----
Harvesting
2nd
D - Dec (Tahsas)
----
Harvesting
1st
E - Jan (Tir)
Water Pollution
2
3rd
F - Feb (Yekatit)
Drought and Water Pollution
3
Land Preparation for Belg Crop
4th
G - Mar (Megabit)
Water Pollution
2
Land Preparation for Belg Crop
5th
H - Apr (Meazea)
Flood
2
Sowing
7th
I - May (Ginbot)
Animal Disease or drought
2
Weeding or sowing
8th
J - Jun (Sene)
Flood
2
Weeding or Planting
10th
K - Jul (Hamle)
Flood
2
Weeding Livestock
11th
NOTE: Hazard Severity Rank helps prioritize the more severe hazards that have occurred in the months of disaster occurrence, 3 being the worst and 1
the least severe hazards.
75
Page 12 of 29

Wereda Disaster
Risk Profile
Data_Collected_Date
December 2011
Disaster Risk Management and
Food Security Sector (DRMFSS)
Wednesday, September 3, 2014
Region S.N.N.P
Zone ALABA SPECIAL
Wereda ALABA SPECIAL
Selected Indictor:
Month of Hazard
L - Aug (Nehase)
Seasonal Calendar for Hazards, Activities and Income Level By Kebele
Major_Problems /Disasters
Flood
Hazard Severity
Rank
2
Agricultural_Activities
Livestock and Weeding
Income
Level Rank
12th
Kebele
HULETEGNA MEKALA
D - Dec (Tahsas)
----
Harvesting
1st
A - Sep (Meskerem)
----
Livestock Production
7th
B - Oct (Tikimt)
----
Livestock Production
6th
C - Nov (Hidar)
Water shortage
2
Harvesting and Livestock Production
2nd
D - Dec (Tahsas)
Water shortage
2
Harvesting and Livestock Production
1st
E - Jan (Tir)
Water shortage
2
Livestock Production
3rd
F - Feb (Yekatit)
Drought and water shortage
3
Livestock Production
4th
G - Mar (Megabit)
Drought and water shortage
3
Land Preparation and Livestock Production
5th
H - Apr (Meazea)
Drought
3
Sowing and Livestock Production
9th
I - May (Ginbot)
Drought
3
Sowing, Weeding and Livestock Production
8th
J - Jun (Sene)
Flood and Snow
3
Weeding and Livestock Production
10th
NOTE: Hazard Severity Rank helps prioritize the more severe hazards that have occurred in the months of disaster occurrence, 3 being the worst and 1
the least severe hazards.
76
Page 13 of 29
Wereda Disaster
Risk Profile
Data_Collected_Date
December 2011
Disaster Risk Management and
Food Security Sector (DRMFSS)
Wednesday, September 3, 2014
Region S.N.N.P
Zone ALABA SPECIAL
Wereda ALABA SPECIAL
Selected Indictor:
Month of Hazard
K - Jul (Hamle)
Seasonal Calendar for Hazards, Activities and Income Level By Kebele
Major_Problems /Disasters
Flood and Snow
Hazard Severity
Rank
2
Agricultural_Activities
Weeding and Livestock Production
Income
Level Rank
11th
L - Aug (Nehase)
Flood and Snow
2
Weeding and Livestock Production
12th
Kebele
HULETEGNA TUKA
A - Sep (Meskerem)
----
Livestock Production
7th
B - Oct (Tikimt)
----
Livestock Production
8th
C - Nov (Hidar)
----
Harvesting and Livestock Production
4th
D - Dec (Tahsas)
Water shortage
2
Harvesting and Livestock Production
1st
E - Jan (Tir)
----
Livestock Production
2nd
F - Feb (Yekatit)
Drought and water shortage
3
Livestock Production
3rd
G - Mar (Megabit)
Drought and water shortage
3
Livestock Production
5th
H - Apr (Meazea)
Drought and water shortage
3
Land Preparation and Livestock Production
9th
I - May (Ginbot)
Drought
3
Sowing and Livestock Production
8th
J - Jun (Sene)
Flood
3
Weeding and Livestock Production
10th
NOTE: Hazard Severity Rank helps prioritize the more severe hazards that have occurred in the months of disaster occurrence, 3 being the worst and 1
the least severe hazards.
77
Page 14 of 29

Wereda Disaster
Risk Profile
Data_Collected_Date
December 2011
Disaster Risk Management and
Food Security Sector (DRMFSS)
Wednesday, September 3, 2014
Region S.N.N.P
Zone ALABA SPECIAL
Wereda ALABA SPECIAL
Selected Indictor:
Month of Hazard
K - Jul (Hamle)
Seasonal Calendar for Hazards, Activities and Income Level By Kebele
Major_Problems /Disasters
Flood and Snow
Hazard Severity
Rank
3
Agricultural_Activities
Weeding and Livestock Production
Income
Level Rank
11th
L - Aug (Nehase)
Flood and Snow
3
Weeding and Livestock Production
12th
Kebele
KOBO GETO
A - Sep (Meskerem)
----
Livestock Production
10th
B - Oct (Tikimt)
Animal Disease
1
----
C - Nov (Hidar)
----
Harvesting
4th
D - Dec (Tahsas)
----
Harvesting
1st
F - Feb (Yekatit)
Drought
3
--
G - Mar (Megabit)
Drought
3
--
H - Apr (Meazea)
Erosion
2
Land Preparation
6th
I - May (Ginbot)
Drought
3
Sowing
8th
J - Jun (Sene)
Erosion
2
Weeding or Planting
9th
K - Jul (Hamle)
Erosion and Snow
2
weeding or Sowing
11th
NOTE: Hazard Severity Rank helps prioritize the more severe hazards that have occurred in the months of disaster occurrence, 3 being the worst and 1
the least severe hazards.
78
Page 15 of 29

Wereda Disaster
Risk Profile
Data_Collected_Date
December 2011
Disaster Risk Management and
Food Security Sector (DRMFSS)
Wednesday, September 3, 2014
Region S.N.N.P
Zone ALABA SPECIAL
Wereda ALABA SPECIAL
Selected Indictor:
Month of Hazard
L - Aug (Nehase)
Seasonal Calendar for Hazards, Activities and Income Level By Kebele
Major_Problems /Disasters
Erosion and Snow
Hazard Severity
Rank
2
Agricultural_Activities
Weeding
Income
Level Rank
12th
Kebele
KULFO
A - Sep (Meskerem)
----
Animal Products
9th
C - Nov (Hidar)
----
Harvesting or Threshing
6th
D - Dec (Tahsas)
----
Harvesting or Threshing
1st
E - Jan (Tir)
Water problem
2
--
F - Feb (Yekatit)
Water problem
2
--
G - Mar (Megabit)
Drought and water problem
3
Land Preparation
4th
H - Apr (Meazea)
Erosion, Drought and Water Problem
3
sowing
5th
I - May (Ginbot)
Drought and water problem
3
sowing
8th
J - Jun (Sene)
Erosion
3
Weeding or Planting
10th
K - Jul (Hamle)
Erosion
3
weeding or sowing
11th
L - Aug (Nehase)
----
Animal Products
12th
NOTE: Hazard Severity Rank helps prioritize the more severe hazards that have occurred in the months of disaster occurrence, 3 being the worst and 1
the least severe hazards.
79
Page 16 of 29

Wereda Disaster
Risk Profile
Data_Collected_Date
December 2011
Disaster Risk Management and
Food Security Sector (DRMFSS)
Wednesday, September 3, 2014
Region S.N.N.P
Zone ALABA SPECIAL
Wereda ALABA SPECIAL
Selected Indictor: Seasonal Calendar for Hazards, Activities and Income Level By Kebele
Month of Hazard
Major_Problems /Disasters
Kebele
LAYEGNAWO LENDA
Hazard Severity
Rank
Agricultural_Activities
Income
Level Rank
A - Sep (Meskerem)
----
Weeding or livestock production
7th
B - Oct (Tikimt)
----
Livestock production
6th
C - Nov (Hidar)
----
Harvesting or Livestock Production
4th
D - Dec (Tahsas)
Water Shortage
2
Harvesting or Livestock Production
4th
E - Jan (Tir)
Water Shortage
2
Livestock production
2nd
F - Feb (Yekatit)
Drought and Water shortage
3
Livestock production
3rd
G - Mar (Megabit)
Drought and Water shortage
3
Livestock production
5th
H - Apr (Meazea)
Drought
3
Land Preparation or Livestock
9th
I - May (Ginbot)
Drought
3
Sowing and Livestock production
8th
J - Jun (Sene)
Flood
3
Weeding or livestock production
10th
K - Jul (Hamle)
Flood and Snow
3
Weeding or livestock production
11th
L - Aug (Nehase)
Flood and Snow
3
Weeding or livestock production
12th
NOTE: Hazard Severity Rank helps prioritize the more severe hazards that have occurred in the months of disaster occurrence, 3 being the worst and 1
the least severe hazards.
80
Page 17 of 29

Wereda Disaster
Risk Profile
Data_Collected_Date
December 2011
Disaster Risk Management and
Food Security Sector (DRMFSS)
Wednesday, September 3, 2014
Region S.N.N.P
Zone ALABA SPECIAL
Wereda ALABA SPECIAL
Selected Indictor: Seasonal Calendar for Hazards, Activities and Income Level By Kebele
Month of Hazard
Kebele
MEJA
Major_Problems /Disasters
Hazard Severity
Rank
Agricultural_Activities
Income
Level Rank
A - Sep (Meskerem)
Animal Disease
3
Livestock Production
7th
B - Oct (Tikimt)
----
6th
C - Nov (Hidar)
----
Harvesting and Livestock Production
2nd
D - Dec (Tahsas)
Water shortage
2
Harvesting and Livestock Production
1st
E - Jan (Tir)
water shortage
2
Livestock Production
3rd
F - Feb (Yekatit)
Drought and water shortage
3
Livestock Production
4th
G - Mar (Megabit)
Drought and water shortage
3
Land Preparation and Livestock Production
5th
H - Apr (Meazea)
Drought and Animal Disease
3
Sowing and Livestock Production
9th
I - May (Ginbot)
Drought
3
Sowing, Weeding and Livestock Production
8th
J - Jun (Sene)
Flood
3
Weeding and Livestock Production
10th
K - Jul (Hamle)
Flood and Snow
3
Weeding and Livestock Production
11th
L - Aug (Nehase)
Flood and Snow
3
Weeding and Livestock Production
12th
NOTE: Hazard Severity Rank helps prioritize the more severe hazards that have occurred in the months of disaster occurrence, 3 being the worst and 1
the least severe hazards.
81
Page 18 of 29
Wereda Disaster
Risk Profile
Data_Collected_Date
December 2011
Disaster Risk Management and
Food Security Sector (DRMFSS)
Wednesday, September 3, 2014
Region S.N.N.P
Zone ALABA SPECIAL
Wereda ALABA SPECIAL
Selected Indictor: Seasonal Calendar for Hazards, Activities and Income Level By Kebele
Month of Hazard
Major_Problems /Disasters
Kebele
MESERAK GORTANCHO
Hazard Severity
Rank
Agricultural_Activities
Income
Level Rank
A - Sep (Meskerem)
----
Livestock Product
7th
C - Nov (Hidar)
----
Harvest
2nd
D - Dec (Tahsas)
----
Harvest
1st
F - Feb (Yekatit)
Drought
3
--
G - Mar (Megabit)
Drought
3
Land Preparation
6th
H - Apr (Meazea)
Erosion
3
Land Preparation and Sowing
8th
I - May (Ginbot)
Drought
3
Sowing
9th
J - Jun (Sene)
Snow, Flood and Erosion
2
Weeding
10th
K - Jul (Hamle)
Snow, Flood and Erosion
3
Weeding and Sowing
11th
L - Aug (Nehase)
Snow, Flood and Erosion
2
Weeding
12th
Kebele
METO DUBALE
A - Sep (Meskerem)
Drought
2
Livestock Product
9th
NOTE: Hazard Severity Rank helps prioritize the more severe hazards that have occurred in the months of disaster occurrence, 3 being the worst and 1
the least severe hazards.
82
Page 19 of 29
Wereda Disaster
Risk Profile
Data_Collected_Date
December 2011
Disaster Risk Management and
Food Security Sector (DRMFSS)
Wednesday, September 3, 2014
Region S.N.N.P
Zone ALABA SPECIAL
Wereda ALABA SPECIAL
Selected Indictor:
Month of Hazard
C - Nov (Hidar)
Seasonal Calendar for Hazards, Activities and Income Level By Kebele
Major_Problems /Disasters
Hazard Severity
Rank
----
Agricultural_Activities
Harvesting
Income
Level Rank
4th
D - Dec (Tahsas)
----
Harvesting
1st
F - Feb (Yekatit)
Drought
2
--
G - Mar (Megabit)
Drought
2
--
H - Apr (Meazea)
----
Land Preparation
7th
I - May (Ginbot)
Drought
----
Sowing and Land Preparation
6th
J - Jun (Sene)
Flooding
3
Sowing and Weeding
10th
K - Jul (Hamle)
Flooding and Snow
3
Weeding Animal Products
11th
L - Aug (Nehase)
Flooding and Snow
3
Weeding Animal Products
12th
Kebele
NEGELE WEDESH
A - Sep (Meskerem)
Animal Disease
2
Livestock production
7th
B - Oct (Tikimt)
----
Livestock production
6th
C - Nov (Hidar)
----
Harvesting or Livestock Production
4th
NOTE: Hazard Severity Rank helps prioritize the more severe hazards that have occurred in the months of disaster occurrence, 3 being the worst and 1
the least severe hazards.
83
Page 20 of 29

Wereda Disaster
Risk Profile
Data_Collected_Date
December 2011
Disaster Risk Management and
Food Security Sector (DRMFSS)
Wednesday, September 3, 2014
Region S.N.N.P
Zone ALABA SPECIAL
Wereda ALABA SPECIAL
Selected Indictor:
Month of Hazard
D - Dec (Tahsas)
Seasonal Calendar for Hazards, Activities and Income Level By Kebele
Major_Problems /Disasters
Water Shortage
Hazard Severity
Rank
1
Agricultural_Activities
Harvesting or Livestock Production
Income
Level Rank
2nd
E - Jan (Tir)
Water Shortage
2
Livestock production
2nd
F - Feb (Yekatit)
Drought and Water shortage
3
Livestock production
3rd
G - Mar (Megabit)
Drought and Water shortage
3
Livestock production
5th
H - Apr (Meazea)
Drought and Animal disease
3
Land Preparation or Livestock
9th
I - May (Ginbot)
Drought
3
Sowing and Livestock production
8th
J - Jun (Sene)
Flood and Snow
3
Weeding or livestock production
10th
K - Jul (Hamle)
Flood and Snow
3
Weeding or livestock production
11th
L - Aug (Nehase)
Flood and Snow
3
Weeding or livestock production
12th
Kebele
SINBITA
A - Sep (Meskerem)
Animal Disease
1
Livestock production
6th
C - Nov (Hidar)
----
Harvesting
2nd
D - Dec (Tahsas)
Water Shortage
2
Harvesting
1st
NOTE: Hazard Severity Rank helps prioritize the more severe hazards that have occurred in the months of disaster occurrence, 3 being the worst and 1
the least severe hazards.
84
Page 21 of 29

Wereda Disaster
Risk Profile
Data_Collected_Date
December 2011
Disaster Risk Management and
Food Security Sector (DRMFSS)
Wednesday, September 3, 2014
Region S.N.N.P
Zone ALABA SPECIAL
Wereda ALABA SPECIAL
Selected Indictor:
Month of Hazard
E - Jan (Tir)
Seasonal Calendar for Hazards, Activities and Income Level By Kebele
Major_Problems /Disasters
Water Shortage
Hazard Severity
Rank
2
Agricultural_Activities
Income
Level Rank
--
F - Feb (Yekatit)
Water Shortage
2
--
G - Mar (Megabit)
Water Shortage
2
--
H - Apr (Meazea)
Drought
2
Land preparation
8th
I - May (Ginbot)
Drought
2
Sowing
9th
J - Jun (Sene)
Flood and Animal Disease
3
Sowing or weeding
10th
K - Jul (Hamle)
Flood and Animal Disease
3
Weeding or sowing
11th
L - Aug (Nehase)
Flood and Animal Disease
3
Livestock production
12th
Kebele
SORGE DARGOSA
A - Sep (Meskerem)
Animal Disease
1
Animal Product
8th
B - Oct (Tikimt)
Animal Disease
1
--
C - Nov (Hidar)
----
Harvesting
3rd
D - Dec (Tahsas)
Water Shortage
1
Harvesting
2nd
NOTE: Hazard Severity Rank helps prioritize the more severe hazards that have occurred in the months of disaster occurrence, 3 being the worst and 1
the least severe hazards.
85
Page 22 of 29

Wereda Disaster
Risk Profile
Data_Collected_Date
December 2011
Disaster Risk Management and
Food Security Sector (DRMFSS)
Wednesday, September 3, 2014
Region S.N.N.P
Zone ALABA SPECIAL
Wereda ALABA SPECIAL
Selected Indictor:
Month of Hazard
E - Jan (Tir)
Seasonal Calendar for Hazards, Activities and Income Level By Kebele
Major_Problems /Disasters
Water shortage
Hazard Severity
Rank
1
Agricultural_Activities
Income
Level Rank
----
F - Feb (Yekatit)
Water shortage
1
----
G - Mar (Megabit)
Water shortage
1
Land Preparation
5th
H - Apr (Meazea)
Snow
2
Sowing
6th
I - May (Ginbot)
Drought
2
Sowing
9th
J - Jun (Sene)
Flood and Erosion
3
Weeding or Sowing
10th
K - Jul (Hamle)
Flood and Erosion
3
Weeding
11th
L - Aug (Nehase)
flood, Snow and Erosion
3
Animal Product
12th
Kebele
TACHEGNAWO BEDANE
A - Sep (Meskerem)
----
livestock production
8th
B - Oct (Tikimt)
Human disease
1
Livestock production
6th
C - Nov (Hidar)
----
Harvesting or Livestock Production
2nd
D - Dec (Tahsas)
----
Harvesting or Livestock Production
1st
NOTE: Hazard Severity Rank helps prioritize the more severe hazards that have occurred in the months of disaster occurrence, 3 being the worst and 1
the least severe hazards.
86
Page 23 of 29

Wereda Disaster
Risk Profile
Data_Collected_Date
December 2011
Disaster Risk Management and
Food Security Sector (DRMFSS)
Wednesday, September 3, 2014
Region S.N.N.P
Zone ALABA SPECIAL
Wereda ALABA SPECIAL
Selected Indictor:
Month of Hazard
E - Jan (Tir)
Seasonal Calendar for Hazards, Activities and Income Level By Kebele
Major_Problems /Disasters
Hazard Severity
Rank
----
Agricultural_Activities
Livestock production
Income
Level Rank
3rd
F - Feb (Yekatit)
Drought
4
Livestock production
4th
G - Mar (Megabit)
Drought
3
Livestock production
5th
H - Apr (Meazea)
Drought
2
Land Preparation, Sowing and Livestock production
7th
I - May (Ginbot)
Drought and Human Disease
3
Sowing and Livestock production
9th
J - Jun (Sene)
Soil erosion and Crop pest
3
Weeding, livestock production and Weeding
10th
K - Jul (Hamle)
Soil erosion, Crop pest and Snow
3
Weeding or livestock production
11th
L - Aug (Nehase)
Soil erosion, Crop pest and Snow
3
Weeding or livestock production
12th
Kebele
TEFO CHUFO
A - Sep (Meskerem)
Disease of Malaria
2
Livestock production
8th
B - Oct (Tikimt)
Human and Livestock disease
2
--
C - Nov (Hidar)
1
Harvesting
3rd
D - Dec (Tahsas)
----
Harvesting
1st
NOTE: Hazard Severity Rank helps prioritize the more severe hazards that have occurred in the months of disaster occurrence, 3 being the worst and 1
the least severe hazards.
87
Page 24 of 29

Wereda Disaster
Risk Profile
Data_Collected_Date
December 2011
Disaster Risk Management and
Food Security Sector (DRMFSS)
Wednesday, September 3, 2014
Region S.N.N.P
Zone ALABA SPECIAL
Wereda ALABA SPECIAL
Selected Indictor:
Month of Hazard
E - Jan (Tir)
Seasonal Calendar for Hazards, Activities and Income Level By Kebele
Major_Problems /Disasters
Water shortage
Hazard Severity
Rank
----
Agricultural_Activities
Income
Level Rank
----
F - Feb (Yekatit)
Drought and water shortage
3
----
G - Mar (Megabit)
Drought and water shortage
4
Land Preparation
5th
H - Apr (Meazea)
Erosion and Water Shortage
5
Land Preparation or sowing
6th
I - May (Ginbot)
Drought and Malaria
----
sowing or weeding
9th
J - Jun (Sene)
Erosion
3
Weeding or Planting
10th
K - Jul (Hamle)
Erosion
3
Weeding or Sowing
11th
L - Aug (Nehase)
Erosion
3
Weeding Or Livestock production
12th
Kebele
TETALI BITORA
A - Sep (Meskerem)
Animal Disease
7
Livestock Production
7th
B - Oct (Tikimt)
----
Livestock Production
6th
C - Nov (Hidar)
----
Harvesting and Livestock Production
4th
D - Dec (Tahsas)
Water shortage
2
Harvesting and Livestock Production
1st
NOTE: Hazard Severity Rank helps prioritize the more severe hazards that have occurred in the months of disaster occurrence, 3 being the worst and 1
the least severe hazards.
88
Page 25 of 29
Wereda Disaster
Risk Profile
Data_Collected_Date
December 2011
Disaster Risk Management and
Food Security Sector (DRMFSS)
Wednesday, September 3, 2014
Region S.N.N.P
Zone ALABA SPECIAL
Wereda ALABA SPECIAL
Selected Indictor:
Month of Hazard
E - Jan (Tir)
Seasonal Calendar for Hazards, Activities and Income Level By Kebele
Major_Problems /Disasters
water shortage
Hazard Severity
Rank
2
Agricultural_Activities
Livestock Production
Income
Level Rank
2nd
F - Feb (Yekatit)
Drought and water shortage
3
Livestock Production
3rd
G - Mar (Megabit)
Drought and water shortage
3
Livestock Production
5th
H - Apr (Meazea)
Drought and Animal Disease
3
Land Preparation and Livestock Production
9th
I - May (Ginbot)
Drought
3
Sowing and Livestock production
8th
J - Jun (Sene)
Flood
3
weeding and Livestock production
10th
K - Jul (Hamle)
Flood and Snow
3
Weeding and Livestock Production
11th
L - Aug (Nehase)
Flood and Snow
3
Weeding and Livestock Production
12th
Kebele
WEJEGO YATO
A - Sep (Meskerem)
Livestock product
2
Livestock Product
8th
C - Nov (Hidar)
Harvesting
4
Harvesting
4th
D - Dec (Tahsas)
Harvesting or Threshing
1
harvesting or threshing
1st
H - Apr (Meazea)
Land Preparation
6
Land Preparation
7th
NOTE: Hazard Severity Rank helps prioritize the more severe hazards that have occurred in the months of disaster occurrence, 3 being the worst and 1
the least severe hazards.
89
Page 26 of 29

Wereda Disaster
Risk Profile
Data_Collected_Date
December 2011
Disaster Risk Management and
Food Security Sector (DRMFSS)
Wednesday, September 3, 2014
Region S.N.N.P
Zone ALABA SPECIAL
Wereda ALABA SPECIAL
Selected Indictor:
Month of Hazard
I - May (Ginbot)
Seasonal Calendar for Hazards, Activities and Income Level By Kebele
Major_Problems /Disasters
Land Preparation and Sowing
Hazard Severity
Rank
9
Agricultural_Activities
Sowing
Income
Level Rank
9th
J - Jun (Sene)
Sowing, weeding and Planting
10
Weeding or Sowing
10th
K - Jul (Hamle)
Weeding or Sowing
11
Weeding or Sowing
11th
L - Aug (Nehase)
Weeding Or Livestock Product
12
Weeding or Livestock Product
12th
Kebele
WETETA
A - Sep (Meskerem)
Animal Disease
1
livestock Production
4th
B - Oct (Tikimt)
Malaria
1
livestock Production
3rd
C - Nov (Hidar)
----
Harvesting
2nd
D - Dec (Tahsas)
Water shortage
----
Harvesting
1st
F - Feb (Yekatit)
Water shortage
2
--
G - Mar (Megabit)
Water shortage
2
--
H - Apr (Meazea)
Drought
3
Land Preparation
8th
I - May (Ginbot)
Drought
3
Sowing
9th
NOTE: Hazard Severity Rank helps prioritize the more severe hazards that have occurred in the months of disaster occurrence, 3 being the worst and 1
the least severe hazards.
90
Page 27 of 29

Wereda Disaster
Risk Profile
Data_Collected_Date
December 2011
Disaster Risk Management and
Food Security Sector (DRMFSS)
Wednesday, September 3, 2014
Region S.N.N.P
Zone ALABA SPECIAL
Wereda ALABA SPECIAL
Selected Indictor:
Month of Hazard
J - Jun (Sene)
Seasonal Calendar for Hazards, Activities and Income Level By Kebele
Major_Problems /Disasters
Animal Disease
Hazard Severity
Rank
1
Agricultural_Activities
Weeding
Income
Level Rank
10th
K - Jul (Hamle)
Snow or Flood
1
Weeding
11th
L - Aug (Nehase)
Snow or Flood
1
Livestock
12th
Kebele
YAMBI
A - Sep (Meskerem)
----
Livestock Production
9th
B - Oct (Tikimt)
Animal Disease and Human disease
2
Harvesting and Livestock Production
5th
C - Nov (Hidar)
Human disease
2
Harvesting and Livestock Production
4th
D - Dec (Tahsas)
Water shortage
3
Harvesting and Livestock Production
1st
E - Jan (Tir)
water shortage
3
Livestock Production
2nd
F - Feb (Yekatit)
water shortage
2
Livestock Production
3rd
G - Mar (Megabit)
water shortage and Drought
1
Land Preparation and Livestock Production
7th
H - Apr (Meazea)
Animal Feed Shortage and Drought
3
Land Preparation and Sowing
8th
I - May (Ginbot)
Drought, Animal Disease and Pest
3
Sowing and Weeding
11th
NOTE: Hazard Severity Rank helps prioritize the more severe hazards that have occurred in the months of disaster occurrence, 3 being the worst and 1
the least severe hazards.
91
Page 28 of 29
Wereda Disaster
Risk Profile
Data_Collected_Date
December 2011
Disaster Risk Management and
Food Security Sector (DRMFSS)
Wednesday, September 3, 2014
Region S.N.N.P
Zone ALABA SPECIAL
Wereda ALABA SPECIAL
Selected Indictor:
Month of Hazard
J - Jun (Sene)
Seasonal Calendar for Hazards, Activities and Income Level By Kebele
Major_Problems /Disasters
Flood, Snow and Crop pest
Hazard Severity
Rank
3
Agricultural_Activities
Weeding and Livestock Production
Income
Level Rank
12th
K - Jul (Hamle)
Flood and Snow
3
Weeding and Livestock Production
9th
L - Aug (Nehase)
Flood and Snow
3
Weeding and Livestock Production
10th
NOTE: Hazard Severity Rank helps prioritize the more severe hazards that have occurred in the months of disaster occurrence, 3 being the worst and 1
the least severe hazards.
92
Page 29 of 29
WDRP Indicators
Infrastructure Access Characteristics
93
Data_Collected_Date
December 2011
Wednesday, September 3, 2014
Region S.N.N.P
Zone ALABA SPECIAL
Wereda ALABA SPECIAL
Selected Indicator
Type of Road
Physical Vulnerability: Access to Roads & Urban Centres - Households access to
road and urban centre
Response
Time to Nearest
Paved Road (Mins.)
Time To Nearest
Response Urban Center (Mins.)
Yes, paved
2.20 A - Less than 30 min
74.93 A - Less than 1 hr
Yes, partly paved road
15.70 B - 30 – 60 min
10.74 B - 1 - 2 hrs
Yes, gravel road
2.48 C - 1 – 2 hrs
8.82 C - 2 - 4 hrs
Yes, dirt road (difficult
for car)
No, no road
56.47 D - 2 – 3 hrs
23.14 E - 3 – 4 hrs
3.03 D - 4 - 6 hrs
0.83 E - More than 6 hrs
Yes, paved
2.20 A - Less than 30 min
74.93 A - Less than 1 hr
Response
29.36
40.72
24.65
3.60
1.66
29.36
Avg Time To Nearest Urban Center(Mins.)
Type of Road
23
2
16
2
56
No, no road
Yes, gravel road
Yes, paved
Yes, dirt road (difficult
for car)
Yes, partly paved road
129.37 Avg_Time_To_Nearest_Paved_Road
35.82
Time to reach the nearest paved road from the HH
80
75
70
60
50
40
30
20
11
10
0
A - Less than 30
min
B - 30 – 60 min
9
C - 1 – 2 hrs
3
D - 2 – 3 hrs
1
E - 3 – 4 hrs
A - Less than 30
min
B - 30 – 60 min
C - 1 – 2 hrs
D - 2 – 3 hrs
E - 3 – 4 hrs
Time to reach nearest urban center from the HH
45
41
40
35
30
29
25
25
20
15
A - Less than 1 hr
B - 1 - 2 hrs
C - 2 - 4 hrs
D - 4 - 6 hrs
E - More than 6 hrs
10
5
0
A - Less than 1 hr
B - 1 - 2 hrs
C - 2 - 4 hrs
4
D - 4 - 6 hrs
2
E - More than 6
hrs
94
Page 1 of 1
Data_Collected_Date
December 2011
Wednesday, September 3, 2014
Region S.N.N.P
Selected Indicator
Zone ALABA SPECIAL
Wereda ALABA SPECIAL
Physical Vulnerability: Access to Electricity - Households access and utilization of
electricity
Household_Located_In_Electricity
7.79
Household_Connected_To Electricity
0.00
95
Page 1 of 1
Data_Collected_Date
December 2011
Wednesday, September 3, 2014
Region S.N.N.P
Selected Indicator
Floor Structure
Zone ALABA SPECIAL
Wereda ALABA SPECIAL
Physical Vulnerability: Type of Dwelling Units - Households type of dwelling
houses
HH Response
Type of Floor
HH Response
Tin House
4.12
Concrete
0.55
Wood and mud
95.88
Non-Concrete
99.45
Floor Structure
100
96
80
Type of Floor
99
100
80
60
60
40
40
20
4
0
Tin House
Wood and mud
Floor Structure
Tin House
Wood and mud
20
1
0
Concrete
Non-Concrete
Type of Floor
Concrete
Non-Concrete
96
Page 1 of 1
WDRP Indicators
Socio Demographic Characteristics
97
Wereda Disaster
Risk Profile
Data_Collected_Date
December 2011
Disaster Risk Management and Food
Security Sector (DRMFSS)
Wednesday, September 3, 2014
Region S.N.N.P
Selected Indicator
Kebele Name
SINBITA
SORGE DARGOSA
HOLUGEB KUKE
WETETA
Zone ALABA SPECIAL
Wereda ALABA SPECIAL
Economic Vulnerability: Level of Migration - Migration level and its characteristics by Kebele
Approx_No. Age_Group
Sex
Migration_Period
Migration Trend
Migration_Reason
Destination
20
Both
Both
8
Working
Male
10
Working
Male
10
Working
Male
Increased
Increased
Decreased
Increased
Loss of assets
Loss of asset
Economic Hardship
Loss of assets and
Economic Hardship
Within Kebele,
Neighbouring Kebele and
Highland
To relatives and Addis
Ababa
Kulito, Jima and Addis
Ababa
Sudan, Addis Ababa and
Within in Wereda or Kulito
98
Page 1 of 1
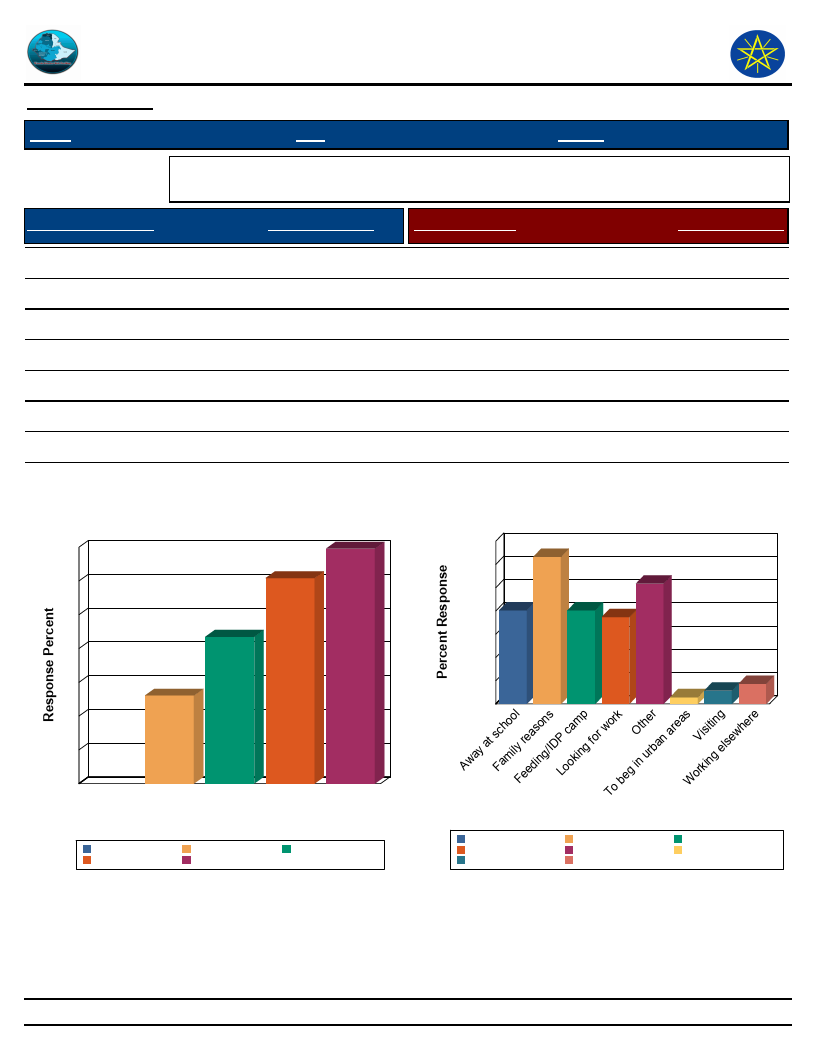
Wereda Disaster
Risk Profile
Data_Collected_Date
December 2011
Region S.N.N.P
Zone
Disaster Risk Management
and Food Security Sector (DRMFSS)
Thursday, September 4, 2014
ALABA SPECIAL
Wereda ALABA SPECIAL
Selected Indicator
Economic Vulnerability: Household Migration - Household migration and reason
for migration
Duration of Migration
Response Percent
Migration Reason
Response Percent
A month – 3 months
3 – 6 months
> 6 months
Less than 2 weeks
30.43
21.74
13.04
34.78
Family reasons
Looking for work
Working elsewhere
Visiting
Feeding/IDP camp
Away at school
To beg in urban areas
Other
25.29
14.94
3.45
2.30
16.09
16.09
1.15
20.69
Duration of Migration
35
35
30
30
25
22
20
15
13
10
5
0
>6
3 – 6 A month – Less than
months months 3 months 2 weeks
Duration of Migration
A month – 3 months
> 6 months
Less than 2 weeks
3 – 6 months
Migration Reason
28
25
24
20
16
16
21
16 15
12
8
4
3
2
1
0
Away at school
Looking for work
Visiting
Migration Reason
Family reasons
Other
Working elsewhere
Feeding/IDP camp
To beg in urban areas
99
Page 1 of 1
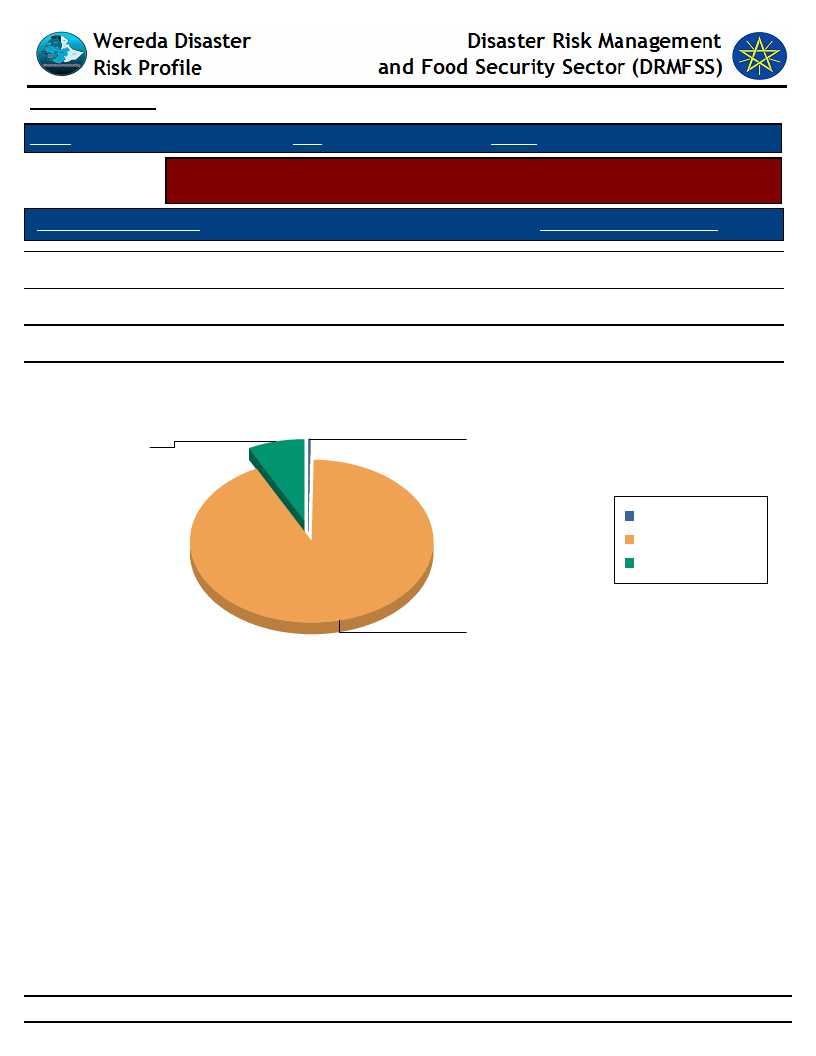
Data_Collected_Date December 2011
Wednesday, September 3, 2014
Region S.N.N.P
Zone ALABA SPECIAL
Wereda ALABA SPECIAL
Selected Indicator
Economic Vulnerability: Household Migration - Disasters as a triggering factor for
migration (households response in %)
Is Migration Due to Hazard?
HH Response - Due To Hazard
No
Yes
Migration partly because of such impacts
92.16
7.56
0.28
Is Migration Due to Hazard?
Migration partly because of such
Yes
impacts
7.6
0.3
Migration partly because
of such impacts
No
Yes
No
92.2
100
Page 1 of 1
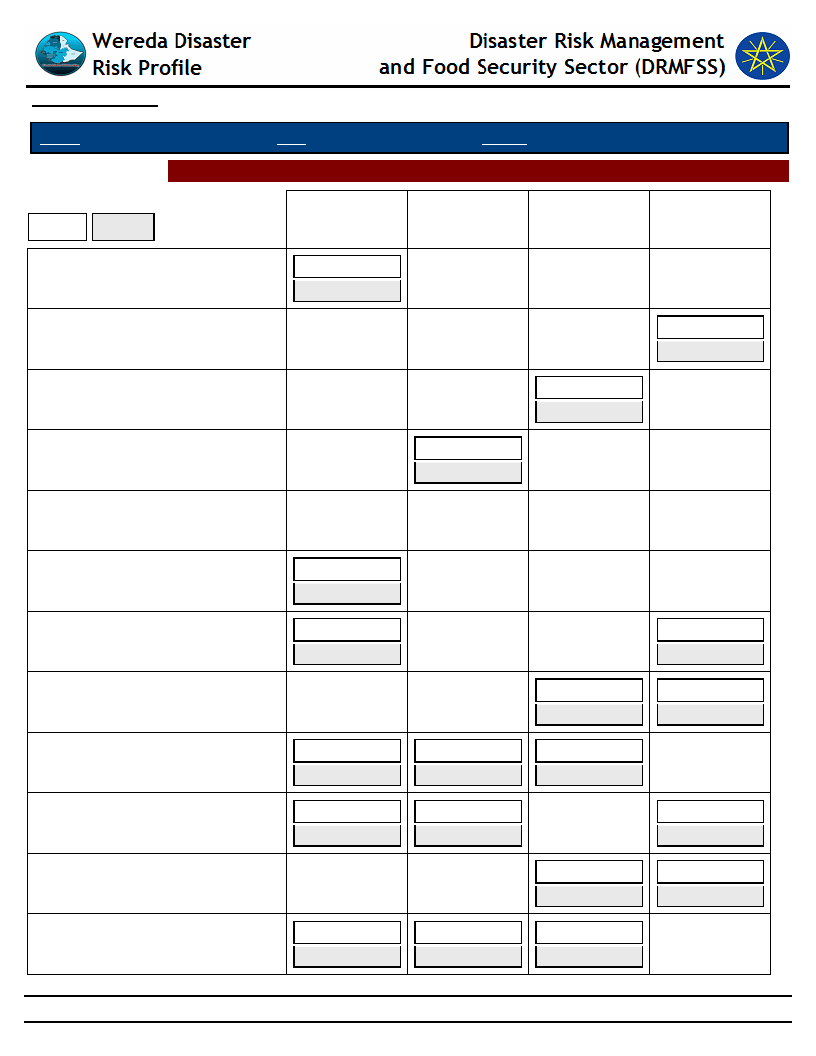
Data_Collected_Date
December 2011
Wednesday, September 3, 2014
Region S.N.N.P
Zone ALABA SPECIAL
Wereda ALABA SPECIAL
Selected Indictor: Demography: Population Structure
KEY:
Male
Female
Children
(0-12 yrs)
Older (Above
55 yrs)
Working
(25-55 yrs)
Youth (12-25
yrs)
AMATA
10%
10%
ANDAGNA MEKELA
19%
11%
ANDANGA ASHEKA
20%
20%
ANDEGANA HANSHA
6%
4%
ANDEGNA KONCHA
ANDEGNA TEFO
ANDEGNA TUKA
ASERE
ASHEKORA BOTI
AYMELE
BESHENO
BUBESA
9%
9%
12%
13%
12%
5%
13%
5%
11%
2%
9%
3%
12%
4%
13%
6%
101
16%
16%
20%
16%
20%
19%
17%
18%
14%
16%
17%
17%
18%
18%
18%
22%
Page 1 of 6
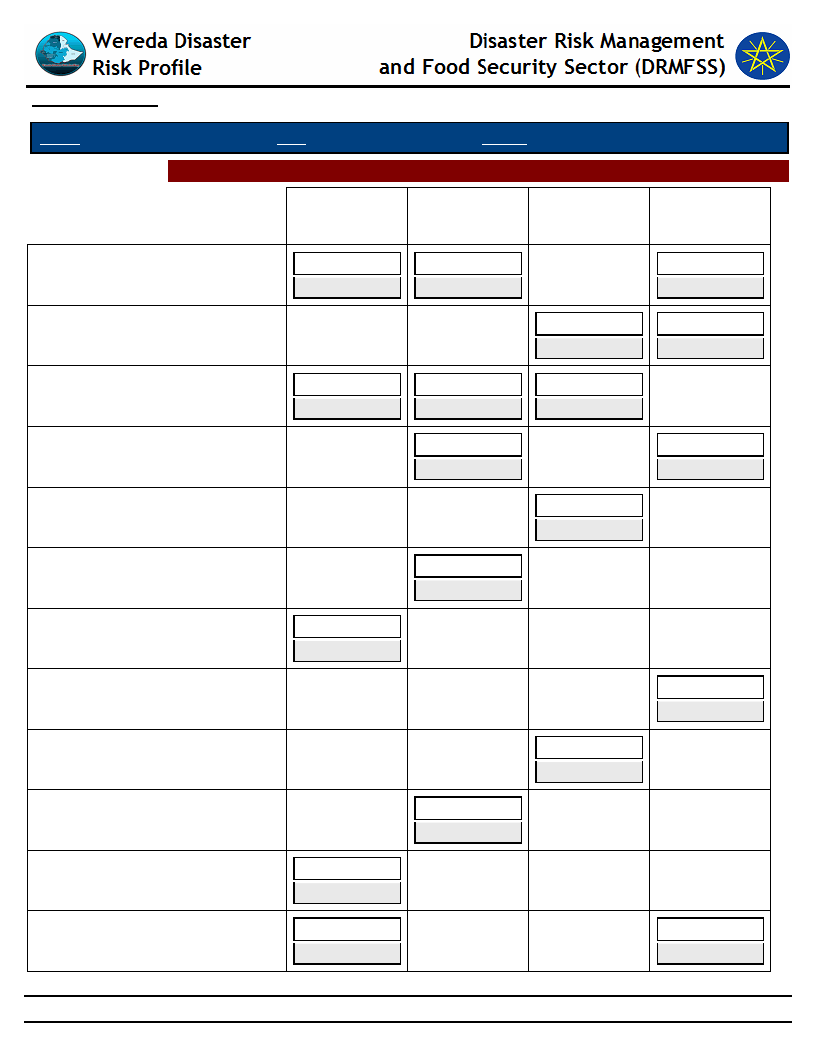
Data_Collected_Date
December 2011
Wednesday, September 3, 2014
Region S.N.N.P
Zone ALABA SPECIAL
Wereda ALABA SPECIAL
Selected Indictor: Demography: Population Structure
Children
(0-12 yrs)
Older (Above
55 yrs)
Working
(25-55 yrs)
Youth (12-25
yrs)
BUKET BAME
12%
3%
16%
13%
2%
19%
CHEBERE MENO
17%
14%
13%
16%
CHEMBULA
12%
2%
17%
13%
3%
18%
DEBESO
4%
15%
6%
15%
DODA BREHO
17%
18%
FELKA
GERME
5%
5%
14
16%
GOBA SHERARO
12%
13%
GOFESA
17%
18%
GURARA BUCHO
4%
6%
HABIBO FURANA
10%
10%
HANTEZO
9%
12%
11%
13%
102
Page 2 of 6
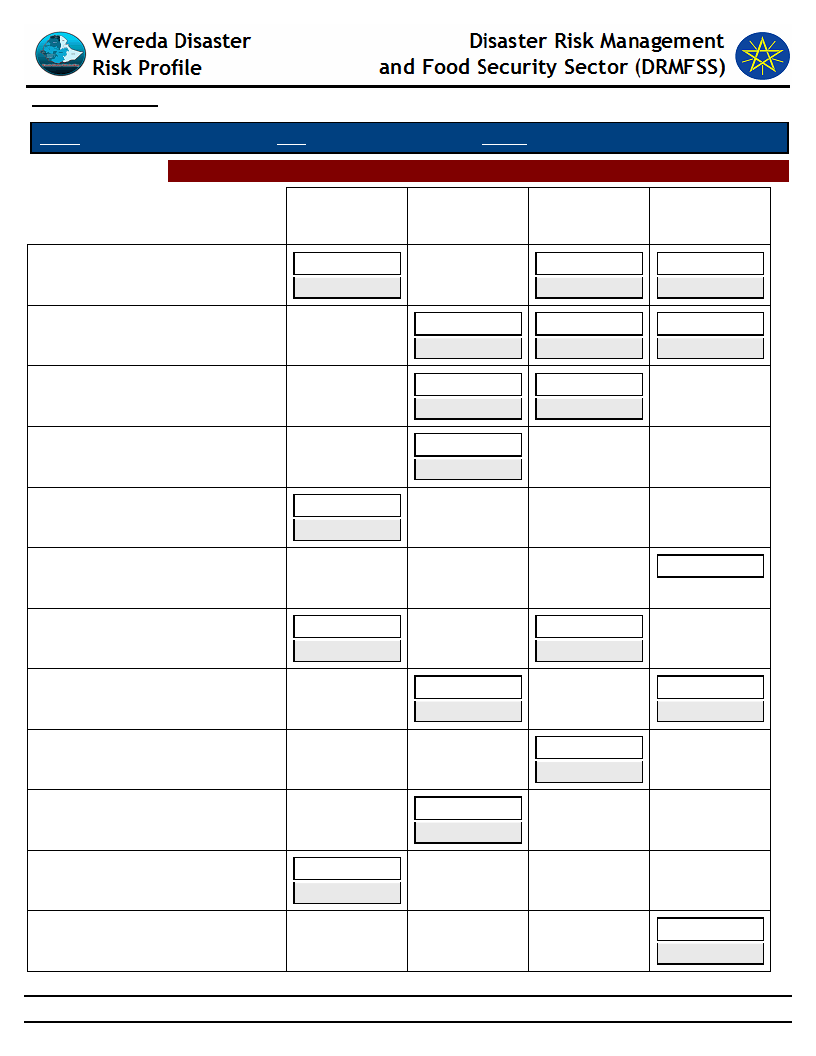
Data_Collected_Date
December 2011
Wednesday, September 3, 2014
Region S.N.N.P
Zone ALABA SPECIAL
Wereda ALABA SPECIAL
Selected Indictor: Demography: Population Structure
Children
(0-12 yrs)
Older (Above
55 yrs)
Working
(25-55 yrs)
Youth (12-25
yrs)
HOLUGEB KUKE
12%
13%
22%
17%
23%
18%
HUDANA CHOLOKISA
5%
18%
14%
5%
22%
16%
HUDANAS MENO
3%
17%
2%
18%
HULATENGA ASHEKA
4%
6%
HULETEGNA MEKALA
10%
10%
HULETEGNA TEFO
19%
HULETEGNA TUKA
HULETEGNA HANSHA
HULETEGNA KONCHA
KOBO CHEBERE
KOBO GETO
KUFE
12%
13%
6%
4%
4%
6%
10%
10%
103
20%
20%
16%
14%
20%
15%
15%
15%
Page 3 of 6
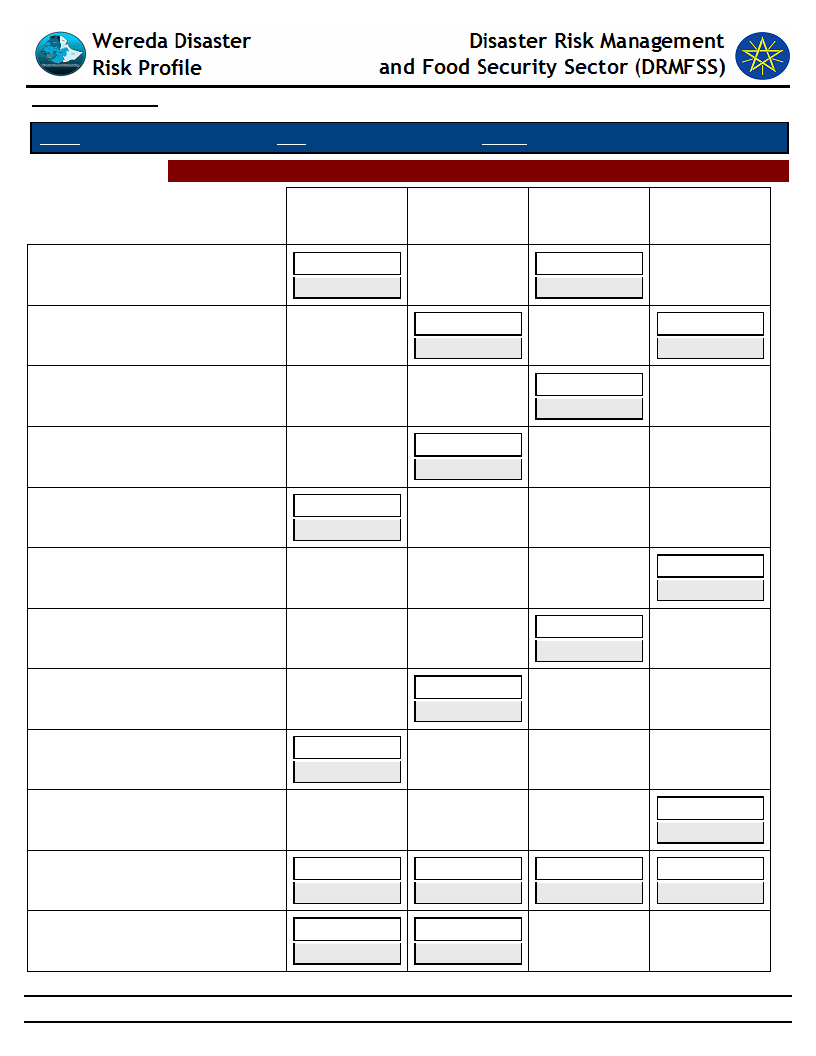
Data_Collected_Date
December 2011
Wednesday, September 3, 2014
Region S.N.N.P
Zone ALABA SPECIAL
Wereda ALABA SPECIAL
Selected Indictor: Demography: Population Structure
Children
(0-12 yrs)
Older (Above
55 yrs)
Working
(25-55 yrs)
Youth (12-25
yrs)
KULFO
50%
20%
50%
20%
KUNCHENA YAYE
5%
50%
5%
50%
LADO CHKORESA
50%
50%
LANGAW MEKALA
50%
50%
LAYEGNAWO LENDA
12%
13%
LAYGNAWO ARSHO
LAYGNAWO BEDANE
16%
19%
17%
13%
LAYGNAWO TUKA
2%
13%
MEJA
13%
12%
MERAB GORTENCHO
17%
13%
MESERAK GORTANCHO
10%
5%
22%
22%
10%
5%
23%
23%
METO DUBALE
12%
5%
13%
5%
104
Page 4 of 6
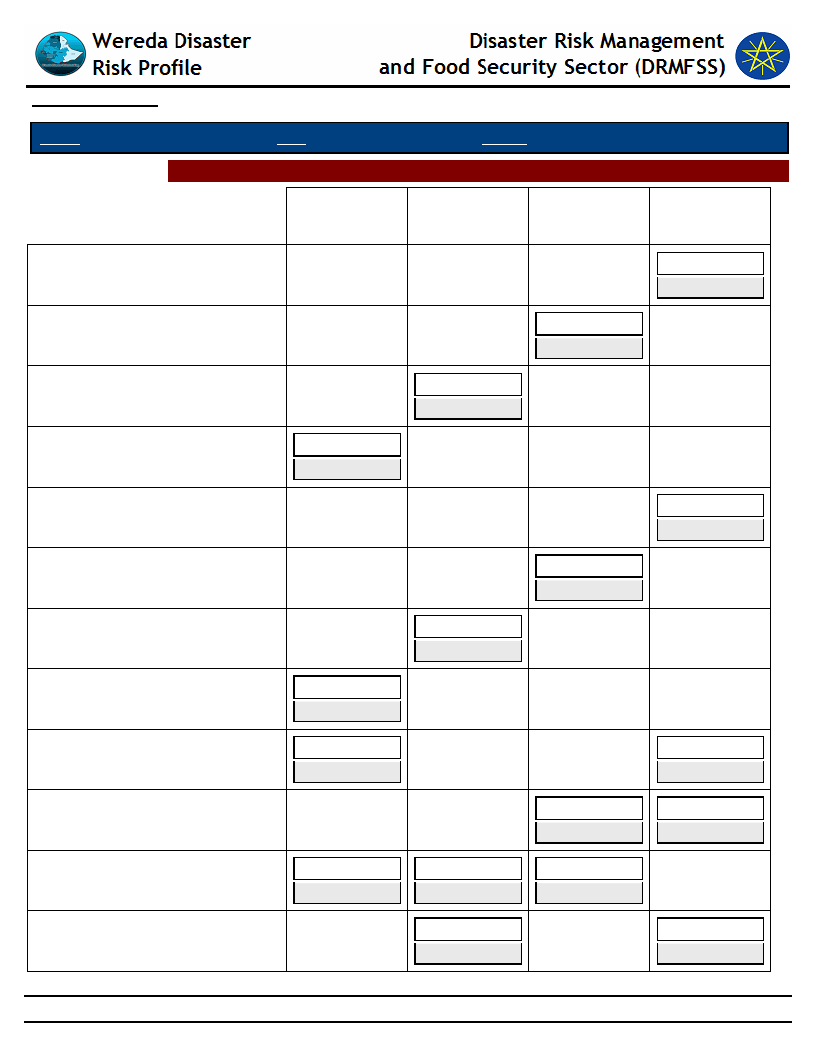
Data_Collected_Date
December 2011
Wednesday, September 3, 2014
Region S.N.N.P
Zone ALABA SPECIAL
Wereda ALABA SPECIAL
Selected Indictor: Demography: Population Structure
Children
(0-12 yrs)
Older (Above
55 yrs)
Working
(25-55 yrs)
Youth (12-25
yrs)
MUDA DINOKOSA
14%
16%
MUDA MEYAFA
17%
18%
MUDAWI SHOAMO
4%
6%
NEGELE WEDESH
12%
13%
QULIBI
14%
16%
RUKEKENE TEFO
SHEKE TENA WOLDIA
17%
18%
4%
6%
SINBITA
7%
8%
SORGE DARGOSA
10%
19%
10%
21%
TACHEGNAWO ARSHO
20%
14%
20%
16%
TACHEGNAWO BEDANE
11%
2%
20%
13%
3%
20%
TACHIGNAW LENDA
5%
14%
5%
17%
105
Page 5 of 6
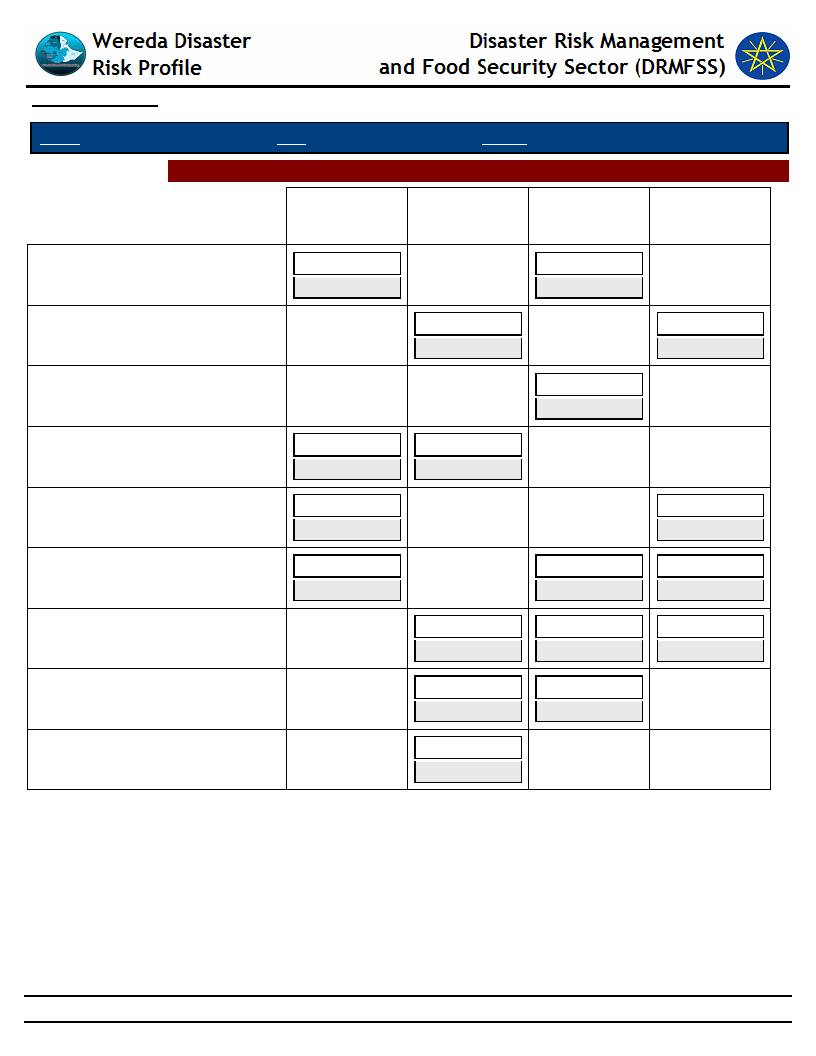
Data_Collected_Date
December 2011
Wednesday, September 3, 2014
Region S.N.N.P
Zone ALABA SPECIAL
Wereda ALABA SPECIAL
Selected Indictor: Demography: Population Structure
Children
(0-12 yrs)
Older (Above
55 yrs)
Working
(25-55 yrs)
Youth (12-25
yrs)
TEFO CHUFO
10%
18%
10%
22%
TETALI BITORA
3%
15%
2%
15%
WANJANA WOLDIA
70%
70%
WEJEGO YATO
10%
5%
10%
5%
WETETA
7%
15%
8%
15%
YAMBI
YATO BEREHO
6%
20%
19%
6%
20%
21%
5%
20%
14%
5%
20%
16%
ZALAFIRE 02
2%
24%
3%
26%
ZEBECHAM 01
4%
4%
106
Page 6 of 6
Data_Collected_Date
Region S.N.N.P
December 2011
Zone
ALABA SPECIAL
Wereda
Selected Indicator
Demography: Population Trends and Ethnic Groups
Kebele Name
Population Change Trend
Population Change Reasons
Wednesday, September 3, 2014
ALABA SPECIAL
Ethnic_Groups
MESERAK
GORTANCHO
KOBO GETO
TEFO CHUFO
METO DUBALE
HABIBO FURANA
SINBITA
CHEMBULA
WEJEGO YATO
ANDEGNA TEFO
SORGE DARGOSA
BUKET BAME
HOLUGEB KUKE
WETETA
ANDEGNA KONCHA
KULFO
LAYEGNAWO
LENDA
TACHEGNAWO
BEDANE
Increased
Increased
Increased
Increased
Increased
Increased
Increased
Increased
Increased
Increased
Increased
Increased
Increased
Increased
Increased
Increased
Increased
More Children or Large Local
Families
More Children or Large Local
Families
More Children or Large Local
Families
More Children or Large Local
Families
More Children or Large Local
Families
More Children or Large Local
Families
More Children or Large Local
Families
More Children or Large Local
Families
More Children or Large Local
Families
High Birth
More Children or Large Local
Families
More Children or Large Local
Families
More Children or Large Local
Families
More Children or Large Local
Families
More Children or Large Local
Families
High Birth
High Birth
107
Halaba
Halaba
Halaba
Halaba
Halaba
Halaba
Halaba
Halaba
Halaba
Halaba
Halaba and Silite
Halaba
Halaba
Halaba
Halaba
Halaba
Halaba
Page 1 of 2
Data_Collected_Date
Region S.N.N.P
December 2011
Zone
ALABA SPECIAL
Wereda
Selected Indicator
Demography: Population Trends and Ethnic Groups
Kebele Name
Population Change Trend
Population Change Reasons
Wednesday, September 3, 2014
ALABA SPECIAL
Ethnic_Groups
HULETEGNA
MEKALA
HULETEGNA TUKA
NEGELE WEDESH
HANTEZO
AYMELE
ANDEGNA TUKA
MEJA
ASHEKORA BOTI
YAMBI
AMATA
TETALI BITORA
GERME
BUBESA
Increased
Increased
Increased
Increased
Increased
Increased
Increased
Increased
Increased
Increased
Increased
Increased
Increased
High Birth
High Birth
High Birth
High Birth
High Birth
High Birth
High Birth
High Birth
High Birth
High Birth
High Birth
More Children
High Birth
Halaba
Halaba
Halaba and Silite
Halaba
Halaba
Halaba
Halaba
Halaba and Silite
Halaba
Halaba
Halaba and Silite
Halaba
Halaba
108
Page 2 of 2

Data_Collected_Date
December 2011
Wednesday, September 3, 2014
Region S.N.N.P
Zone
ALABA SPECIAL
Wereda ALABA SPECIAL
Selected Indicator
Social Vulnerability: Household Demographic Characteristics - Demographic
characteristics of households
Demographic Indicator
Indicator_Value Comments
Average household size
7
Sex ratio
1,088 Number of males divided by number of females
Child sex ratio (under 14 yrs)
Adult sex ratio (18 & Above yrs)
Dependency ratio ([(0-14)+(64+)] / (15-64)
yrs)
1,104 Sex ration for the population whose age is
below 14 years
1,009 Sex ratio for the population whose age is 18 and
above years
1
109
Page 1 of 1
Wereda Disaster
Risk Profile
Data_Collected_Date
December 2011
Disaster Risk Management and Food
Security Sector (DRMFSS)
Wednesday, September 3, 2014
Region S.N.N.P
Selected Indicator
Zone
ALABA SPECIAL
Wereda ALABA SPECIAL
Social Vulnerability: Level of Educational Attainment - Education status of household members
General Awareness
Percentage Educational Level
Read and understand text - Easily
2.34
Less than 1st grade completed
Percentage
37.90
Read and understand text - with difficulty
9.51
From Proportion of population (7+) - Primary (1-6)
40.19
Can write letters - easily
2.15
From Proportion of population (7+) - Secondary (7-12)
19.47
Can write letters - with difficulty
5.22
Technical / vocational certificate or diploma
0.87
0.00
University diploma
0.33
0.00
Pursuing University degree
0.38
General Literacy Rate
0.00
University degree or higher
Percentage
0.00
Adult Literacy Rate
0.11
Percentage
0.00
110
Page 1 of 1

Data_Collected_Date
December 2011
Wednesday, September 3, 2014
Region S.N.N.P
Selected Indicator
Zone ALABA SPECIAL
Wereda ALABA SPECIAL
Social Vulnerability: Gender Parity - Gender parity in education level (7+ years)
and household heading
Educational Level
Male_Percent
Female_Percent
Less than 1st grade completed
43.77
56.24
Technical / vocational certificate or diploma
100.00
0.00
University diploma
0.00
0.00
Pursuing University degree
100.00
0.00
University degree or higher
38.16
61.84
From Proportion of population (7+) - Primary (1-6)
62.85
37.15
From Proportion of population (7+) - Secondary (7-12)
72.79
27.21
Male Head of HH
86.70
Female Head of HH
13.30
111
Page 1 of 1
WDRP Indicators
Environmental Characteristics
112

Data_Collected_Date
December 2011
Thursday, September 4, 2014
Region S.N.N.P
Zone ALABA SPECIAL
Wereda ALABA SPECIAL
Selected Indicator
Environmental Situation: Environmental Problems - Major environmental
problems by Kebele
KebeleName
Problem_1
Problem_2
Problem_3
Problem4
MESERAK
GORTANCHO
KOBO GETO
Erosion
Erosion
Drought
Drought
Drought
Drought
Flood
Snow
TEFO CHUFO
METO DUBALE
Degradation or
Erosion
Flooding
Drought
Drought
Drought
Drought
Water Shortage
HABIBO FURANA
Erosion
Drought
Drought
Flood
SINBITA
Erosion
Drought
Drought
Flood
CHEMBULA
Erosion
Drought
Drought
WEJEGO YATO
Erosion
Drought
Drought
Flooding
ANDEGNA TEFO
Flooding
Erosion
Erosion
SORGE DARGOSA
Erosion
Flood
Drought
BUKET BAME
Flooding
Land Shortage
Land Shortage
HOLUGEB KUKE
Erosion
Land Shortage
Drought
WETETA
Erosion
Erosion
Land Shortage
ANDEGNA
KONCHA
KULFO
Drought
Erosion
Erosion
Degradation
Erosion
Degradation
Flood
LAYEGNAWO
LENDA
TACHEGNAWO
BEDANE
Drought
Drought
Land Degradation
Soil or Land
Degradation
Land Degradation
Soil or Land
Degradation
Water shortage
Gully Expansion
113
Page 1 of 2

Data_Collected_Date
December 2011
Thursday, September 4, 2014
Region S.N.N.P
Zone ALABA SPECIAL
Wereda ALABA SPECIAL
Selected Indicator
Environmental Situation: Environmental Problems - Major environmental
problems by Kebele
KebeleName
Problem_1
Problem_2
Problem_3
Problem4
HULETEGNA
MEKALA
HULETEGNA
TUKA
NEGELE WEDESH
HANTEZO
Drought
Drought
Drought
Drought
Soil or Land
Degradation
Soil Degradation or
Erosion
Soil or land
Degradation
Water shortage
Soil or Land
Degradation
Soil Degradation or
Erosion
Soil or land
Degradation
Water shortage
Shortage of Water
Animal Disease
Animal Disease
Gully expansion
AYMELE
Drought
Land Degradation
Land Degradation
Gully Expansion
ANDEGNA TUKA
Drought
Land Degradation
Land Degradation
Water shortage
MEJA
Drought
Drought
Soil Degradation
Water Pollution
ASHEKORA BOTI
YAMBI
Drought
Drought
Soil Degradation or
Erosion
Water shortage
Water shortage
Water shortage
Animal Disease
Animal Disease
AMATA
Drought
Land Degradation
Land Degradation
Water shortage
TETALI BITORA
GERME
Drought
Drought
Soil Degradation or
Erosion
Land Degradation
Soil Degradation or
Erosion
Land Degradation
Animal Disease
Flood
114
Page 2 of 2
Data_Collected_Date
December 2011
Wednesday, September 3, 2014
Region S.N.N.P
Selected Indicator
KebeleName
Zone ALABA SPECIAL
Wereda ALABA SPECIAL
Environmental Situation: Deforestation - Observed changes over levels of
deforestation by the community and its problems
Changes_Observed
Problems_Due_To_Changes
MESERAK
GORTANCHO
KOBO GETO
Increasing
Increasing
Drought, Crop failure and Poor livestock yield
Low access to Wood, Low Rainfall and Low Animal Feed
TEFO CHUFO
Increasing
Low Rainfall, Drought and Poor wood supply
METO DUBALE
HABIBO FURANA
SINBITA
CHEMBULA
WEJEGO YATO
ANDEGNA TEFO
SORGE DARGOSA
BUKET BAME
HOLUGEB KUKE
WETETA
ANDEGNA
KONCHA
KULFO
LAYEGNAWO
LENDA
TACHEGNAWO
BEDANE
HULETEGNA
MEKALA
Increasing
Increasing
Increasing
Increasing
Increasing
Increasing
Increasing
Increasing
Increasing
Increasing
Increasing
Increasing
Increasing
Increasing
Increasing
Low Rain and Low Production
Low Production and Drought
Flooding, Drought and snow
Low rain and Food Shortage
Low Rainfall, low Production, Soil Loss and Low animal Feed
Low Rainfall, Poor Wood Supply and Drought
Poor Harvest and Drought
Rain Reduction and less access to five wood
Low Rain and Less access to Fire wood and Construction
Soil erosion and low Production
Low Rainfall and Low access to wood
Low Production and Drought
Increased erosion and Rainfall reduction
Soil erosion and Rainfall shortage
Erosion Increment and Rainfall reduction
115
Page 1 of 2

Data_Collected_Date
December 2011
Wednesday, September 3, 2014
Region S.N.N.P
Selected Indicator
KebeleName
Zone ALABA SPECIAL
Wereda ALABA SPECIAL
Environmental Situation: Deforestation - Observed changes over levels of
deforestation by the community and its problems
Changes_Observed
Problems_Due_To_Changes
HULETEGNA
TUKA
NEGELE WEDESH
Increasing
Increasing
Erosion Increment and Rainfall reduction
Increased erosion and Rainfall reduction
HANTEZO
Increasing
Rainfall reduction and Increased erosion
AYMELE
ANDEGNA TUKA
MEJA
ASHEKORA BOTI
YAMBI
AMATA
TETALI BITORA
GERME
BUBESA
Increasing
Increasing
Increasing
Increasing
Increasing
Increasing
Increasing
Increasing
Increasing
Increased erosion and Rainfall reduction
Increased erosion and Rainfall reduction
Erosion Increment and Rainfall reduction
Rain Reduction and Increased Erosion
Erosion and Soil degradation
Increased erosion and Rainfall reduction
Erosion Increment and Rainfall Reduction
Flooding, Erosion Increment, Rainfall Reduction and Gully
expansion on Farm land
Increased erosion and Rainfall reduction
116
Page 2 of 2

Wereda Disaster
Risk Profile
Data_Collected_Date
December 2011
Disaster Risk Management
and Food Security Sector (DRMFSS)
Wednesday, September 3, 2014
Region S.N.N.P
Zone ALABA SPECIAL
Wereda
ALABA SPECIAL
Selected Indicator
Environmental Situation: Natural Resources Availability - Natural resources available and changes observed by
the community
KebeleName
MESERAK GORTANCHO
Resources_1
Land Shortage
Resources_3
Observed_Change_1
Increasing
Observed_Change_3
Problems_Changes_1
Family Conflict
Problems_Changes_3
Resources_2
Observed_Change_2
Problems_Changes_2
Resources_4
Observed_Change_4
Problems_Changes_4
KebeleName
KOBO GETO
Resources_1
Land Shortage
Observed_Change_1
Increasing Shortage
Problems_Changes_1
Conflict
Resources_2
Observed_Change_2
Problems_Changes_2
Resources_3
Observed_Change_3
Problems_Changes_3
Resources_4
Observed_Change_4
Problems_Changes_4
117
Page 1 of 15

Wereda Disaster
Risk Profile
Data_Collected_Date
December 2011
Disaster Risk Management
and Food Security Sector (DRMFSS)
Wednesday, September 3, 2014
Region S.N.N.P
Zone ALABA SPECIAL
Wereda
ALABA SPECIAL
Selected Indicator
Environmental Situation: Natural Resources Availability - Natural resources available and changes observed by
the community
KebeleName
TEFO CHUFO
Resources_1
Land
Resources_3
Observed_Change_1
Decreasing
Observed_Change_3
Problems_Changes_1
Conflict
Problems_Changes_3
Resources_2
Observed_Change_2
Problems_Changes_2
Resources_4
Observed_Change_4
Problems_Changes_4
KebeleName
METO DUBALE
Resources_1
Land Quality
Observed_Change_1
Decreasing
Problems_Changes_1
Conflict
Resources_2
Observed_Change_2
Problems_Changes_2
Resources_3
Observed_Change_3
Problems_Changes_3
Resources_4
Observed_Change_4
Problems_Changes_4
118
Page 2 of 15

Wereda Disaster
Risk Profile
Data_Collected_Date
December 2011
Disaster Risk Management
and Food Security Sector (DRMFSS)
Wednesday, September 3, 2014
Region S.N.N.P
Zone ALABA SPECIAL
Wereda
ALABA SPECIAL
Selected Indicator
Environmental Situation: Natural Resources Availability - Natural resources available and changes observed by
the community
KebeleName
HABIBO FURANA
Resources_1
Land
Resources_3
Observed_Change_1
Decreasing Quality
Observed_Change_3
Problems_Changes_1
Conflict
Problems_Changes_3
Resources_2
Observed_Change_2
Problems_Changes_2
Resources_4
Observed_Change_4
Problems_Changes_4
KebeleName
CHEMBULA
Resources_1
Land Shortage
Observed_Change_1
Increasing
Problems_Changes_1
Family Conflict
Resources_2
Observed_Change_2
Problems_Changes_2
Resources_3
Observed_Change_3
Problems_Changes_3
Resources_4
Observed_Change_4
Problems_Changes_4
119
Page 3 of 15

Wereda Disaster
Risk Profile
Data_Collected_Date
December 2011
Disaster Risk Management
and Food Security Sector (DRMFSS)
Wednesday, September 3, 2014
Region S.N.N.P
Zone ALABA SPECIAL
Wereda
ALABA SPECIAL
Selected Indicator
Environmental Situation: Natural Resources Availability - Natural resources available and changes observed by
the community
KebeleName
WEJEGO YATO
Resources_1
Land Shortage
Resources_3
Observed_Change_1
Increasing
Observed_Change_3
Problems_Changes_1
Conflict
Problems_Changes_3
Resources_2
Observed_Change_2
Problems_Changes_2
Forest Removal
Increasing
Desertification
Resources_4
Observed_Change_4
Problems_Changes_4
KebeleName
ANDEGNA TEFO
Resources_1
Land
Observed_Change_1
Decreasing
Problems_Changes_1
Conflict
Resources_2
Observed_Change_2
Problems_Changes_2
Resources_3
Observed_Change_3
Problems_Changes_3
Resources_4
Observed_Change_4
Problems_Changes_4
120
Page 4 of 15

Wereda Disaster
Risk Profile
Data_Collected_Date
December 2011
Disaster Risk Management
and Food Security Sector (DRMFSS)
Wednesday, September 3, 2014
Region S.N.N.P
Zone ALABA SPECIAL
Wereda
ALABA SPECIAL
Selected Indicator
Environmental Situation: Natural Resources Availability - Natural resources available and changes observed by
the community
KebeleName
SORGE DARGOSA
Resources_1
Land Shortage
Resources_3
Observed_Change_1
Increasing
Observed_Change_3
Problems_Changes_1
Conflict
Problems_Changes_3
Resources_2
Observed_Change_2
Problems_Changes_2
Resources_4
Observed_Change_4
Problems_Changes_4
KebeleName
BUKET BAME
Resources_1
Land Quality
Observed_Change_1
Decreasing
Problems_Changes_1
Occasionally conflict
Resources_2
Observed_Change_2
Problems_Changes_2
Resources_3
Observed_Change_3
Problems_Changes_3
Resources_4
Observed_Change_4
Problems_Changes_4
121
Page 5 of 15

Wereda Disaster
Risk Profile
Data_Collected_Date
December 2011
Disaster Risk Management
and Food Security Sector (DRMFSS)
Wednesday, September 3, 2014
Region S.N.N.P
Zone ALABA SPECIAL
Wereda
ALABA SPECIAL
Selected Indicator
Environmental Situation: Natural Resources Availability - Natural resources available and changes observed by
the community
KebeleName
HOLUGEB KUKE
Resources_1
Land Shortage
Resources_3
Observed_Change_1
Increasing
Observed_Change_3
Problems_Changes_1
Family Conflict
Problems_Changes_3
Resources_2
Observed_Change_2
Problems_Changes_2
Resources_4
Observed_Change_4
Problems_Changes_4
KebeleName
WETETA
Resources_1
Land
Observed_Change_1
Increase Shortage
Problems_Changes_1
Increase Conflict or low production
Resources_2
Observed_Change_2
Problems_Changes_2
Water
Increase Shortage
Increase disease and Poor health
Resources_3
Observed_Change_3
Problems_Changes_3
Resources_4
Observed_Change_4
Problems_Changes_4
122
Page 6 of 15

Wereda Disaster
Risk Profile
Data_Collected_Date
December 2011
Disaster Risk Management
and Food Security Sector (DRMFSS)
Wednesday, September 3, 2014
Region S.N.N.P
Zone ALABA SPECIAL
Wereda
ALABA SPECIAL
Selected Indicator
Environmental Situation: Natural Resources Availability - Natural resources available and changes observed by
the community
KebeleName
ANDEGNA KONCHA
Resources_1
Land Quality
Resources_3
Observed_Change_1
Decreasing
Observed_Change_3
Problems_Changes_1
Conflict
Problems_Changes_3
Resources_2
Observed_Change_2
Problems_Changes_2
Resources_4
Observed_Change_4
Problems_Changes_4
KebeleName
KULFO
Resources_1
Land Shortage
Observed_Change_1
Increasing
Problems_Changes_1
Family Conflict
Resources_2
Observed_Change_2
Problems_Changes_2
Resources_3
Observed_Change_3
Problems_Changes_3
Resources_4
Observed_Change_4
Problems_Changes_4
123
Page 7 of 15
Wereda Disaster
Risk Profile
Data_Collected_Date
December 2011
Disaster Risk Management
and Food Security Sector (DRMFSS)
Wednesday, September 3, 2014
Region S.N.N.P
Zone ALABA SPECIAL
Wereda
ALABA SPECIAL
Selected Indicator
Environmental Situation: Natural Resources Availability - Natural resources available and changes observed by
the community
KebeleName
LAYEGNAWO LENDA
Resources_1
Land
Resources_3
Observed_Change_1
Decreasing
Observed_Change_3
Problems_Changes_1
Land Shortage
Problems_Changes_3
Resources_2
Observed_Change_2
Problems_Changes_2
Forest
Degradation Gully
Resources_4
Observed_Change_4
Problems_Changes_4
KebeleName
TACHEGNAWO BEDANE
Resources_1
Land
Observed_Change_1
Decreasing
Problems_Changes_1
Shortage of land
Resources_2
Observed_Change_2
Problems_Changes_2
Resources_3
Observed_Change_3
Problems_Changes_3
Resources_4
Observed_Change_4
Problems_Changes_4
124
Page 8 of 15

Wereda Disaster
Risk Profile
Data_Collected_Date
December 2011
Disaster Risk Management
and Food Security Sector (DRMFSS)
Wednesday, September 3, 2014
Region S.N.N.P
Zone ALABA SPECIAL
Wereda
ALABA SPECIAL
Selected Indicator
Environmental Situation: Natural Resources Availability - Natural resources available and changes observed by
the community
KebeleName
HULETEGNA MEKALA
Resources_1
Land
Resources_3
Observed_Change_1
Decreasing
Observed_Change_3
Problems_Changes_1
Shortage of land
Problems_Changes_3
Resources_2
Observed_Change_2
Problems_Changes_2
Resources_4
Observed_Change_4
Problems_Changes_4
KebeleName
HULETEGNA TUKA
Resources_1
Land
Observed_Change_1
Decreasing
Problems_Changes_1
Shortage of land
Resources_2
Observed_Change_2
Problems_Changes_2
Forest Land
Decreasing
Degradation, Erosion and Gully Expansion
Resources_3
Observed_Change_3
Problems_Changes_3
Resources_4
Observed_Change_4
Problems_Changes_4
125
Page 9 of 15

Wereda Disaster
Risk Profile
Data_Collected_Date
December 2011
Disaster Risk Management
and Food Security Sector (DRMFSS)
Wednesday, September 3, 2014
Region S.N.N.P
Zone ALABA SPECIAL
Wereda
ALABA SPECIAL
Selected Indicator
Environmental Situation: Natural Resources Availability - Natural resources available and changes observed by
the community
KebeleName
NEGELE WEDESH
Resources_1
Land
Resources_3
Observed_Change_1
Decreasing
Observed_Change_3
Problems_Changes_1
Land Shortage and Problem Conflict
Problems_Changes_3
Resources_2
Observed_Change_2
Problems_Changes_2
Natural Forest
Decreasing
Degradation, Erosion and Gully Expansion
Resources_4
Observed_Change_4
Problems_Changes_4
KebeleName
HANTEZO
Resources_1
Land
Observed_Change_1
Decreasing
Problems_Changes_1
Land Shortage
Resources_2
Observed_Change_2
Problems_Changes_2
Forest
Decreasing
Degradation and Gully expansion on farm
land
Resources_3
Observed_Change_3
Problems_Changes_3
Resources_4
Observed_Change_4
Problems_Changes_4
126
Page 10 of 15

Wereda Disaster
Risk Profile
Data_Collected_Date
December 2011
Disaster Risk Management
and Food Security Sector (DRMFSS)
Wednesday, September 3, 2014
Region S.N.N.P
Zone ALABA SPECIAL
Wereda
ALABA SPECIAL
Selected Indicator
Environmental Situation: Natural Resources Availability - Natural resources available and changes observed by
the community
KebeleName
AYMELE
Resources_1
Land
Resources_3
Observed_Change_1
Decreasing
Observed_Change_3
Problems_Changes_1
Land Shortage
Problems_Changes_3
Resources_2
Observed_Change_2
Problems_Changes_2
Forest
Decreasing
Degradation and Gully expansion
Resources_4
Observed_Change_4
Problems_Changes_4
KebeleName
ANDEGNA TUKA
Resources_1
Land
Observed_Change_1
Decreasing
Problems_Changes_1
Land Shortage
Resources_2
Observed_Change_2
Problems_Changes_2
Forest
Decreasing
Degradation and Gully expansion
Resources_3
Observed_Change_3
Problems_Changes_3
Resources_4
Observed_Change_4
Problems_Changes_4
127
Page 11 of 15

Wereda Disaster
Risk Profile
Data_Collected_Date
December 2011
Disaster Risk Management
and Food Security Sector (DRMFSS)
Wednesday, September 3, 2014
Region S.N.N.P
Zone ALABA SPECIAL
Wereda
ALABA SPECIAL
Selected Indicator
Environmental Situation: Natural Resources Availability - Natural resources available and changes observed by
the community
KebeleName
MEJA
Resources_1
Land
Resources_3
Observed_Change_1
Decreasing
Observed_Change_3
Problems_Changes_1
Shortage of land
Problems_Changes_3
Resources_2
Observed_Change_2
Problems_Changes_2
Resources_4
Observed_Change_4
Problems_Changes_4
KebeleName
ASHEKORA BOTI
Resources_1
Land
Observed_Change_1
Decreasing
Problems_Changes_1
Land Shortage and Problem Conflict
Resources_2
Observed_Change_2
Problems_Changes_2
Natural Forest
Decreasing
Degradation and Erosion
Resources_3
Observed_Change_3
Problems_Changes_3
Resources_4
Observed_Change_4
Problems_Changes_4
128
Page 12 of 15

Wereda Disaster
Risk Profile
Data_Collected_Date
December 2011
Disaster Risk Management
and Food Security Sector (DRMFSS)
Wednesday, September 3, 2014
Region S.N.N.P
Zone ALABA SPECIAL
Wereda
ALABA SPECIAL
Selected Indicator
Environmental Situation: Natural Resources Availability - Natural resources available and changes observed by
the community
KebeleName
YAMBI
Resources_1
Land
Resources_3
Observed_Change_1
Decreasing
Observed_Change_3
Problems_Changes_1
Shortage of Land and land Degradation
Problems_Changes_3
Resources_2
Observed_Change_2
Problems_Changes_2
Resources_4
Observed_Change_4
Problems_Changes_4
KebeleName
AMATA
Resources_1
land
Observed_Change_1
Decreasing
Problems_Changes_1
Conflict or Land Shortage
Resources_2
Observed_Change_2
Problems_Changes_2
Resources_3
Observed_Change_3
Problems_Changes_3
Resources_4
Observed_Change_4
Problems_Changes_4
129
Page 13 of 15

Wereda Disaster
Risk Profile
Data_Collected_Date
December 2011
Disaster Risk Management
and Food Security Sector (DRMFSS)
Wednesday, September 3, 2014
Region S.N.N.P
Zone ALABA SPECIAL
Wereda
ALABA SPECIAL
Selected Indicator
Environmental Situation: Natural Resources Availability - Natural resources available and changes observed by
the community
KebeleName
TETALI BITORA
Resources_1
Land
Resources_3
Observed_Change_1
Decreasing
Observed_Change_3
Problems_Changes_1
Shortage of Land and Problematic Conflict
Problems_Changes_3
Resources_2
Observed_Change_2
Problems_Changes_2
Natural Forest
Decreasing
Degradation, Erosion and Gully Expansion
Resources_4
Observed_Change_4
Problems_Changes_4
KebeleName
GERME
Resources_1
Land
Observed_Change_1
Decreasing
Problems_Changes_1
Shortage of Land
Resources_2
Observed_Change_2
Problems_Changes_2
Resources_3
Observed_Change_3
Problems_Changes_3
Resources_4
Observed_Change_4
Problems_Changes_4
130
Page 14 of 15
Wereda Disaster
Risk Profile
Data_Collected_Date
December 2011
Disaster Risk Management
and Food Security Sector (DRMFSS)
Wednesday, September 3, 2014
Region S.N.N.P
Zone ALABA SPECIAL
Wereda
ALABA SPECIAL
Selected Indicator
Environmental Situation: Natural Resources Availability - Natural resources available and changes observed by
the community
KebeleName
BUBESA
Resources_1
Land
Resources_3
Observed_Change_1
Decreasing
Observed_Change_3
Problems_Changes_1
Land Shortage
Problems_Changes_3
Resources_2
Observed_Change_2
Problems_Changes_2
Forest
Degradation and Gully Expansion
Resources_4
Observed_Change_4
Problems_Changes_4
131
Page 15 of 15

Data_Collected_Date
December 2011
Wednesday, September 3, 2014
Region S.N.N.P
Zone ALABA SPECIAL
Wereda ALABA SPECIAL
Selected Indicator
KebeleName
Environmental Situation: Reasons for Environmental Changes
Reason_For_Environmental_Changes
MESERAK GORTANCHO
Population Growth
KOBO GETO
TEFO CHUFO
Population Pressure, deforestation, Bad Farming System and Poor
conservation work
Deforestation, Population Increase and Bad farming system
METO DUBALE
Deforestation, Population Growth and poor farming system
HABIBO FURANA
SINBITA
"Population Growth, Bad Farming Practice, Limited water shed
development effort, even though the
Population pressure, Forest Removal and Bad Farming Method
CHEMBULA
Forest Removal, High Erosion, Population growth and Bad Farming System
WEJEGO YATO
ANDEGNA TEFO
Forest Clearing, Bad Farming Method, Population Pleasure and Erratic
nature of Rainfall
Forest Removal, Population Increase and Bad farming System
SORGE DARGOSA
BUKET BAME
Population Growth, Poor water shed Development and Backward farming
Practices
Population Growth and Increased Investors Clearing Forest
HOLUGEB KUKE
Population pressure and Bad farming Practice
ANDEGNA KONCHA
Population Growth, Deforestation and Bad Farming Method
KULFO
BUBESA
Population Increase, Poor water shed development and Poor farming
system
Population Growth
132
Page 1 of 1

Data_Collected_Date
December 2011
Wednesday, September 3, 2014
Region S.N.N.P
Zone ALABA SPECIAL
Wereda ALABA SPECIAL
Selected Indicator
KebeleName
Environmental Situation: Soil Erosion - Observed changes on levels of soil erosion
by the community
Changes_Observed
Problems_Observed
MESERAK GORTANCHO
Increasing
Drought, Crop failure and Poor livestock yield
KOBO GETO
Increasing
Low yield, Soil Loss and High or large Gully
TEFO CHUFO
High Degradation
Poor Harvest, Large Gullies and food shortage
METO DUBALE
Increasing
Low Production
HABIBO FURANA
Increasing
Low Production and Drought
SINBITA
Increasing
Flooding, Drought and snow
CHEMBULA
Increasing
Soil loss, Degradation, Low yield and Hunger
WEJEGO YATO
ANDEGNA TEFO
Increasing
Increasing
Low Rainfall, low Production, Soil Loss and Low animal
Feed
Low crop Yield, Poor Soil and Large Gully
SORGE DARGOSA
Increasing
Poor Harvest and Drought
BUKET BAME
Increasing
Rain Reduction and less access to fire wood
HOLUGEB KUKE
Increasing
Low Production and Food Shortage
WETETA
Increasing
Low Production and Hunger
ANDEGNA KONCHA
KULFO
Increasing
Increasing
Poor Crop yield and high Gully
Low Production and Drought
LAYEGNAWO LENDA
Increasing
Decreasing of soil Production and Crop production
TACHEGNAWO BEDANE
Increasing
Soil erosion and Rainfall shortage
HULETEGNA MEKALA
HULETEGNA TUKA
Increasing
Increasing
Decreasing soil productivity and Decreasing crop
production
Decreasing soil productivity and Decreasing crop
production
133
Page 1 of 2

Data_Collected_Date
December 2011
Wednesday, September 3, 2014
Region S.N.N.P
Zone ALABA SPECIAL
Wereda ALABA SPECIAL
Selected Indicator
KebeleName
Environmental Situation: Soil Erosion - Observed changes on levels of soil erosion
by the community
Changes_Observed
Problems_Observed
NEGELE WEDESH
HANTEZO
Increasing
Increasing
Decreasing soil productivity and Decreasing crop
production
Decreasing of soil Production and Crop production
AYMELE
Increasing
Decreasing of soil Production and Crop production
ANDEGNA TUKA
Increasing
Decreasing of soil Production and Crop production
MEJA
Increasing
Decreasing of soil Production and Crop production
ASHEKORA BOTI
Increasing
Rain Reduction and Increased Erosion
YAMBI
Increasing
Low Production and Poverty
AMATA
Increasing
Decreasing of soil Production and Crop production
TETALI BITORA
Increasing
Decreasing of soil Production and Crop production
GERME
Increasing
Low Production, hunger and Poverty
BUBESA
Increasing
Decreasing of soil Production and Crop production
134
Page 2 of 2
Data_Collected_Date
December 2011
Wednesday, September 3, 2014
Region S.N.N.P
Zone ALABA SPECIAL
Wereda ALABA SPECIAL
Selected Indicator
KebeleName
Environmental Situation: Soil Erosion - Observed changes on levels of soil erosion
by the community
Changes_Observed
Problems_Observed
MESERAK GORTANCHO
Increasing
Drought, Crop failure and Poor livestock yield
KOBO GETO
Increasing
Low yield, Soil Loss and High or large Gully
TEFO CHUFO
High Degradation
Poor Harvest, Large Gullies and food shortage
METO DUBALE
Increasing
Low Production
HABIBO FURANA
Increasing
Low Production and Drought
SINBITA
Increasing
Flooding, Drought and snow
CHEMBULA
Increasing
Soil loss, Degradation, Low yield and Hunger
WEJEGO YATO
ANDEGNA TEFO
Increasing
Increasing
Low Rainfall, low Production, Soil Loss and Low animal
Feed
Low crop Yield, Poor Soil and Large Gully
SORGE DARGOSA
Increasing
Poor Harvest and Drought
BUKET BAME
Increasing
Rain Reduction and less access to fire wood
HOLUGEB KUKE
Increasing
Low Production and Food Shortage
WETETA
Increasing
Low Production and Hunger
ANDEGNA KONCHA
KULFO
Increasing
Increasing
Poor Crop yield and high Gully
Low Production and Drought
LAYEGNAWO LENDA
Increasing
Decreasing of soil Production and Crop production
TACHEGNAWO BEDANE
Increasing
Soil erosion and Rainfall shortage
HULETEGNA MEKALA
HULETEGNA TUKA
Increasing
Increasing
Decreasing soil productivity and Decreasing crop
production
Decreasing soil productivity and Decreasing crop
production
135
Page 1 of 2
Data_Collected_Date
December 2011
Wednesday, September 3, 2014
Region S.N.N.P
Zone ALABA SPECIAL
Wereda ALABA SPECIAL
Selected Indicator
KebeleName
Environmental Situation: Soil Erosion - Observed changes on levels of soil erosion
by the community
Changes_Observed
Problems_Observed
NEGELE WEDESH
HANTEZO
Increasing
Increasing
Decreasing soil productivity and Decreasing crop
production
Decreasing of soil Production and Crop production
AYMELE
Increasing
Decreasing of soil Production and Crop production
ANDEGNA TUKA
Increasing
Decreasing of soil Production and Crop production
MEJA
Increasing
Decreasing of soil Production and Crop production
ASHEKORA BOTI
Increasing
Rain Reduction and Increased Erosion
YAMBI
Increasing
Low Production and Poverty
AMATA
Increasing
Decreasing of soil Production and Crop production
TETALI BITORA
Increasing
Decreasing of soil Production and Crop production
GERME
Increasing
Low Production, hunger and Poverty
BUBESA
Increasing
Decreasing of soil Production and Crop production
136
Page 2 of 2
WDRP Indicators
Livelihood, Occupation and Source
of Food Characteristics
137

Wereda Disaster
Risk Profile
Data_Collected_Date
December 2011
Disaster Risk Management and Food
Security Sector (DRMFSS)
Wednesday, September 3, 2014
Region S.N.N.P
Zone
ALABA SPECIAL
Wereda ALABA SPECIAL
Selected Indicator
Economic Vulnerability: Major Occupational Categories - Major categories of occupation and percent of population
engaged in the occupation by Kebele
Occupational Categories and Percent of Population engaged within these occupational categories
Percent (%) of Population
KebeleName
Occupation 1
Population Occupation 2
Population Occupation 3
Population Occupation 4
Population
MESERAK
GORTANCHO
KOBO GETO
Agriculture
Agriculture
TEFO CHUFO
Agriculture
METO DUBALE
Agriculture
HABIBO FURANA
Agriculture
SINBITA
Agriculture
CHEMBULA
Agriculture
WEJEGO YATO
Agriculture
ANDEGNA TEFO
Agriculture
SORGE DARGOSA
Agriculture
BUKET BAME
Agriculture
HOLUGEB KUKE
Agriculture
Animal Rearing
138
Page 1 of 3

Wereda Disaster
Risk Profile
Data_Collected_Date
December 2011
Disaster Risk Management and Food
Security Sector (DRMFSS)
Wednesday, September 3, 2014
Region S.N.N.P
Zone
ALABA SPECIAL
Wereda ALABA SPECIAL
Selected Indicator
Economic Vulnerability: Major Occupational Categories - Major categories of occupation and percent of population
engaged in the occupation by Kebele
Occupational Categories and Percent of Population engaged within these occupational categories
Percent (%) of Population
KebeleName
Occupation 1
Population Occupation 2
Population Occupation 3
Population Occupation 4
Population
WETETA
Agriculture
ANDEGNA KONCHA
Agriculture
KULFO
Agriculture
LAYEGNAWO
LENDA
TACHEGNAWO
BEDANE
HULETEGNA
MEKALA
HULETEGNA TUKA
Agriculture
Agriculture
Agriculture
Agriculture
Animal Rearing
Animal Rearing
Animal
Animal Rearing
NEGELE WEDESH
Agriculture
Animal Rearing
HANTEZO
Agriculture
Animal Rearing
AYMELE
Agriculture
Animal Rearing
ANDEGNA TUKA
Agriculture
Animal Rearing
139
Page 2 of 3

Wereda Disaster
Risk Profile
Data_Collected_Date
December 2011
Disaster Risk Management and Food
Security Sector (DRMFSS)
Wednesday, September 3, 2014
Region S.N.N.P
Zone
ALABA SPECIAL
Wereda ALABA SPECIAL
Selected Indicator
Economic Vulnerability: Major Occupational Categories - Major categories of occupation and percent of population
engaged in the occupation by Kebele
Occupational Categories and Percent of Population engaged within these occupational categories
Percent (%) of Population
KebeleName
Occupation 1
Population Occupation 2
Population Occupation 3
Population Occupation 4
Population
MEJA
Agriculture
Animal Rearing
ASHEKORA BOTI
Agriculture
Animal Rearing
YAMBI
Agriculture
Livestock Production
AMATA
Agriculture
Animal Rearing
TETALI BITORA
Agriculture
Animal Rearing
GERME
Agriculture
Livestock Production
BUBESA
Agriculture
Animal Rearing
140
Page 3 of 3

Data_Collected_Date
December 2011
Wednesday, September 3, 2014
Region S.N.N.P
Zone ALABA SPECIAL
Wereda ALABA SPECIAL
Selected Indicator
Economic Vulnerability: Livelihoods - Households important sources of
livelihood (response in %)
Type of Livelihood Activity
Order of Importnce
Agricultural laborer
1st
2nd
3rd
29.04
2.40
0.79
Animal herder
1.64
0.90
11.02
Basket-making, Mat-making
0.00
0.30
0.00
Begging activities
0.00
0.30
0.79
Buying and selling livestock (cattle, sheep, goats, camels)
0.00
6.01
0.79
Carpenter, Furniture-maker, or Metal-worker
0.00
0.00
0.00
Construction worker (masonry)
0.00
0.30
0.79
Daily laborer
0.27
2.70
5.51
Military service
0.00
0.00
0.79
Others
0.00
0.30
0.00
Rearing & selling animals (camels, cattle, sheep, goats)
0.55
61.86
13.39
Salaried job
0.00
0.30
0.00
Sale_Of_Natural_Products - Animal feed (grass, fodder, forage, salty
sand, etc.)
141
0.00
9.91
5.51
Page 1 of 2
Data_Collected_Date
December 2011
Wednesday, September 3, 2014
Region S.N.N.P
Zone ALABA SPECIAL
Wereda ALABA SPECIAL
Selected Indicator
Economic Vulnerability: Livelihoods - Households important sources of
livelihood (response in %)
Type of Livelihood Activity
Order of Importnce
1st
2nd
3rd
Sale_Of_Natural_Products - Charcoal
0.00
0.00
1.57
Sale_Of_Natural_Products - Firewood
0.27
3.00
3.15
Sale_Of_Natural_Products - Incense, frankincense, and natural gum
0.00
0.00
0.79
Sale_Of_Natural_Products - Precious stones (gold, gem-stones)
0.00
0.00
1.57
Sale_Of_Natural_Products - Water
0.00
0.90
8.66
Selling Cereal food crops (sorghum, maize, wheat, barley)
66.58
7.81
37.01
Selling Chat / Khat
0.27
1.50
6.30
Selling Clothes and shoes
0.00
0.00
0.79
Selling cooked food
0.00
0.30
0.00
Selling dairy products (milk, butter, ghee, cheese)
0.00
0.30
0.79
Selling Fruits (mango, papaya, banana, orange, lemon, etc.)
0.00
0.90
0.00
Selling meat (from own livestock)
1.10
0.00
0.00
Selling Other foods (sugar, flour, coffee, etc.)
0.27
0.00
0.00
142
Page 2 of 2

Data_Collected_Date
December 2011
Wednesday, September 3, 2014
Region S.N.N.P
Zone ALABA SPECIAL
Wereda ALABA SPECIAL
Selected Indicator
Economic Vulnerability: Occupational Categories - Percent of population
above 15 years age by occupation categories
Type of Livelihood Activity
Main Occupation
Secondary Occupation
Below school age children
Cultivator
Neither studying nor working nor seeking work
None
Others (specify)
Physically disabled
Retired/ Old
Salaried
Student
Unemployed & seeking work
Agricultural labourer
Chronically ill
Craftsman
Home-maker (housewife)
Livestock rearing
Non-agricultural labour
Shopkeeper and Petty trade
1st Occupation
0.40
42.37
0.81
0.00
1.52
0.10
2.33
0.10
18.30
0.81
0.81
0.30
0.10
29.63
0.00
1.62
0.81
2nd Occupation
0.00
18.13
0.26
0.78
0.52
0.00
1.04
1.55
1.55
1.81
6.74
0.00
0.00
13.47
1.04
51.04
2.07
143
Page 1 of 1
Wereda Disaster
Risk Profile
Data_Collected_Date
December 2011
Disaster Risk Management
and Food Security Sector (DRMFSS)
Wednesday, September 3, 2014
Region S.N.N.P
Zone ALABA SPECIAL
Wereda ALABA SPECIAL
Economic Vulnerability: Sources of Food - Households source for different food items (response in %)
Selected Indictor:
Source of Food
Types of Food Item
Begging
Borrowed
Casual labor
0.81
Free meals/Food assistance
Gifts from friends/neighbors
Other
1.00
0.32
1.00
2.23
0.91
0.32
0.32
0.91
1.91
2.44
1.43
144
Page 1 of 2

0.36
0.36
0.36
145
Wereda Disaster
Risk Profile
Data_Collected_Date
December 2011
Disaster Risk Management
and Food Security Sector (DRMFSS)
Wednesday, September 3, 2014
Region S.N.N.P
Zone ALABA SPECIAL
Wereda ALABA SPECIAL
Economic Vulnerability: Sources of Food - Households source for different food items (response in %)
Selected Indictor:
Source of Food
Types of Food Item
Own cultivation/production
Purchase from roadside
vendor/tuck shop
Purchase subsidized food
from Kebele shop
Purchases from main shop
8.06 100.00
66.67
28.57
97.50
87.00
0.32
92.04
2.86 100.00
1.82
37.90
42.85
2.50
4.00
45.98
1.59
31.71
75.71
42.73
1.00
0.32
0.32
1.43
53.23
33.33
28.57
6.00
49.84
1.59
65.85
18.57
53.64
146
Page 2 of 2

37.50
45.36
12.86
3.21
147
WDRP Indicators
Crop Production Characteristics
148
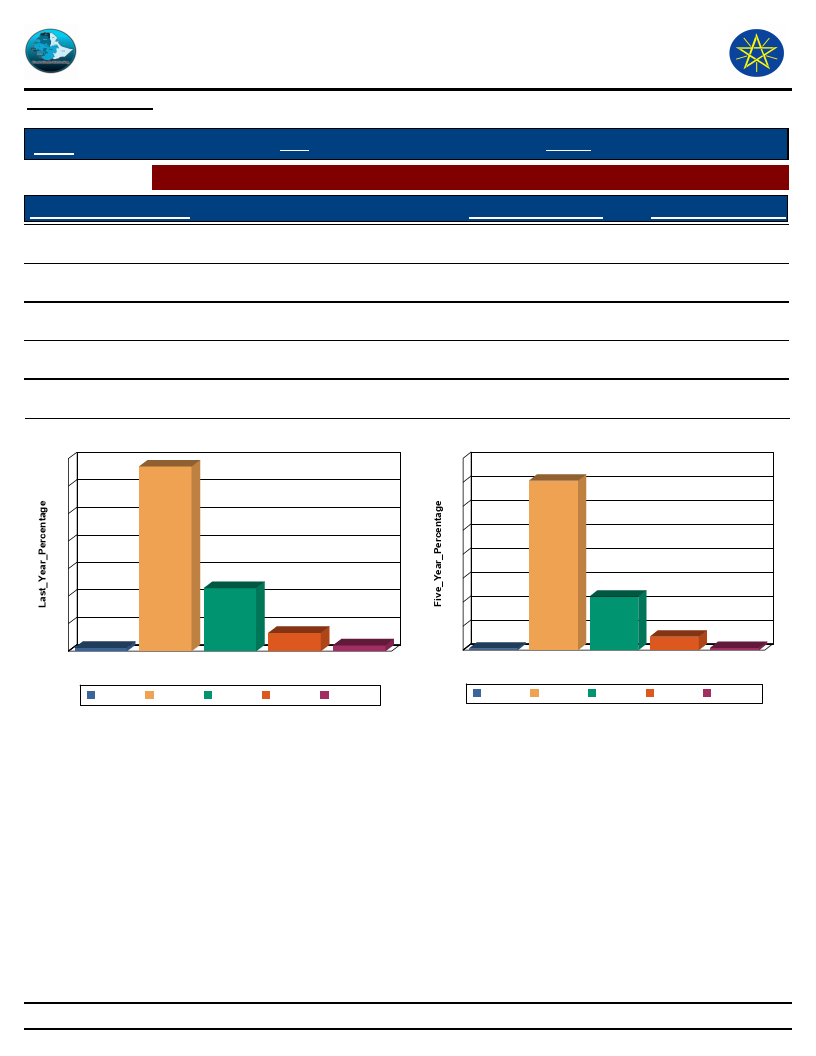
Wereda Disaster
Risk Profile
Data_Collected_Date
December 2011
Disaster Risk Management
and Food Security Sector (DRMFSS)
Thursday, September 4, 2014
Region S.N.N.P
Zone ALABA SPECIAL
Wereda ALABA SPECIAL
Selected Indictor: Hazards: Change in Crop Damages - Proportion of Total Crop Damage
Extent of Crop Damage (%)
0
Last_Year_Percentage
1.21
Five_Year_Percentage
0.59
1 - 25
67.13
70.67
26 _ 50
22.91
22.27
51 _ 75
6.64
5.55
76 _ 100
2.11
0.92
Extent of Crop Damage Last_Year
70
67
60
50
40
30
23
20
10
1
0
0
0
7
1 - 25
26 _ 50
51 _ 75
Extent of Crop Damage
1 - 25
26 _ 50
51 _ 75
2
76 _ 100
76 _ 100
Extent of Crop Damage Five Years Ago
80
71
70
60
50
40
30
22
20
10
1
0
0
0
6
1 - 25
26 _ 50
51 _ 75
Extent of Crop Damage
1 - 25
26 _ 50
51 _ 75
1
76 _ 100
76 _ 100
149
Page 1 of 1
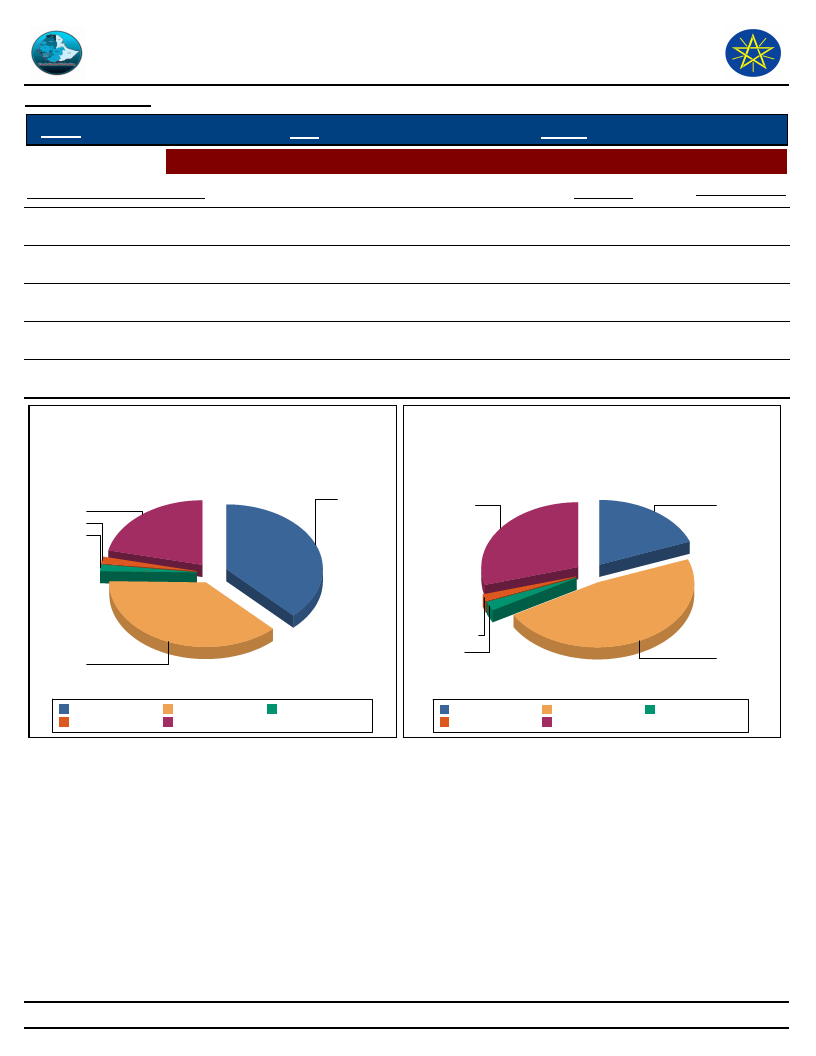
Wereda Disaster
Risk Profile
Data_Collected_Date
December 2011
Disaster Risk Management
and Food Security Sector (DRMFSS)
Wednesday, September 3, 2014
Region S.N.N.P
Zone ALABA SPECIAL
Wereda ALABA SPECIAL
Selected Indictor: Hazards: Change in Crop Damages - Major reasons for crop damage
Major Reason of Crop Damage
Last_Year
Five_Year_Ago
Pests / Termite
28.32
29.55
Drought
49.84
47.47
Flood
49.84
19.11
Frost/ Cold wave
2.02
2.44
Others (specify)
2.35
1.43
Major Reason of Crop Damage -
Last Year
Major Reason of Crop Damage -
Five Years Ago
49.8
28.3
Pests / Termite
Flood
2.4
2.0
49.8
Flood
Others (specify)
Drought
Pests / Termite
Frost/ Cold wave
Others (specify)
Frost/ Cold
wave
Drought
Flood
Others (specify)
Drought
Pests / Termite
Frost/ Cold wave
150
Page 1 of 1
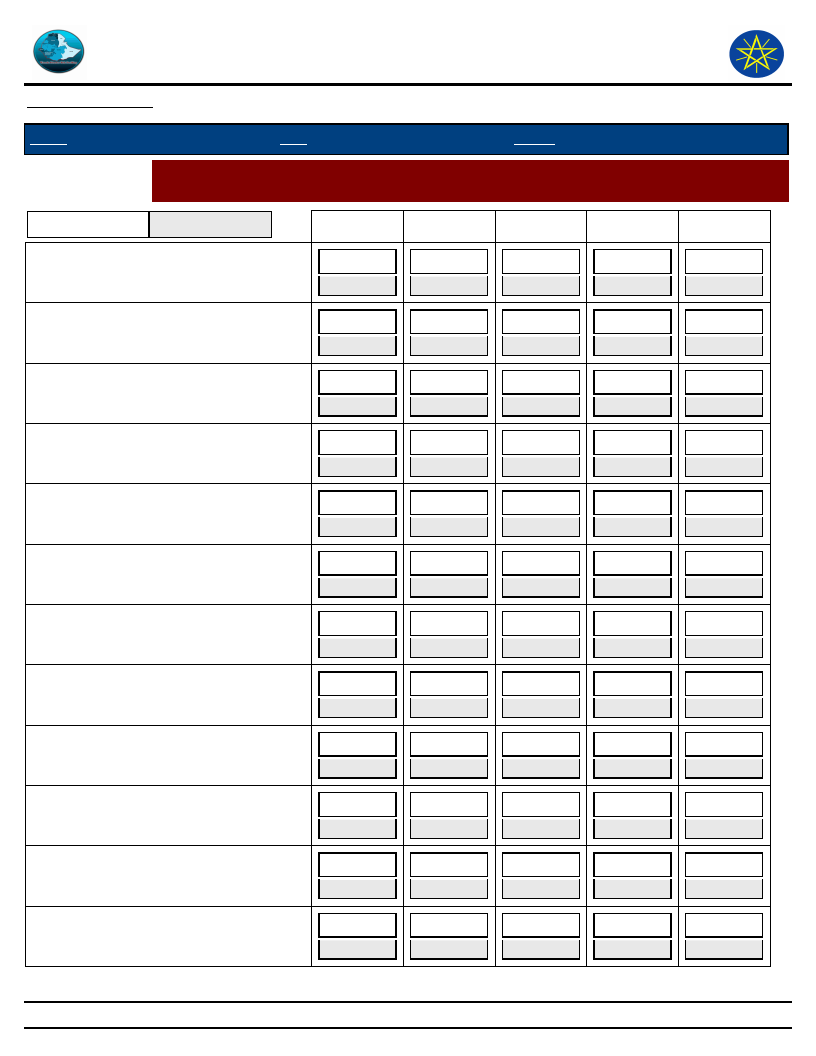
Wereda Disaster
Risk Profile
Data_Collected_Date
December 2011
Disaster Risk Management
and Food Security Sector (DRMFSS)
Wednesday, September 3, 2014
Region S.N.N.P
Zone ALABA SPECIAL
Wereda ALABA SPECIAL
Selected Indictor:
Hazards: Change in Crop Damages - Proportion of Damage for Major Crops
(percentage response by households)
Last Year
Five Years Ago
0%
1_25%
26_50%
51_75%
76_100%
Barley
0.00
100.00
0.00
0.00
0.00
0.00
100.00
0.00
0.00
0.00
Beans
0.00
42.86
42.86
0.00
14.29
0.00
90.00
10.00
0.00
0.00
Chat
14.29
42.86
42.86
0.00
0.00
1.08
71.35
18.92
8.11
0.54
Hops
0.00
100.00
0.00
0.00
0.00
0.00
50.00
50.00
0.00
0.00
Lentils
0.00
100.00
0.00
0.00
0.00
0.00
0.00
33.33
66.67
0.00
Maize
0.85
66.76
25.57
5.11
1.70
0.28
58.76
33.33
5.65
1.98
Millet
3.81
73.33
14.29
7.62
0.95
0.90
73.87
17.12
7.21
0.90
Neug
0.00
0.00
100.00
0.00
0.00
0.00
100.00
0.00
0.00
0.00
Other cash crop
1.00
63.68
25.87
6.97
2.49
0.00
0.00
0.00
0.00
0.00
Other grain (specify)
0.00
44.44
11.11
33.33
11.11
0.00
87.50
12.50
0.00
0.00
Other pulses
3.85
61.54
19.23
15.38
0.00
0.00
100.00
0.00
0.00
0.00
Peas
0.00
100.00
0.00
0.00
0.00
0.00
100.00
0.00
0.00
0.00
151
Page 1 of 2
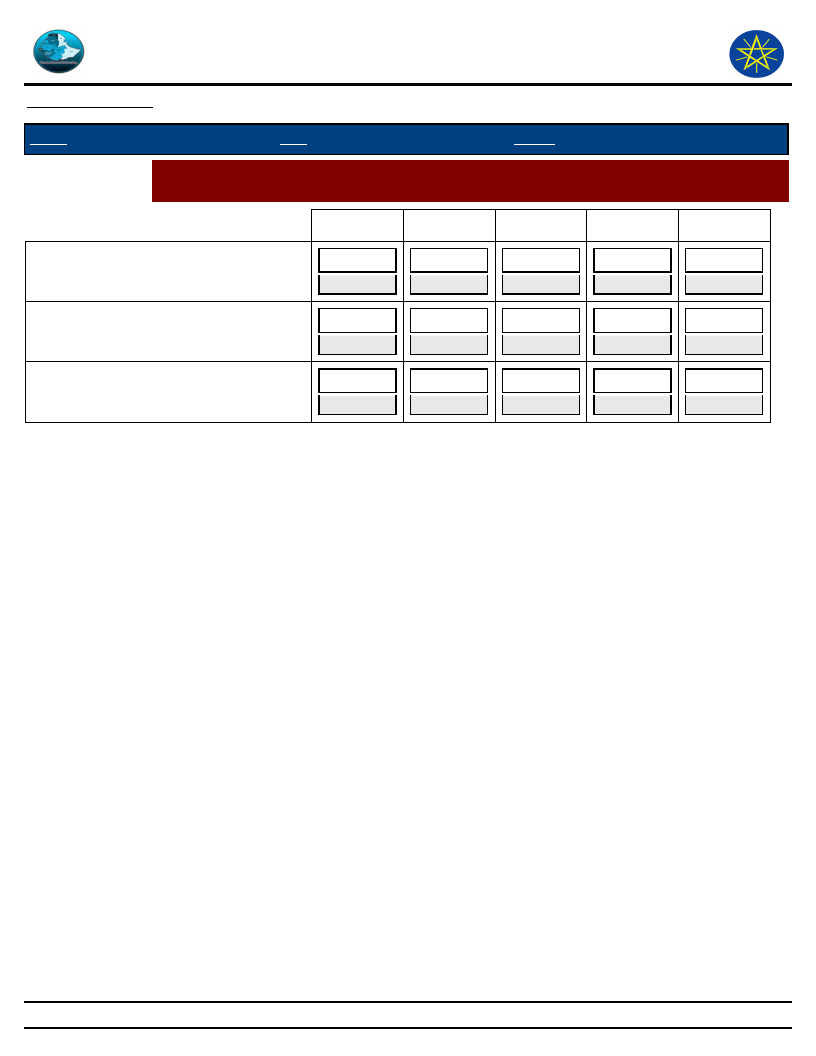
Wereda Disaster
Risk Profile
Data_Collected_Date
December 2011
Disaster Risk Management
and Food Security Sector (DRMFSS)
Wednesday, September 3, 2014
Region S.N.N.P
Zone ALABA SPECIAL
Wereda ALABA SPECIAL
Selected Indictor:
Hazards: Change in Crop Damages - Proportion of Damage for Major Crops
(percentage response by households)
0%
1_25%
26_50%
51_75%
Sorghum
0.64
73.25
19.75
4.46
1.26
76.73
15.72
6.29
76_100%
1.91
0.00
Teff
1.30
67.39
20.43
8.70
2.17
0.48
82.61
14.01
2.90
0.00
Wheat
0.00
64.12
26.72
6.11
3.05
0.00
70.50
24.46
3.60
1.44
152
Page 2 of 2
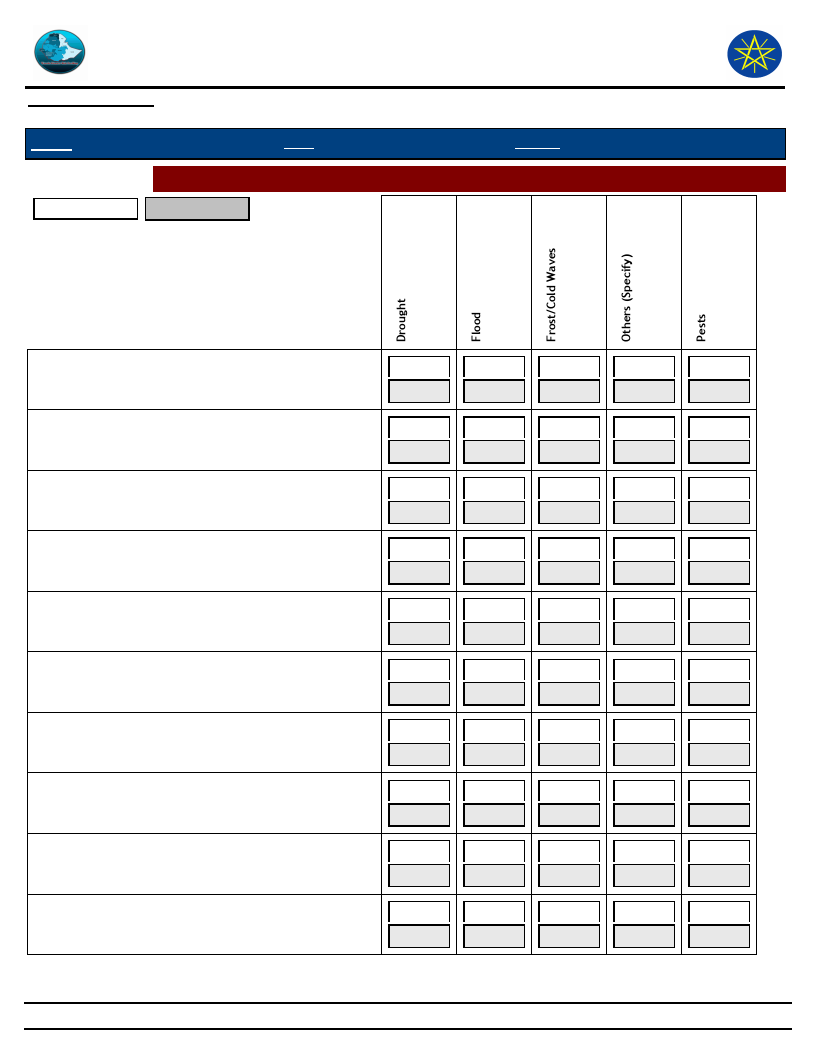
Wereda Disaster
Risk Profile
Data_Collected_Date
December 2011
Disaster Risk Management
and Food Security Sector (DRMFSS)
Wednesday, September 3, 2014
Region S.N.N.P
Zone ALABA SPECIAL
Wereda ALABA SPECIAL
Selected Indictor: Hazards: Change in Crop Damages - Reasons for Damage of Major Crops
Last Year
Five Years Ago
Barley
Beans
Chat
Hops
Lentils
Maize
Millet
Neug
Other cash crop
Other grain (specify)
60.00
66.67
57.14
50.00
42.86
35.33
0.00
50.00
0.00
33.33
44.79
43.63
59.62
52.29
0.00
100.00
39.90
0.00
87.50
37.50
40.00
0.00
42.86
10.00
0.00
19.02
100.00
0.00
0.00
0.00
18.87
16.43
18.27
22.94
0.00
0.00
13.30
0.00
0.00
50.00
0.00
0.00
0.00
0.00
28.57
6.52
0.00
25.00
0.00
0.00
0.28
0.28
1.92
0.92
0.00
0.00
4.43
0.00
0.00
0.00
0.00
0.00
0.00
33.33
0.00
0.00
0.00
40.00
0.00
28.57
2.17
36.96
0.00
0.00
0.00
25.00
0.00
100.00
0.00
66.67
1.41
34.65
0.85
38.81
0.96
19.23
0.92
22.94
0.00
100.00
0.00
0.00
2.46
39.90
0.00
0.00
0.00
12.50
0.00
12.50
153
Page 1 of 2
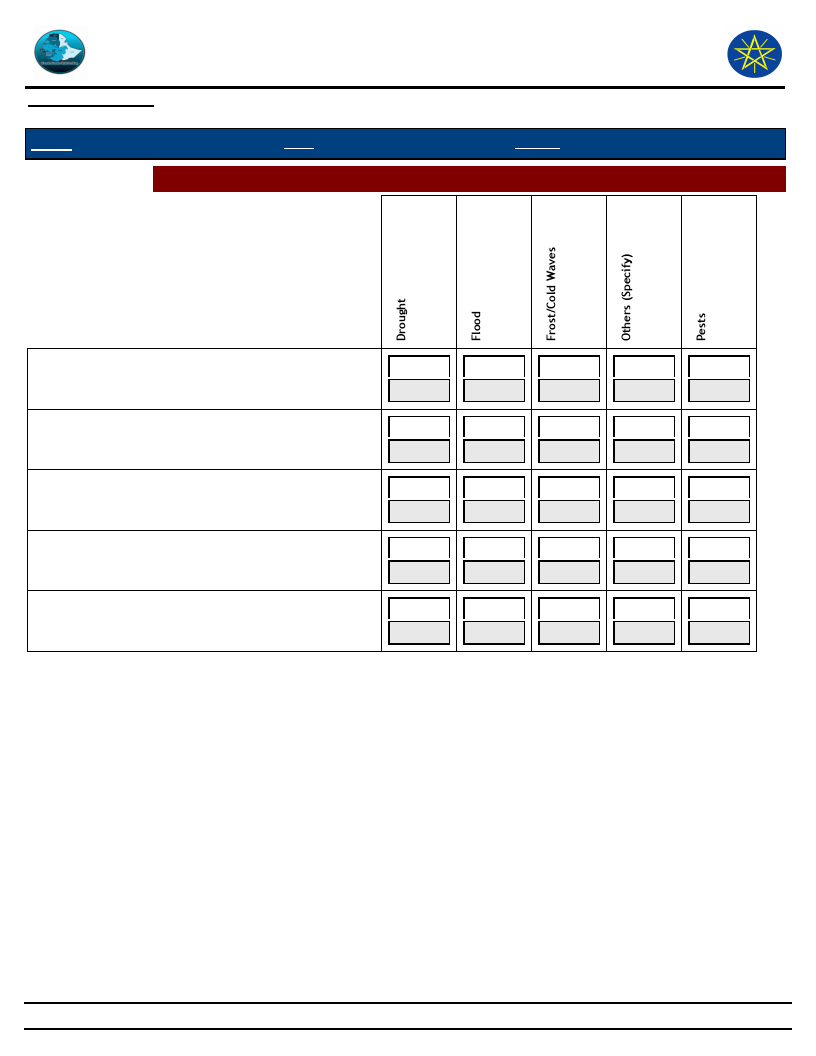
Wereda Disaster
Risk Profile
Data_Collected_Date
December 2011
Disaster Risk Management
and Food Security Sector (DRMFSS)
Wednesday, September 3, 2014
Region S.N.N.P
Zone ALABA SPECIAL
Wereda ALABA SPECIAL
Selected Indictor: Hazards: Change in Crop Damages - Reasons for Damage of Major Crops
Other pulses
Peas
Sorghum
Teff
Wheat
34.62
19.23
0.00
100.00
0.00
0.00
0.00
0.00
0.00
0.00
0.00
0.00
52.87
17.20
0.64
55.00
16.88
1.25
58.95
16.59
3.49
53.14
23.67
4.83
53.85
20.00
1.54
52.52
19.42
1.44
0.00
46.15
0.00
0.00
0.00
100.00
0.00
100.00
5.10
24.20
1.88
25.00
2.62
18.34
1.93
16.43
3.08
21.54
1.44
25.18
154
Page 2 of 2

Wereda Disaster
Risk Profile
Data_Collected_Date
December 2011
Disaster Risk Management and Food
Security Sector (DRMFSS)
Wednesday, September 3, 2014
Region
S.N.N.P
Zone
ALABA SPECIAL
Wereda
ALABA SPECIAL
Selected Indictor:
Agricultural Situation: Change in Crops Grown - Five major crops grown by proportion of total cultivated land
Kebele Name
MESERAK GORTANCHO
Major Crops
Maize
Main Season
Belg
Present
Cropped Area
Five_Years_Ago
20
60
Reason_For_Change
Market Price
Sorghum
Belg
20
15
Millet
Belg
15
10
Peas
Meher
8
8
Teff
Meher
7
7
KOBO GETO
Maize
Belg
50
55
Market Price
Pepper
Meher
15
10
Market Price
Teff
Meher
12
10
Market Price
Wheat
Meher
15
10
Market Price
Millet
Belg
8
15
Market Price
TEFO CHUFO
Maize
Belg
45
55
Market Price
Pepper
Meher
15
10
Market Price
Teff
Meher
20
15
Market Price
Wheat
Meher
15
10
Market Price
Millet
Belg
5
10
Market Price
155
Page 1 of 9

Wereda Disaster
Risk Profile
Data_Collected_Date
December 2011
Disaster Risk Management and Food
Security Sector (DRMFSS)
Wednesday, September 3, 2014
Region
S.N.N.P
Zone
ALABA SPECIAL
Wereda
ALABA SPECIAL
Selected Indictor:
Agricultural Situation: Change in Crops Grown - Five major crops grown by proportion of total cultivated land
Kebele Name
METO DUBALE
Major Crops
Maize
Main Season
Belg
Present
Cropped Area
Five_Years_Ago
50
60
Reason_For_Change
Market Price
Millet
Meher
5
10
Market Price
Pepper
Meher
15
10
Market Price
Sorghum
Belg
10
10
Market Price
HABIBO FURANA
Millet
Belg
10
10
Market Price
Maize
Belg
50
55
Market Price
Pepper
Meher
15
10
Market Price
Sorghum
Belg
20
20
Market Price
Wheat
Meher
5
5
Market Price
SINBITA
Millet
Belg
10
10
Market Price
Maize
Belg
55
65
Market Price
Pepper
Meher
20
15
Market Price
Wheat
Meher
10
5
Market Price
Sorghum
Belg
5
5
Market Price
CHEMBULA
Millet
Belg
7
7
Market Price
156
Page 2 of 9

Wereda Disaster
Risk Profile
Data_Collected_Date
December 2011
Disaster Risk Management and Food
Security Sector (DRMFSS)
Wednesday, September 3, 2014
Region
S.N.N.P
Zone
ALABA SPECIAL
Wereda
ALABA SPECIAL
Selected Indictor:
Agricultural Situation: Change in Crops Grown - Five major crops grown by proportion of total cultivated land
Kebele Name
CHEMBULA
Major Crops
Maize
Main Season
Belg
Present
Cropped Area
Five_Years_Ago
50
60
Reason_For_Change
Market Price
Teff
Meher
20
15
Market Price
Pepper
Meher
15
10
Market Price
Beans
All Season
8
8
Market Price
WEJEGO YATO
Millet
Belg
5
5
Market Price
Maize
Belg
50
50
Market Price
Wheat
Meher
20
20
Market Price
Pepper
Meher
15
10
Market Price
Sorghum
Belg
10
10
Market Price
ANDEGNA TEFO
Millet
Belg
5
10
Market Price
Maize
Belg
55
60
Market Price
Teff
Meher
12
10
Market Price
Pepper
Meher
15
10
Market Price
Sorghum
Belg
13
10
Market Price
SORGE DARGOSA
Millet
Belg
10
10
157
Page 3 of 9

Wereda Disaster
Risk Profile
Data_Collected_Date
December 2011
Disaster Risk Management and Food
Security Sector (DRMFSS)
Wednesday, September 3, 2014
Region
S.N.N.P
Zone
ALABA SPECIAL
Wereda
ALABA SPECIAL
Selected Indictor:
Agricultural Situation: Change in Crops Grown - Five major crops grown by proportion of total cultivated land
Kebele Name
SORGE DARGOSA
Major Crops
Maize
Main Season
Belg
Present
Cropped Area
Five_Years_Ago
50
55
Reason_For_Change
Market Price
Sorghum
Belg
20
20
Wheat
Belg
5
5
BUKET BAME
Maize
Meher
50
50
Wheat
Meher
20
15
Market Price
Pepper
Belg
15
10
Market Price
Sorghum
Belg
10
10
Market Price
Barley
Meher
5
5
Market Price
HOLUGEB KUKE
Maize
Belg
50
60
Market Price
Teff
Meher
20
15
Market Price
Haricot Bean
Millet
Belg and
15
Meher
Belg
8
10
Market Price
8
Market Price
Sorghum
Belg
7
7
Market Price
WETETA
Maize
Belg
52
70
Market Price
Wheat
Meher
10
15
Market Price
158
Page 4 of 9

Wereda Disaster
Risk Profile
Data_Collected_Date
December 2011
Disaster Risk Management and Food
Security Sector (DRMFSS)
Wednesday, September 3, 2014
Region
S.N.N.P
Zone
ALABA SPECIAL
Wereda
ALABA SPECIAL
Selected Indictor:
Agricultural Situation: Change in Crops Grown - Five major crops grown by proportion of total cultivated land
Kebele Name
WETETA
Major Crops
Pepper
Main Season
Meher
Present
Cropped Area
Five_Years_Ago
20
15
Reason_For_Change
Market Price
Millet
Belg
10
15
Market Price
Sorghum
Belg
8
5
Market Price
ANDEGNA KONCHA
Maize
Belg
53
60
Market Price
Teff
Meher
12
10
Market Price
Wheat
Meher
15
10
Market Price
Pepper
Meher
15
10
Market Price
Millet
Belg
5
10
Market Price
KULFO
Maize
Belg
50
55
Market Price
Pepper
Meher
15
10
Market Price
Sorghum
Belg
20
20
Market Price
Wheat
Meher
5
5
Market Price
Millet
Belg
10
10
Market Price
LAYEGNAWO LENDA
Maize
Belg
50
60
Market Price
Sorghum
Belg
10
10
Market Price
159
Page 5 of 9

Wereda Disaster
Risk Profile
Data_Collected_Date
December 2011
Disaster Risk Management and Food
Security Sector (DRMFSS)
Wednesday, September 3, 2014
Region
S.N.N.P
Zone
ALABA SPECIAL
Wereda
ALABA SPECIAL
Selected Indictor:
Agricultural Situation: Change in Crops Grown - Five major crops grown by proportion of total cultivated land
Kebele Name
LAYEGNAWO LENDA
Major Crops
Millet
Main Season
Belg
Present
Cropped Area
Five_Years_Ago
5
5
Reason_For_Change
Market Price
Wheat
Meher
20
10
Market Price
Pepper
Meher
15
15
Market Price
TACHEGNAWO BEDANE
Maize
Belg
50
50
Market Price
Millet
Belg
5
5
Market Price
Wheat
Meher
10
10
Market Price
Pepper
Meher
20
15
Market Price
Teff
Meher
15
10
Market Price
HANTEZO
Maize
Belg
50
60
Market Price
Wheat
Meher
20
10
Market Price
Pepper
Meher
15
15
Market Price
Sorghum
Belg
10
10
Market Price
Teff
Meher
5
5
Market Price
AYMELE
Maize
Belg
50
60
Market Price
Sorghum
Belg
10
10
Market Price
160
Page 6 of 9

Wereda Disaster
Risk Profile
Data_Collected_Date
December 2011
Disaster Risk Management and Food
Security Sector (DRMFSS)
Wednesday, September 3, 2014
Region
S.N.N.P
Zone
ALABA SPECIAL
Wereda
ALABA SPECIAL
Selected Indictor:
Agricultural Situation: Change in Crops Grown - Five major crops grown by proportion of total cultivated land
Kebele Name
AYMELE
Major Crops
Millet
Main Season
Belg
Present
Cropped Area
Five_Years_Ago
5
5
Reason_For_Change
Market Price
Pepper
Meher
15
15
Market Price
Wheat
Meher
20
10
Market Price
ANDEGNA TUKA
Maize
Belg
50
60
Market Price
Sorghum
Belg
10
10
Market Price
Millet
Belg
5
5
Market Price
Wheat
Meher
20
10
Market Price
Pepper
Meher
15
15
Market Price
MEJA
Maize
Belg
50
60
Market Price
Sorghum
Belg
10
20
Market Price
Millet
Belg
5
5
Market Price
Teff
Meher
15
10
Market Price
Teff
Meher
20
15
Market Price
Pepper
Meher
20
15
Market Price
ASHEKORA BOTI
Maize
Belg
50
60
Market Price
161
Page 7 of 9

Wereda Disaster
Risk Profile
Data_Collected_Date
December 2011
Disaster Risk Management and Food
Security Sector (DRMFSS)
Wednesday, September 3, 2014
Region
S.N.N.P
Zone
ALABA SPECIAL
Wereda
ALABA SPECIAL
Selected Indictor:
Agricultural Situation: Change in Crops Grown - Five major crops grown by proportion of total cultivated land
Kebele Name
ASHEKORA BOTI
Major Crops
Sorghum
Main Season
Belg
Present
Cropped Area
Five_Years_Ago
10
10
Reason_For_Change
Market Price
Wheat
Meher
20
10
Market Price
Pepper
Meher
15
15
Market Price
Millet
Belg
5
5
Market Price
YAMBI
Maize
Belg
40
50
Market Price
Pepper
Meher
20
20
Teff
Meher
15
10
Wheat
Meher
15
10
AMATA
Maize
Belg
50
60
Market Price
Pepper
Meher
20
15
Market Price
Teff
Meher
15
10
Market Price
Sorghum
Belg
10
10
Market Price
Millet
Belg
5
5
Market Price
TETALI BITORA
Maize
Belg
50
60
Market Price
Sorghum
Belg
10
10
Market Price
162
Page 8 of 9
Wereda Disaster
Risk Profile
Data_Collected_Date
December 2011
Disaster Risk Management and Food
Security Sector (DRMFSS)
Wednesday, September 3, 2014
Region
S.N.N.P
Zone
ALABA SPECIAL
Wereda
ALABA SPECIAL
Selected Indictor:
Agricultural Situation: Change in Crops Grown - Five major crops grown by proportion of total cultivated land
Kebele Name
TETALI BITORA
Major Crops
Millet
Main Season
Belg
Present
Cropped Area
Five_Years_Ago
5
5
Reason_For_Change
Market Price
Wheat
Meher
20
10
Market Price
Pepper
Meher
15
15
Market Price
GERME
Pepper
Meher
40
50
Pepper
Meher
20
20
Teff
Meher
15
10
Wheat
Meher
15
10
Millet
Belg
5
5
BUBESA
Maize
Belg
50
60
Market Price
Sorghum
Belg
10
10
Millet
Belg
5
5
Wheat
Meher
20
10
Pepper
Meher
15
15
Pepper
Meher
163
Page 9 of 9
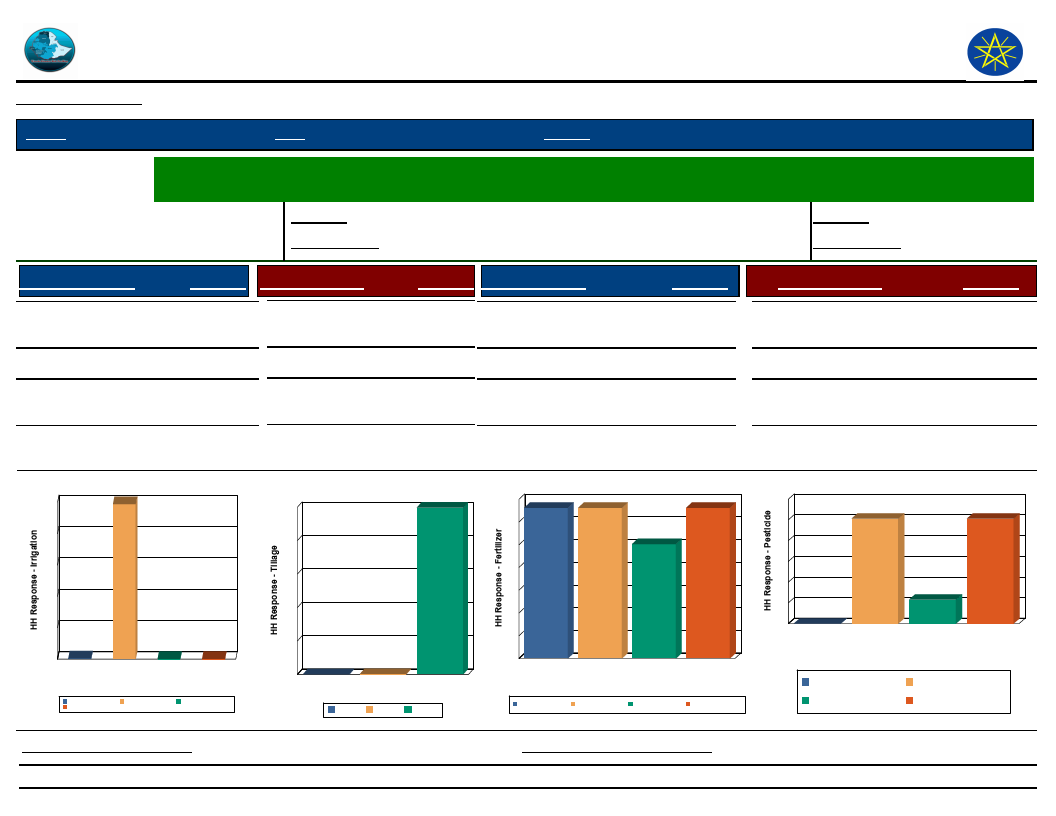
Wereda Disaster
Risk Profile
Data_Collected_Date
December 2011
Disaster Risk Management
and Food Security Sector (DRMFSS)
Thursday, September 4, 2014
Region S.N.N.P
Zone ALABA SPECIAL
Wereda ALABA SPECIAL
Selected Indictor:
Economic Vulnerability: Status of Agriculture - Methods of tillage, Irrigation and other agricultural input utilization
by households
Percentage of
Last Year
0.80
Irrigated Area
Five Years Ago
0.10
Percentage of households
Last Year
0.00
with irrigated area
Five Years Ago
0.00
Source of Irrigation
River/Lake/Pond
Response Method of Tillage
0.27 Oxen
Response Type of Fertilizer
99.73 Chemical
Response
26.45
Birkas (tanks)
0.55 None
0.27
Other (specify)
0.27
0.00
No Irrigation
(Rain-fed)
Source of Irrigation
99
100
98.90
80
60
40
20
1
0
Birkas (tanks)
0
0
Other (specify)
No Irrigation (Rain-fed)
River/Lake/Pond
Source of Irrigation
Birkas (tanks)
River/Lake/Pond
No Irrigation (Rain-fed)
Other (specify)
0.00
Method of Tillage
100
100
80
60
40
20
0
0
0
None
Oxen
Method of Tillage
None Oxen
Natural/Animal manure
Both Chemical and
Natural
None
20.11
26.45
26.45
Type of Fertilizer
28
26
26
26
24
20
20
16
12
8
4
0
Both
Chemical and
Natural
Chemical Natural/Animal
manure
Type of Fertilizer
None
Both Chemical and
Natural
Chemical
Natural/Animal manure
None
Type of Pesticide
Chemicals (insecticides,
fungicide, etc)
Natural methods
None
Response
50.55
11.60
50.55
0.00
Type of Pesticide
60
51
51
50
40
30
20
10
0
0
12
Chemicals
(insecticides,
fungicide, etc)
Natural
methods
Type of Pesticide
None
Natural methods
Chemicals (insecticides,
fungicide, etc)
None
Proportion_Improved_Seeds
82.42
Proportion_Agriculture_Service
164
87.26
Page 1 of 1
Data_Collected_Date
December 2011
Wednesday, September 3, 2014
Region S.N.N.P
Zone ALABA SPECIAL
Wereda ALABA SPECIAL
Selected Indicator
Economic Vulnerability: Crops Grown - Number of crops grown by households
Number of Crops Grown
One type
Crops Grown Last Year
1.36
Crops Grown Five Years Ago
1.73
Two types
9.82
10.90
Three types
27.80
29.56
Four types
30.11
30.14
Five types
30.91
27.66
Avg Crops Grown Last Year
Avg Crops Grown Five Years Ago
3.79
3.71
Number of Crops Grown Last Year
32
31
30
28
28
24
20
16
12
10
8
4
0
Five types
1
Four types One type Three types
Number of Crops Grown
Two types
Five types
Two types
Four types
One type
Three types
Number of Crops Grown five years ago
32
30
30
28
28
24
20
16
12
11
8
4
0
Five types
2
Four types One type Three types Two types
Number of Crops Grown
Five types
Two types
Four types
One type
Three types
165
Page 1 of 1
Data_Collected_Date
Region S.N.N.P
December 2011
Zone ALABA SPECIAL
Wednesday, September 3, 2014
Wereda ALABA SPECIAL
Selected Indicator
Economic Vulnerability: Crops Grown - Types of crops grown by households
Major Crop Type
Sorghum
Type of Crops Grown
Last Year
12.71
Type of Crops Grown
Five Years Ago
13.29
Millet
8.55
9.25
Other grain (specify)
0.72
0.83
Beans
0.56
0.91
Peas
0.08
0.08
Lentils
0.08
0.00
Other pulses
2.08
0.25
Neug
0.08
0.00
Fruits
0.00
0.08
Hops
0.08
0.08
Chat
0.56
0.41
Other cash crop
16.39
15.69
Types of Crops Grown - Percent Responses of HHs for Last Year as compared to
Five Years Ago
18
16
16
16
14
13
13
12
10
9
9
8
6
4
2
0
0
0
Fruits
1
1
Beans
1
0
Chat
0
0
Hops
0
0
Lentils
Millet
0
0
Neug
2
1
1
00
0
Other cash Other grain Other pulses
crop
(specify)
Peas
Sorghum
LEGEND :
Last year
Five Years Ago
166
Page 1 of 1
Wereda Disaster
Risk Profile
Disaster Risk Management
and Food Security Sector (DRMFSS)
Data_Collected_Date
Region S.N.N.P
December 2011
Zone
ALABA SPECIAL
Wednesday, September 3, 2014
Wereda ALABA SPECIAL
Selected Indictor:
Economic Vulnerability: Crops Grown - Proportion of households by amount of
yield of major crops (last year)
Fruits
Barley
Beans
Chat
Hops
Lentils
Maize
Millet
Neug
Other cash crop
Other grain (specify)
Other pulses
Peas
Sorghum
Teff
Wheat
80.00
20.00
100.00
42.86
42.86
14.29
100.00
100.00
2.51
22.07
47.21
12.29
6.70
9.22
31.13
65.09
2.83
0.94
100.00
62.07
36.95
0.99
66.67
33.33
3.85
69.23
26.92
100.00
33.76
56.69
8.28
0.64
0.64
25.65
60.87
10.87
1.30
0.87
0.43
9.16
64.12
19.85
5.34
1.53
167
Page 1 of 1
Wereda Disaster
Risk Profile
Data_Collected_Date
December 2011
Region S.N.N.P
Zone
Disaster Risk Management
and Food Security Sector (DRMFSS)
ALABA SPECIAL
Wednesday, September 3, 2014
Wereda ALABA SPECIAL
Selected Indictor:
Economic Vulnerability: Crops Grown - Proportion of households by amount of
yield of major crops (Five Years Ago)
Types of Major Crops
Category of Yield used to be obtained five years ago
Fruits
Barley
Beans
Chat
Hops
Lentils
Maize
Millet
Neug
Other cash crop
Other grain (specify)
Other pulses
Peas
Sorghum
Teff
63.64
25.00
100.00
100.00
36.36
50.00
100.00
25.00
3.36
41.46
40.90
7.00
4.20
3.08
51.35
46.85
0.90
0.90
74.33
24.60
1.07
12.50
87.50
33.33
33.33
33.33
100.00
40.63
55.00
3.75
30.00
61.43
7.14
0.48
168
0.63
0.95
Page 1 of 2
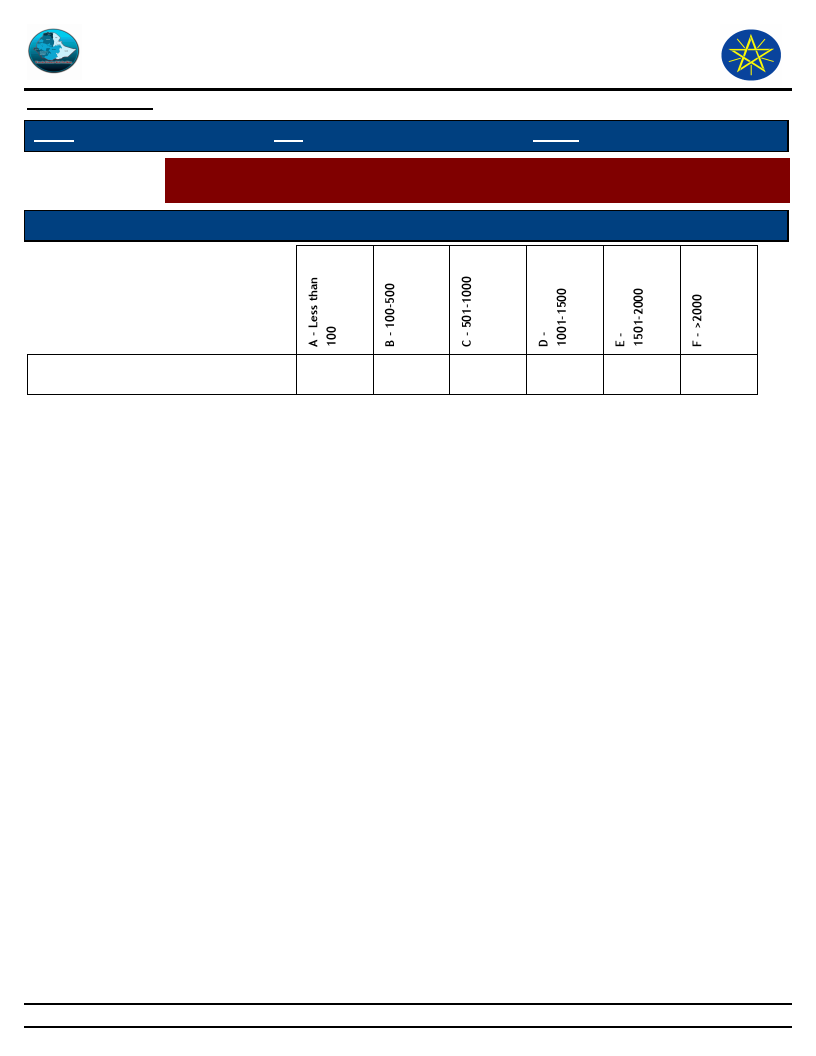
Wereda Disaster
Risk Profile
Data_Collected_Date
December 2011
Region S.N.N.P
Zone
Disaster Risk Management
and Food Security Sector (DRMFSS)
ALABA SPECIAL
Wednesday, September 3, 2014
Wereda ALABA SPECIAL
Selected Indictor:
Economic Vulnerability: Crops Grown - Proportion of households by amount of
yield of major crops (Five Years Ago)
Types of Major Crops
Category of Yield used to be obtained five years ago
Wheat
12.14
70.00
16.43
0.71
0.71
169
Page 2 of 2
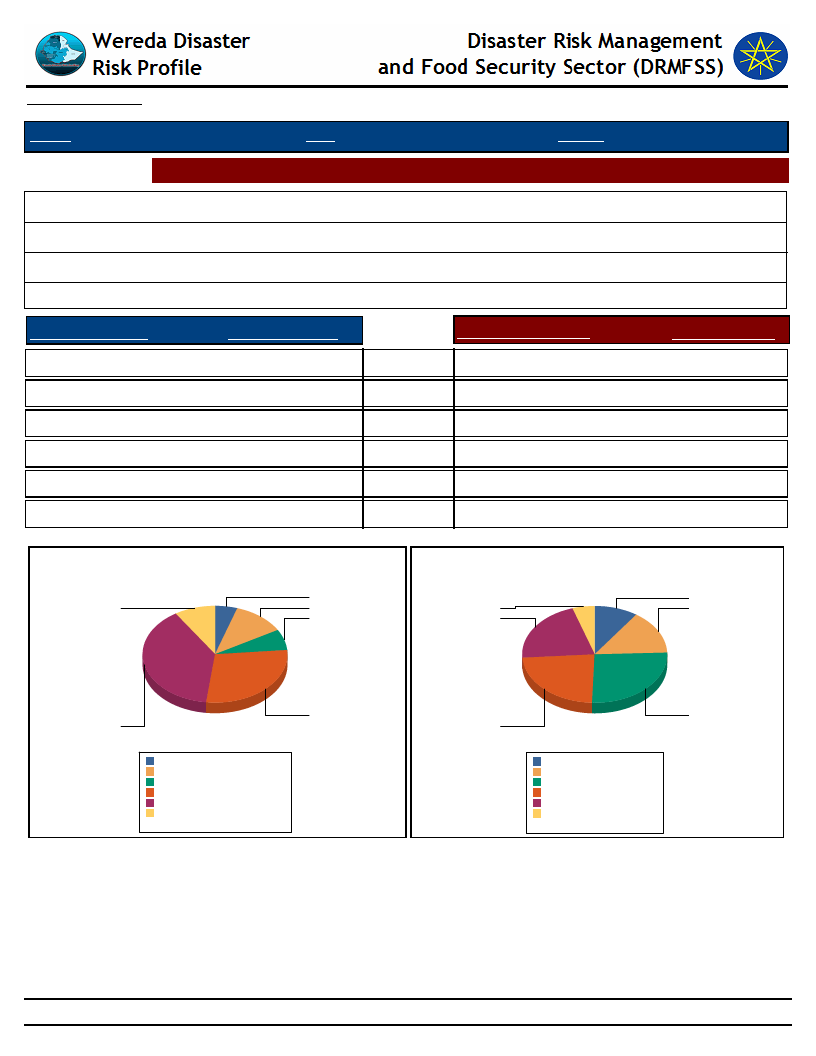
Data_Collected_Date
December 2011
Wednesday, September 3, 2014
Region S.N.N.P
Zone ALABA SPECIAL
Wereda ALABA SPECIAL
Selected Indictor: Economic Vulnerability: Land Ownership and Quality - Landownership of households
Households owning land (%)
Average landholding (in Hectares)s
Households cultivating land in last 12 months (%)
Average quantity of land cultivated (in hectares)
100.00
1.29
99.71
0.98
Range Land Holding
Percent_Response
A - Less than 0.25 ha
5.0
B - 0.25 - 0.50 ha
12.0
C - 0.5 - 0.75 ha
7.0
D - 0.75 - 1 ha
28.0
E - 1 - 2 ha
39.0
F - More than 2 ha
9.0
IMPORTANT: ha = Hectar
Household Responses to Range Land Holding
4.9
9.0
11.8
6.8
Range Cultivated Land
A - Less than 0.25 ha
B - 0.25 - 0.50 ha
C - 0.5 - 0.75 ha
D - 0.75 - 1 ha
E - 1 - 2 ha
F - More than 2 ha
Percent_Respons
10.0
15.0
26.0
23.0
21.0
5.0
Household Responses to Range Cultivated Land
9.8
4.9
14.7
21.2
38.9
28.5
A - Less than 0.25 ha
B - 0.25 - 0.50 ha
C - 0.5 - 0.75 ha
D - 0.75 - 1 ha
E - 1 - 2 ha
F - More than 2 ha
4.9%
11.8%
6.9%
28.5%
38.9%
9.0%
Total:
100.0%
23.3
26.1
A - Less than 0.25 ha 9.8
B - 0.25 - 0.50 ha 14.7
C - 0.5 - 0.75 ha
26.1
D - 0.75 - 1 ha
23.3
E - 1 - 2 ha
21.2
F - More than 2 ha 4.9
Total:
100
170
Page 1 of 1
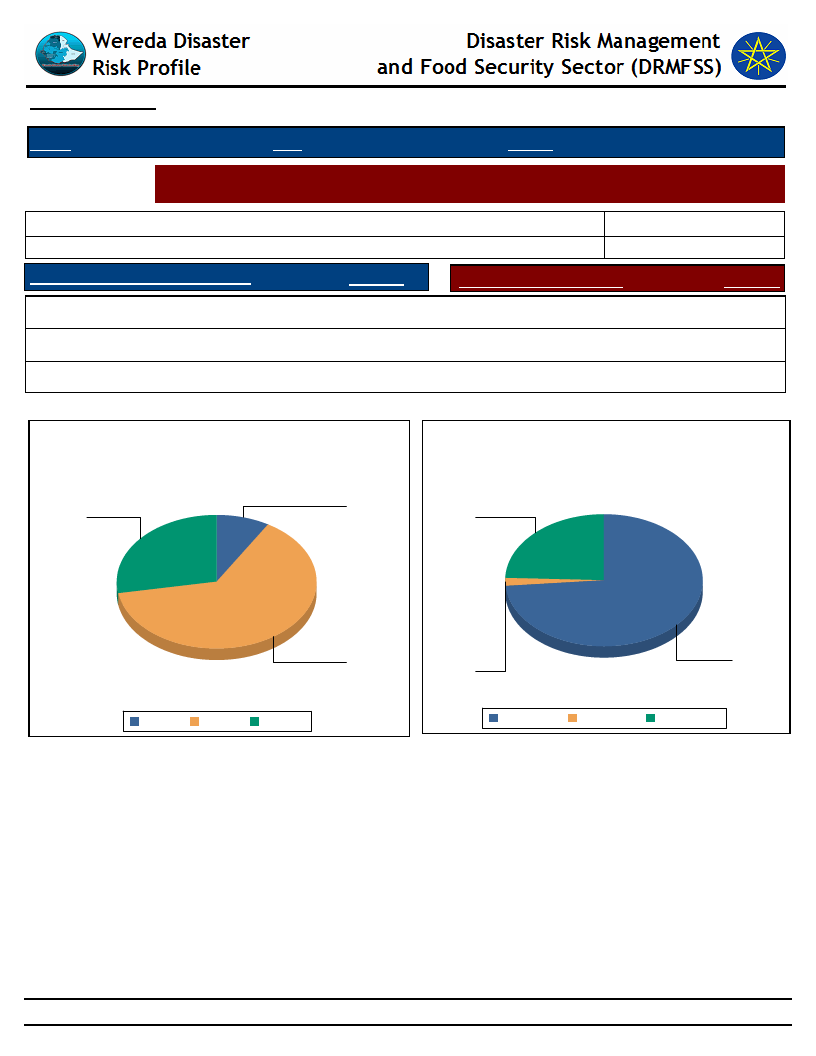
Data_Collected_Date
December 2011
Wednesday, September 3, 2014
Region S.N.N.P
Zone ALABA SPECIAL
Wereda ALABA SPECIAL
Selected Indictor:
Economic Vulnerability: Land Ownership and Quality - Farmers’ perception on the
quality of their agricultural land
Cropping_Intensity *
Households with enough land for farming
HHs with favourable location of farm
Response
Households with fertile soil
Yes
27.75
Highly fertile
204.90
24.11
Response
1.92
Partially
63.74
Fertile
73.63
No
8.52
Not fertile
24.45
* Cropping Intensity = (Gross Cropped Area / total land owned Area )x 100%
Household responses to the type of farm
location
Household responses tp the type of soil
fertility
9
28
24
64
No
Partially Yes
2
Fertile
74
Highly fertile Not fertile
171
Page 1 of 1

Wereda Disaster
Risk Profile
Data_Collected_Date
December 2011
Region S.N.N.P
Zone ALABA SPECIAL
Disaster Risk Management and Food
Security Sector (DRMFSS)
Wednesday, September 3, 2014
Wereda ALABA SPECIAL
Selected Indicator
Kebele Name
Environmental Situation: Land-Use other than crop production - Types of land use other than crop production
across Kebeles
Landuse_1
Comments_1
Landuse_2
Comments_2
Landuse_3
Comments_3
METO DUBALE
Farm Land
77%
Grazing Land
6%
Residential Area
13%
HABIBO FURANA
Farm Land
78%
Grazing Land
3%
Residential Area
20%
SINBITA
Farm Land
60%
Grazing Land
13%
Residential Area
15%
CHEMBULA
WEJEGO YATO
Farm Land or Crop
74%
Production
Farm Land
73%
Grazing Land
4%
Grazing Land
4%
Residential Area
15%
Residential Area
15%
ANDEGNA TEFO
Annual Crop Production
75%
Grazing Land
8%
Village
15%
SORGE DARGOSA
Farm Land
70%
Grazing Land
5%
Residential Area
15%
BUKET BAME
Farm Land
80%
Grazing Land
6%
Residential Area
12%
HOLUGEB KUKE
Farm land
74%
Grazing Land
8%
Residential Area
15%
WETETA
Farm Land
65%
Grazing Land
87%
Residential Area
16%
ANDEGNA KONCHA
Farm Land
75%
Grazing Land
5%
Residential Area
15%
KULFO
Farm Land
70%
Grazing Land
5%
Residential Area
15%
LAYEGNAWO LENDA
Forest Land
TACHEGNAWO BEDANE
Crop Land
1st
Settlement area
2nd
Others
3rd
HULETEGNA MEKALA
Crop Land
1st
Settlement area
2nd
172
Others
3rd
Page 1 of 2
Wereda Disaster
Risk Profile
Data_Collected_Date
December 2011
Region S.N.N.P
Zone ALABA SPECIAL
Disaster Risk Management and Food
Security Sector (DRMFSS)
Wednesday, September 3, 2014
Wereda ALABA SPECIAL
Selected Indicator
Kebele Name
Environmental Situation: Land-Use other than crop production - Types of land use other than crop production
across Kebeles
Landuse_1
Comments_1
Landuse_2
Comments_2
Landuse_3
Comments_3
HULETEGNA TUKA
Crop Land
1st
Forest Land
2nd
Settlement area
3rd
NEGELE WEDESH
Crop Land
1st
Forest Land
2nd
Settlement area
3rd
HANTEZO
Crop Land
1st
Forest Land
3rd
Settlement area
2nd
AYMELE
Forest Land
2nd
Crop land
1st
Settlement area
3rd
ANDEGNA TUKA
Forest Land
2nd
Crop land
1st
Settlement area
3rd
ASHEKORA BOTI
Forest Land
2nd
Crop land
1st
Settlement area
3rd
YAMBI
Grazing land
Very low or poor
Crop land
Settlement area
AMATA
Crop Land
1st
Settlement area
2nd
Others
3rd
TETALI BITORA
Crop Land
1st
Forest Land
2nd
Settlement area
3rd
GERME
Crop Land
1st
Settlement area
2nd
Others
3rd
BUBESA
Forest Land
2nd
Crop land
1st
Settlement area
3rd
TEFO CHUFO
Farm Land
70%
KOBO GETO
Farm Land
70%
Grazing Land
4%
Grazing Land
3%
Village or
15%
Residential Area
Residential Area
18%
MESERAK GORTANCHO
Crop Production land
70%
Grazing Land
7%
Residential Area
18%
173
Page 2 of 2
WDRP Indicators
Livestock Production Characteristics
174
Wereda Disaster
Risk Profile
Disaster Risk Management
and Food Security Sector (DRMFSS)
Data_Collected_Date
December 2011
Wednesday, September 3, 2014
Region S.N.N.P
Zone ALABA SPECIAL
Wereda ALABA SPECIAL
Selected Indictor:
Kebele Name
Agricultural Situation: Status of Livestock Disease - Change in Livestock Disease
Status
Current_Level
Change_Over_Last_Decade
Comment
MESERAK
GORTANCHO
KOBO GETO
Moderate
Moderate
Decreasing
Decreasing
TEFO CHUFO
Moderate
Miner or Low Reduction
METO DUBALE
Moderate
Decreasing
HABIBO FURANA
Moderate
Decreasing
Health Worker Appointed
SINBITA
Moderately sever
Decreasing
CHEMBULA
Moderate
Moderate
Nearest to Kulito Clinic
WEJEGO YATO
Moderate
Decreasing
ANDEGNA TEFO
Moderate
Decreasing
SORGE DARGOSA
BUKET BAME
HOLUGEB KUKE
Existence of animal
Disease
Moderate Problem
Moderate
Decreasing
Decreasing
Decreasing
Animal Health Worker
Appointed
Relative Improvement in
treatment
Progressive
WETETA
ANDEGNA KONCHA
Relative reduction out
of break
Moderate Problem
Decreasing
Decreasing
KULFO
Moderate
Decreasing
Health Worker Appointed
LAYEGNAWO
LENDA
TACHEGNAWO
BEDANE
HULETEGNA
MEKALA
HULETEGNA TUKA
Medium
Existence of Anthrax
and Blackleg
Still Exists
Decreasing
Increasing but slightly
Slightly Decreasing
Slightly Decreasing
Improvement vaccine
Off course Improvement
have been seen in vaccine
Improvement in vaccine
Improvement in Vaccine
NEGELE WEDESH
Still Exists
Slightly Decreasing
Improvement in Vaccine
175
Page 1 of 2

Wereda Disaster
Risk Profile
Disaster Risk Management
and Food Security Sector (DRMFSS)
Data_Collected_Date
December 2011
Wednesday, September 3, 2014
Region S.N.N.P
Zone ALABA SPECIAL
Wereda ALABA SPECIAL
Selected Indictor:
Kebele Name
Agricultural Situation: Status of Livestock Disease - Change in Livestock Disease
Status
Current_Level
Change_Over_Last_Decade
Comment
HANTEZO
Medium
Decreasing
Improvement in vaccine
AYMELE
Medium
Decreasing
Improvement in vaccine
ANDEGNA TUKA
Medium
Decreasing
Improvement vaccine
MEJA
Still Exists
Decreasing
Improvement in vaccine
ASHEKORA BOTI
Still Exists
Exists Decreasingly
Improvement in vaccine
YAMBI
Still Exists
Increasing
Improvement in vaccine
AMATA
Decreasing
Decreasing
Improvement in vaccine
TETALI BITORA
Still Exists
Slightly Decreasing
Improvement in vaccine
GERME
Still Exists
Slightly Decreasing
Improvement in vaccine
BUBESA
Medium
Decreasing
Improvement in vaccine
176
Page 2 of 2
Wereda Disaster
Risk Profile
Data_Collected_Date
December 2011
Disaster Risk Management
and Food Security Sector (DRMFSS)
Wednesday, September 3, 2014
Region S.N.N.P
Zone ALABA SPECIAL
Wereda ALABA SPECIAL
Selected Indictor: Livestock Diseases Prevalece
Type of livestock diseases affected households in the last five years (households reporting in %)
African horse disease
1st
2nd
3rd
0.27
Anthrax
57.81
26.37
10.48
Black leg
14.25
48.08
23.51
Contagious Caprine Pleuropneumonia (CCPP)
0.27
1.42
Faculiasis
16.16
9.62
28.33
Foot and Mouth Disease (FMD)
10.14
11.81
26.91
Heartwater
0.27
0.55
0.57
Internal and External Parasite
1.65
5.10
Liverfluke
1.10
1.10
0.85
Newcastle disease (Chicken)
1.98
Tick born diseases
0.28
Trypanosomiasis
0.27
0.27
0.57
177
Page 1 of 1
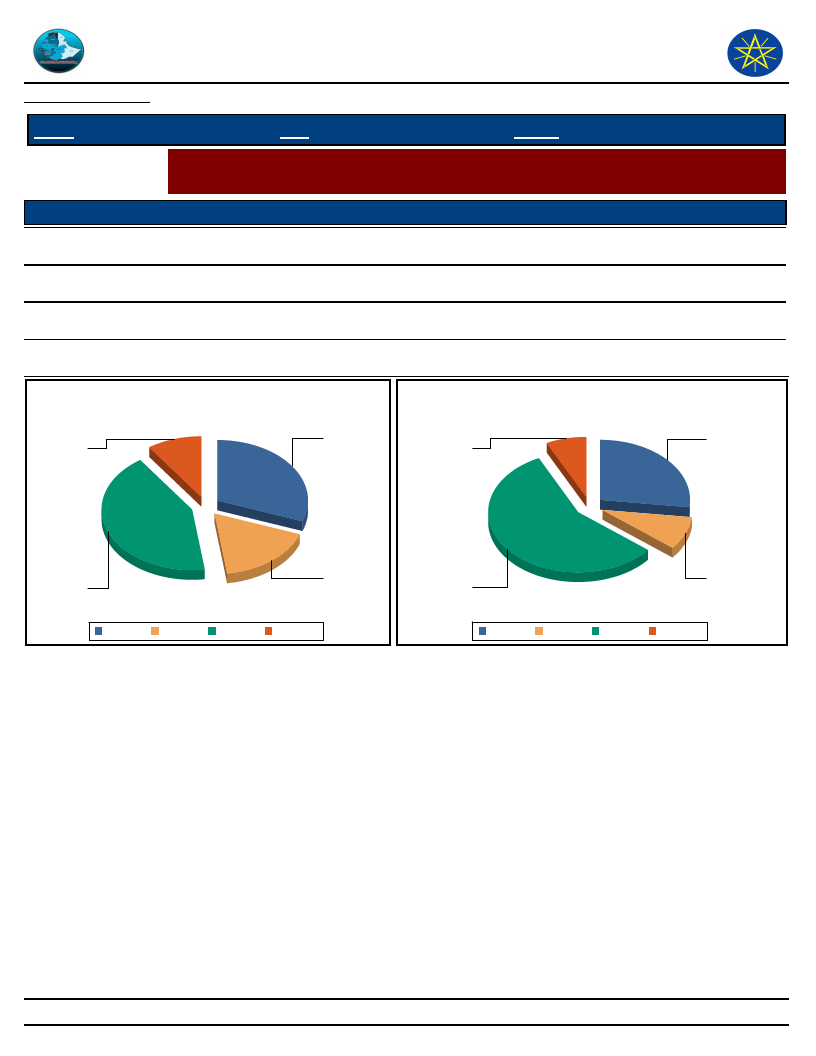
Wereda
Disaster Risk
Data_Collected_Date
December 2011
Disaster Risk Management
and Food Security Sector
Wednesday, September 3, 2014
Region S.N.N.P
Selected Indictor:
Level of Access
Good
Zone ALABA SPECIAL
Wereda ALABA SPECIAL
Evaluation of Access to Veternary Services and Livestock Drugs
Households’ evaluation on access to drugs and veterinary services
Veternary Service
16.99
Livestock_Drugs
9.04
Adequate
30.68
26.85
Poor
42.74
56.99
Very poor
9.59
7.12
Level of Access to Veternary Services
Access Level of Livestock Drugs
31
27
10
7
17
43
Adequate Good
Poor
Very poor
9
57
Adequate Good
Poor
Very poor
178
Page 1 of 1

Data_Collected_Date
December 2011
Wednesday, September 3, 2014
Region S.N.N.P
Zone ALABA SPECIAL
Wereda ALABA SPECIAL
Selected Indictor:
KebeleName
MESERAK
GORTANCHO
Agricultural Situation: Livestock Diversity - Type of livestock and their economic
importance in the community
Type of Livestock
Cattle
Avg_Num_Per_HH
2.00
Economic_Importance_Rank
45%
Poultry
5.00
15%
Goat and Sheep
3.00
30%
Eqines
1.00
10%
KOBO GETO
Cattle
4.00
50%
Goat and Sheep
5.00
20%
Poultry
5.00
10%
Eqines
1.00
20%
TEFO CHUFO
Cattle
4.00
40%
Poultry
3.00
30%
Goat and Sheep
4.00
15%
Eqines
1.00
15%
METO DUBALE
Cattle
3.00
40%
Poultry
5.00
15%
Goat and Sheep
4.00
30%
Eqines
1.00
15%
HABIBO FURANA
Cattle
3.00
50%
Poultry
4.00
20%
Goat and Sheep
3.00
30%
Eqines
1.00
10%
SINBITA
Cattle
5.00
60%
Poultry
4.00
10%
Goat and Sheep
4.00
20%
179
Page 1 of 6

Data_Collected_Date
December 2011
Wednesday, September 3, 2014
Region S.N.N.P
Zone ALABA SPECIAL
Wereda ALABA SPECIAL
Selected Indictor:
KebeleName
SINBITA
Agricultural Situation: Livestock Diversity - Type of livestock and their economic
importance in the community
Type of Livestock
Eqines
Avg_Num_Per_HH
1.00
Economic_Importance_Rank
15%
CHEMBULA
Cattle
3.00
45%
Goat and Sheep
3.00
30%
Poultry
4.00
15%
Eqines
1.00
10%
WEJEGO YATO
Cattle
4.00
15%
Goat and Sheep
5.00
30%
Poultry
5.00
10%
Eqines
1.00
10%
ANDEGNA TEFO
Cattle
4.00
45%
Goat and Sheep
3.00
25%
Poultry
4.00
15%
Eqines
1.00
15
SORGE DARGOSA
Cattle
2.00
55%
Poultry
4.00
25%
Goat and Sheep
3.00
15%
Eqines
1.00
10%
BUKET BAME
Cattle
2.00
30%
Poultry
5.00
15%
Goat and Sheep
3.00
40%
Eqines
1.00
15%
HOLUGEB KUKE
Cattle
3.00
50%
Goat and Sheep
2.00
25%
180
Page 2 of 6
Data_Collected_Date
December 2011
Wednesday, September 3, 2014
Region S.N.N.P
Zone ALABA SPECIAL
Wereda ALABA SPECIAL
Selected Indictor:
KebeleName
HOLUGEB KUKE
Agricultural Situation: Livestock Diversity - Type of livestock and their economic
importance in the community
Type of Livestock
Poultry
Avg_Num_Per_HH
3.00
Economic_Importance_Rank
15%
Eqines
1.00
10%
WETETA
Cattle
3.00
60%
Poultry
5.00
10%
Sheep
3.00
20%
Eqines
1.00
15%
ANDEGNA KONCHA
Cattle
3.00
40%
Goat and Sheep
4.00
30%
Poultry
3.00
15%
Eqines
1.00
15%
KULFO
Cattle
3.00
55%
Poultry
4.00
25%
Goat and Sheep
3.00
15%
Eqines
1.00
10%
LAYEGNAWO LENDA
Cattle
4.00
1st
Goat and Sheep
6.00
2nd
Poultry
5.00
3rd
Eqines
1.00
4th
TACHEGNAWO
BEDANE
Cattle
Poultry
2.00
1st
4.00
3rd
Goat and Sheep
2.00
2nd
Eqines
1.00
4th
HULETEGNA
MEKALA
Cattle
4.00
181
1st
Page 3 of 6

Data_Collected_Date
December 2011
Wednesday, September 3, 2014
Region S.N.N.P
Zone ALABA SPECIAL
Wereda ALABA SPECIAL
Selected Indictor:
KebeleName
HULETEGNA
MEKALA
Agricultural Situation: Livestock Diversity - Type of livestock and their economic
importance in the community
Type of Livestock
Goat and Sheep
Avg_Num_Per_HH
2.00
Economic_Importance_Rank
2nd
Poultry
3.00
3rd
Eqines
1.00
4th
HULETEGNA TUKA
Cattle
4.00
1st
Goat and Sheep
5.00
2nd
Poultry
4.00
3rd
Eqines
1.00
4th
NEGELE WEDESH
Cattle
6.00
1st
Goat and Sheep
7.00
2nd
Poultry
5.00
3rd
Eqines
1.00
4th
HANTEZO
Cattle
2.00
1st
Poultry
4.00
3rd
Goat and Sheep
3.00
2nd
Eqines
1.00
4th
AYMELE
Cattle
4.00
1st
Goat and Sheep
5.00
2nd
Poultry
5.00
3rd
Eqines
1.00
4th
ANDEGNA TUKA
Cattle
4.00
1st
Goat and Sheep
6.00
2nd
Poultry
5.00
3rd
Eqines
1.00
4th
182
Page 4 of 6

Data_Collected_Date
December 2011
Wednesday, September 3, 2014
Region S.N.N.P
Zone ALABA SPECIAL
Wereda ALABA SPECIAL
Selected Indictor:
KebeleName
MEJA
Agricultural Situation: Livestock Diversity - Type of livestock and their economic
importance in the community
Type of Livestock
Cattle
Avg_Num_Per_HH
4.00
Economic_Importance_Rank
1st
Goat and Sheep
3.00
2nd
Eqines
1.00
4th
Poultry
4.00
3rd%
ASHEKORA BOTI
Cattle
4.00
1st
Poultry
5.00
3rd
Goat and Sheep
6.00
2nd
Eqines
1.00
4th
YAMBI
Cattle
2.00
50%
Poultry
3.00
20%
Goat and Sheep
2.00
25%
Eqines
1.00
5%
AMATA
Cattle
6.00
50%
Goat and Sheep
4.00
20%
Poultry
2.00
15%
Eqines
1.00
10%
TETALI BITORA
Cattle
4.00
1st
Goat and Sheep
5.00
2nd
Eqines
1.00
4th
Poultry
4.00
3rd
GERME
Cattle
4.00
1st
Goat and Sheep
2.00
2nd
Poultry
6.00
3rd
183
Page 5 of 6
Data_Collected_Date
December 2011
Wednesday, September 3, 2014
Region S.N.N.P
Zone ALABA SPECIAL
Wereda ALABA SPECIAL
Selected Indictor:
KebeleName
GERME
Agricultural Situation: Livestock Diversity - Type of livestock and their economic
importance in the community
Type of Livestock
Eqines
Avg_Num_Per_HH
1.00
Economic_Importance_Rank
4th
BUBESA
Cattle
4.00
1st
Goat and Sheep
5.00
2nd
Poultry
5.00
3rd
Eqines
1.00
4th
184
Page 6 of 6
Wereda Disaster
Risk Profile
Data_Collected_Date
December 2011
Disaster Risk Management
and Food Security Sector (DRMFSS)
Wednesday, September 3, 2014
Region S.N.N.P
Zone ALABA SPECIAL
Wereda ALABA SPECIAL
Selected Indictor:
Economic Vulnerability: Livestock Ownership and Changes - Percentage of households by number and type of
livestock owned
A - 1 to 5
B - 6 to 10
C - 11 to 50
D - 51 to 100
None
Bee keeping
15.34
0.55
0.27
83.84
Camels: Female
0.27
99.73
Camels: Male
0.55
99.45
Camels: Young Female
0.27
99.73
Camels: Young Male
0.55
0.55
98.90
Cattle: Female
32.60
0.55
0.27
0.27
66.30
Cattle: Male bulls
15.89
0.82
0.27
83.01
Cattle: Mature Female
67.95
1.92
0.27
29.86
Cattle: Mature Male
61.98
2.20
35.81
Cattle: under 1 year
43.84
1.64
0.27
54.25
Donkeys
48.49
0.55
0.27
0.27
50.41
Goats
28.77
2.19
0.55
68.49
185
Page 1 of 2
Wereda Disaster
Risk Profile
Data_Collected_Date
December 2011
Disaster Risk Management
and Food Security Sector (DRMFSS)
Wednesday, September 3, 2014
Region S.N.N.P
Zone ALABA SPECIAL
Wereda ALABA SPECIAL
Selected Indictor:
Economic Vulnerability: Livestock Ownership and Changes - Percentage of households by number and type of
livestock owned
A - 1 to 5
B - 6 to 10
C - 11 to 50
D - 51 to 100
None
Horses
5.00
0.62
0.34
94.04
Mules
3.29
1.10
0.27
95.34
Poultry
32.60
6.56
0.55
0.55
59.74
Sheep
35.07
1.37
0.27
0.52
62.74
186
Page 2 of 2
Wereda Disaster
Risk Profile
Data_Collected_Date
December 2011
Disaster Risk Management
and Food Security Sector (DRMFSS)
Wednesday, September 3, 2014
Region S.N.N.P
Zone ALABA SPECIAL
Wereda ALABA SPECIAL
Selected Indicator
Economic Vulnerability: Livestock Ownership and Changes - Households
perception on changes in livestock number in the last five years (response in %)
Type of Livestock Owned
Changes Observed By Households
Bee keeping
Decreased
82.67
Increased
1.33
Remained the Same
16.00
Camels: Female
25.00
75.00
Camels: Male
20.00
80.00
Camels: Young Female
25.00
75.00
Camels: Young Male
42.86
57.14
Cattle: Female
88.15
5.19
6.67
Cattle: Male bulls
87.92
6.33
16.46
Cattle: Mature Female
87.50
3.79
8.71
Cattle: under 1 year
84.62
3.84
11.54
Donkeys
73.96
4.69
21.35
Goats
88.89
2.96
8.15
Horses
66.67
9.09
24.24
Mules
68.82
7.53
23.66
Poultry
80.63
8.75
10.63
Sheep
83.23
3.87
12.90
187
Page 1 of 3
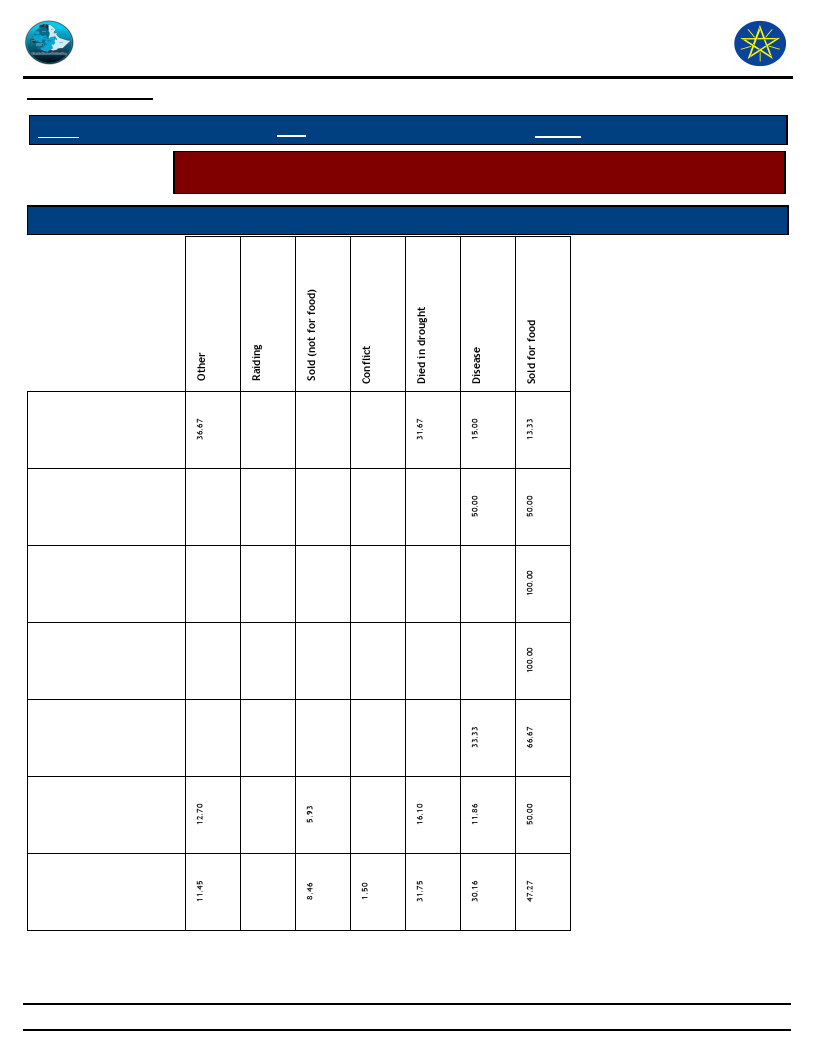
Wereda Disaster
Risk Profile
Data_Collected_Date
December 2011
Disaster Risk Management
and Food Security Sector (DRMFSS)
Wednesday, September 3, 2014
Region S.N.N.P
Zone ALABA SPECIAL
Wereda ALABA SPECIAL
Selected Indicator
Economic Vulnerability: Livestock Ownership and Changes - Households
perception on changes in livestock number in the last five years (response in %)
Type of Livestock Owned
Reason for Decrease in Livestock Number
Bee keeping
Camels: Female
Camels: Male
Camels: Young
Female
Camels: Young
Male
Cattle: Female
Cattle: Male bulls
188
Page 2 of 3
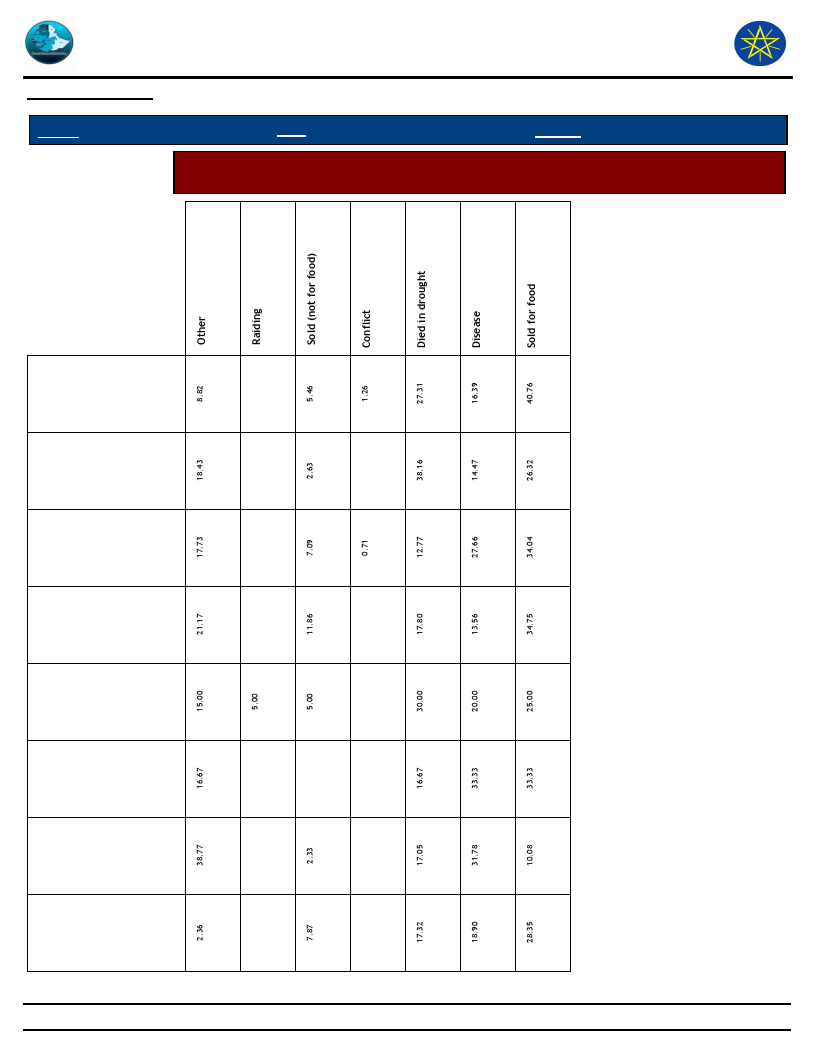
Wereda Disaster
Risk Profile
Data_Collected_Date
December 2011
Disaster Risk Management
and Food Security Sector (DRMFSS)
Wednesday, September 3, 2014
Region S.N.N.P
Zone ALABA SPECIAL
Wereda ALABA SPECIAL
Selected Indicator
Economic Vulnerability: Livestock Ownership and Changes - Households
perception on changes in livestock number in the last five years (response in %)
Cattle: Mature
Female
Cattle: under 1
year
Donkeys
Goats
Horses
Mules
Poultry
Sheep
189
Page 3 of 3
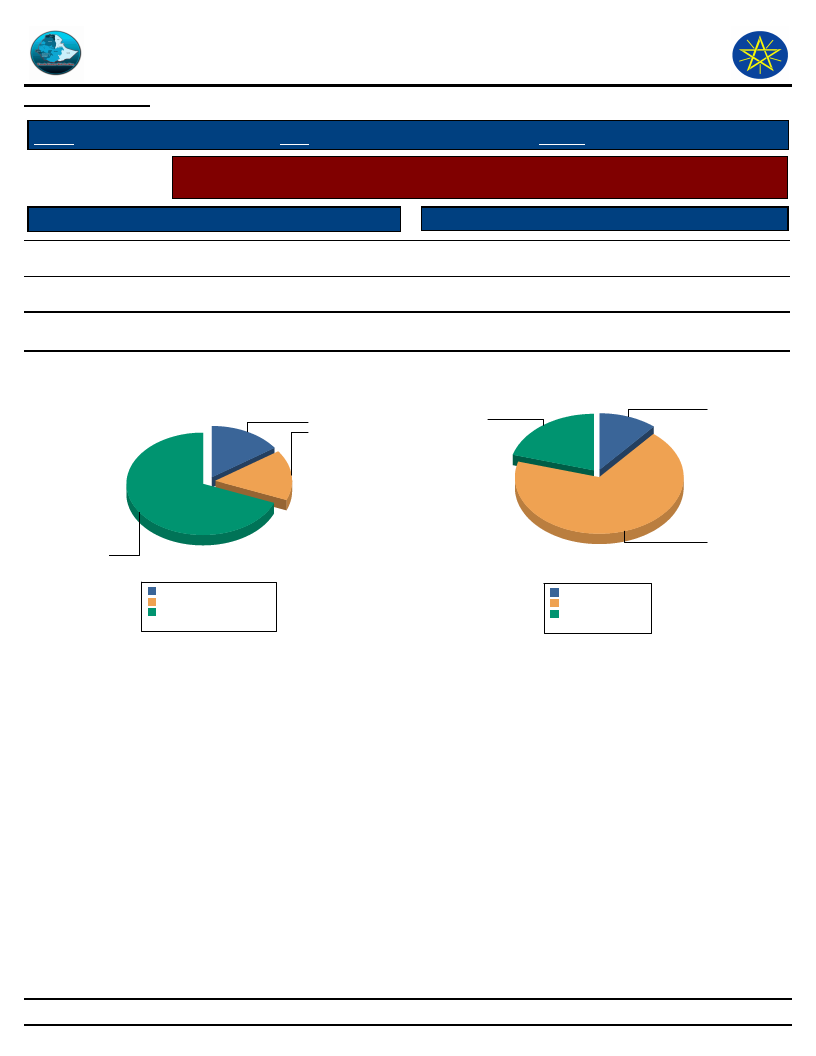
Wereda Disaster
Risk Profile
Data_Collected_Date
December 2011
Disaster Risk Management
and Food Security Sector (DRMFSS)
Wednesday, September 3, 2014
Region S.N.N.P
Selected Indicator
Access to Pasture
Zone ALABA SPECIAL
Wereda ALABA SPECIAL
Agriculture (Livestock): Pasture Availability - Households perception on access
and quality of pasture
Response Percent
Quality of Pasture
Response Percent
Occasionally
15.62
Adequate
10.61
Seldom available
67.67
Poor
65.64
Never available
15.07
Very poor
19.83
Household responses to Access to Pasture for
Livestock
15.1
15.6
Household responses to Quality of Pasture
10.6
19.8
67.7
Never available 15.3%
Occasionally
15.9%
Seldom available 68.8%
Total:
100.0%
Adequate 11.0%
Poor
68.3%
Very poor 20.6%
Total:
100.0%
65.6
190
Page 1 of 1

Data_Collected_Date
December 2011
Wednesday, September 3, 2014
Region S.N.N.P
Zone ALABA SPECIAL
Wereda ALABA SPECIAL
Selected Indicator
Agriculture (Livestock): Pasture Availability - Households perception on
problematic months for pasture availability
Problematic Months
Order of Severity
A - Sep (Meskerem)
B - Oct (Tikimt)
C - Nov (Hidar)
D - Dec (Tahsas)
E - Jan (Tir)
F - Feb (Yekatit)
G - Mar (Megabit)
H - Apr (Meazea)
I - May (Ginbot)
J - Jun (Sene)
K - Jul (Hamle)
L - Aug (Nehase)
1st
7.95
14.25
31.23
30.14
13.15
1.92
0.27
0.27
0.55
0.27
2nd
0.27
8.77
19.45
39.45
25.21
4.66
0.55
0.55
0.55
3rd
0.55
6.06
16.25
15.70
31.13
25.34
4.13
0.55
0.28
191
Page 1 of 1
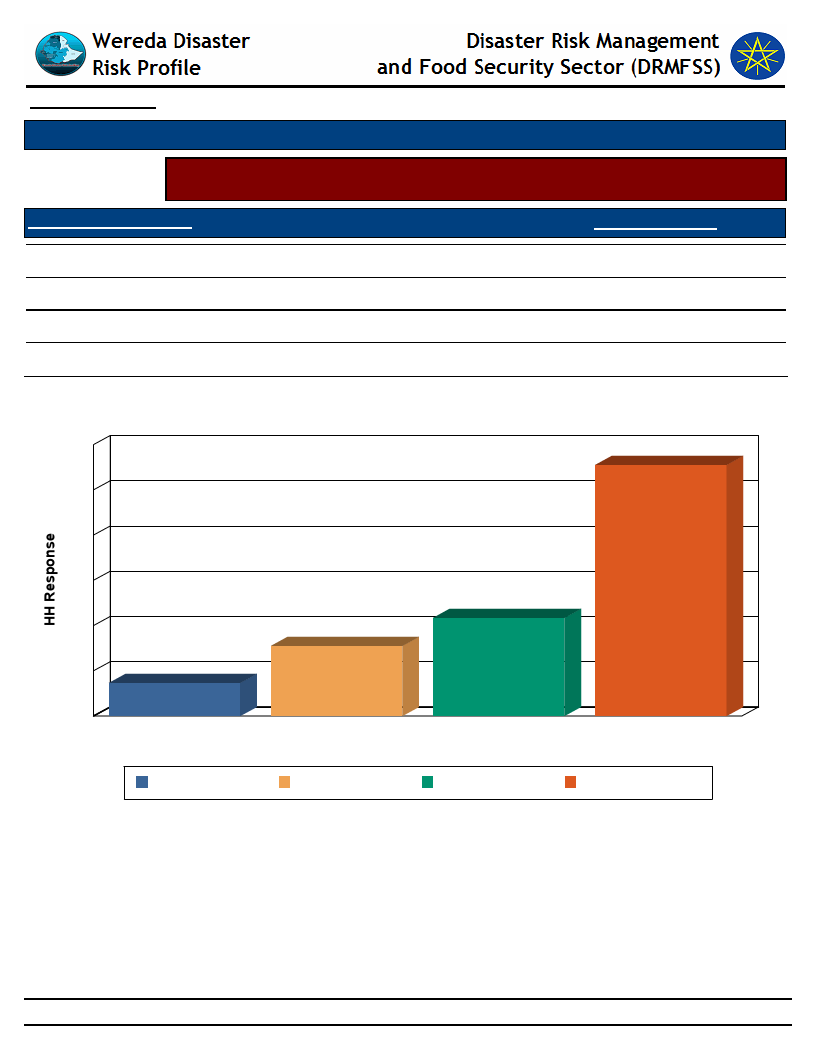
Data_Collected_Date
December 2011
Thursday, September 4, 2014
Selected Indicator
Agriculture (Livestock): Water Availability - Households response on water
availability for livestock
Access to Water - Livestock
Household Response
Regularly available
Occasionally
Seldom available
Never available
21.70
15.50
55.50
7.30
Household Access to Water for Livestock
60
56
50
40
30
20
10
7
22
16
0
Never available
Never available
Occasionally
Regularly available
Access to Water - Livestock
Occasionally
Regularly available
Seldom available
Seldom available
192
Page 1 of 1
Data_Collected_Date
December 2011
Wednesday, September 3, 2014
Region S.N.N.P
Zone ALABA SPECIAL
Wereda ALABA SPECIAL
Selected Indicator
Agriculture (Livestock): Water Availability - Households perception on
problematic months for water availability for Livestock
Problematic Months
Order of Severity
A - Sep (Meskerem)
B - Oct (Tikimt)
C - Nov (Hidar)
D - Dec (Tahsas)
E - Jan (Tir)
F - Feb (Yekatit)
G - Mar (Megabit)
H - Apr (Meazea)
I - May (Ginbot)
J - Jun (Sene)
K - Jul (Hamle)
L - Aug (Nehase)
1st
34.17
13.48
5.96
5.64
0.94
0.31
2.82
36.68
2nd
40.13
39.50
13.79
1.88
0.31
0.31
0.31
0.31
3.45
3rd
9.12
42.45
36.16
7.55
0.94
0.31
0.31
3.14
193
Page 1 of 1
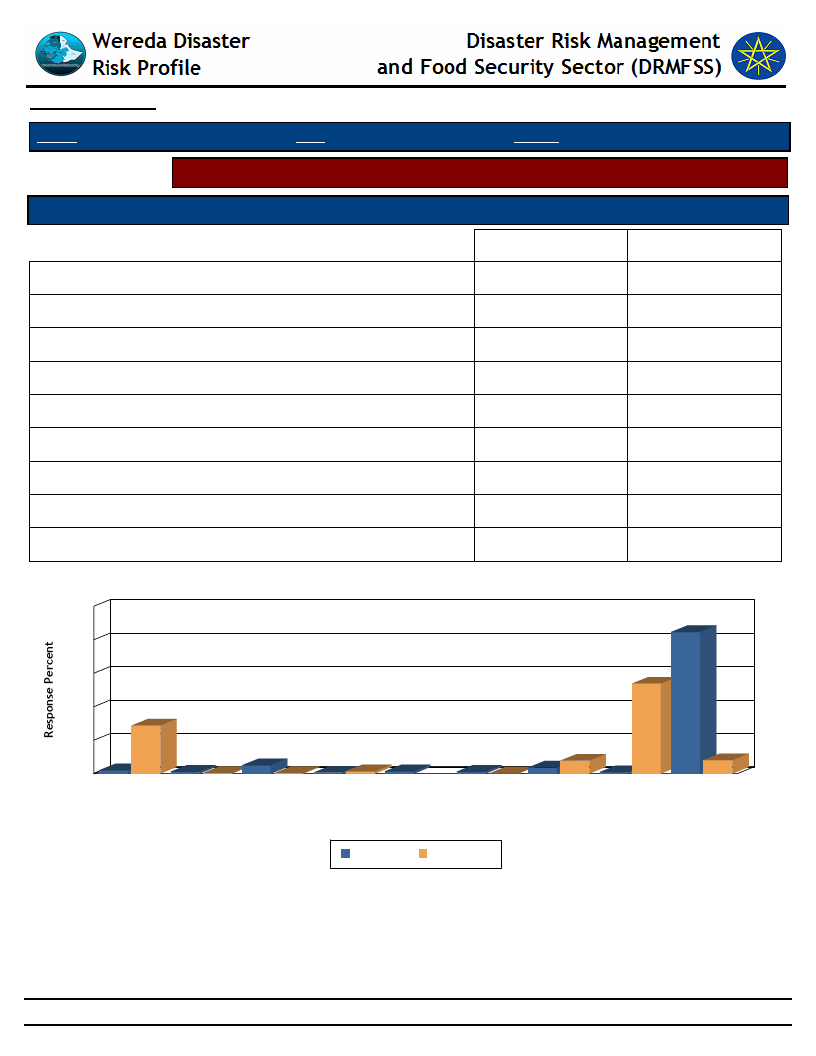
Data_Collected_Date
December 2011
Wednesday, September 3, 2014
Region S.N.N.P
Zone ALABA SPECIAL
Wereda ALABA SPECIAL
Selected Indicator
Sources of water for livestock (households response in %)
Type of Livestock Owned
Pond or lake (open access)
Birka
Communal tap (Bono)
Open/Deep well
Other
Piped water into dwelling or plot
Pond or lake (fenced)
Rainwater harvesting
River, stream
Changes Observed By Households
Dry Season
1.93
1.10
4.96
0.55
1.38
1.10
3.58
0.83
84.57
Wet Season
28.65
0.28
0.28
1.38
7.71
53.72
7.99
Household Responses to Type of Water Source and Season for Livestock
100
85
80
60
54
40
29
20
2
0
Pond or lake
(open access)
1
0
Birka
5
0
Communal tap
(Bono)
1
1
1
1
0
Open/Deep
well
Other
Piped water
into dwelling
or plot
Type of Water Source & Season
8
4
Pond or lake
(fenced)
Dry Season
Wet Season
1
Rainwater
harvesting
8
River, stream
194
Page 1 of 1
WDRP Indicators
Access to Market and Credit
195
Wereda Disaster
Risk Profile
Disaster Risk Management
and Food Security Sector (DRMFSS)
Data_Collected_Date December 2011
Wednesday, September 3, 2014
Region S.N.N.P
Zone ALABA SPECIAL
Wereda ALABA SPECIAL
Selected Indictor:
KebeleName
MESERAK
GORTANCHO
KOBO GETO
TEFO CHUFO
Economic Vulnerability: Proportion of Produce Sold and Market - Proportion of crops and livestock sold from total
production and markets
Market_For_Crops
Market_For_Livestock_Produce
Percent
Livestock_Sold
Total_% Comments
Sold
Kulito
Kulito
20%
Kobo, Guba and
Kobo, Guba and Besheno
20%
Besheno
25%
METO DUBALE
Mito
Mito
20%
HABIBO FURANA
Kulito
Kulito
20%
SINBITA
Besheno and Alem
Besheno and Alem Gebeya
20%
Gebeya
CHEMBULA
Kulito
Kulito
20%
WEJEGO YATO
Mito
Mito
20%
ANDEGNA TEFO
Guba and Kulito
Guba and Kulito
10%
SORGE DARGOSA
Kulito and Mazoria
Bonosha and Kulito
20%
BUKET BAME
Mito Market
Mito Market
20%
HOLUGEB KUKE
Kulito
Kulito
20%
WETETA
Besheno
Besheno
25%
196
Page 1 of 4

Wereda Disaster
Risk Profile
Disaster Risk Management
and Food Security Sector (DRMFSS)
Data_Collected_Date December 2011
Wednesday, September 3, 2014
Region S.N.N.P
Zone ALABA SPECIAL
Wereda ALABA SPECIAL
Selected Indictor:
KebeleName
ANDEGNA KONCHA
Economic Vulnerability: Proportion of Produce Sold and Market - Proportion of crops and livestock sold from total
production and markets
Market_For_Crops
Market_For_Livestock_Produce
Percent
Livestock_Sold
Total_% Comments
Sold
Kobo and Besheno
Besheno
10%
KULFO
Kulito and Mazoria
Kulito and Mazoria
25%
LAYEGNAWO LENDA
Kulito
Kulito
TACHEGNAWO
BEDANE
Kulito
Kulito
HULETEGNA
MEKALA
Kulito
Kulito
HULETEGNA TUKA
NEGELE WEDESH
Kulito, Guba and
Kobo
Miro or Alem
Gebeya
Kulito, Guba and Kobo
Miro or Alem Gebeya
Storing or Save large share of crop
produce occurs mainly when
community speculate disaster such
as drought
5%
Storing large share of crop
produce occurs mainly when
community speculate disaster such
as drought
20% Storing large share of crop
produce occurs mainly when
community speculate disaster such
as drought
15% Storing or Save large share of crop
produce mainly when community
speculate disaster such as drought
15% Storing or Save large share of crop
produce occurs mainly when
community speculate disaster such
as drought
197
Page 2 of 4
Wereda Disaster
Risk Profile
Disaster Risk Management
and Food Security Sector (DRMFSS)
Data_Collected_Date December 2011
Wednesday, September 3, 2014
Region S.N.N.P
Zone ALABA SPECIAL
Wereda ALABA SPECIAL
Selected Indictor:
KebeleName
HANTEZO
AYMELE
ANDEGNA TUKA
MEJA
ASHEKORA BOTI
YAMBI
Economic Vulnerability: Proportion of Produce Sold and Market - Proportion of crops and livestock sold from total
production and markets
Market_For_Crops
Market_For_Livestock_Produce
Percent
Livestock_Sold
Total_% Comments
Sold
Besheno and Kulito
Besheno
20% Storing of Crop residue occurs
mainly when community speculate
disaster such as drought
Kulito
Kulito
15% Storing large share of crop
produce occurs mainly when
community speculate disaster such
as drought
Kulito
Kulito
15% Storing or Save large share of crop
produce occurs mainly when
community speculate disaster such
as drought
Kulito
Kulito
15% Storing large share of crop
produce occurs mainly when
community speculate disaster such
as drought
Mito or Alem
Gebeya
Mito or Alem Gebeya
15% Storing or Keep large share of crop
produce occurs mainly when
community speculate disaster such
as drought
Kulito
Kulito
20%
198
Page 3 of 4

Wereda Disaster
Risk Profile
Disaster Risk Management
and Food Security Sector (DRMFSS)
Data_Collected_Date December 2011
Wednesday, September 3, 2014
Region S.N.N.P
Zone ALABA SPECIAL
Wereda ALABA SPECIAL
Selected Indictor:
KebeleName
AMATA
TETALI BITORA
GERME
BUBESA
Economic Vulnerability: Proportion of Produce Sold and Market - Proportion of crops and livestock sold from total
production and markets
Market_For_Crops
Kulito
Market_For_Livestock_Produce
Kulito
Percent
Livestock_Sold
Total_%
Sold
80%
Comments
Storing large share of crop
produce occurs mainly when
community speculate disaster such
as drought
Mito or Alem
Gebeya
Mito or Alem Gebeya
15% Storing or Save large share of crop
produce occurs mainly when
community speculate disaster such
as drought
Kulito
Kulito
75% Storing or Keep large share of crop
produce occurs mainly when
community speculate disaster such
as drought
Kulito
Kulito
15% Storing or Save large of crop
produce occurs mainly when
community speculate disaster such
as drought
199
Page 4 of 4
Data_Collected_Date
December 2011
Wednesday, September 3, 2014
Region S.N.N.P
Zone ALABA SPECIAL
Wereda ALABA SPECIAL
Selected Indicator
Economic Vulnerability: Kebele Access to Markets - Access to market by Kebele
Kebele Name
AMATA
ANDEGNA KONCHA
ANDEGNA TEFO
ANDEGNA TUKA
ASHEKORA BOTI
AYMELE
BUBESA
BUKET BAME
CHEMBULA
GERME
HABIBO FURANA
HANTEZO
HOLUGEB KUKE
HULETEGNA MEKALA
HULETEGNA TUKA
KOBO GETO
KULFO
LAYEGNAWO LENDA
MEJA
MESERAK GORTANCHO
METO DUBALE
NEGELE WEDESH
SINBITA
SORGE DARGOSA
TACHEGNAWO BEDANE
Market_Access_Comments
Good Access
Less access to Market
Loss access to Market Due to Poor Road
Medium access to Market
Low access to Market
Medium access to Market
Low access to Market
Better access
Good Access
Low access to Market
Low Access
Low access to Market
Better access
Good Access
Medium Access
Low Access
Low Access
Medium access to Market
Good Access
Good Access
Better access
Low access to Market
Poor Access
Less Market access due to road problem, the Kebele is Full of large Gullies
Medium
200
Page 1 of 2
Data_Collected_Date
December 2011
Wednesday, September 3, 2014
Region S.N.N.P
Zone ALABA SPECIAL
Wereda ALABA SPECIAL
Selected Indicator
Economic Vulnerability: Kebele Access to Markets - Access to market by Kebele
Kebele Name
TEFO CHUFO
TETALI BITORA
WEJEGO YATO
WETETA
YAMBI
Market_Access_Comments
Poor Access
Low access to Market
Moderate Access
Poor Access
Relatively Good access
201
Page 2 of 2
Data_Collected_Date
December 2011
Thursday, September 4, 2014
Region S.N.N.P
Zone ALABA SPECIAL
Wereda ALABA SPECIAL
Selected Indicator
Economic Vulnerability: Formal & Informal Transfers - Percentage of households
reporting received formal transfers
Type of Formal Transfer
Food aid
HH Response Type of Informal Transfer
Formal
6.08 Free use of pack animals (camels or donkeys)
HH Response
47.53
Food-for-Work project
4.16 Grain loan (no interest)
9.39
Cash-for-Work project
34.07 Free use of oxen or plough
59.18
Faffa
5.51 Cash loan (no interest)
13.81
Free cash
1.93 Seed loan
9.39
Seeds
6.63 Free labour
52.34
Livestock
0.83 Seed gift
7.46
----
Gift of livestock to newly-weds
0.83
Blood money – compensation
0.83
Distribution of meat to neighbours after a slaughter
0.28
takes place
Donations of cash or animals to disaster stricken
0.28
people
Food or grain gift
3.04
Restocking of poorer relatives
2.49
Dowry given to bride’s parents
1.66
Cash or kind gift to married daughters when they visit
1.39
parents or relatives
Zakaat
0.83
Other cash gift
0.83
202
Page 1 of 2

Data_Collected_Date
December 2011
Thursday, September 4, 2014
Region S.N.N.P
Zone ALABA SPECIAL
Wereda ALABA SPECIAL
Selected Indicator
Economic Vulnerability: Formal & Informal Transfers - Percentage of households
reporting received formal transfers
Type of Formal Transfer
HH Response Type of Informal Transfer
Formal
Type of Formal Transfer Received By Households
HH Response
6.6
0.8
1.9
4.2
----
0.0%
Cash-for-Work project 57.5%
Faffa
9.3%
Food aid
10.3%
Food-for-Work project 7.0%
Free cash
3.3%
Livestock
1.4%
Seeds
11.2%
Total:
100.0%
6.1
34.1
5.5
203
Page 2 of 2

Data_Collected_Date
December 2011
Thursday, September 4, 2014
Region S.N.N.P
Zone ALABA SPECIAL
Wereda ALABA SPECIAL
Selected Indicator
Economic Vulnerability: Formal & Informal Transfers - Percentage of households
reporting received formal transfers
Type of Formal Transfer
Food aid
HH Response Type of Informal Transfer
Formal
6.08 Free use of pack animals (camels or donkeys)
HH Response
47.53
Food-for-Work project
4.16 Grain loan (no interest)
9.39
Cash-for-Work project
34.07 Free use of oxen or plough
59.18
Faffa
5.51 Cash loan (no interest)
13.81
Free cash
1.93 Seed loan
9.39
Seeds
6.63 Free labour
52.34
Livestock
0.83 Seed gift
7.46
----
Gift of livestock to newly-weds
0.83
Blood money – compensation
0.83
Distribution of meat to neighbours after a slaughter
0.28
takes place
Donations of cash or animals to disaster stricken
0.28
people
Food or grain gift
3.04
Restocking of poorer relatives
2.49
Dowry given to bride’s parents
1.66
Cash or kind gift to married daughters when they visit
1.39
parents or relatives
Zakaat
0.83
Other cash gift
0.83
204
Page 1 of 2
Data_Collected_Date
December 2011
Thursday, September 4, 2014
Region S.N.N.P
Zone ALABA SPECIAL
Wereda ALABA SPECIAL
Selected Indicator
Economic Vulnerability: Formal & Informal Transfers - Percentage of households
reporting received formal transfers
Type of Formal Transfer
HH Response Type of Informal Transfer
Formal
Type of Formal Transfer Received By Households
HH Response
6.6
0.8
1.9
4.2
----
0.0%
Cash-for-Work project 57.5%
Faffa
9.3%
Food aid
10.3%
Food-for-Work project 7.0%
Free cash
3.3%
Livestock
1.4%
Seeds
11.2%
Total:
100.0%
6.1
34.1
5.5
205
Page 2 of 2
Data_Collected_Date
December 2011
Wednesday, September 3, 2014
Region S.N.N.P
Selected Indicator
Zone ALABA SPECIAL
Wereda ALABA SPECIAL
Capacity: Access to Credit Facilities - Households access to credit facilities
Type of Access To Credit Facilities
Households with membership in any credit /micro finance society (%)
Households who borrowed any money in the last one year (%)
Households who tried to borrow 1-2
Households who tried to borrow 3-4
Households who tried to borrow 5 & Above
Households who managed to get credit 1-2
Households who managed to get credit 3-4
Households who managed to get credit 5 & Above
Indicator_Value
9.86
6.59
95.65
4.35
0.00
100.00
0.00
0.00
Average No. of HHs Tried to get Credit
Average No. HHs Managed to get Credit
2.07
1.65
Type of Access To Credit Facilities
2
2
2
2
Type of Access To Credit Facilities
1.6
1.6
1.6
1.6
2
2
2
2
Households who
borrowed any money in
the last one year (%)
Households who tried to
borrow 1-2
Households who
managed to get credit
1-2
Households who tried to
borrow 3-4
Households who
managed to get credit
3-4
Households who tried to
borrow 5 & Above
Households who
managed to get credit 5
& Above
Households with
membership in any
credit /micro finance
society (%)
1.6
1.6
1.6
1.6
Households who
borrowed any money in
the last one year (%)
Households who tried to
borrow 3-4
Households who
managed to get credit
1-2
Households who tried to
borrow 5 & Above
Households who
managed to get credit
3-4
Households with
membership in any
credit /micro finance
society (%)
Households who
managed to get credit 5
& Above
Households who tried to
borrow 1-2
206
Page 1 of 1
Data_Collected_Date
December 2011
Wednesday, September 3, 2014
Region S.N.N.P
Zone ALABA SPECIAL
Wereda ALABA SPECIAL
Selected Indicator
Capacity: Access to Credit Facilities - Percentage of households by major reasons
of borrowing money
Type of Borrowing Reason
Degree of Importance of the Borrowing Reasons - HH Respones
1st
2nd
3rd
Buy agricultural input
Buy food
Buy or rent land
Others (specify)
Pay for education
Pay for health care
Pay for social event
10.64
63.83
2.13
2.13
2.13
14.89
4.26
21.21
18.18
3.03
3.03
54.55
41.67
25.00
16.67
16.67
207
Page 1 of 1

Data_Collected_Date
December 2011
Wednesday, September 3, 2014
Region S.N.N.P
Zone ALABA SPECIAL
Wereda ALABA SPECIAL
Selected Indicator
Capacity: Access to Credit Facilities - Percentage of households by major sources
of credit
Major Sources of Credit for Households
Degree of Importance of the Credit Source
1st
2nd
3rd
Bank/ formal lending institution
Friends/relatives
Help associations (Edir)
Informal savings group (Ekub)
Local shops / moneylenders
Neighbors
Others
5.26
71.05
21.05
2.63
20.83
75.00
4.17
7.69
23.08
7.69
30.77
23.08
7.69
208
Page 1 of 1
Data_Collected_Date
December 2011
Wednesday, September 3, 2014
Region S.N.N.P
Zone ALABA SPECIAL
Wereda ALABA SPECIAL
Selected Indicator
Capacity: Access to Credit Facilities - Percent of households with ability to raise
500 birr in one week
HH Ability To Raise 500 Br in One Week
Response_Percent
Yes, we would use our savings
4.23
Yes, by borrowing money
47.89
Perhaps, but I doubt it
0.85
No, it would be impossible
46.76
N/A
0.28
Households' Ability To Raise 500 Br in One Week
4
48
0
N/A
No, it would be
impossible
Perhaps, but I doubt it
Yes, by borrowing
money
Yes, we would use our
savings
47
1
209
Page 1 of 1
WDRP Indicators
Health and Sanitation
Characteristics
210
Data_Collected_Date
December 2011
Wednesday, September 3, 2014
Region S.N.N.P
Zone ALABA SPECIAL
Wereda ALABA SPECIAL
Selected Indicator
Household Access to Health Facilities - Where do patients go for health care?
Constraints to adequate healthcare
Where do Patients Go for Healthcare
HH Response Constraints to Adequate Health Car
HH Responses
Did not get Health Care
Central Hospital
District/Municipal hospital/health
centre/ clinic
Private hospital/clinic
Pharmacy
Other private
Traditional/spiritual healer
Other
Other public
Community health worker
3.01
No money for treatment costs
4.65
No Reasons
3.83
Not aware about any health facility
2.33
----
14.09
0.41
2.05
0.14
45.96
23.53
84.21
5.26
10.53
0.00
0.00
0.00
0.00
0.00
0.00
0.00
Where Do Patients go for Health care?
5
2
24
2
14
3
4
0
0
46
Constraints to Adequate Health Care
11
5
Central Hospital
Community health worker
Did not get Health Care
District/Municipal hospital/health centre/ clinic
Other
Other private
Other public
Pharmacy
Private hospital/clinic
Traditional/spiritual healer
4.7%
23.5%
3.0%
3.8%
0.1%
0.4%
46.0%
14.1%
2.3%
2.0%
Total:
100.0%
84
----
No money for treatment costs
No Reasons
Not aware about any health facility
0.0%
84.2%
5.3%
10.5%
Total:
100.0%
211
Page 1 of 1
Data_Collected_Date
December 2011
Wednesday, September 3, 2014
Region S.N.N.P
Selected Indicator
Zone ALABA SPECIAL
Wereda ALABA SPECIAL
Hazards: Health problems and changes over the last decade
Kebele Name
Health_Problems
Changes_In_Last_Decade
MESERAK
GORTANCHO
KOBO GETO
TEFO CHUFO
METO DUBALE
HABIBO FURANA
SINBITA
CHEMBULA
WEJEGO YATO
ANDEGNA TEFO
SORGE DARGOSA
BUKET BAME
HOLUGEB KUKE
WETETA
ANDEGNA
KONCHA
KULFO
LAYEGNAWO
LENDA
TACHEGNAWO
BEDANE
HULETEGNA
MEKALA
HULETEGNA
TUKA
NEGELE WEDESH
Malaria out Break and water Borne Disease
Malaria out Break and water Borne Disease
Malaria out Break and water Borne Disease
Malaria out Break
Malaria and Water Born disease
Malaria and Water Born disease
Malaria outbreak and Water Borne disease
Water Burn Disease and Malaria Out Break
Relative Reduction in Disease out Break Occurred
Malaria Outbreak
Relative improvement Occurred
Malaria Outbreak and water born Disease
Malaria and Water Born disease
Miner or Lower Reduction
Malaria
Malaria
Malaria
Malaria
Malaria
Malaria, Why because of Malaria Resistance area
Reducing and Water Born
Disease
Decreasing and Water
Borne Disease
Reducing Aids
Decreasing
Decreasing and Water
Borne Disease
Miner or low Reduction
Decreasing
As is Low Reduction
Slowly Improving
Reducing
Relative Progress occurred
Relative reduction
Occurred
Decreasing and Increasing
Slightly Improving
Decreasing
Slightly Decreasing
Slightly Decreasing
Slightly Decreasing
Slightly Decreasing
Slightly Decreasing
212
Page 1 of 2

Data_Collected_Date
December 2011
Wednesday, September 3, 2014
Region S.N.N.P
Selected Indicator
Zone ALABA SPECIAL
Wereda ALABA SPECIAL
Hazards: Health problems and changes over the last decade
Kebele Name
Health_Problems
Changes_In_Last_Decade
HANTEZO
AYMELE
ANDEGNA TUKA
MEJA
ASHEKORA BOTI
YAMBI
AMATA
TETALI BITORA
GERME
BUBESA
Malaria
Malaria
Malaria
Malaria
Malaria
Malaria and Water Born disease
Malaria
Malaria, because of Malaria Resistance area
Malaria
Malaria
Slightly Decreasing
Slightly Decreasing
Slightly Decreasing
Slightly Decreasing
Slightly Decreasing
Miner reduction occurred
Slightly Decreasing
Slightly Decreasing
Slightly Decreasing
Slightly Decreasing
213
Page 2 of 2
Wereda Disaster
Risk Profile
Data_Collected_Date
December 2011
Region S.N.N.P
Zone ALABA SPECIAL
Disaster Risk Management and Food
Security Sector (DRMFSS)
Wednesday, September 3, 2014
Wereda ALABA SPECIAL
Selected Indicator
Household Health Status - Households health condition and major health problems
Health Condition
HH Response Population Sickness
HH Response Children Sickness
HH Response
Good health
Ill for <3 months
Ill for more than three months
----
65.0
Malaria
30.0
Headache
5.0
Chronic fever
0.0
Hyper tension
0.0
HIV/AIDS
0.0
Asthma
0.0
Eye problems
0.0
Tuberculosis
0.0
Stomach pain
0.0
Back ache
0.0
Mental illness
0.0
Meningitis
0.0
Pneumonia/ lung problem
0.0
Diarrhea
65.0 Malaria
76.0
9.0 Diarrhea
10.0
5.0 Headache
6.0
1.0 ----
0.0
0.0
0.0
0.0
0.0
3.0 Meningitis
1.0
2.0 Hyper tension
1.0
2.0 Eye problems
1.0
1.0 Back ache
1.0
1.0 Stomach pain
1.0
1.0 ----
0.0
5.0 Chronic fever
2.0
4.0 Pneumonia/ lung problem
2.0
214
Page 1 of 2
Wereda Disaster
Risk Profile
Data_Collected_Date
December 2011
Region S.N.N.P
Zone ALABA SPECIAL
Disaster Risk Management and Food
Security Sector (DRMFSS)
Wednesday, September 3, 2014
Wereda ALABA SPECIAL
Selected Indicator
Household Health Status - Households health condition and major health problems
Health Condition
HH Response Population Sickness
HH Response Children Sickness
HH Response
Health Condition of the Community
5.0
30.1
64.9
----
Good health
Ill for <3 months
Ill for more than three months
0.0%
64.9%
30.1%
5.0%
Total:
100.0%
70
60
50
40
30
20
10
5
0
1
0
a
Asthm
ache
Back
Chronic fever
Population Sickness in the Community
65
9
4
3
0
1
5
1
1
2
2
Diarrhea
s
problem
Eye
Headache
HIV/AIDS Hyper tension
alaria
M
Population Sickness
eningitis
M
ental
M
illnessPneumopnroiab/lelumng
pain
ach
Stom
Tuberculosis
Asthma
Chronic fever
Eye problems
HIV/AIDS
Malaria
Mental illness
Stomach pain
Back ache
Diarrhea
Headache
Hyper tension
Meningitis
Pneumonia/ lung
problem
Tuberculosis
80
70
60
50
40
30
20
10
0
0
----
Children Sickness in the Community
76
1
Back ache
2
Chronic
fever
10
Diarrhea
6
1
1
Eye
problems
Headache
Hyper
tension
Children Sickness
Malaria
1
2
Meningitis Pneumonia/
lung problem
1
Stomach
pain
----
Back ache
Chronic fever
Diarrhea
Eye problems
Headache
Hyper tension
Malaria
Meningitis
Pneumonia/ lung
problem
Stomach pain
215
Page 2 of 2
Data_Collected_Date
December 2011
Wednesday, September 3, 2014
Region S.N.N.P
Zone ALABA SPECIAL
Wereda ALABA SPECIAL
Selected Indicator
Household Access to Sanitation - Percentage of households with access to
different kind of toilet facilities
Type of Toilet Facility
HH Response
Modern water closet
Ventilated, build in latrine
Outdoors latrine/hole on plot
No facilities/Open Space
HH Sharing Toilet
0.27
0.82
73.42
25.48
2.59
Household Responses to the type of toilet facilities in the community
0.3
0.8
25.5
Modern water closet
No facilities/Open Space
Outdoors latrine/hole on
plot
Ventilated, build in latrine
73.4
216
Page 1 of 1
Data_Collected_Date
December 2011
Wednesday, September 3, 2014
Region S.N.N.P
Zone ALABA SPECIAL
Wereda ALABA SPECIAL
Selected Indicator
Household Access to Drinking Water - Sources of drinking water for households
(response in %)
Sources of drinking water for Households
Priority of the Water Source
Main
Secondary
Birka
Communal tap (Bono)
Open well
Other
Piped water outside the house
Pond or lake (fenced)
Pond or lake (open access)
Rainwater harvesting
River, stream
19.45
45.48
0.27
0.27
0.27
6.85
5.75
0.27
21.37
9.09
0.00
0.00
0.00
9.09
18.18
36.36
18.18
9.09
50
45
40
35
30
25
20
15
10
19
5
0
Birka
Source of Drinking Water for Households
45
Communal tap
(Bono)
0
Open well
36
18
9
0
Other
Piped water
outside the
house
Pond or lake
(fenced)
Source of Drinking Water
Pond or lake
(open access)
18
Rainwater
harvesting
21
River, stream
217
Page 1 of 1
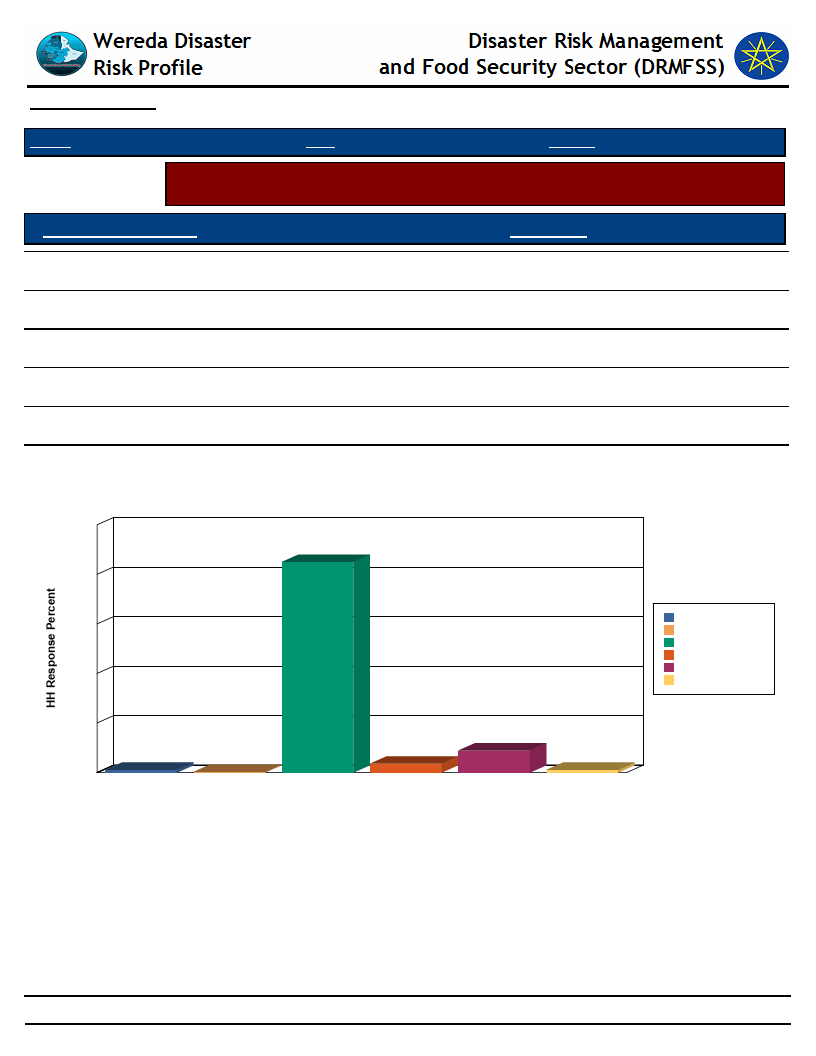
Data_Collected_Date
December 2011
Wednesday, September 3, 2014
Region S.N.N.P
Zone ALABA SPECIAL
Wereda ALABA SPECIAL
Selected Indicator
Household Access to Drinking Water - Households methods of treating drinking
water
Method of Treating Water
HH Response
Boil
1.11
Water Guard
1.11
Use filter
8.89
Other chemicals
3.61
None
85.00
DK
0.28
Method of Treating Water by Households
100
85
80
Boil
60
DK
None
Other chemicals
Use filter
40
Water Guard
20
1
0
Boil
9
4
0
1
DK
None
Other chemicals
Use filter
Water Guard
Water Treatment Method
218
Page 1 of 1
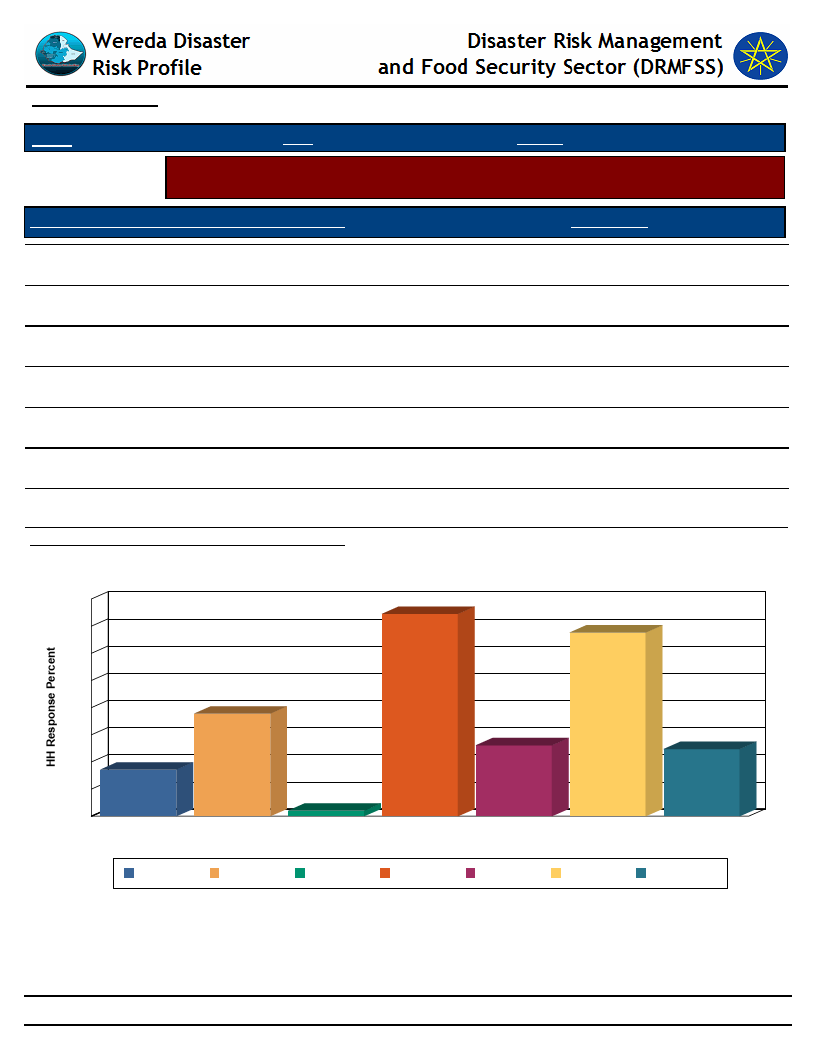
Data_Collected_Date
December 2011
Wednesday, September 3, 2014
Region S.N.N.P
Zone ALABA SPECIAL
Wereda ALABA SPECIAL
Selected Indicator
Household Access to Drinking Water - Number of times households fetch water in
a week
Number of Times Households Fetch Water in a Week
HH Response
Once
0.82
Twice
9.89
Three times
27.06
Four times
15.11
Five times
6.87
Six times
10.44
Seven times
29.80
Average Number of Times HH Fetch Water Per Week
4.66
Number of Times HH Fetch Water in a Week
32
30
28
27
24
20
16
15
12
8
7
10
10
4
0
Five times
Four times
1
Once
Seven times
Six times
Number of Times HH Fetch Water in a Week
Three times
Twice
Five times
Four times
Once
Seven times Six times
Three times
Twice
219
Page 1 of 1
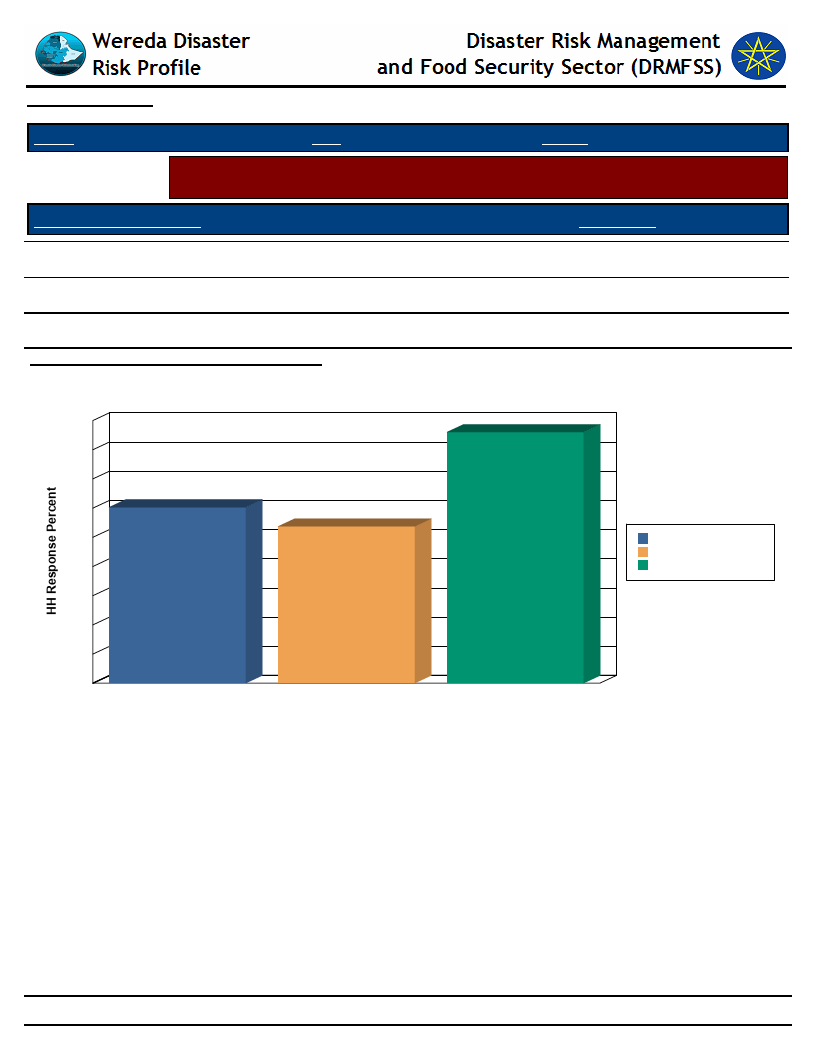
Data_Collected_Date
December 2011
Wednesday, September 3, 2014
Region S.N.N.P
Zone ALABA SPECIAL
Wereda ALABA SPECIAL
Selected Indicator
Household Access to Drinking Water - Time taken per day to fetch water for
households
Time Taken To Fetch Water
HH Response
A - Less than 30 min
30.14
B - 30 min - 1 hr
26.85
C - 1 hr and Above
Average Number of Times Taken To Fetch Water
43.01
86.55
Time Taken To Fetch Water for the HH
45
43
40
35
30
30
27
25
20
15
10
5
0
A - Less than 30 min
B - 30 min - 1 hr
Time Taken To Fetch Water
C - 1 hr and Above
A - Less than 30 min
B - 30 min - 1 hr
C - 1 hr and Above
220
Page 1 of 1
WDRP Indicators
Coping Mechanisms and
Preparedness
221
Wereda Disaster
Risk Profile
Data_Collected_Date
December 2011
Disaster Risk Management and Food
Security Sector (DRMFSS)
Wednesday, September 3, 2014
Region S.N.N.P
Selected Indicator
Zone ALABA SPECIAL
Wereda ALABA SPECIAL
Capacity: Community Preparedness against Sudden Onset Disasters
KebeleName
Precaution_1
Comment_1
Precaution_2
Comment_2
Precaution_3
Comment_3
MESERAK
GORTANCHO
KOBO GETO
TEFO CHUFO
METO DUBALE
HABIBO FURANA
SINBITA
CHEMBULA
WEJEGO YATO
ANDEGNA TEFO
SORGE DARGOSA
Livestock sale
Meal Reduction
Meal Reduction
Livestock sale
To Minimize Loss
This is to save food
To Save Food
Prevent Loss
Migration
Migration or
Evaluation
Migration or
Evacuation
Evacuation or
Migration
Migration
Evacuation or
Migration
Evacuation or
Migration
Migration or
Evacuation
Migration or
Evacuation
Migration or
Evacuation
To minimize
Damage
Reduce Human and
asset loss
Reduce Human and
asset loss
To prevent human
and asset loss
Minimize Human
and Asset Loss
To prevent Human
and asset loss
To Minimize human
and asset loss
Reduce Human and
asset loss
Reduce Human and
asset loss
To Prevent or
Minimize Loss
222
Page 1 of 5

Wereda Disaster
Risk Profile
Data_Collected_Date
December 2011
Disaster Risk Management and Food
Security Sector (DRMFSS)
Wednesday, September 3, 2014
Region S.N.N.P
Selected Indicator
Zone ALABA SPECIAL
Wereda ALABA SPECIAL
Capacity: Community Preparedness against Sudden Onset Disasters
KebeleName
BUKET BAME
Precaution_1
HOLUGEB KUKE
WETETA
ANDEGNA KONCHA
KULFO
LAYEGNAWO
LENDA
Saving Of Livestock
TACHEGNAWO
BEDANE
Storing Crop Residue
for later use
Comment_1
Precaution_2
Evacuation from
flood Spot
Evacuation or
Migration
Evacuation
Because to Buy grain
or to change by
grain during disaster
to minimize
Livestock loss during
disaster and Buying
after settlement
Because of available
on crop harvesting
to harvest and
minimizing loss and
possible later use
Migration or
Evacuation
Possible Migration
or evacuation
Migration
Migration
Comment_2
To avoid Human
lose and Property
lose
To prevent human
and asset loss
To safe human and
Animal life
Reduce Human and
asset loss
Minimize Human
and Asset Loss
To safe Human and
asset loss
Precaution_3
To save human and
asset loss
Comment_3
223
Page 2 of 5

Wereda Disaster
Risk Profile
Data_Collected_Date
December 2011
Disaster Risk Management and Food
Security Sector (DRMFSS)
Wednesday, September 3, 2014
Region S.N.N.P
Selected Indicator
Zone ALABA SPECIAL
Wereda ALABA SPECIAL
Capacity: Community Preparedness against Sudden Onset Disasters
KebeleName
Precaution_1
Comment_1
Precaution_2
Comment_2
Precaution_3
Comment_3
HULETEGNA
MEKALA
Saving Of Livestock
HULETEGNA TUKA
Saving Of Livestock
NEGELE WEDESH
Saving Of Livestock
Because to Buy grain
or to change by
grain during disaster
to minimize
Livestock loss during
disaster and Buying
after settlement
Because to Buy grain
or to change by
grain during disaster
to minimize
Livestock loss during
disaster and Buying
after settlement
Because to Buy grain
or to change by
grain during disaster
and to minimize
Livestock loss during
disaster and Buying
after settlement
Migration
Migration
Migration
To safe Human and
asset loss
To safe Human and
asset loss
To Safe Human and
asset loss
224
Page 3 of 5

Wereda Disaster
Risk Profile
Data_Collected_Date
December 2011
Disaster Risk Management and Food
Security Sector (DRMFSS)
Wednesday, September 3, 2014
Region S.N.N.P
Selected Indicator
Zone ALABA SPECIAL
Wereda ALABA SPECIAL
Capacity: Community Preparedness against Sudden Onset Disasters
KebeleName
HANTEZO
AYMELE
ANDEGNA TUKA
MEJA
Precaution_1
Saving Of Livestock
Storing Crop Residue
for later use
Saving Of livestock
Selling Of Livestock
Comment_1
Because to buy grain
or to change by
grain during disaster
and to minimize
Livestock loss
Because of available
on crop harvesting
time to harvest and
minimizing loss and
possible later use
Because to Buy grain
or to change by
grain during disaster
and to minimize
Livestock loss during
disaster and Buying
after settlement
Because to Buy grain
or to change by
grain during disaster
and to minimize
Livestock loss during
disaster and Buying
after settlement
Precaution_2
Migration
Migration to
Relatives
Migration
Migration
Comment_2
To safe human and
asset loss
Precaution_3
Comment_3
To safe human and
asset loss
To Safe human and
asset loss
To safe human and
Animal loss
225
Page 4 of 5

Wereda Disaster
Risk Profile
Data_Collected_Date
December 2011
Disaster Risk Management and Food
Security Sector (DRMFSS)
Wednesday, September 3, 2014
Region S.N.N.P
Selected Indicator
Zone ALABA SPECIAL
Wereda ALABA SPECIAL
Capacity: Community Preparedness against Sudden Onset Disasters
KebeleName
Precaution_1
Comment_1
Precaution_2
Comment_2
Precaution_3
Comment_3
ASHEKORA BOTI
YAMBI
Storing Feed, Straw,
Crop residue for later
use
It is less cost and
possible after
harvest for later use
Evacuation or
Migration
To avoid Human
and asset loss
Possible evacuation
AMATA
TETALI BITORA
GERME
BUBESA
Ditch
Selling Of Livestock
Storing Crop residue
for Later Use
Selling Of Livestock
To protect effect of
flood
Because, to buy
grain or to change
by grain during
disaster, To
minimize livestock
loss during disaster
and Buying After
Settlement
It is less cost and
possible after
harvest for later use
Because, to buy
grain or to change
by grain during
disaster, To
minimize livestock
loss
Possible evacuation
Migration
Reduce effect of
Disaster
To safe human and
asset loss
Migration
Migration
To avoid Human
and asset loss
To safe Human and
asset loss
226
Page 5 of 5

Wereda Disaster
Risk Profile
Disaster Risk Management and Food
Security Sector (DRMFSS)
Data_Collected_Date
December 2011
Wednesday, September 3, 2014
Region S.N.N.P
Zone ALABA SPECIAL
Wereda ALABA SPECIAL
Selected Indicator
Capacity: Community Preparedness against Increase in Disaster Intensity
KebeleName
Precaution_1
Comment_1
Precaution_2
Comment_2
Precaution_3
Comment_3
MESERAK
GORTANCHO
KOBO GETO
TEFO CHUFO
METO DUBALE
HABIBO FURANA
SINBITA
CHEMBULA
WEJEGO YATO
ANDEGNA TEFO
SORGE DARGOSA
Soil and Water
Conservation work
Water shed
Development
Water shed
Development
Reforestation
Water shed
Development
Flood diversion
canal construction
Water shed
development
Soil and Water
Conservation work
Water shed
Development
Increase flood
Control work
Reduce erosion
Reduce Erosion
Reduce erosion and
Degradation
Reduce flood
drought
Prevent Erosion
Minimize Flooding
Minimize drought
Improve soil and
increase Production
Reduce erosion and
Increases
production
To minimize flood
Damage
Use of Drought
resistant varieties
Use of Drought
Resistant Seed
Use of Drought
resistant
Flood diversion
canal construction
Gully Treatment
Water Supply
Drought resistant
seed
Use of Drought
Resistant Varieties
Use of drought
resistant seed
Increase erosion
prevention effort
Improves production
Improve Production
Improve production
Reduce or prevent
flood
Prevent Erosion
Reduce water
problem
Increase production
Increase Production
Increase production
To optimize
Production
227
Page 1 of 4
Wereda Disaster
Risk Profile
Data_Collected_Date
December 2011
Disaster Risk Management and Food
Security Sector (DRMFSS)
Wednesday, September 3, 2014
Region S.N.N.P
Zone ALABA SPECIAL
Wereda ALABA SPECIAL
Selected Indicator
Capacity: Community Preparedness against Increase in Disaster Intensity
KebeleName
Precaution_1
Comment_1
Precaution_2
Comment_2
Precaution_3
Comment_3
BUKET BAME
Replantation
HOLUGEB KUKE
WETETA
Flood Prevention
work
Migration
ANDEGNA KONCHA
KULFO
LAYEGNAWO
LENDA
Soil and Water
Conservation
Soil and water
Conservation work
Soil and Water
Conservation
TACHEGNAWO
BEDANE
HULETEGNA
MEKALA
Reforestation
Soil and water
conservation
To control Flooding
and Improve
Rainfall
To control Flood,
Erosion and Soil Loss
People or
Households Migrate
to Safe place
Improve soil fertility
and Production
Improve
Productivity
To protect soil
erosion and To
protect Gully
expansion
To develop water
shed
To protect soil
erosion and To
protect Gully
expansion
Diversion canal
Construction
Use of Drought
resistant Varieties
Water shed
Development
Water supply
Gully Treatment
Reforestation
Ditching
Reforestation
Controlling Flooding
To increase
Production
Improve Production
Reduce Disease and
Save Time
Reduce Erosion
To develop the water
shed
To protect soil
erosion
To develop the water
shed
228
Page 2 of 4

Wereda Disaster
Risk Profile
Data_Collected_Date
December 2011
Disaster Risk Management and Food
Security Sector (DRMFSS)
Wednesday, September 3, 2014
Region S.N.N.P
Zone ALABA SPECIAL
Wereda ALABA SPECIAL
Selected Indicator
Capacity: Community Preparedness against Increase in Disaster Intensity
KebeleName
Precaution_1
Comment_1
Precaution_2
Comment_2
Precaution_3
Comment_3
HULETEGNA TUKA
Soil and Water
Conservation
NEGELE WEDESH
HANTEZO
AYMELE
ANDEGNA TUKA
Soil and water
conservation
Soil and water
conservation
Reforestation
Soil and Water
Conservation
MEJA
Soil and Water
Conservation
ASHEKORA BOTI
YAMBI
Reforestation and
Control of Erosion
Leave or left the
area
To protect soil
erosion and To
protect Gully
expansion
To protect soil
erosion
To protect soil
erosion
To develop Water
shed
To protect Soil
erosion and To
protect Gully
Expansion
To protect Soil
erosion and To
protect Gully
Expansion
To protect soil lose
and Improve
Rainfall
To save Human and
Animal loss
Reforestation
Reforestation
Reforestation
Animal disease
prevention
Reforestation
Reforestation
Animal disease
prevention
To develop the water
shed
To develop the Water
Shed
To develop the Water
Shed
To protect Livestock
loss
To develop the water
shed
To develop the water
shed
To protect Livestock
loss
229
Page 3 of 4

Wereda Disaster
Risk Profile
Disaster Risk Management and Food
Security Sector (DRMFSS)
Data_Collected_Date
December 2011
Wednesday, September 3, 2014
Region S.N.N.P
Zone ALABA SPECIAL
Wereda ALABA SPECIAL
Selected Indicator
Capacity: Community Preparedness against Increase in Disaster Intensity
KebeleName
Precaution_1
Comment_1
Precaution_2
Comment_2
Precaution_3
Comment_3
AMATA
TETALI BITORA
Animal Disease
Prevention
Soil and Water
Conservation
GERME
BUBESA
Reforestation
Soil and Water
Conservation
To protect Livestock
loss
To protect soil
erosion and To
protect Gully
expansion
To improve Rainfall
and Protect Soil loss
To protect soil
erosion and To
protect Gully
expansion
Reforestation
Reforestation
Water shed
Development
Reforestation
To develop water
shed
To develop the water
shed
To develop the water
shed
To develop the water
shed
230
Page 4 of 4

Wereda Disaster
Risk Profile
Disaster Risk Management and Food
Security Sector (DRMFSS)
Data_Collected_Date
December 2011
Wednesday, September 3, 2014
Region S.N.N.P
Zone
ALABA SPECIAL
Wereda ALABA SPECIAL
Selected Indicator
Capacity: Community Preparedness against Disasters
Kebele Name
Precaution 1
Comment 1
Precaution 2
Comment 2
Precaution 3
Comment 3
MESERAK
GORTANCHO
KOBO GETO
TEFO CHUFO
METO DUBALE
HABIBO FURANA
SINBITA
CHEMBULA
WEJEGO YATO
ANDEGNA TEFO
Saving or Minimize
Consumption
Reducing
Consumption
Water way or
Diversion
construction
Flood diversion
canal
Saving of
Production
Reduce crop sell,
Food saving and
Meal Reduction
Saving of Own
Production
Reducing
Consumption
Reducing
Consumption
Go reduce food short
age
Minimize food
Shortage
To reduce erosion
Reduce flood damage
Increase soil and
Water conservation
Work
For hard time Use,
Households save what
they have
Farmers reduce
market Supply in time
of Drought
To save Food
To save Production
Livestock sale
Livestock sale
Food Saving
Food Saving
To prevent
Erosion
Livestock sale
Livestock Sale
Food Saving
To prevent
livestock loss
Prevent loss
To minimize food
Shortage
Livestock sale
To use it at
disaster time
Minimize
possible
Livestock loss
To Prevent Loss
Meal Reduction
Meal Reduction
For later use
Livestock sale
To Minimize Loss
This is to save food
To Save Food
Prevent Loss
231
Page 1 of 7
Wereda Disaster
Risk Profile
Disaster Risk Management and Food
Security Sector (DRMFSS)
Data_Collected_Date
December 2011
Wednesday, September 3, 2014
Region S.N.N.P
Zone
ALABA SPECIAL
Wereda ALABA SPECIAL
Selected Indicator
Capacity: Community Preparedness against Disasters
Kebele Name
Precaution 1
Comment 1
Precaution 2
Comment 2
Precaution 3
Comment 3
SORGE DARGOSA
BUKET BAME
HOLUGEB KUKE
WETETA
ANDEGNA
KONCHA
KULFO
Reducing
Consumption or
Saving of Crop
Saving of own crop
production
Saving of own
Produce
No crop sell or
Reduce Market
supply, Food saving
and Meal Reduction
Saving
Consumption
Food saving
To minimize food
Shortage
To use it in time and
aftermath of disaster
For Later use, Farmers
save their produce or
crop
To past hard time
Households use what
they have effectively
To use it at hard Time
To minimize food
Shortage
Flood Diversion
canal
Construction
Sale of Livestock
Livestock sale
To minimize
flooding
To avoid
livestock lose
To avoid
livestock loss
Livestock sale
Soil and water
conservation
structures
Construction
Prevent loss
To reduce
erosion
232
Page 2 of 7

Wereda Disaster
Risk Profile
Disaster Risk Management and Food
Security Sector (DRMFSS)
Data_Collected_Date
December 2011
Wednesday, September 3, 2014
Region S.N.N.P
Zone
ALABA SPECIAL
Wereda ALABA SPECIAL
Selected Indicator
Capacity: Community Preparedness against Disasters
Kebele Name
LAYEGNAWO
LENDA
Precaution 1
Reducing Market
Supply
Comment 1
Because it can easily
providing by farmers
Precaution 2
Storing Crop
Residue to later
Use
Comment 2
Because
available on crop
harvesting time
to Harvest and
Minimize loss
and possible for
later use
Precaution 3
Saving Of Livestock
Comment 3
Because to Buy
grain or to change
by grain during
disaster to
minimize Livestock
loss during disaster
and Buying after
settlement
TACHEGNAWO
BEDANE
Reducing Market
Supply
It can easily
performed by farmers
Saving of
Livestock
Because to buy
grain or to
change by grain
during disaster
Storing Crop
Residue for later
use
Because of
available on crop
harvesting to
harvest and
minimizing loss
and possible later
use
HULETEGNA
MEKALA
Reducing Market
Supply
Because it can easily
Performing by farmers
Storing Crop
Residue to later
Use
Because only
available on crop
harvesting time
and to
minimizing loss
and possible
after harvest for
later use
Saving Of Livestock
Because to Buy
grain or to change
by grain during
disaster to
minimize Livestock
loss during disaster
and Buying after
settlement
233
Page 3 of 7
Wereda Disaster
Risk Profile
Disaster Risk Management and Food
Security Sector (DRMFSS)
Data_Collected_Date
December 2011
Wednesday, September 3, 2014
Region S.N.N.P
Zone
ALABA SPECIAL
Wereda ALABA SPECIAL
Selected Indicator
Capacity: Community Preparedness against Disasters
Kebele Name
HULETEGNA
TUKA
Precaution 1
Reducing Market
Supply
Comment 1
Because it can easily
providing by farmers
Precaution 2
Storing Crop
Residue to later
Use
Comment 2
Because of
available on crop
harvesting time
and Minimize
loss and possible
for harvest for
later use
Precaution 3
Saving Of Livestock
Comment 3
Because to Buy
grain or to change
by grain during
disaster to
minimize Livestock
loss during disaster
and Buying after
settlement
NEGELE WEDESH
Reducing Market
Supply
Because it can easily
providing by farmers
Storing Crop
Residue to later
Use
Because
available on crop
harvesting time
to Harvest and
Minimize loss
and possible for
later use
Saving Of Livestock
Because to Buy
grain or to change
by grain during
disaster and to
minimize Livestock
loss during disaster
and Buying after
settlement
HANTEZO
Reducing Market
Supply
Because it can easily
providing by farmers
Storing Crop
Residue to later
Use
Because of
available on crop
harvesting time
to Harvest and
Minimize loss
and possible for
later use
Saving Of Livestock
Because to buy
grain or to change
by grain during
disaster and to
minimize Livestock
loss
234
Page 4 of 7

Wereda Disaster
Risk Profile
Disaster Risk Management and Food
Security Sector (DRMFSS)
Data_Collected_Date
December 2011
Wednesday, September 3, 2014
Region S.N.N.P
Zone
ALABA SPECIAL
Wereda ALABA SPECIAL
Selected Indicator
Capacity: Community Preparedness against Disasters
Kebele Name
AYMELE
Precaution 1
Reducing Market
Supply
Comment 1
Because it can easily
providing by farmers
Precaution 2
Selling Livestock
Comment 2
Because to buy
grain or to
change by grain
during disaster
and To minimize
livestock loss
Precaution 3
Storing Crop
Residue for later
use
Comment 3
Because of
available on crop
harvesting time to
harvest and
minimizing loss
and possible later
use
ANDEGNA TUKA
Reducing market
Supplying
Because it can easily
providing by farmers
Storing Crop
residue for Later
Use
Because of
Available on crop
harvesting time
to harvest and
minimize loss
and possible for
use
Saving Of livestock
Because to Buy
grain or to change
by grain during
disaster and to
minimize Livestock
loss during disaster
and Buying after
settlement
MEJA
Reducing market
Supplying
Because it can easily
providing by farmers
Storing Crop
residue for Later
Use
Because of any
Available on crop
harvesting time
and minimize
loss and possible
after harvest for
later use
Selling Of Livestock
Because to Buy
grain or to change
by grain during
disaster and to
minimize Livestock
loss during disaster
and Buying after
settlement
235
Page 5 of 7

Wereda Disaster
Risk Profile
Disaster Risk Management and Food
Security Sector (DRMFSS)
Data_Collected_Date
December 2011
Wednesday, September 3, 2014
Region S.N.N.P
Zone
ALABA SPECIAL
Wereda ALABA SPECIAL
Selected Indicator
Capacity: Community Preparedness against Disasters
Kebele Name
ASHEKORA BOTI
Precaution 1
Saving or reducing
supply to Market
Comment 1
Because it can easily
performed by Farmers
Precaution 2
Sale of Livestock
Comment 2
To protect
livestock loss.
They sale at
drought time and
Buy later, Buy
Grain
Precaution 3
Storing Feed,
Straw, Crop
residue for later
use
Comment 3
It is less cost and
possible after
harvest for later
use
YAMBI
Crop save
For later use
Livestock Sell
To minimize Loss
AMATA
Reducing market
Supply
TETALI BITORA
Reducing Market
Supply
It can easily
performed by farmers
Because it can easily
providing by farmers
Storing Crop
residue for Later
Use
Storing Crop
residue for Later
Use
Because of any
Available on crop
harvesting time
to harvest and
minimize loss
and possible
later use
Because of Only
Available on crop
harvesting time
and minimize
loss and possible
after harvest for
later use,
Ditch
Selling Of Livestock
To protect effect
of flood
Because, to buy
grain or to change
by grain during
disaster, To
minimize livestock
loss during disaster
and Buying After
Settlement
236
Page 6 of 7

Wereda Disaster
Risk Profile
Disaster Risk Management and Food
Security Sector (DRMFSS)
Data_Collected_Date
December 2011
Wednesday, September 3, 2014
Region S.N.N.P
Zone
ALABA SPECIAL
Wereda ALABA SPECIAL
Selected Indicator
Capacity: Community Preparedness against Disasters
Kebele Name
GERME
Precaution 1
Reducing Market
Supply
Comment 1
Because it can easily
Performed by farmers
Precaution 2
Sale of Livestock
Comment 2
To protect
livestock loss.
They sale at
drought time and
Buy later use,
Buy Grain
Precaution 3
Storing Crop
residue for Later
Use
Comment 3
It is less cost and
possible after
harvest for later
use
BUBESA
Reducing Market
Supply
Because it can easily
Providing by farmers
Storing Crop
Residues for
Later Use
Because of
Available on crop
harvesting time
to harvest and
minimize loss
and possible
later use,
Selling Of Livestock
Because, to buy
grain or to change
by grain during
disaster, To
minimize livestock
loss
237
Page 7 of 7

Wereda Disaster
Risk Profile
Data_Collected_Date
December 2011
Region S.N.N.P
Selected Indicator
Kebele Name
Type of Disaster(s)
Zone
ALABA SPECIAL
Hazard: Coping and recovering during last Disaster
MESERAK GORTANCHO
Drought
Coping_Strategy
Labour sale, Land rent, Livestock sale and Government Aid
Disaster Risk Management and Food
Security Sector (DRMFSS)
Wednesday, September 3, 2014
Wereda ALABA SPECIAL
Description
Joint community and Government effort to minimize the disaster
Recovery_Strategy
Cropping and Livestock production occurred after the disaster
Description
Joint community and Government effort to minimize the disaster
Community
Participation_Ways
Description
Food sharing, Labour sharing, seed and Oxen help
Joint community and Government effort to minimize the disaster
238
Page 1 of 30

Wereda Disaster
Risk Profile
Data_Collected_Date
December 2011
Region S.N.N.P
Selected Indicator
Kebele Name
Type of Disaster(s)
Zone
ALABA SPECIAL
Hazard: Coping and recovering during last Disaster
KOBO GETO
Drought
Coping_Strategy
Land rent, Fire wood sale, Livestock sale and Government aid
Disaster Risk Management and Food
Security Sector (DRMFSS)
Wednesday, September 3, 2014
Wereda ALABA SPECIAL
Description
Government aid even including water supply or aid occurred that year
Recovery_Strategy
Livestock and Crop production started after rainfall
Description
Community Highly evolved crop production work after rainfall
Community
Participation_Ways
Description
Labour sharing, Oxen sharing and Food Sharing
239
Page 2 of 30

Wereda Disaster
Risk Profile
Data_Collected_Date
December 2011
Region S.N.N.P
Selected Indicator
Kebele Name
Type of Disaster(s)
Zone
ALABA SPECIAL
Hazard: Coping and recovering during last Disaster
TEFO CHUFO
Drought
Disaster Risk Management and Food
Security Sector (DRMFSS)
Wednesday, September 3, 2014
Wereda ALABA SPECIAL
Coping_Strategy
Community help, Government aid, Diversion or water way construction and asset sale
Description
Government With low community trying to develop the water shed, But it is still problem
Recovery_Strategy
Replantation and Soil conservation work, Animal and crop production following rainfall
Description
Government With low community trying to develop the water shed, But it is still problem
Community
Participation_Ways
Description
Food sharing, Oxen seed sharing and Labour Sharing
Government With low community trying to develop the water shed, But it is still problem
240
Page 3 of 30

Wereda Disaster
Risk Profile
Data_Collected_Date
December 2011
Region S.N.N.P
Selected Indicator
Kebele Name
Type of Disaster(s)
Zone
ALABA SPECIAL
Hazard: Coping and recovering during last Disaster
METO DUBALE
Flood
Coping_Strategy
Livestock sale, government aid and land rent
Disaster Risk Management and Food
Security Sector (DRMFSS)
Wednesday, September 3, 2014
Wereda ALABA SPECIAL
Description
It was an organized effort by the government and community
Recovery_Strategy
After the disaster cropping and livestock production stored
Description
It was an organized effort by the government and community
Community
Participation_Ways
Description
Labour sharing, Oxen sharing and Food Sharing
It was an organized effort by the government and community
241
Page 4 of 30

Wereda Disaster
Risk Profile
Data_Collected_Date
December 2011
Region S.N.N.P
Selected Indicator
Kebele Name
Type of Disaster(s)
Zone
ALABA SPECIAL
Hazard: Coping and recovering during last Disaster
HABIBO FURANA
Drought
Coping_Strategy
Community help, Government aid and Asset sale
Disaster Risk Management and Food
Security Sector (DRMFSS)
Wednesday, September 3, 2014
Wereda ALABA SPECIAL
Description
Joint community and Government effort to cope the Disaster Occurred
Recovery_Strategy
Crop Production and Livestock production resumed after rainfall
Description
Joint community and Government effort to cope the Disaster Occurred
Community
Participation_Ways
Description
Food Sharing Oxen and Seed sharing, Labour Sharing
Joint community and Government effort to cope the Disaster Occurred
242
Page 5 of 30

Wereda Disaster
Risk Profile
Data_Collected_Date
December 2011
Region S.N.N.P
Selected Indicator
Kebele Name
Type of Disaster(s)
Zone
ALABA SPECIAL
Hazard: Coping and recovering during last Disaster
SINBITA
Flood
Coping_Strategy
Evacuation, Food aid By Government and Community Support
Disaster Risk Management and Food
Security Sector (DRMFSS)
Wednesday, September 3, 2014
Wereda ALABA SPECIAL
Description
Recovery_Strategy
After the disaster households returned to their homes and Started crop and Animal production
Description
Community
Participation_Ways
Description
Food sharing , crop or seed sharing and House sharing
243
Page 6 of 30

Wereda Disaster
Risk Profile
Data_Collected_Date
December 2011
Region S.N.N.P
Selected Indicator
Kebele Name
Type of Disaster(s)
Zone
ALABA SPECIAL
Hazard: Coping and recovering during last Disaster
CHEMBULA
Drought
Coping_Strategy
Food sharing, Government aid, Land Rent and Livestock sale
Disaster Risk Management and Food
Security Sector (DRMFSS)
Wednesday, September 3, 2014
Wereda ALABA SPECIAL
Description
Community and Government effort increased against drought
Recovery_Strategy
Animal and crop production enhanced after rainfall
Description
Community and Government effort increased against drought
Community
Participation_Ways
Description
Labour sharing, Oxen and seed sharing and also Food Sharing
Community and Government effort increased against drought
244
Page 7 of 30

Wereda Disaster
Risk Profile
Data_Collected_Date
December 2011
Region S.N.N.P
Selected Indicator
Kebele Name
Type of Disaster(s)
Zone
ALABA SPECIAL
Hazard: Coping and recovering during last Disaster
WEJEGO YATO
Drought
Coping_Strategy
Land Rent, Asset sale, Government Aid and Community help
Disaster Risk Management and Food
Security Sector (DRMFSS)
Wednesday, September 3, 2014
Wereda ALABA SPECIAL
Description
Community with Government Involved in Recovery effort
Recovery_Strategy
After Rainfall crop and Livestock production Improved
Description
Community with Government Involved in Recovery effort
Community
Participation_Ways
Description
Oxen sharing, Food Sharing and Seed Sharing
Community with Government Involved in Recovery effort
245
Page 8 of 30

Wereda Disaster
Risk Profile
Data_Collected_Date
December 2011
Region S.N.N.P
Selected Indicator
Kebele Name
Type of Disaster(s)
Zone
ALABA SPECIAL
Hazard: Coping and recovering during last Disaster
ANDEGNA TEFO
Flood
Coping_Strategy
Livestock sale, Land rent, Food sharing and Government Aid
Disaster Risk Management and Food
Security Sector (DRMFSS)
Wednesday, September 3, 2014
Wereda ALABA SPECIAL
Description
Both Government and Community involved in recovery effort
Recovery_Strategy
Crop production resumed after drought and Flooding
Description
Government and Community wider participation
Community
Participation_Ways
Description
Food Sharing, Oxen sharing and Labour sharing
Wider community participation
246
Page 9 of 30

Wereda Disaster
Risk Profile
Data_Collected_Date
December 2011
Region S.N.N.P
Selected Indicator
Kebele Name
Type of Disaster(s)
Zone
ALABA SPECIAL
Hazard: Coping and recovering during last Disaster
SORGE DARGOSA
Flood
Disaster Risk Management and Food
Security Sector (DRMFSS)
Wednesday, September 3, 2014
Wereda ALABA SPECIAL
Coping_Strategy
Land rent, Labour sale, Livestock sale, Migration and Government Aid
Description
The recovery effort was limited and Covered only 30% of Kebele
Recovery_Strategy
The problem of soil Degradation still exist
Description
Limited effort is Undertaken by Community and Government
Community
Participation_Ways
Description
Flood Disaster Time Community Tries to prevent By constructing Diversion canal
Government and Community trying to prevent flood and soil Degradation by PSNP even though it is less effective
247
Page 10 of 30

Wereda Disaster
Risk Profile
Data_Collected_Date
December 2011
Region S.N.N.P
Selected Indicator
Kebele Name
Type of Disaster(s)
Zone
ALABA SPECIAL
Hazard: Coping and recovering during last Disaster
BUKET BAME
Flood
Coping_Strategy
Livestock sale, Land rent, Firewood sale and Labour sale
Disaster Risk Management and Food
Security Sector (DRMFSS)
Wednesday, September 3, 2014
Wereda ALABA SPECIAL
Description
People helped each other, Government delivered aid to the Victims
Recovery_Strategy
After rainfall crop Produced and Livestock production
Description
Every farmers helping each other participated in development works and increase effort in crop production
Community
Participation_Ways
Description
Those with oxen occasionally give oxen to farmers with no oxen and seed lending
Government credit access for seed and Fertilizer supply, Community and Government effort to Produce crop, and
Avoid animal Disease
248
Page 11 of 30

Wereda Disaster
Risk Profile
Data_Collected_Date
December 2011
Region S.N.N.P
Selected Indicator
Kebele Name
Type of Disaster(s)
Zone
ALABA SPECIAL
Hazard: Coping and recovering during last Disaster
HOLUGEB KUKE
Drought
Coping_Strategy
Land Rent, Labour sale and Livestock sale
Disaster Risk Management and Food
Security Sector (DRMFSS)
Wednesday, September 3, 2014
Wereda ALABA SPECIAL
Description
Government delivered aid to the people and the community helped each other
Recovery_Strategy
Crop production and Livestock improved After Rainfall
Description
Farmers effectively involved in crop production and Livestock management work after rainfall
Community
Participation_Ways
Description
Seed lending and Ploughing Oxen sharing
Government Provided Credit access for seed and Fertilizer
249
Page 12 of 30

Wereda Disaster
Risk Profile
Data_Collected_Date
December 2011
Region S.N.N.P
Selected Indicator
Kebele Name
Type of Disaster(s)
Zone
ALABA SPECIAL
Hazard: Coping and recovering during last Disaster
WETETA
Flood
Disaster Risk Management and Food
Security Sector (DRMFSS)
Wednesday, September 3, 2014
Wereda ALABA SPECIAL
Coping_Strategy
Land rent, Livestock sale, Firewood sale, Migrate to other Kebele and Food aid
Description
Seed and Food aid was Given by Government
Recovery_Strategy
After Rainfall crop Production started
Description
But in August the crop was again hit by snow
Community
Participation_Ways
Description
Food sharing, oxen labour sharing and Seed lending
250
Page 13 of 30

Wereda Disaster
Risk Profile
Data_Collected_Date
December 2011
Region S.N.N.P
Selected Indicator
Kebele Name
Type of Disaster(s)
Zone
ALABA SPECIAL
Hazard: Coping and recovering during last Disaster
ANDEGNA KONCHA
Drought
Coping_Strategy
Food sharing, Land Rent, Livestock sale and Government aid
Disaster Risk Management and Food
Security Sector (DRMFSS)
Wednesday, September 3, 2014
Wereda ALABA SPECIAL
Description
Government Aid Delivered
Recovery_Strategy
Crop production Restarted
Description
People supported by Government seed and Fertilizer credit supply and evolved in crop production after rainfall
Community
Participation_Ways
Description
Labour sharing, oxen labour sharing and Food Sharing
Community widely Participated
251
Page 14 of 30

Wereda Disaster
Risk Profile
Data_Collected_Date
December 2011
Region S.N.N.P
Selected Indicator
Kebele Name
Type of Disaster(s)
Zone
ALABA SPECIAL
Hazard: Coping and recovering during last Disaster
KULFO
Drought
Coping_Strategy
Asset sale and Government Aid
Disaster Risk Management and Food
Security Sector (DRMFSS)
Wednesday, September 3, 2014
Wereda ALABA SPECIAL
Description
Recovery_Strategy
After Rainfall crop and livestock production resumed
Description
Community
Participation_Ways
Description
Food sharing, Oxen and Seed lending
252
Page 15 of 30

Wereda Disaster
Risk Profile
Data_Collected_Date
December 2011
Region S.N.N.P
Selected Indicator
Kebele Name
Type of Disaster(s)
Zone
ALABA SPECIAL
Hazard: Coping and recovering during last Disaster
LAYEGNAWO LENDA
Drought
Coping_Strategy
Selling of firewood, Renting land and Selling Livestock
Disaster Risk Management and Food
Security Sector (DRMFSS)
Wednesday, September 3, 2014
Wereda ALABA SPECIAL
Description
Community helped each other and Government aid delivered
Recovery_Strategy
Increasing agricultural production after practicing their agriculture follows the rainfall
Description
Farmers effort to produce following rainfall, By supplying agricultural inputs or seed and Fertilizer
Community
Participation_Ways
Description
Food Sharing, Oxen labour lending and Seed lending
Food sharing existed, community help each other by giving Oxen for Tillage and seed
253
Page 16 of 30

Wereda Disaster
Risk Profile
Data_Collected_Date
December 2011
Region S.N.N.P
Selected Indicator
Kebele Name
Type of Disaster(s)
Zone
ALABA SPECIAL
Hazard: Coping and recovering during last Disaster
TACHEGNAWO BEDANE
Drought
Coping_Strategy
Renting land and Selling Livestock
Disaster Risk Management and Food
Security Sector (DRMFSS)
Wednesday, September 3, 2014
Wereda ALABA SPECIAL
Description
Community helped each other and Government aid Development
Recovery_Strategy
Increased agricultural production after practicing their agriculture following the rainfall
Description
Farmers effort to produce following rainfall, By supplying agricultural inputs or seed and Fertilizer
Community
Participation_Ways
Description
Seed lending, Food Sharing and Oxen labour lending
Community help each other by giving Oxen for Tillage and seed and Food sharing existed
254
Page 17 of 30

Wereda Disaster
Risk Profile
Data_Collected_Date
December 2011
Region S.N.N.P
Selected Indicator
Kebele Name
Type of Disaster(s)
Zone
ALABA SPECIAL
Hazard: Coping and recovering during last Disaster
HULETEGNA MEKALA
Flood
Coping_Strategy
Water Purchase and Using Pond water
Disaster Risk Management and Food
Security Sector (DRMFSS)
Wednesday, September 3, 2014
Wereda ALABA SPECIAL
Description
Recovery_Strategy
It is still a problem since there is no water supply in the Kebele
Description
Community
Participation_Ways
Description
Water sharing
255
Page 18 of 30

Wereda Disaster
Risk Profile
Data_Collected_Date
December 2011
Region S.N.N.P
Selected Indicator
Kebele Name
Type of Disaster(s)
Zone
ALABA SPECIAL
Hazard: Coping and recovering during last Disaster
HULETEGNA TUKA
Drought
Coping_Strategy
Selling of firewood, Renting land and Selling Livestock
Disaster Risk Management and Food
Security Sector (DRMFSS)
Wednesday, September 3, 2014
Wereda ALABA SPECIAL
Description
Community helped each other and Government aid delivered
Recovery_Strategy
Increasing agricultural production after practicing their agriculture following the rainfall
Description
Farmers effort to produce following rainfall, By supplying agricultural inputs or seed and Fertilizer
Community
Participation_Ways
Description
Food Sharing, Oxen labour lending and Seed lending
Food sharing existed, community help each other by giving Oxen for Tillage and seed
256
Page 19 of 30

Wereda Disaster
Risk Profile
Data_Collected_Date
December 2011
Region S.N.N.P
Selected Indicator
Kebele Name
Type of Disaster(s)
Zone
ALABA SPECIAL
Hazard: Coping and recovering during last Disaster
NEGELE WEDESH
Drought
Coping_Strategy
By Selling of firewood, By Renting land and By Selling Livestock
Disaster Risk Management and Food
Security Sector (DRMFSS)
Wednesday, September 3, 2014
Wereda ALABA SPECIAL
Description
Community helped each other and Government aid delivered
Recovery_Strategy
Increasing agricultural production after practicing their agriculture following the rainfall
Description
Community
Participation_Ways
Description
Farmers effort to produce following rainfall, By supplying agricultural inputs or seed and Fertilizer, Measures taken
By Government to control animal disease
Food Sharing, Oxen labour lending and Seed lending
Food sharing existed, community help each other by giving Oxen for Tillage and seed
257
Page 20 of 30

Wereda Disaster
Risk Profile
Data_Collected_Date
December 2011
Region S.N.N.P
Selected Indicator
Kebele Name
Type of Disaster(s)
Zone
ALABA SPECIAL
Hazard: Coping and recovering during last Disaster
HANTEZO
Drought
Coping_Strategy
Renting land, Selling Livestock and Selling of fire wood
Disaster Risk Management and Food
Security Sector (DRMFSS)
Wednesday, September 3, 2014
Wereda ALABA SPECIAL
Description
Community helped each other and Government aid Delivered
Recovery_Strategy
Increasing agricultural production after Exercising their agriculture following the rainfall
Description
Farmers effort to produce following rainfall, By supplying agricultural inputs or seed and Fertilizer
Community
Participation_Ways
Description
Food Sharing, Oxen labour lending and Seed lending
Food sharing existed, community help each other by giving Oxen for Tillage and seed
258
Page 21 of 30

Wereda Disaster
Risk Profile
Data_Collected_Date
December 2011
Region S.N.N.P
Selected Indicator
Kebele Name
Type of Disaster(s)
Zone
ALABA SPECIAL
Hazard: Coping and recovering during last Disaster
AYMELE
Drought
Coping_Strategy
Selling of firewood, By renting land and Selling of livestock
Disaster Risk Management and Food
Security Sector (DRMFSS)
Wednesday, September 3, 2014
Wereda ALABA SPECIAL
Description
Government aid Delivered and Community helped each other
Recovery_Strategy
Increasing agricultural production after practicing their agriculture following the rainfall
Description
Community
Participation_Ways
Description
Farmers effort to produce following rainfall, By supplying agricultural inputs or seed and Fertilizer, Measures taken
By Government to control disease
Food Sharing, Oxen labour lending and Seed lending
Food sharing existed, community help each other by giving Oxen for Tillage and seed
259
Page 22 of 30

Wereda Disaster
Risk Profile
Data_Collected_Date
December 2011
Region S.N.N.P
Selected Indicator
Kebele Name
Type of Disaster(s)
Zone
ALABA SPECIAL
Hazard: Coping and recovering during last Disaster
ANDEGNA TUKA
Drought
Coping_Strategy
Selling of firewood, By renting land and Selling of livestock
Disaster Risk Management and Food
Security Sector (DRMFSS)
Wednesday, September 3, 2014
Wereda ALABA SPECIAL
Description
Community helped each other and Government aid Delivered
Recovery_Strategy
Increasing agricultural production after practicing their agriculture following the rainfall
Description
Farmers effort to produce following rainfall, By supplying agricultural inputs or seed and Fertilizer
Community
Participation_Ways
Description
Food Sharing, Oxen labour lending and Seed lending
Food sharing existed, community help each other by giving Oxen for Tillage and seed
260
Page 23 of 30

Wereda Disaster
Risk Profile
Data_Collected_Date
December 2011
Region S.N.N.P
Selected Indicator
Kebele Name
Type of Disaster(s)
Zone
ALABA SPECIAL
Hazard: Coping and recovering during last Disaster
MEJA
Drought
Coping_Strategy
By Selling of firewood, By Renting land and By Selling Livestock
Disaster Risk Management and Food
Security Sector (DRMFSS)
Wednesday, September 3, 2014
Wereda ALABA SPECIAL
Description
Community helped each other and Government aid Delivered
Recovery_Strategy
Increasing agricultural production after practicing other agriculture following the rainfall
Description
Community
Participation_Ways
Description
Farming effort to produce following rainfall, By supplying agricultural inputs, Measures taken By Government to
control disease
Food Sharing, Oxen labour lending and Seed lending
Food sharing existed, community help each other by giving Oxen for Tillage and seed
261
Page 24 of 30

Wereda Disaster
Risk Profile
Data_Collected_Date
December 2011
Region S.N.N.P
Selected Indicator
Kebele Name
Type of Disaster(s)
Zone
ALABA SPECIAL
Hazard: Coping and recovering during last Disaster
ASHEKORA BOTI
Drought
Coping_Strategy
Livestock sale, Firewood sale and land rent
Disaster Risk Management and Food
Security Sector (DRMFSS)
Wednesday, September 3, 2014
Wereda ALABA SPECIAL
Description
Community helped each other and Government aid Delivered
Recovery_Strategy
Crop production and Animal Production increased after rainfall
Description
Community
Participation_Ways
Description
Government Intervention to control animal disease, Farmers effort to produce crop following rainfall and Improved
seed and fertilizer supply
Seed lending, Oxen labour lending and Food sharing
Community help each other by giving seed, Oxen, for tillage and Food sharing existed
262
Page 25 of 30

Wereda Disaster
Risk Profile
Data_Collected_Date
December 2011
Region S.N.N.P
Selected Indicator
Kebele Name
Type of Disaster(s)
Zone
ALABA SPECIAL
Hazard: Coping and recovering during last Disaster
YAMBI
Drought
Coping_Strategy
Beg from relatives and Food Aid
Disaster Risk Management and Food
Security Sector (DRMFSS)
Wednesday, September 3, 2014
Wereda ALABA SPECIAL
Description
It was an Organized effort
Recovery_Strategy
By self_help and By Government aid
Description
It was an Organized effort
Community
Participation_Ways
Description
Food share and Oxen labour lend
It was an Organized effort
263
Page 26 of 30

Wereda Disaster
Risk Profile
Data_Collected_Date
December 2011
Region S.N.N.P
Selected Indicator
Kebele Name
Type of Disaster(s)
Zone
ALABA SPECIAL
Hazard: Coping and recovering during last Disaster
AMATA
Drought
Coping_Strategy
Selling of firewood, Renting land and Selling Livestock
Disaster Risk Management and Food
Security Sector (DRMFSS)
Wednesday, September 3, 2014
Wereda ALABA SPECIAL
Description
Community helped each other and Government aid Delivered
Recovery_Strategy
Increasing agricultural production after practicing other agriculture following the rainfall
Description
Farmers effort to produce following rainfall, By supplying agricultural inputs seeds and Fertilizer
Community
Participation_Ways
Description
Seed lending, Oxen labour lending and Food sharing
Community help each other by giving oxen for Tillage and seed, Food Sharing existed
264
Page 27 of 30

Wereda Disaster
Risk Profile
Data_Collected_Date
December 2011
Region S.N.N.P
Selected Indicator
Kebele Name
Type of Disaster(s)
Zone
ALABA SPECIAL
Hazard: Coping and recovering during last Disaster
TETALI BITORA
Drought
Coping_Strategy
By Selling of firewood, By Renting land and By Selling Livestock
Disaster Risk Management and Food
Security Sector (DRMFSS)
Wednesday, September 3, 2014
Wereda ALABA SPECIAL
Description
Community helped each other and Government aid delivered
Recovery_Strategy
Increased agricultural production after practicing their agriculture following the rainfall
Description
Community
Participation_Ways
Description
Farmers effort to produce following rainfall, By supplying agricultural inputs, Measures taken By Government to
control animal disease
Food Sharing, Oxen labour lending and Seed lending
Food sharing existed, community help each other by giving Oxen for Tillage and seed
265
Page 28 of 30

Wereda Disaster
Risk Profile
Data_Collected_Date
December 2011
Region S.N.N.P
Selected Indicator
Kebele Name
Type of Disaster(s)
Zone
ALABA SPECIAL
Hazard: Coping and recovering during last Disaster
GERME
Drought
Coping_Strategy
Livestock sale, Firewood sale and land rent
Disaster Risk Management and Food
Security Sector (DRMFSS)
Wednesday, September 3, 2014
Wereda ALABA SPECIAL
Description
Community helped each other and Government aid Delivered
Recovery_Strategy
Crop production and Animal Production increased after rainfall
Description
Community
Participation_Ways
Description
Possible Government Intervention, Farmers effort to produce crop following rainfall, Agricultural Input supply or Seed
and Fertilizer
Seed lending, Oxen labour lending and Food sharing
Community help each other by giving Seed, oxen for Tillage and Food Sharing existed
266
Page 29 of 30

Wereda Disaster
Risk Profile
Data_Collected_Date
December 2011
Region S.N.N.P
Selected Indicator
Kebele Name
Type of Disaster(s)
Zone
ALABA SPECIAL
Hazard: Coping and recovering during last Disaster
BUBESA
Drought
Coping_Strategy
Selling of firewood, Renting land and Selling Livestock
Disaster Risk Management and Food
Security Sector (DRMFSS)
Wednesday, September 3, 2014
Wereda ALABA SPECIAL
Description
Community helped each other and Government aid delivered
Recovery_Strategy
Increasing Agricultural Production, after exercising their agriculture following the rainfall
Description
Farmers effort to Produce following rainfall, By supplying agricultural Input or Seed and Fertilizer
Community
Participation_Ways
Description
Food Sharing, Oxen labour lending and Seed Lending
Food sharing existed, community help each other by giving Oxen for Tillage and seed
267
Page 30 of 30
Data_Collected_Date
Region S.N.N.P
December 2011
Zone ALABA SPECIAL
Selected Indicator
Capacity: Type Community Participation
Kebele Name
Levels_Comm_Participation
MESERAK
GORTANCHO
KOBO GETO
TEFO CHUFO
METO DUBALE
HABIBO FURANA
SINBITA
CHEMBULA
WEJEGO YATO
ANDEGNA TEFO
SORGE DARGOSA
BUKET BAME
HOLUGEB KUKE
WETETA
ANDEGNA
KONCHA
KULFO
LAYEGNAWO
LENDA
Marriage, Death and Sudden Hazard. Example
Fire Hazard
During Marriage, Fire Hazard, Conflict, Death
and Harvesting
In time Disaster, Marriage and Death. Example
Fire hazard Conflict
During Marriage, Death, Time of Disaster.
Example Fire Hazard
On the Occasion of Death, Marriage and
Disaster Such Fire Hazard
On the occasion of Marriage, Death and
Hazard
In time of Marriage, Death and Sudden shocks
In case Such as Sudden Hazard Fire, Marriage,
death and Harvesting Time
During disaster, Marriage time and Time of
Death. Example Fire Hazard
During Death, Disaster and Marriage
Disaster time, Marriage time and Mourning or
Death time
during disaster, Marriage and Mourning or
Death
Time of death, Time of Marriage and Time of
fire Hazard
In case of disaster, Death and Marriage
During Marriage, Disaster such as fire hazard
and Death
During in time of Mourn or Death, Farming and
Marriage
268
Wednesday, September 3, 2014
Wereda ALABA SPECIAL
Changes_In_Last_Decade
Increasing
Increasing Cooperation
Increasing
Increasing Cooperation
Increasing Cooperation
Increasing Cooperation
Increasing Cooperation
Increasing Cooperation
Good Cooperation
Increasing Cooperation
Increasing Cooperation
Increasing Cooperation
Increasing Cooperation
Good Cooperation
Good Cooperation
No change
Page 1 of 2

Data_Collected_Date
Region S.N.N.P
December 2011
Zone ALABA SPECIAL
Selected Indicator
Capacity: Type Community Participation
Kebele Name
Levels_Comm_Participation
TACHEGNAWO
BEDANE
HULETEGNA
MEKALA
HULETEGNA
TUKA
NEGELE WEDESH
HANTEZO
AYMELE
At time of Marriage, Death and at Farming
In Time of Farming, Marriage and Death
During in time of Farming, Mourn or Death,
Marriage and Border Conflict
During in time of Farming, Mourn or Death,
Marriage and Border Conflict
In Time of Farming, Marriage and Death
In time of Disaster, Marriage and Death
ANDEGNA TUKA
MEJA
ASHEKORA BOTI
YAMBI
AMATA
TETALI BITORA
GERME
During in time of Mourn or Death, Farming and
Marriage
In Time of Farming, Marriage and Death
In time of Border Conflict, Mourn or Death,
Marriage and Farming
By time of Marriage, Death and Fire hazard
At Marriage, Disaster and death time
During in time of Farming, Mourn or Death,
Marriage and Border Conflict
In time of Death, Marriage and Farming
BUBESA
In time of Death, Marriage and Farming
Wednesday, September 3, 2014
Wereda ALABA SPECIAL
Changes_In_Last_Decade
Good
No change
No change
Good
Good
No change
Good
In the same way they are cooperating
each other
No significant change
Good
No change
In the same way they are cooperating
each other
No change
269
Page 2 of 2
Data_Collected_Date
December 2011
Wednesday, September 3, 2014
Region S.N.N.P
Selected Indicator
Zone
ALABA SPECIAL
Wereda ALABA SPECIAL
Capacity: Recovery from Losses from Disasters - Percentage of Households who
have managed to recover from losses of disasters
Percentage of households who have managed to recover from losses of disasters
Comments
48.67 %
270
Page 1 of 1
Data_Collected_Date
Region S.N.N.P
December 2011
Zone
ALABA SPECIAL
Wednesday, September 3, 2014
Wereda ALABA SPECIAL
Selected Indicator
Type of Disaster
Capacity: Recovery from Losses from Disasters - Percentage of households
recovered from past disasters by type of Disasters
Recovered Percentage
Droughts
Floods
Landslides
Crop diseases
Livestock diseases
Human diseases
Storms / Cyclone/hail storm
Heavy Rain
Heat waves/ High temp
Conflicts
Earthquake
35.24
27.62
1.19
5.24
5.48
5.48
18.33
0.71
0.24
0.24
0.24
271
Page 1 of 1
Data_Collected_Date
December 2011
Wednesday, September 3, 2014
Region S.N.N.P
Zone ALABA SPECIAL
Wereda ALABA SPECIAL
Selected Indictor:
Capacity: Recovery from Losses from Disasters - Proportion of households
recovered by type of Losses
Type of Loss
Physical damages on houses and property
Percentage
9.05
Crop damage
54.29
Livestock damage
19.76
Death of household members
1.43
Illness/health problems
2.86
Loss of income
5.48
Loss of savings
2.14
Lost access to grazing land
0.71
Lost access to water source
2.14
Had to flee/change residence area
2.14
272
Page 1 of 1
Data_Collected_Date
Region S.N.N.P
December 2011
Zone ALABA SPECIAL
Wednesday, September 3, 2014
Wereda ALABA SPECIAL
Selected Indicator
Capacity: Coping Options if More Resources Available - What coping strategy
could be adopted if more resource were available?
Coping Strategy To Be Adopted
Percentage_Response
Adaptation of economic activities to hazards season (e.g. cropping cycle,
short term crops)
65.19
Storage of food and other necessities
33.70
Physical protection of buildings and property
1.10
Top 10 Copng Strategies to be adopted if more resources were available
70
65
60
50
40
34
30
20
10
0
Adaptation of economic activities to hazards season (e.g. cropping cycle, short term crops)
Adaptation of economic
activities to hazards
season (e.g. cropping
cycle, short term crops)
Storage of food and other necessities
Storage of food and
other necessities
Physical protection of
buildings and property
1
Physical protection of buildings and property
273
Page 1 of 1
Data_Collected_Date
December 2011
Wednesday, September 3, 2014
Region S.N.N.P
Zone ALABA SPECIAL
Wereda ALABA SPECIAL
Selected Indictor:
Capacity: Coping Strategies Adopted by Households - Percentage of households by
major type of coping strategies adopted (at least once)
Coping Strategy Adopted
Main Strategy
Secondary Strategy
Collection of wild food
0.72
0.95
Sell more livestock than usual
11.08
3.81
Rely on less preferred and less expensive food
8.19
14.92
Seek alternative or additional jobs
13.49
29.05
Limit portion size at meals
0.96
5.08
Consumption rather than sale of crop surplus
22.89
14.92
Short-term / seasonal labor migration
0.96
1.90
Borrowing of food or cash (including purchasing food on credit)
0.24
0.32
Reduced expenditure on non-essential items (beer, cigarettes,
etc)
Increased working hours
21.69
14.94
11.11
15.72
Sending children of household for work
2.89
1.90
Long-term / permanent migration (including distress migration)
0.48
0.00
Sale of non-productive assets (jewellery, clothing, etc.)
0.48
0.00
Sale of productive assets (land, farm implements, vehicle, etc)
0.96
0.00
274
Page 1 of 1
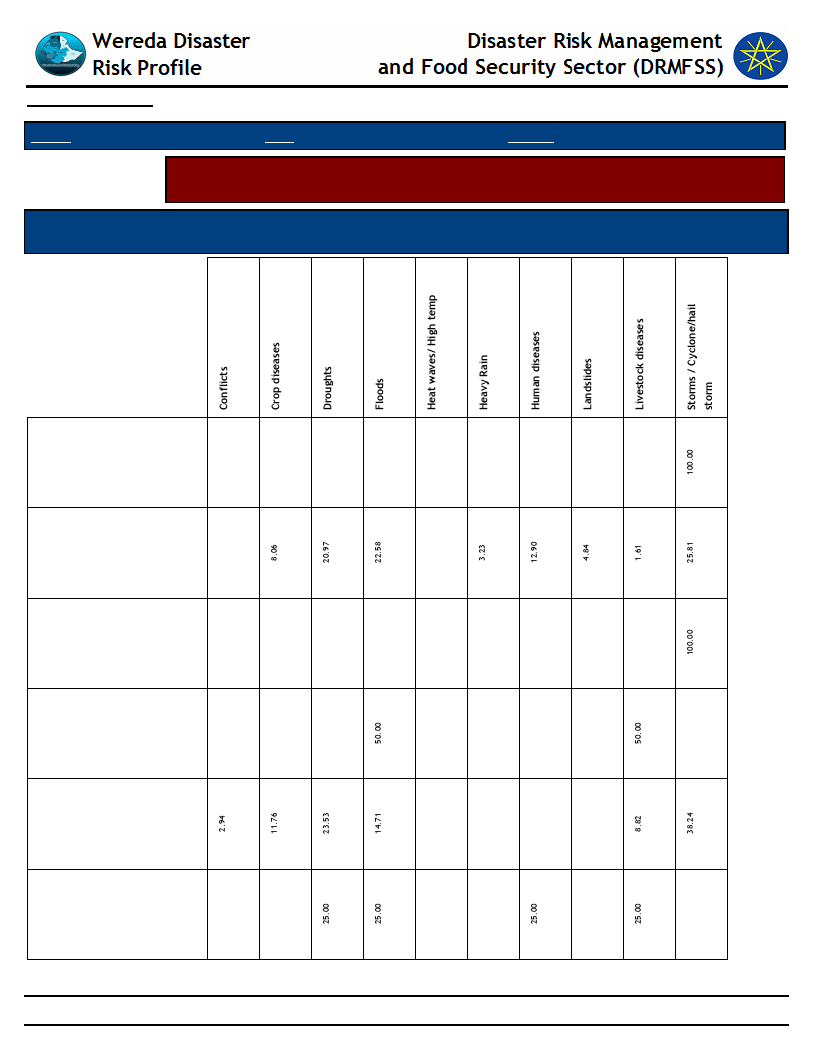
Data_Collected_Date
December 2011
Wednesday, September 3, 2014
Region S.N.N.P
Zone ALABA SPECIAL
Wereda ALABA SPECIAL
Selected Indicator
Capacity: Coping Strategies Adopted by Households - Main coping strategies
adopted by households for respective disasters
Coping Strtegies Adopted
Types of disaters for which HHs in the community adopt the listed
Coping Strtegies
Collection of wild food
Increased working hours
Limit portion size at meals
Long-term / permanent
migration (including
distress migration)
Rely on less preferred and
less expensive food
Sale of productive assets
(land, farm implements,
vehicle, etc)
275
Page 1 of 2
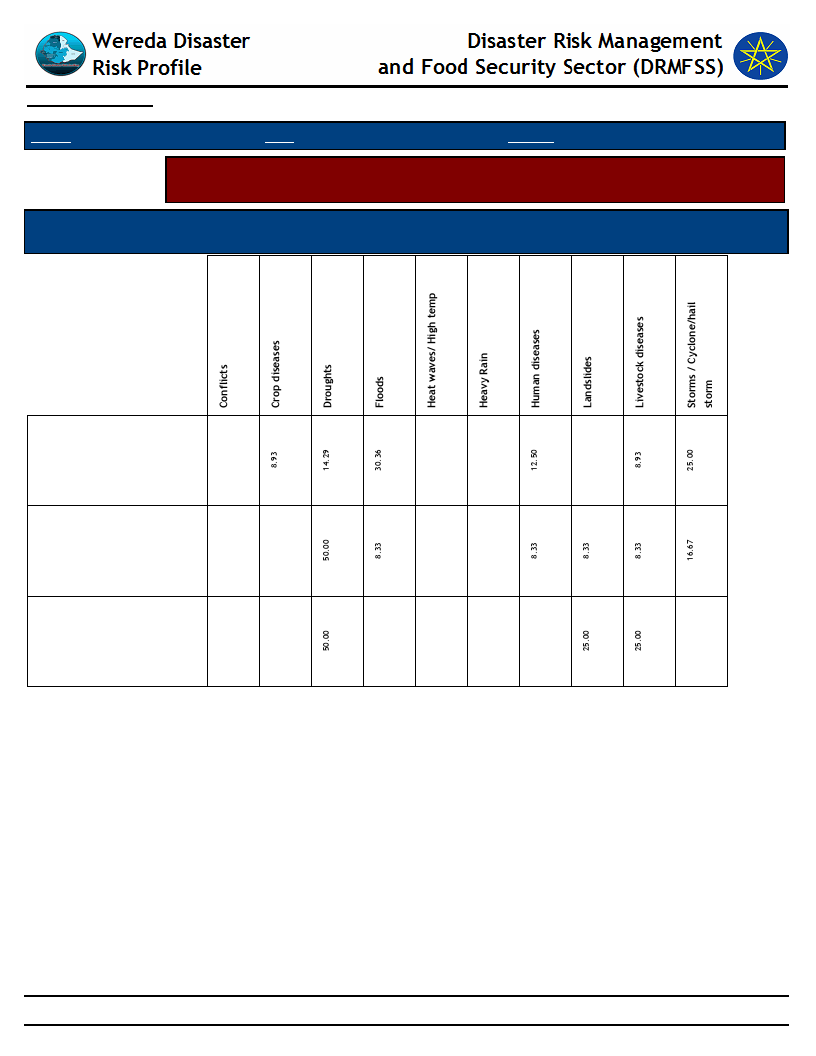
Data_Collected_Date
December 2011
Wednesday, September 3, 2014
Region S.N.N.P
Zone ALABA SPECIAL
Wereda ALABA SPECIAL
Selected Indicator
Capacity: Coping Strategies Adopted by Households - Main coping strategies
adopted by households for respective disasters
Coping Strtegies Adopted
Types of disaters for which HHs in the community adopt the listed
Coping Strtegies
Seek alternative or
additional jobs
Sending children of
household for work
Short-term / seasonal
labor migration
276
Page 2 of 2
Wereda Disaster
Risk Profile
Data_Collected_Date
December 2011
Disaster Risk Management and Food
Security Sector (DRMFSS)
Wednesday, September 3, 2014
Region S.N.N.P
Zone
ALABA SPECIAL
Wereda ALABA SPECIAL
Selected Indicator
Capacity: Coping Strategies Adopted by Households - Secondary coping strategies adopted by households for
respective disasters
Borrowing of food or cash (including purchasing
food on credit)
Collection of wild food
Consumption rather than sale of crop surplus
Increased working hours
Limit portion size at meals
33.33
4.26
34.04
2.04
4.08
40.82
56.25
66.67
31.91
36.73
100.00
2.13
6.38
4.26
2.04
2.04
4.08
6.25
277
Page 1 of 3

17.02
8.16
278

Wereda Disaster
Risk Profile
Data_Collected_Date
December 2011
Disaster Risk Management and Food
Security Sector (DRMFSS)
Wednesday, September 3, 2014
Region S.N.N.P
Zone
ALABA SPECIAL
Wereda ALABA SPECIAL
Selected Indicator
Capacity: Coping Strategies Adopted by Households - Secondary coping strategies adopted by households for
respective disasters
Reduced expenditure on non-essential items
(beer, cigarettes, etc)
Rely on less preferred and less expensive food
Seek alternative or additional jobs
Sell more livestock than usual
Sending children of household for work
Short-term / seasonal labor migration
2.86
31.43
34.29
4.26
42.55
2.13
29.79
5.49
40.66
31.87
3.30
41.67
16.67
8.33
66.67
16.67
16.67
16.67
50.00
33.33
279
5.71
2.13
2.20
25.00
Page 2 of 3

25.71
37.50
16.48
8.33
280
Wereda Disaster
Risk Profile
Data_Collected_Date
December 2011
Disaster Risk Management and Food
Security Sector (DRMFSS)
Wednesday, September 3, 2014
Region S.N.N.P
Zone
ALABA SPECIAL
Wereda ALABA SPECIAL
Selected Indicator
Capacity: Coping Strategies Adopted by Households - Secondary coping strategies adopted by households for
respective disasters
Skip entire day without eating
100.00
281
Page 3 of 3

282

Wereda Disaster
Risk Profile
Disaster Risk Management and
Food Security Sector (DRMFSS)
Data_Collected_Date
Region S.N.N.P
December 2011
Zone ALABA SPECIAL
Wereda
Wednesday, September 3, 2014
ALABA SPECIAL
Selected Indicator
Capacity: Coping Strategies Adopted by Households - Main coping strategies adopted by households to recover
from respective losses
Type of Coping Strategy Adopted
Type of Loss
Borrowing of food or cash
(including purchasing food on
credit)
Collection of wild food
Consumption rather than sale
of crop surplus
Increased working hours
283
Page 1 of 3
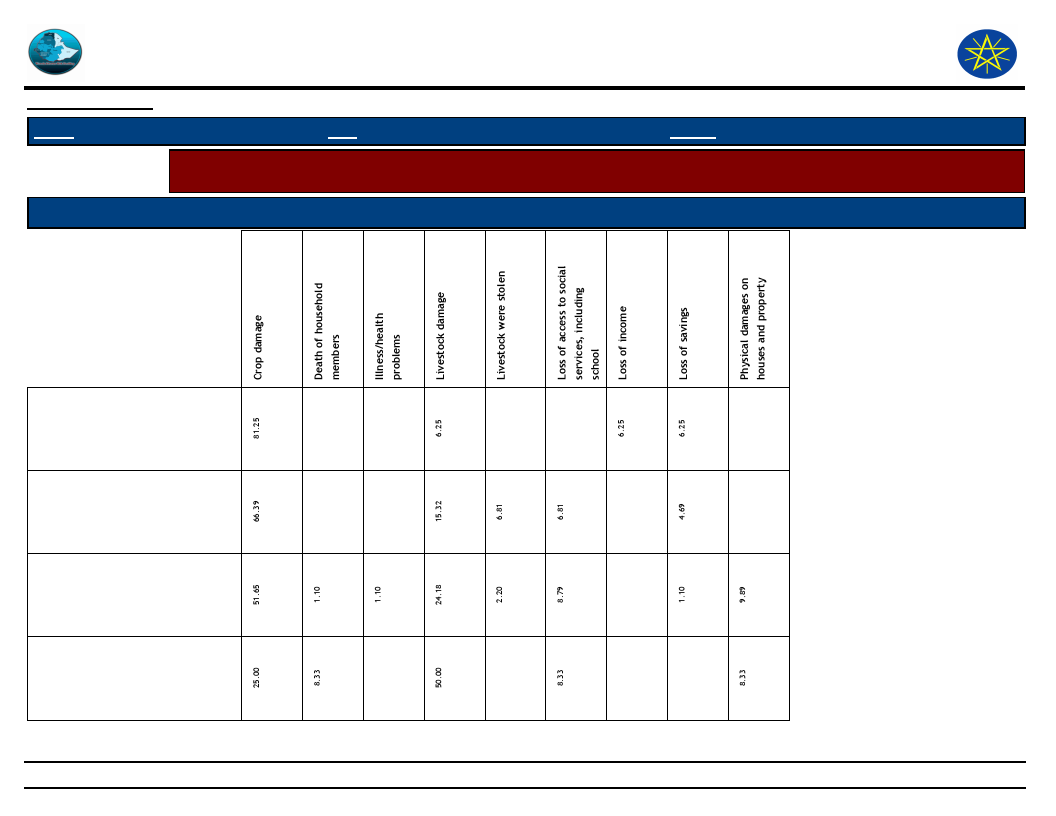
Wereda Disaster
Risk Profile
Disaster Risk Management and
Food Security Sector (DRMFSS)
Data_Collected_Date
Region S.N.N.P
December 2011
Zone ALABA SPECIAL
Wereda
Wednesday, September 3, 2014
ALABA SPECIAL
Selected Indicator
Capacity: Coping Strategies Adopted by Households - Main coping strategies adopted by households to recover
from respective losses
Type of Coping Strategy Adopted
Type of Loss
Limit portion size at meals
Rely on less preferred and less
expensive food
Seek alternative or additional
jobs
Sell more livestock than usual
284
Page 2 of 3
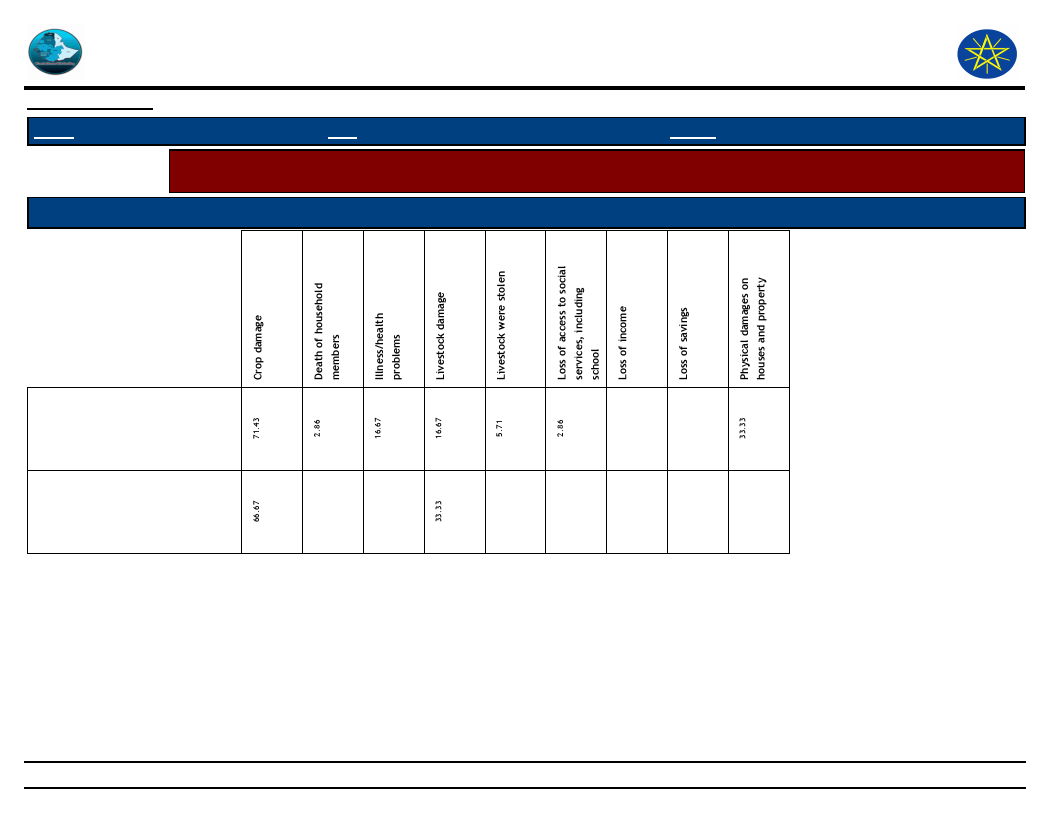
Wereda Disaster
Risk Profile
Disaster Risk Management and
Food Security Sector (DRMFSS)
Data_Collected_Date
Region S.N.N.P
December 2011
Zone ALABA SPECIAL
Wereda
Wednesday, September 3, 2014
ALABA SPECIAL
Selected Indicator
Capacity: Coping Strategies Adopted by Households - Main coping strategies adopted by households to recover
from respective losses
Type of Coping Strategy Adopted
Type of Loss
Sending children of household
for work
Short-term / seasonal labor
migration
285
Page 3 of 3
Data_Collected_Date
December 2011
Wednesday, September 3, 2014
Region S.N.N.P
Selected Indicator
Zone ALABA SPECIAL
Wereda ALABA SPECIAL
Capacity: Coping Strategies Adopted by Households - Percentage of households by
frequency of main coping strategies adopted
Type of Coping Strategy Adopted
Frequency of Adoption
Borrowing of food or cash (including purchasing
food on credit)
Collection of wild food
Consumption rather than sale of crop surplus
Increased working hours
Limit portion size at meals
Long-term / permanent migration (including
distress migration)
Reduced expenditure on non-essential items
(beer, cigarettes, etc)
Sale of non-productive assets (jewellery, clothing,
etc.)
Sale of productive assets (land, farm implements,
vehicle, etc)
Seek alternative or additional jobs
Sell more livestock than usual
Sending children of household for work
100.00
100.00
4.49
3.37
25.84
40.45
25.84
5.26
21.05
28.07
45.61
100.00
50.00
50.00
7.50
7.50
21.25
42.50
21.25
100.00
100.00
26.79
28.57
60.61
30.36
6.06
2.22
4.44
82.22
11.11
20.00
50.00
20.00
10.00
286
Page 1 of 2
Data_Collected_Date
December 2011
Wednesday, September 3, 2014
Region S.N.N.P
Selected Indicator
Zone ALABA SPECIAL
Wereda ALABA SPECIAL
Capacity: Coping Strategies Adopted by Households - Percentage of households by
frequency of main coping strategies adopted
Type of Coping Strategy Adopted
Frequency of Adoption
Short-term / seasonal labor migration
25.00
50.00
25.00
287
Page 2 of 2
Wereda Disaster
Risk Profile
Data_Collected_Date
December 2011
Disaster Risk Management and Food
Security Sector (DRMFSS)
Wednesday, September 3, 2014
Region S.N.N.P
Selected Indicator
Zone ALABA SPECIAL
Wereda ALABA SPECIAL
Capacity: Alternative Livelihood Sources - Alternative livelihood sources suggested by the community
Kebele Name
Work_Option_1
Comment_1
Work_Option_2
Comment_2
Work_Option_3
Comment_3
CHEMBULA
BUKET BAME
HOLUGEB KUKE
ANDEGNA KONCHA
LAYEGNAWO
LENDA
NEGELE WEDESH
Migration to
Kulito Town in
search of Daily
Labour
Migration to
Nearby town in
search of daily
work
Migration to Town
in search of daily
work
Migration to
Bordering Or
Omiya Kebeles
Petty Trading
Firewood selling
The Only possible
option is it
Because it is the only
option in this area
It is the only Option
in this Area
They May Get Daily
Labour
It is Performed in
some Householders
Using Nearby Kulito
Market
The existence of
Natural forest
Petty Trading
It is Performed in some
Households Using
Nearby Mito Market
288
Page 1 of 3

Wereda Disaster
Risk Profile
Data_Collected_Date
December 2011
Disaster Risk Management and Food
Security Sector (DRMFSS)
Wednesday, September 3, 2014
Region S.N.N.P
Selected Indicator
Zone ALABA SPECIAL
Wereda ALABA SPECIAL
Capacity: Alternative Livelihood Sources - Alternative livelihood sources suggested by the community
Kebele Name
Work_Option_1
Comment_1
Work_Option_2
Comment_2
Work_Option_3
Comment_3
AYMELE
ANDEGNA TUKA
ANDEGNA TUKA
ASHEKORA BOTI
YAMBI
AMATA
Petty Trading
Firewood selling
It is Performed in
some Households
Using Nearby Kulito
Market
Natural Forest exist in
this Kebele
Petty Trading
Firewood selling
Firewood selling
The existence of
nearby Basheno
market buying and
Selling to Kulito
Market
Natural Forest exist in
this Kebele
Petty Trading
Petty Trading
Petty Trading
Petty Trading
It is a small scale
effort done only by
few Households
It is Performed in
some Households
Using Nearby Kulito
Market
It is performed in some
Households Using nearby
Mito Market
It is performed in some
Households using nearby
Kulito Market
It is performed in some
Households Using nearby
Mito Market
289
Page 2 of 3

Wereda Disaster
Risk Profile
Data_Collected_Date
December 2011
Disaster Risk Management and Food
Security Sector (DRMFSS)
Wednesday, September 3, 2014
Region S.N.N.P
Selected Indicator
Zone ALABA SPECIAL
Wereda ALABA SPECIAL
Capacity: Alternative Livelihood Sources - Alternative livelihood sources suggested by the community
Kebele Name
Work_Option_1
Comment_1
Work_Option_2
Comment_2
Work_Option_3
Comment_3
TETALI BITORA
Firewood selling
The Existence of
Natural forest
290
Page 3 of 3
WDRP Indicators
Community
Perceptions and Suggestions
291
Data_Collected_Date
December 2011
Wednesday, September 3, 2014
Region S.N.N.P
Selected Indictor:
KebeleName
Zone ALABA SPECIAL
Wereda ALABA SPECIAL
Agricultural Situation: Access to Extension - Perception of the community on
Access to Agricultural extension Services
Current_Level
Change_In_Last_Decade
Comments
MESERAK
GORTANCHO
KOBO GETO
TEFO CHUFO
METO DUBALE
HABIBO FURANA
SINBITA
CHEMBULA
WEJEGO YATO
ANDEGNA TEFO
SORGE DARGOSA
BUKET BAME
HOLUGEB KUKE
WETETA
ANDEGNA
KONCHA
KULFO
Good Access
Good Access
Good Access
Good Access
Good Access
Good Access
Good Access
Good Access
Good Access
Good Access
Good Access
Good Access
Good Access
Good Access
Good Access
Improving
Improving
Improving
Improving
Improving
Improving
Improving
Improving
Improving
Increasing
Improving
Good access
Improving
Improving
Improving
3 Development Agent or
Peasant Association
3 Development Agent or
Peasant Association
3 Development Agent or
Peasant Association
3 Development Agent or
Peasant Association
3 Development Agent or
Peasant Association
3 Development Agent or
Peasant Association
3 Development Agent or
Peasant Association
3 Development Agent or
Peasant Association
3 Development Agent or
Peasant Association
3 Development Agent or
Peasant Association
3 Development Agent or
Peasant Association
3 Development Agent or
Peasant Association
3 Development Agent or
Peasant Association
3 Development Agent or
Peasant Association
292
Page 1 of 3

Data_Collected_Date
December 2011
Wednesday, September 3, 2014
Region S.N.N.P
Selected Indictor:
KebeleName
LAYEGNAWO
LENDA
TACHEGNAWO
BEDANE
HULETEGNA
MEKALA
HULETEGNA
TUKA
NEGELE WEDESH
HANTEZO
AYMELE
ANDEGNA TUKA
MEJA
ASHEKORA BOTI
Zone ALABA SPECIAL
Wereda ALABA SPECIAL
Agricultural Situation: Access to Extension - Perception of the community on
Access to Agricultural extension Services
Current_Level
Change_In_Last_Decade
Comments
Good Access
Improving
Farmer Training Centre
Establishment and 3 to 4
Development Agent or
Peasant Association
Good Access
Good
3 Development Agent or
Peasant Association
Good Access
Improving
Farmer Training Centre
Establishment and 2 to 3
Development Agent or
Peasant Association
Good Access
Improving
Farmer Training Centre
Establishment and 3 to 4
Development Agent or
Peasant Association
Good Access
Improving
3 to 4 Development Agent
or Peasant Association
Good Access
Improving
2 to 3 Development Agent
or Peasant Association
Good Access
Improving
Farmer Training Centre
Establishment and 3 to 4
Development Agent or
Peasant Association
Good Access
Improving
Farmer Training Centre
Establishment and 3 to 4
Development Agent or
Peasant Association
Good Access
Improving
Farmer Training Centre
Establishment and 2 to 3
Development Agent or
Peasant Association
Good Access
Improving
3 to 4 Development Agent
or Peasant Association
293
Page 2 of 3

Data_Collected_Date
December 2011
Wednesday, September 3, 2014
Region S.N.N.P
Selected Indictor:
KebeleName
YAMBI
AMATA
TETALI BITORA
GERME
BUBESA
Zone ALABA SPECIAL
Wereda ALABA SPECIAL
Agricultural Situation: Access to Extension - Perception of the community on
Access to Agricultural extension Services
Current_Level
Change_In_Last_Decade
Comments
Good Access
Good
Farmer Training Centre
Establishment and 2 to 3
Development Agent or
Peasant Association
Good Access
Improving
Farmer Training Centre
Establishment and 2 to 3
Development Agent or
Peasant Association
Good Access
Improving
Farmer Training Centre
Establishment and 3 to 4
Development Agent or
Peasant Association
Good Access
Improving
Farmer Training Centre
Establishment and 2 to 3
Development Agent or
Peasant Association
Good Access
Improving
Farmer Training Centre
Establishment and 3 to 4
Development Agent or
Peasant Association
294
Page 3 of 3
Data_Collected_Date
December 2011
Wednesday, September 3, 2014
Region S.N.N.P
Selected Indictor:
KebeleName
MESERAK
GORTANCHO
KOBO GETO
TEFO CHUFO
METO DUBALE
HABIBO FURANA
SINBITA
CHEMBULA
WEJEGO YATO
ANDEGNA TEFO
SORGE DARGOSA
BUKET BAME
HOLUGEB KUKE
WETETA
ANDEGNA
KONCHA
KULFO
LAYEGNAWO
LENDA
TACHEGNAWO
BEDANE
HULETEGNA
MEKALA
HULETEGNA
TUKA
NEGELE WEDESH
HANTEZO
AYMELE
ANDEGNA TUKA
Zone ALABA SPECIAL
Wereda ALABA SPECIAL
Agricultural Situation: Access to Inputs - Perception of the community on access
to improved agricultural inputs
Current_Level
Change_In_Last_Decade
Comments
Good Access
Improved
Unions Supply
Good Access
Good Access
Good Access
Moderate
Moderate
Good Access
Good Access
Good Access
Poor Access due to Road
Good Access
Good Access
Improved access
Good Access
Improved
Improved
Improved
Improved
Increasing
Improved
Improved
Improved
Decreasing
Improved
Improved
Improved
Improved
Unions Supply
Unions Supply
Unions Supply
Unions Supply
Unions Formed
Unions Supply
Union Supply
Unions
Union Formed
Union Formation
Unions
Improved access
Improved access
Increasing
Improved
Unions
Union Formation
Good Access
Good
Union Formation
Improved access
Improved
Union Formation
Improved access
Improved
Union Formation
Improved access
Improved access
Improved access
Improved access
Improved
Improved
Improved
Improved
Union Formation
Union Establishment
Union Formation
Union Formation
295
Page 1 of 2
Data_Collected_Date
December 2011
Wednesday, September 3, 2014
Region S.N.N.P
Selected Indictor:
KebeleName
MEJA
ASHEKORA BOTI
YAMBI
AMATA
TETALI BITORA
GERME
BUBESA
Zone ALABA SPECIAL
Wereda ALABA SPECIAL
Agricultural Situation: Access to Inputs - Perception of the community on access
to improved agricultural inputs
Current_Level
Change_In_Last_Decade
Comments
Improved access
Improved access
Good Access
Good Access
Improved access
Good Access
Improved access
Improved
Improved
Good
Improved
Improved
Good Improved
Improved
Union Formation
Union Formation
Union Information
Union Information
Union Formation
Union Information
Union Formation
296
Page 2 of 2

Data_Collected_Date
December 2011
Wednesday, September 3, 2014
Region S.N.N.P
Zone ALABA SPECIAL
Wereda ALABA SPECIAL
Selected Indictor:
KebeleName
Agricultural Situation: Water for irrigation - Access to water for irrigation in the
community
Current_Level
Change_In_Last_Decade
Comments
HABIBO FURANA
Moderate
CHEMBULA
ANDEGNA TEFO
BUKET BAME
HOLUGEB KUKE
ANDEGNA KONCHA
LAYEGNAWO LENDA
TACHEGNAWO
BEDANE
HULETEGNA TUKA
NEGELE WEDESH
HANTEZO
AYMELE
ASHEKORA BOTI
YAMBI
TETALI BITORA
Moderate
No
No Available
No
No
42 Households have access
to irrigation
No
No
No
No
No
Increase
Moderate
No
Decreasing
No
No
Reducing
No
No
No
No
No
No
If irrigation Scheme scaled up,
Many farmers can benefit from it
Bilate River can be Used
297
Page 1 of 1
Data_Collected_Date
December 2011
Wednesday, September 3, 2014
Region S.N.N.P
Zone ALABA SPECIAL
Wereda ALABA SPECIAL
Selected Indictor:
Agricultural Situation: Water Availability for Livestock - Water availability for
livestock in the community
KebeleName
Current_Level
Change_In_Last_Decade
Comments
MESERAK
GORTANCHO
KOBO GETO
Moderate
Low
No change
Decreasing
TEFO CHUFO
Low
Decreasing
No supply
METO DUBALE
Good
Decreasing
Shortage
HABIBO FURANA
Moderate
SINBITA
Moderate
Increase
Decreasing
If irrigation Scheme scaled
up, Many farmers can
benefit from it
CHEMBULA
Moderate
Moderate
Bilate River can be Used
WEJEGO YATO
Moderate
Moderate
Dijo River
ANDEGNA TEFO
Moderate
Increase
Borehole water constructed
SORGE DARGOSA
Animal Use Bilate River
Increasing Shortage
BUKET BAME
Good
Decreasing
Shortage
HOLUGEB KUKE
WETETA
Good or River
Poor access
Increase
Nearby River is used for
Animals
ANDEGNA KONCHA
Very low
Deteriorating
KULFO
Low
Decreasing
LAYEGNAWO
LENDA
TACHEGNAWO
BEDANE
HULETEGNA
MEKALA
HULETEGNA TUKA
Poor access
Good access
Poor access
Poor access
Deteriorating
Good Access
Deteriorating
Deteriorating
Shortage
Have river
Erratic rainfall and Long
Dry seasons
Erratic rainfall and Long
Dry seasons
298
Page 1 of 2
Data_Collected_Date
December 2011
Wednesday, September 3, 2014
Region S.N.N.P
Zone ALABA SPECIAL
Wereda ALABA SPECIAL
Selected Indictor:
Agricultural Situation: Water Availability for Livestock - Water availability for
livestock in the community
KebeleName
Current_Level
Change_In_Last_Decade
Comments
NEGELE WEDESH
Poor access
Deteriorating
Shortage
HANTEZO
AYMELE
Poor
Deteriorating
Shortage
ANDEGNA TUKA
Poor
Deteriorating
Shortage
MEJA
Poor
Deteriorating
Erratic rainfall
ASHEKORA BOTI
Poor
Deteriorating
Shortage
YAMBI
No
Shortage
AMATA
TETALI BITORA
GERME
Poor
Poor
Deteriorating
Deteriorating
Erratic rainfall and Long
Dry seasons
Shortage
BUBESA
Poor
Deteriorating
Shortage
299
Page 2 of 2
Data_Collected_Date
December 2011
Wednesday, September 3, 2014
Region S.N.N.P
Selected Indictor:
Kebele Name
Zone ALABA SPECIAL
Wereda ALABA SPECIAL
Agricultural Situation: Soil Fertility - Perception of the community on soil fertility
and its change over time
Current_Level
Change_In_Last_Decade
Comments
MESERAK
GORTANCHO
KOBO GETO
TEFO CHUFO
METO DUBALE
HABIBO FURANA
Low
Low
Low
Moderate
Low
Deteriorating
Decreasing
Deteriorating
Decreasing
Decreasing
Erosion
Erosion or Degradation
High erosion and
Degradation
Erosion or Flooding
High erosion
SINBITA
CHEMBULA
WEJEGO YATO
ANDEGNA TEFO
SORGE DARGOSA
BUKET BAME
HOLUGEB KUKE
Low
Low
Low
Low
Poor Soil
Moderate
Low
Decreasing
Decreasing
Deteriorating
Decreasing
Increasing Erosion
Decreasing
Decreasing
Flooding
High Erosion
Erosion and Degradation
Erosion
Erosion
Flood and Erosion
Flood and Erosion
WETETA
ANDEGNA
KONCHA
KULFO
LAYEGNAWO
LENDA
TACHEGNAWO
BEDANE
HULETEGNA
MEKALA
HULETEGNA
TUKA
Poor quality
Low
Low
Low
poor
Low
Low
Decreasing fertility
Decreasing
Decreasing
Reducing
Increasing poor quality
Decreasing
Decreasing
Erosion
Erosion
Soil Degradation
Soil Degradation
Soil Degradation
Soil Degradation
300
Page 1 of 2

Data_Collected_Date
December 2011
Wednesday, September 3, 2014
Region S.N.N.P
Selected Indictor:
Kebele Name
Zone ALABA SPECIAL
Wereda ALABA SPECIAL
Agricultural Situation: Soil Fertility - Perception of the community on soil fertility
and its change over time
Current_Level
Change_In_Last_Decade
Comments
NEGELE WEDESH
Low
Reducing
Flood and Erosion
HANTEZO
AYMELE
ANDEGNA TUKA
MEJA
ASHEKORA BOTI
YAMBI
AMATA
Low
Low
Low
Loss
Reducing
Poor quality
Slightly Medium
Reducing
Reducing
Reducing
Decreasing
Decreasing
Decreasing
Decreasing
Soil Degradation
Flood and Erosion
Soil Degradation
Soil Degradation
Flood and Erosion
Soil Degradation
Soil Degradation
TETALI BITORA
GERME
BUBESA
Low
Medium
Low
Decreasing
Decreasing
Reducing
Flood and Erosion
Soil Degradation
Soil Degradation
301
Page 2 of 2
Data_Collected_Date
December 2011
Wednesday, September 3, 2014
Region S.N.N.P
Selected Indictor:
Zone ALABA SPECIAL
Wereda ALABA SPECIAL
Economic Vulnerability: Change in Agricultural Situation - Households perception
on changes of crop type, size of cultivated area and crop yields
Proportion of households reporting change in crops grown
----
38.22
%
1st
2nd
3rd
0.00
0.00
0.00
Adequate fertilizer
48.80
35.43
2.11
Adequate rainfall
12.00
7.09
45.26
Insufficient fertilizer
0.00
6.30
1.05
Less rainfall
4.00
0.79
0.00
More drought resistant crop
0.00
1.57
6.32
More pest resistant crop
8.80
8.66
26.32
More yielding crop
26.40
40.16
18.95
Proportion of households reporting change in size of area cultivated
22.74 %
Addition of area
1st
2nd
3rd
18.18
2.86
33.33
Adequate fertilizer
31.17
51.43
0.00
Adequate rainfall
12.99
15.71
30.56
insufficient fertilizer
0.00
7.14
8.33
Insufficient rainfall
6.49
0.00
0.00
Loss of area
3.90
0.00
0.00
more yielding crop
25.97
22.86
27.78
Water logging
1.30
0.00
0.00
302
Page 1 of 2
Data_Collected_Date
December 2011
Wednesday, September 3, 2014
Region S.N.N.P
Selected Indictor:
Zone ALABA SPECIAL
Wereda ALABA SPECIAL
Economic Vulnerability: Change in Agricultural Situation - Households perception
on changes of crop type, size of cultivated area and crop yields
Proportion of households reporting change in crop yield
96.16
%
1st
2nd
3rd
----
0.00
0.00
0.00
Adequate fertilizer
40.58
49.55
0.00
Adequate rainfall
21.16
2.39
33.66
Better yielding crop
20.00
29.85
29.77
Improved variety of seeds
13.91
14.93
30.42
Insufficient fertilizer
0.58
2.39
0.65
Insufficient irrigation available
0.29
0.30
0.32
Insufficient rainfall
3.48
0.60
5.18
303
Page 2 of 2
Data_Collected_Date
December 2011
Wednesday, September 3, 2014
Region S.N.N.P
Selected Indicator
Zone ALABA SPECIAL
Wereda ALABA SPECIAL
Environmental Situation: General Land Quality - Perceptions of the community
on changes in the general quality of land over a decade
KebeleName
Current_Situation
Change_Last_Decade
Comment
MESERAK
Low
GORTANCHO
KOBO GETO
Low
Deteriorating
Deteriorating
Erosion
Erosion or Degradation
TEFO CHUFO
Low
METO DUBALE
Low
Deteriorating
Deteriorating
High erosion and
Degradation
Erosion or Flooding
HABIBO FURANA
Low
Decreasing
High erosion
SINBITA
Poor Quality
Decreasing quality
CHEMBULA
Low
Deteriorating
High Erosion
WEJEGO YATO
Low
Deteriorating
Erosion and Degradation
ANDEGNA TEFO
Low
Deteriorating
Erosion and Degradation
SORGE DARGOSA
Poor Soil Quality
Increasing Degradation
Erosion
BUKET BAME
Low
Deteriorating
Erosion and Degradation
HOLUGEB KUKE
WETETA
Low
Poor quality
Deteriorating
Become more poor
Erosion and Degradation
of soil
ANDEGNA
KONCHA
KULFO
Low
Poor
Deteriorating
Decreasing
Degradation
Erosion
LAYEGNAWO
LENDA
TACHEGNAWO
BEDANE
HULETEGNA
MEKALA
HULETEGNA
TUKA
Slightly Medium
Poor quality
Less quality
Low quality
Reducing
Increasing Poor Quality
Reducing
Reducing
304
Land Degradation
Land Degradation
Land Degradation
Land Degradation
Page 1 of 2
Data_Collected_Date
December 2011
Wednesday, September 3, 2014
Region S.N.N.P
Selected Indicator
Zone ALABA SPECIAL
Wereda ALABA SPECIAL
Environmental Situation: General Land Quality - Perceptions of the community
on changes in the general quality of land over a decade
KebeleName
Current_Situation
Change_Last_Decade
Comment
NEGELE WEDESH
Poor
Reducing
Soil degradation
HANTEZO
Slightly Medium
Reducing
Land Degradation
AYMELE
Medium or Slightly
Reducing
Soil Degradation
ANDEGNA TUKA
Slightly Medium
Reducing
Land Degradation
MEJA
Low quality
Reducing
Land Degradation
ASHEKORA BOTI
Reducing
YAMBI
Medium Quality
Low Quality
Decreasing
Erosion and Soil
Degradation
Land Degradation
AMATA
Poor
Decreasing
Land Degradation
TETALI BITORA
Low quality
Reducing
Soil degradation
GERME
Low quality
Decreasing
Land Degradation
BUBESA
Slightly Medium
Reducing
Land Degradation
305
Page 2 of 2
Data_Collected_Date
December 2011
Wednesday, September 3, 2014
Region S.N.N.P
Selected Indicator
KebeleName
Zone ALABA SPECIAL
Wereda ALABA SPECIAL
Environmental Situation: Changes in Landscape - Changes observed by the
community on landscape and the problems due to the changes
Changes_Observed
Problems_Due_To_Changes
MESERAK GORTANCHO
Erosion and Degradation
Drought, Crop failure and Poor livestock yield
KOBO GETO
TEFO CHUFO
METO DUBALE
HABIBO FURANA
SINBITA
Land Degradation and
Deforestation
Soil degradation, Erosion,
Deforestation and Large
Gullies
Deforestation and
Degradation
Soil Degradation and Large
Gully Formation
Deforestation
Drought, Erosion, Poor Harvest and Poor Animal
Pasture
Drought, Low Production, Poor accessibility and
Disease
Drought and Flooding
Low Production and Drought
Flooding, Drought and snow
CHEMBULA
WEJEGO YATO
ANDEGNA TEFO
SORGE DARGOSA
BUKET BAME
HOLUGEB KUKE
WETETA
ANDEGNA KONCHA
KULFO
Erosion and soil
Degradation
Deforestation and
Degradation
Land Degradation, Forest
removal and Deforestation
Soil Degradation and Gully
Formation
Forest removal and land
Degradation
Soil Degradation,
deforestation and Erosion
Increase Bare land and
Deforestation
Land degradation and
Forest Removal
Soil degradation
Drought, Low Yield and Food Shortage
Drought, Flooding and Soil loss
Drought, Erosion, Low yield and Wood Shortage
Poor Harvest and Drought
Drought and Flooding
Drought and Crop Failure
Drought and Poverty
Erosion and Drought
Low Production and Drought
306
Page 1 of 2

Data_Collected_Date
December 2011
Wednesday, September 3, 2014
Region S.N.N.P
Selected Indicator
KebeleName
Zone ALABA SPECIAL
Wereda ALABA SPECIAL
Environmental Situation: Changes in Landscape - Changes observed by the
community on landscape and the problems due to the changes
Changes_Observed
Problems_Due_To_Changes
LAYEGNAWO LENDA
TACHEGNAWO BEDANE
HULETEGNA MEKALA
Land degradation
Land Degradation
Land Degradation
Drought, Flooding and Gully Expansion on farm
land
Drought, Blooding and Gully expansion on farm
land
Flooding and Gully expansion on farm land
HULETEGNA TUKA
NEGELE WEDESH
HANTEZO
AYMELE
ANDEGNA TUKA
MEJA
Forest Degradation and
Land Degradation
Natural forest Degradation
and land Degradation
Land Degradation and
Forest degradation
Land Degradation and
Forest degradation
Land Degradation and
Forest Degradation
Land Degradation
Drought, Flooding and Gully Expansion on farm
land
Drought, Flooding and Gully Expansion on farm
land
Drought, Flooding and Gully expansion on farm
Land
Drought, Flooding and Gully expansion on farm
Land
Drought, Flooding and Gully expansion on farm
Land
Flooding and Gully expansion on farm Land
ASHEKORA BOTI
YAMBI
Natural forest Removal
and land Degradation
Land Shortage
Drought and Flooding
Conflict
AMATA
Land Degradation
Flooding, Gully expansion on farm land
TETALI BITORA
GERME
Natural forest Degradation
and land Degradation
Land Degradation
Drought, Flooding and Gully Expansion on farm
land
Land shortage
BUBESA
Land Degradation
Drought, Flooding and Gully Expansion on farm
land
307
Page 2 of 2

Wereda Disaster
Risk Profile
Data_Collected_Date
December 2011
Disaster Risk Management and Food
Security Sector (DRMFSS)
Wednesday, September 3, 2014
Region S.N.N.P
Zone
ALABA SPECIAL
Wereda ALABA SPECIAL
Selected Indicator
Kebele Name
Interventions: Community Perception on Mediums to Influence DRM Actors - Community perception on the
effectiveness of institutional channels to use to influence DRM actors
Institution_1
Process_Description
Institution_2 Process_Description
Institution_3
Process_Description
MESERAK
GORTANCHO
KOBO GETO
TEFO CHUFO
By letter
Letter
By letter
METO DUBALE
HABIBO FURANA
Official Letter
By Delegation
SINBITA
Letter
At Conference
Time
By Delegation
By Delegation
Development
Agent
Official Letter
Delegation
By
Development
Agents
Development
Agent
Using
Development
Agents
Delegation
Through
Development
Agent
At Conference
CHEMBULA
Official Letter
WEJEGO YATO
Delegation
Through
Development
Agent
Official Letter
By Delegation
Through
Development
Agent
308
Page 1 of 5

Wereda Disaster
Risk Profile
Data_Collected_Date
December 2011
Disaster Risk Management and Food
Security Sector (DRMFSS)
Wednesday, September 3, 2014
Region S.N.N.P
Zone
ALABA SPECIAL
Wereda ALABA SPECIAL
Selected Indicator
Interventions: Community Perception on Mediums to Influence DRM Actors - Community perception on the
effectiveness of institutional channels to use to influence DRM actors
Kebele Name
ANDEGNA TEFO
Institution_1
By Letter
Process_Description
Institution_2
Conference
Time
Process_Description
SORGE DARGOSA
By Official Letter
BUKET BAME
By letter
HOLUGEB KUKE
By Letter
Through
Development
Agent
At Conference
Time
discussion
At Conference
Time
WETETA
By Letter
By Delegation
ANDEGNA KONCHA
KULFO
Through
Development
Agent
Letter
Official Letter
Through
Development
Agent
Institution_3
Using
Development
Agents
At Conference
time
Process_Description
Through Our
Delegation
Using
Development
Agents
At Conference
time
By Delegation
Delegation
309
Page 2 of 5
Wereda Disaster
Risk Profile
Data_Collected_Date
December 2011
Disaster Risk Management and Food
Security Sector (DRMFSS)
Wednesday, September 3, 2014
Region S.N.N.P
Zone
ALABA SPECIAL
Wereda ALABA SPECIAL
Selected Indicator
Interventions: Community Perception on Mediums to Influence DRM Actors - Community perception on the
effectiveness of institutional channels to use to influence DRM actors
Kebele Name
LAYEGNAWO
LENDA
Institution_1
By Letter
TACHEGNAWO
BEDANE
At conference
Discussion
HULETEGNA
MEKALA
By Letter
HULETEGNA TUKA
Through
Representatives
NEGELE WEDESH
By letter
HANTEZO
At conference
Discussion
Process_Description
Official letter
attached to
committee verbal
will be Submitted
Oral or Verbal
Messages
Official letter
attached to
committee verbal
will be Submitted
Sending By
Development agent
Official letter
attached to
committee verbal
will be Submitted
Oral or Verbal
Messages
Institution_2 Process_Description
By
Representative
s
Sending by
Development Agents
Institution_3
At Conference
Discussion
Process_Description
Oral or Verbal Message
By letters
At conference
Discussion
Official letter
attached to
committee verbal will
be Submitted
Oral or Verbal
Message
Through
representatives
Sending By
Development Agents
By letters
Through
Representative
s
Official letter
attached to
committee verbal will
be Submitted
Sending by
Development Agents
At Conference
Discussion
Oral or Verbal Message
At Conference
Discussion
Oral or Verbal Message
By letters
Official letter
attached to
committee verbal will
be Submitted
By
representatives
Sending By
Development Agents
310
Page 3 of 5

Wereda Disaster
Risk Profile
Data_Collected_Date
December 2011
Disaster Risk Management and Food
Security Sector (DRMFSS)
Wednesday, September 3, 2014
Region S.N.N.P
Zone
ALABA SPECIAL
Wereda ALABA SPECIAL
Selected Indicator
Kebele Name
Interventions: Community Perception on Mediums to Influence DRM Actors - Community perception on the
effectiveness of institutional channels to use to influence DRM actors
Institution_1
Process_Description
Institution_2 Process_Description
Institution_3
Process_Description
AYMELE
By Letter
ANDEGNA TUKA
By Letter
MEJA
At conference
Discussion
ASHEKORA BOTI
By Letter
YAMBI
AMATA
At conference
Time
By Letter
Official letter
attached to
committee verbal
will be Submitted
Official letter
attached to
committee verbal
will be Submitted
Oral or Verbal
Messages
Official letter
attached to
committee verbal
will be Submitted
Official letter
attached to
committee verbal
will be Submitted
At conference
Discussion
Oral or Verbal
Message
By
Representative
s
Sending by
Development Agents
Through
representatives
At Conference
Discussion
Sending By
Development Agents,
Health extension and
Teachers
Oral or Verbal Message
By letters
At conference
Discussion
Official letter
attached to
committee verbal will
be Submitted
Oral or Verbal
Message
Through
representatives
Sending By
Development Agent
Through
Delegate
Sending By
Development Agent
Using
Development
Agent
Through
Representative
s
Sending by
Development Agents
By letters
At Conference
Discussion
Oral or Verbal Message
311
Page 4 of 5

Wereda Disaster
Risk Profile
Data_Collected_Date
December 2011
Disaster Risk Management and Food
Security Sector (DRMFSS)
Wednesday, September 3, 2014
Region S.N.N.P
Zone
ALABA SPECIAL
Wereda ALABA SPECIAL
Selected Indicator
Kebele Name
Interventions: Community Perception on Mediums to Influence DRM Actors - Community perception on the
effectiveness of institutional channels to use to influence DRM actors
Institution_1
Process_Description
Institution_2 Process_Description
Institution_3
Process_Description
TETALI BITORA
GERME
BUBESA
Through
Representatives
By Letter
By Letter
Sending By
Development agent
Official letter or
Verbal will be
Submitted
Official letter
attached to
committee verbal
will be Submitted
By letters
At conference
Discussion
Official letter
attached to
committee verbal will
be Submitted
Oral or Verbal
Message
At Conference
Discussion
Oral or Verbal Message
Through
Delegate
Sending By
Development Agent
By
Representative
s
Sending by
Development Agents
At Conference
Discussion
Oral or Verbal Message
312
Page 5 of 5
Data_Collected_Date
Region S.N.N.P
December 2011
Zone
ALABA SPECIAL
Wednesday, September 3, 2014
Wereda ALABA SPECIAL
Selected Indicator
Interventions: Community Perception on their Knowledge used in DRM Process -
Perception of the community on how their knowledge influences the priorities
and measures of DRM actors
KebeleName
Community_Suggestions
AMATA
To identify community problems and accept our Idea
ANDEGNA
KONCHA
ANDEGNA TUKA
They working with people especially at planning stage and hence we can Influence
them
To identify community problems and accept our Idea
ASHEKORA BOTI
To identify community problems and accept our Idea
AYMELE
To identify community problems and accept our Idea
BUBESA
To identify community problems and accept our Idea
BUKET BAME
They are accepting our ideas and They are Identifying problems with us
CHEMBULA
GERME
Authorities are planning with people for people and hence community can influence
them
To identify community problems and accept our Idea
HANTEZO
To identify community problems and accept our Idea
HOLUGEB KUKE
In many occasion we are planning with them and influencing them
HULETEGNA
MEKALA
HULETEGNA
TUKA
KULFO
To identify community problems and accept our Idea
To identify community problems and accept our Idea
They are working with the community and accepting suggestion
LAYEGNAWO
LENDA
MEJA
To identify community problems and accept our Idea
To identify community problems and accept our Idea
NEGELE WEDESH
To identify community problems and accept our Idea
313
Page 1 of 2
Data_Collected_Date
Region S.N.N.P
December 2011
Zone
ALABA SPECIAL
Wednesday, September 3, 2014
Wereda ALABA SPECIAL
Selected Indicator
Interventions: Community Perception on their Knowledge used in DRM Process -
Perception of the community on how their knowledge influences the priorities
and measures of DRM actors
KebeleName
Community_Suggestions
SORGE DARGOSA
Authorities may plan with community and Hence Would be Influenced
TACHEGNAWO
BEDANE
TETALI BITORA
To identify community problems and accept our Idea
To identify community problems and accept our Idea
WEJEGO YATO
WETETA
Authorities are planning and Working with community and are being Influences by
community
Institutions are assumed to work with us on our problems and Hence influence them
YAMBI
Now a days community participate in every program and hence influences
314
Page 2 of 2
Wereda Disaster
Risk Profile
Data_Collected_Date
December 2011
Region S.N.N.P
Zone ALABA SPECIAL
Disaster Risk Management
and Food Security Sector (DRMFSS)
Wednesday, September 3, 2014
Wereda ALABA SPECIAL
Selected Indicator
Interventions: Suggestions to improve preparedness - Interventions suggested by the community to development
actors to improve preparedness in the area
KebeleName
Measure 1
Comment 1
Measure 2
Comment 2
Measure 3
Comment 3
MESERAK
GORTANCHO
KOBO GETO
TEFO CHUFO
Watershed Development
work
Watershed Development
Watershed Development
Reduce Erosion and save
soil
Water Harvesting
technology
Supply of Drought
Resistant Seed
Replantation
Increase
Production
METO DUBALE
HABIBO FURANA
Flood Diversion canal
Construction
Watershed Development
SINBITA
CHEMBULA
Flood Diversion canal
Construction
Watershed development
WEJEGO YATO
water supply
ANDEGNA TEFO watershed development
SORGE
DARGOSA
Strong Watershed
Development Work
Prevent flood
Prevent Erosion and
Degradation
Prevent Flooding
To reduce drought
Reduces Disease and
Women Burden
Reduce Erosion and Boost
Production
To prevent Erosion, Flood
and Soil loss
Reforestation
Water Supply
Dig borehole water
Irrigation scheme
Drought Resistant
variety supply
Drought Resistant
Seed Supply
Road Construction
Prevent flood and
Drought
For water Supply
Improve water
supply
To increase
production
Improve
Production
Increase
Production
To Improve
Market Access
315
Page 1 of 4

Wereda Disaster
Risk Profile
Data_Collected_Date
December 2011
Region S.N.N.P
Zone ALABA SPECIAL
Disaster Risk Management
and Food Security Sector (DRMFSS)
Wednesday, September 3, 2014
Wereda ALABA SPECIAL
Selected Indicator
Interventions: Suggestions to improve preparedness - Interventions suggested by the community to development
actors to improve preparedness in the area
KebeleName
Measure 1
Comment 1
Measure 2
Comment 2
Measure 3
Comment 3
BUKET BAME
HOLUGEB KUKE
WETETA
Diversion canal
Construction
water shade
Development
Dig Borehole water
ANDEGNA
KONCHA
KULFO
Watershed development
Watershed development
LAYEGNAWO
LENDA
Watershed Development
TACHEGNAWO
BEDANE
Watershed Development
HULETEGNA
MEKALA
Borehole water
Development
To control Flood
To improve land quality
Improve water Supply
Minimize Erosion
To prevent Erosion, Flood
and Soil loss
To protect catchment
degradation and minimize
of drought
To protect degradation
For water supply
Borehole Water
Development
Establish Animal
Health clinic
Water Supply
Water supply
Borehole Water
Development
Gully Rehabilitation
Watershed
Development
For water Supply
Improve Livestock
Production
Reduce Disease
Reduce Disease
and Women
Burden
For water Supply
To protect
expansion on farm
land
To Protect land
Degradation
316
Page 2 of 4

Wereda Disaster
Risk Profile
Data_Collected_Date
December 2011
Region S.N.N.P
Zone ALABA SPECIAL
Disaster Risk Management
and Food Security Sector (DRMFSS)
Wednesday, September 3, 2014
Wereda ALABA SPECIAL
Selected Indicator
Interventions: Suggestions to improve preparedness - Interventions suggested by the community to development
actors to improve preparedness in the area
KebeleName
HULETEGNA
TUKA
Measure 1
Watershed Development
NEGELE WEDESH Watershed Development
HANTEZO
Borehole Development
AYMELE
Watershed development
ANDEGNA TUKA Watershed development
MEJA
Watershed development
ASHEKORA BOTI
YAMBI
Borehole water
Development
Food or feed storing
Comment 1
To protect catchment
degradation and minimize
of drought
To protect Degradation
and Minimizing Drought
For supplying water
To protect Degradation
To protect Catchment
degradation and
Minimizing drought
To protect degradation
and Minimizing drought
For water supply
Crop failure
Measure 2
Borehole Water
Development
Borehole Water
Development
Watershed
Development
Borehole Water
Development
Borehole Water
Development
Borehole Water
Development
Watershed
Development
Water Supply
Comment 2
For water Supply
Measure 3
Comment 3
For water Supply
To protect
degradation
To improve
Market Supply
For water Supply
For water Supply
Minimize Drought
and Degradation
Drought
AMATA
Watershed development
To protect Degradation
Construction of water
point
To improve water
supply
317
Page 3 of 4

Wereda Disaster
Risk Profile
Data_Collected_Date
December 2011
Region S.N.N.P
Zone ALABA SPECIAL
Disaster Risk Management
and Food Security Sector (DRMFSS)
Wednesday, September 3, 2014
Wereda ALABA SPECIAL
Selected Indicator
Interventions: Suggestions to improve preparedness - Interventions suggested by the community to development
actors to improve preparedness in the area
KebeleName
TETALI BITORA
Measure 1
Watershed development
GERME
Watershed Development
BUBESA
Watershed Development
Comment 1
To protect Degradation
and Minimizing Drought
Minimizing Drought and
Degradation
To protect Catchment
Degradation and
Minimization of Drought
Measure 2
Borehole Water
Development
Borehole Water
Development
Borehole Water
Development
Comment 2
For water Supply
Measure 3
For water Supply
For water Supply
Comment 3
318
Page 4 of 4

Wereda Disaster
Risk Profile
Data_Collected_Date
December 2011
Disaster Risk Management and
Food Security Sector (DRMFSS)
Wednesday, September 3, 2014
Region S.N.N.P
Zone ALABA SPECIAL
Wereda ALABA SPECIAL
Selected Indicator
Interventions: Suggestions to DRM Actors in the Area - Community suggested measures to DRM actors in the area
for effective DRM actions
Kebele Name Measure 1
Comment 1
Measure 2
Comment 2
Measure 3
MESERAK
GORTANCHO
KOBO GETO
Watershed
Development work
Watershed
Development
TEFO CHUFO
METO DUBALE
HABIBO
FURANA
SINBITA
CHEMBULA
WEJEGO YATO
Watershed
Development
Flood Diversion
canal Construction
Watershed
Development
Flood Diversion
canal Construction
Watershed
development
water supply
Reduce Erosion
and save soil
Water Harvesting
technology
Supply of Drought
Resistant Seed
Replantation
Prevent flood
Reforestation
Prevent Erosion
and Degradation
Prevent Flooding
Water Supply
Dig borehole water
To reduce
drought
Reduces Disease
and Women
Burden
Irrigation scheme
Drought Resistant
variety supply
Increase
Production
Prevent flood and
Drought
For water Supply
Improve water
supply
To increase
production
Improve
Production
Drought Resistant
seed Supply
Supply of Water
harvesting
Technology
Resistant seed
supply
Soil and Water
conservation work
Supply of Drought
Resistant Seed
Watershed
development
Supply of Drought
Resistant Seed
Water Harvesting
Technology
Supply
Comment 3
Increase
Production
Prevent flood
and Drought
Increase
Production
To protect
Erosion
To increase
production
Improve
Production
319
Page 1 of 5
Wereda Disaster
Risk Profile
Data_Collected_Date
December 2011
Disaster Risk Management and
Food Security Sector (DRMFSS)
Wednesday, September 3, 2014
Region S.N.N.P
Zone ALABA SPECIAL
Wereda ALABA SPECIAL
Selected Indicator
Interventions: Suggestions to DRM Actors in the Area - Community suggested measures to DRM actors in the area
for effective DRM actions
Kebele Name
ANDEGNA TEFO
Measure 1
watershed
development
Comment 1
Reduce Erosion
and Boost
Production
Measure 2
Drought Resistant Seed
Supply
Comment 2
Increase
Production
Measure 3
SORGE
DARGOSA
Strong Watershed
Development Work
To prevent
Erosion, Flood
and Soil loss
Road Construction
To Improve Market
Access
Flood or Gully
Control Work
BUKET BAME
Diversion canal
Construction
To control Flood
HOLUGEB KUKE
water shade
Development
To improve land
quality
Borehole Water
Development
For water Supply
WETETA
Dig Borehole water
Improve water
Supply
Establish Animal Health
clinic
Improve Livestock
Production
Watershed
Development
ANDEGNA
KONCHA
Watershed
development
Minimize Erosion
Water Supply
Reduce Disease
Supply of Drought
resistant seed
KULFO
Watershed
development
To prevent
Erosion, Flood
and Soil loss
Water supply
Reduce Disease
and Women Burden
Gully Treatment
Comment 3
To Protect soil
erosion
Increase
Production
Increase
accessibility
320
Page 2 of 5

Wereda Disaster
Risk Profile
Data_Collected_Date
December 2011
Disaster Risk Management and
Food Security Sector (DRMFSS)
Wednesday, September 3, 2014
Region S.N.N.P
Zone ALABA SPECIAL
Wereda ALABA SPECIAL
Selected Indicator
Interventions: Suggestions to DRM Actors in the Area - Community suggested measures to DRM actors in the area
for effective DRM actions
Kebele Name
LAYEGNAWO
LENDA
Measure 1
Watershed
Development
Comment 1
To protect
catchment
degradation and
minimize of
drought
Measure 2
Borehole Water
Development
Comment 2
For water Supply
Measure 3
Gully
Rehabilitation
TACHEGNAWO
BEDANE
Watershed
Development
To protect
degradation
Gully Rehabilitation
To protect
expansion on farm
land
HULETEGNA
MEKALA
Borehole water
Development
For water supply
Watershed
Development
To Protect land
Degradation
Road Construction
HULETEGNA
TUKA
Watershed
Development
To protect
catchment
degradation and
minimize of
drought
Borehole Water
Development
For water Supply
Gully
Rehabilitation
NEGELE
WEDESH
Watershed
Development
To protect
Degradation and
Minimizing
Drought
Borehole Water
Development
For water Supply
Road Construction
HANTEZO
Borehole
Development
For supplying
water
Watershed
Development
To protect
degradation
Comment 3
To change to
production land
To solve road
problem
To change to
productive land
To Improve Road
service for
Everything
Throughout the
year
321
Page 3 of 5

Wereda Disaster
Risk Profile
Data_Collected_Date
December 2011
Disaster Risk Management and
Food Security Sector (DRMFSS)
Wednesday, September 3, 2014
Region S.N.N.P
Zone ALABA SPECIAL
Wereda ALABA SPECIAL
Selected Indicator
Interventions: Suggestions to DRM Actors in the Area - Community suggested measures to DRM actors in the area
for effective DRM actions
Kebele Name Measure 1
Comment 1
Measure 2
Comment 2
Measure 3
AYMELE
Watershed
development
To protect
Degradation
Borehole Water
Development
To improve Market
Supply
Gully
Rehabilitation
ANDEGNA TUKA
Watershed
development
MEJA
Watershed
development
ASHEKORA
BOTI
Borehole water
Development
To protect
Catchment
degradation and
Minimizing
drought
To protect
degradation and
Minimizing
drought
For water supply
Borehole Water
Development
Borehole Water
Development
Watershed
Development
YAMBI
Food or feed storing
Crop failure
Water Supply
For water Supply
Gully
Rehabilitation
For water Supply
Road Construction
Minimize Drought
and Degradation
Road Construction
Drought
Comment 3
To change to
Productive land
to protect
expansion on
farm land
To protect
expansion on
farm land and to
change to
productive land
To improve Road
Problem
To improve road
problem for
everything
AMATA
Watershed
development
To protect
Degradation
Construction of water
point
322
To improve water
supply
Gully
Rehabilitation
To protect
expansion on
farm land
Page 4 of 5
Wereda Disaster
Risk Profile
Data_Collected_Date
December 2011
Disaster Risk Management and
Food Security Sector (DRMFSS)
Wednesday, September 3, 2014
Region S.N.N.P
Zone ALABA SPECIAL
Wereda ALABA SPECIAL
Selected Indicator
Interventions: Suggestions to DRM Actors in the Area - Community suggested measures to DRM actors in the area
for effective DRM actions
Kebele Name Measure 1
Comment 1
Measure 2
Comment 2
Measure 3
TETALI BITORA
Watershed
development
GERME
BUBESA
Watershed
Development
Watershed
Development
To protect
Degradation and
Minimizing
Drought
Minimizing
Drought and
Degradation
To protect
Catchment
Degradation and
Minimization of
Drought
Borehole Water
Development
Borehole Water
Development
Borehole Water
Development
For water Supply
Road Construction
For water Supply
Road Construction
For water Supply
Gully
Rehabilitation
Comment 3
To Improve Road
Problem
To Improve Road
Problem
To protect
Expansion On
Farm land and To
change to
production land
323
Page 5 of 5

Wereda Disaster
Risk Profile
Data_Collected_Date
December 2011
Region S.N.N.P
Zone ALABA SPECIAL
Disaster Risk Management and Food
Security Sector (DRMFSS)
Wednesday, September 3, 2014
Wereda ALABA SPECIAL
Selected Indicator
Economic Vulnerability: Community Suggestions to Improve Economic Situation - Community suggested measures
to improve the economic situation of the area
KebeleName
Measure 1
Comment 1
Measure 2
Comment 2
Measure 3 Comment 3
MESERAK
GORTANCHO
KOBO GETO
TEFO CHUFO
Minimize erosion
Watershed Development
Strong watershed
development work
Prevent Degradation
METO DUBALE
Petty Trading
HABIBO FURANA
Improve irrigation
access, Capacity and
Water supply
SINBITA
Flood protection work
CHEMBULA
Irrigation scheme
Increase Income
To scale up Irrigation
Beneficiary
Flood Prevention
Using Bilate River
Drought Resistant
seed Supply
Drought Resistant
seed Supply
Water Supply
Increase
Production
Disease and
Burden reduction
Zero Grazing
Strong Soil and
Water Conservation
Work
Reduce land
Problem
To protect Soil
Watershed
Development
Watershed
Development
Flood Prevention
Minimize Erosion
Irrigation
Scheme
Rural Road
Construction
Drought
resistant
varieties
supply
Watershed
Development
Supply
Drought
Resistant
seed
Water supply
Supply of
Drought
Resistant
Varieties
Using Bilate
River It is
Possible
Increase
Production
Reduce
Drought
To increase
Production
Improve
Water Supply
324
Page 1 of 4
Wereda Disaster
Risk Profile
Data_Collected_Date
December 2011
Region S.N.N.P
Zone ALABA SPECIAL
Disaster Risk Management and Food
Security Sector (DRMFSS)
Wednesday, September 3, 2014
Wereda ALABA SPECIAL
Selected Indicator
Economic Vulnerability: Community Suggestions to Improve Economic Situation - Community suggested measures
to improve the economic situation of the area
KebeleName
Measure 1
Comment 1
Measure 2
Comment 2
Measure 3 Comment 3
WEJEGO YATO
Strong soil and water
Conservation work
Water Supply
ANDEGNA TEFO
Watershed Development
Improve Production
SORGE DARGOSA
BUKET BAME
Flood, Erosion and Gully
prevention work
Zero Grazing
Improve Soil Fertility
To solve land Shortage
Resistant seed
Supply
Improve
Production
Road Construction
Petty Trading
Improve Market
access
To increase
income
HOLUGEB KUKE
Soil and Water
conservation work
Improve Soil Fertility
Supply of drought
resistant Crop
WETETA
ANDEGNA
KONCHA
Significant watershed
development work
including gully
treatment
Watershed Development
To save soil and Improve
Fertility
Increase Production
Water supply
Drought Resistant
Varieties Supply
325
Increase
Production
Reduce food
shortage
Supply of
drought
Resistant
Varieties
Water
Harvesting
Technology
Water Supply
Flood
Diversion
canal
Construction
Water
Treatment or
supply
Rural Road
Construction
Improve
Production
Reduces
Disease
Reduce
Flooding
Reduce
Disease
Water Supply
Reduce
Disease
Page 2 of 4

Wereda Disaster
Risk Profile
Data_Collected_Date
December 2011
Region S.N.N.P
Zone ALABA SPECIAL
Disaster Risk Management and Food
Security Sector (DRMFSS)
Wednesday, September 3, 2014
Wereda ALABA SPECIAL
Selected Indicator
Economic Vulnerability: Community Suggestions to Improve Economic Situation - Community suggested measures
to improve the economic situation of the area
KebeleName
Measure 1
Comment 1
Measure 2
Comment 2
Measure 3 Comment 3
KULFO
Watershed development
Reduces erosion
LAYEGNAWO
LENDA
TACHEGNAWO
BEDANE
HULETEGNA
MEKALA
HULETEGNA
TUKA
NEGELE WEDESH
HANTEZO
AYMELE
ANDEGNA TUKA
MEJA
Animal Food storing or
Crop residue
Animal Feed or Crop
residue Storing
Animal Feed Storing or
Crop residue
Animal Feed Storing or
Crop residue
Animal food storing or
Crop residue
Animal Feed Storing or
Crop residue
Animal food storing or
Crop residue
Animal Food or Crop
residue storing
Improved Production
Improve Production
Improve Production
Improved Production
Improved Production
Improved Livestock
Production
Improved Production
Improved Production
Water supply
Improve water
Road
construction
Improve
access
326
Page 3 of 4

Wereda Disaster
Risk Profile
Data_Collected_Date
December 2011
Region S.N.N.P
Zone ALABA SPECIAL
Disaster Risk Management and Food
Security Sector (DRMFSS)
Wednesday, September 3, 2014
Wereda ALABA SPECIAL
Selected Indicator
Economic Vulnerability: Community Suggestions to Improve Economic Situation - Community suggested measures
to improve the economic situation of the area
KebeleName
Measure 1
Comment 1
Measure 2
Comment 2
Measure 3 Comment 3
ASHEKORA BOTI
Zero Grazing
YAMBI
AMATA
Water borehole
establishment
Solves land Shortage
For water supply
Animal Feed or
crop residue
Improve
Production
Petty Trade
Increase
Income
TETALI BITORA
GERME
BUBESA
Animal Feed Storing or
crop Residue
Water Borehole
Establishment
Animal Feed Storing or
crop Residue
Improved Production
Water supply and To save
time and Labour loss
Improved Production
327
Page 4 of 4

Wereda Disaster
Risk Profile
Disaster Risk Management and
Food Security Sector (DRMFSS)
Data_Collected_Date
December 2011
Wednesday, September 3, 2014
Region S.N.N.P
Selected Indicator
Zone ALABA SPECIAL
Community Awareness of Disaster Risk Management System and Actors
Wereda ALABA SPECIAL
Kebele Name
Institution 1 Responsibility
Activity Institution 2 Responsibility
Activity
Institution 3 Responsibility Activity
MESERAK
GORTANCHO
KOBO GETO
Kebele Early
Warning
Committee
Kebele Early
Warning
Committee
All Duties
Concerning
All risk and
Early warning
Related Duties
Identify
Developmen Risk and Early
t Agent
Warning
All
activities
including
Developmen
t Agent
TEFO CHUFO
METO DUBALE
HABIBO FURANA
Kebele Early
Warning
Committee,
Developmen
t Agent and
Health
Extension
Kebele Early
warning
Committee
Kebele Early
warning
Committee
All Early
warning And
Disaster related
duties
Information
Dissemination
All risk and
Early warning
Related Duties
All
Disaster
and Risk
Related
Activities
Support
Kind and
type
selection
Identificat
ion
Developmen
t Agent
Developmen
t Agent
Participation
Health
Extensions
Screening
Health
Extension
Screening
Health
Extension
Screening
Health
Extension
Inform
Identifyin
g and
Informati
on
328
Page 1 of 7

Wereda Disaster
Risk Profile
Disaster Risk Management and
Food Security Sector (DRMFSS)
Data_Collected_Date
December 2011
Wednesday, September 3, 2014
Region S.N.N.P
Selected Indicator
Zone ALABA SPECIAL
Community Awareness of Disaster Risk Management System and Actors
Wereda ALABA SPECIAL
Kebele Name
SINBITA
CHEMBULA
WEJEGO YATO
ANDEGNA TEFO
Institution 1 Responsibility
Kebele Early
warning
Committee
and
Developmen
t Agent
Work On Risk
management
Cases
Kebele Early
warning
Committee
All risk and
Early warning
Related Duties
Kebele Early
Warning
Committee,
Developmen
t Agent and
Health
Extension
All Early
warning And
Disaster related
duties
Kebele Early
warning
Committee
Mobilization
Activity Institution 2
Screen,
Identify
and
Announce,
et cetera
Responsibility
Identify,
Screen
and
Inform
All risk
related
works
Including,
Informatio
n,
Identificat
ion and
Screening
Screening
Victims
Developmen
t Agent
Information
Provision
Activity
Institution 3 Responsibility Activity
Selection
of type and
Kind of
Support
needed
Health
Extension
329
Page 2 of 7
Wereda Disaster
Risk Profile
Disaster Risk Management and
Food Security Sector (DRMFSS)
Data_Collected_Date
December 2011
Wednesday, September 3, 2014
Region S.N.N.P
Selected Indicator
Zone ALABA SPECIAL
Community Awareness of Disaster Risk Management System and Actors
Wereda ALABA SPECIAL
Kebele Name
Institution 1 Responsibility
Activity Institution 2 Responsibility
Activity
Institution 3 Responsibility Activity
SORGE DARGOSA
BUKET BAME
HOLUGEB KUKE
Kebele Risk
Management
Kebele Level
Duties
Kebele Early
warning
Committee
Kebele Early
warning
Committee
and
Developmen
t Agent
Inform the
community
about Disaster
and Participate
in evacuation
effort when
needed
Problem
Identificat
ion,
Screening
Type and
Kind of
Measures
Developmen
t Agent
Screen
Victims
and
Selecting
type of
support
needed
Screening,
Distributio
n of aid
when
there is
relief
program
330
Page 3 of 7
Wereda Disaster
Risk Profile
Disaster Risk Management and
Food Security Sector (DRMFSS)
Data_Collected_Date
December 2011
Wednesday, September 3, 2014
Region S.N.N.P
Selected Indicator
Zone ALABA SPECIAL
Community Awareness of Disaster Risk Management System and Actors
Wereda ALABA SPECIAL
Kebele Name
WETETA
ANDEGNA
KONCHA
KULFO
LAYEGNAWO
LENDA
Institution 1 Responsibility
Kebele
Disaster Risk
Management
Committee
Work on all
Disaster
Kebele Early
warning
Committee
Information
Dissemination
and
Mobilization
Kebele Risk
Management
committee
and
Developmen
t Agent
Developmen
t Agents
All early
warning duties
Capacity
Building
Activity Institution 2
Screening,
Identifyin
g and
Announcin
g
Screening
and
Selecting
Type and
Kind of
support
needed
Developmen
t Agent
Identifyin
g,
Screening
and
Distributio
n
Screening
type kind
of
interventi
on
Kebele
Crisis
managemen
t
Committee
Responsibility
Inform
community
about disaster
Activity
Institution 3 Responsibility Activity
Screening
who are
victims
Health
Extension
Capacity
Building
Screening
who are
Victims
331
Page 4 of 7

Wereda Disaster
Risk Profile
Disaster Risk Management and
Food Security Sector (DRMFSS)
Data_Collected_Date
December 2011
Wednesday, September 3, 2014
Region S.N.N.P
Zone ALABA SPECIAL
Selected Indicator
Community Awareness of Disaster Risk Management System and Actors
Kebele Name
TACHEGNAWO
BEDANE
Institution 1 Responsibility
HULETEGNA
MEKALA
Developmen
t Agent
Capacity
Building
HULETEGNA
TUKA
Developmen
t Agent
Capacity
Building
NEGELE WEDESH
Developmen
t Agent
Teaching
community
HANTEZO
Developmen
t Agent
Capacity
Building
Activity Institution 2 Responsibility
Kebele
Crisis
managemen
t
Committee
Screening
Type and
Kind of
Interventi
on
Kebele
Crisis
managemen
t
Committee
Inform
Community
about disaster
Screening
Type and
Kind of
Interventi
on
Kebele
Crisis
managemen
t
Committee
Inform
Community
about disaster
Screening
Type and
Kind of
Interventi
on
Kebele
Crisis
managemen
t
Committee
Inform
Community
about disaster
Screening
Type and
Kind of
Interventi
on
Kebele
Crisis
managemen
t
Committee
Inform
Community
about disaster
332
Wereda ALABA SPECIAL
Activity
Institution 3 Responsibility Activity
Screening
who are
Victims
Health
Extension
Screening
who are
Victims
Health
Extension
Inform
Community
about
disaster
Screening
who are
Victims
Capacity
Building
Screening
who are
Victims
Screening
who are
Victims
Health
Extension
Screening
who are
Victims
Health
Extension
Inform
Community
about
disaster
Screening
who are
Victims
Capacity
Building
Screening
who are
Victims
Page 5 of 7

Wereda Disaster
Risk Profile
Disaster Risk Management and
Food Security Sector (DRMFSS)
Data_Collected_Date
December 2011
Wednesday, September 3, 2014
Region S.N.N.P
Selected Indicator
Zone ALABA SPECIAL
Community Awareness of Disaster Risk Management System and Actors
Wereda ALABA SPECIAL
Kebele Name
Institution 1 Responsibility
Activity Institution 2 Responsibility
Activity
Institution 3 Responsibility Activity
AYMELE
Developmen
t Agent
Capacity
Building
ANDEGNA TUKA
Developmen
t Agent
Capacity
Building
MEJA
Developmen
t Agent
Teaching
community
ASHEKORA BOTI
Developmen
t Agent
Teaching
community
YAMBI
Kebele
Office and
Developmen
t Agent
Information
Distribution
Screening
Type and
Kind of
Interventi
on
Kebele
Crisis
managemen
t
Committee
Screening
Type and
Kind of
Interventi
on
Kebele
Crisis
managemen
t
Committee
Screening
Type and
Kind of
Interventi
on
Kebele
Crisis
managemen
t
Committee
Screening
Type and
Kind of
Interventi
on
Kebele
Crisis
managemen
t
Committee
Screening
and
Distributio
n
Risk
Managemen
t
Committee
Inform
Community
about disaster
Inform
Community
about disaster
To learn about
the disaster
Inform
community
about disaster
Screening
Screening
who are
Victims
Health
Extension
Screening
who are
Victims
Health
Extension
Screening
who are
Victims
Health
Extension
Screening
who are
Victims
Health
Extension
Distributio
n
Capacity
Building
Capacity
Building
Inform
Community
about
disaster
Inform
Community
about
disaster
Screening
who are
Victims
Screening
who are
Victims
Screening
who are
Victims
Screening
who are
Victims
333
Page 6 of 7

Wereda Disaster
Risk Profile
Disaster Risk Management and
Food Security Sector (DRMFSS)
Data_Collected_Date
December 2011
Wednesday, September 3, 2014
Region S.N.N.P
Selected Indicator
Zone ALABA SPECIAL
Community Awareness of Disaster Risk Management System and Actors
Wereda ALABA SPECIAL
Kebele Name
Institution 1 Responsibility
Activity Institution 2 Responsibility
Activity
Institution 3 Responsibility Activity
AMATA
Developmen
t Agent
Capacity
Building
TETALI BITORA
Developmen
t Agents
Teaching
community
GERME
BUBESA
Developmen
t Agents
Community
Capacity
Building
Developmen
t Agents
Capacity
Building
Screening
Type and
Kind of
Interventi
on
Screening
Type and
kind of
Interventi
on
Screening
Type and
kind of
Interventi
on
Screening
Type and
kind of
Interventi
on
Kebele
crisis
Managemen
t
Committee
Kebele
Crisis
managemen
t
Committee
Kebele
Crisis
managemen
t
Committee
Kebele
Crisis
managemen
t
Committee
Inform
Community
about disaster
Inform the
community
about disaster
Inform
Community
about disaster
Inform
Community
about disaster
Screening
who are
Victims
Health
Extension
Screening
who are
Victims
Health
Extension
Screening
who are
Victims
Health
Extension
Screening
who are
Victims
Health
Extension
Capacity
Building
Inform
Community
about
disaster
Community
Capacity
Building
Capacity
Building
Screening
who are
Victims
Screening
who are
Victims
Screening
who are
Victims
Screening
who are
Victims
334
Page 7 of 7
Wereda Disaster
Risk Profile
Data_Collected_Date
December 2011
Disaster Risk Management and Food
Security Sector (DRMFSS)
Wednesday, September 3, 2014
Region S.N.N.P
Selected Indicator
Zone ALABA SPECIAL
Wereda ALABA SPECIAL
Community Perception of DRM System and Actors - Perception of the community on the effectiveness of DRM
system in helping them to prevent, cope and recover from disasters
KebeleName
MESERAK GORTANCHO
Prevention
Moderately Effective
KOBO GETO
Moderately Effective
TEFO CHUFO
Less effective
METO DUBALE
HABIBO FURANA
SINBITA
CHEMBULA
Less effective
Moderately Effective
Moderately Effective
Moderately Effective
WEJEGO YATO
ANDEGNA TEFO
Less effective
Moderately Effective
Coping
Moderately Effective
Moderately Effective
Less effective
Less effective
Moderately Effective
Moderately Effective
Moderately Effective
Less effective
Moderately Effective
Recovery
Moderately Effective
Moderately Effective
Less effective
Less effective
Moderately Effective
Moderately Effective
Moderately Effective
Less effective
Moderately Effective
Overall_Effectiveness
Awareness and Knowledge
gap
Limited awareness and
Limited Knowledge and
Skill
Low awareness and Low
Knowledge concerning
Disaster risk Management
Limited Knowledge and
Poor Awareness
Knowledge, Skill and
Awareness Gap
Limited awareness and
Knowledge Gap
Low awareness, Low
Knowledge and skill of risk,
Mitigation measures and so
on
Awareness, Knowledge and
Skill Gap
Low awareness, Knowledge
and Skill Gap
335
Page 1 of 3

Wereda Disaster
Risk Profile
Data_Collected_Date
December 2011
Disaster Risk Management and Food
Security Sector (DRMFSS)
Wednesday, September 3, 2014
Region S.N.N.P
Selected Indicator
Zone ALABA SPECIAL
Wereda ALABA SPECIAL
Community Perception of DRM System and Actors - Perception of the community on the effectiveness of DRM
system in helping them to prevent, cope and recover from disasters
KebeleName
SORGE DARGOSA
Prevention
Less effective
Coping
Less effective
Recovery
Less effective
Overall_Effectiveness
Knowledge and Skill Gap
BUKET BAME
Less effective
Less effective
Less effective
Limited Knowhow
HOLUGEB KUKE
Moderately Effective
Moderately Effective
Moderately Effective
Knowledge and Skill gap
WETETA
ANDEGNA KONCHA
KULFO
LAYEGNAWO LENDA
TACHEGNAWO
BEDANE
HULETEGNA MEKALA
Less effective
Moderately Effective
Less effective
Less effective
Less
Less effective
Moderately Effective
Less effective
Less effective
less
Less effective
Moderately Effective
Less effective
Less effective
less
Poor awareness and
Knowledge gap
Knowledge gap and Low
awareness
Limited Knowledge and
Poor awareness
Limited awareness,
Knowledge and skill gap
Knowledge and Skill gap
HULETEGNA TUKA
NEGELE WEDESH
Less effective
Less effective
Less effective
Less effective
Less effective
Less effective
Knowledge and Skill gap
and Limited awareness
Knowledge and Skill gap
and Limited awareness
336
Page 2 of 3
Wereda Disaster
Risk Profile
Data_Collected_Date
December 2011
Disaster Risk Management and Food
Security Sector (DRMFSS)
Wednesday, September 3, 2014
Region S.N.N.P
Selected Indicator
Zone ALABA SPECIAL
Wereda ALABA SPECIAL
Community Perception of DRM System and Actors - Perception of the community on the effectiveness of DRM
system in helping them to prevent, cope and recover from disasters
KebeleName
HANTEZO
Prevention
Less
Coping
Less
Recovery
Less
Overall_Effectiveness
Knowledge and Skill Gap
AYMELE
ANDEGNA TUKA
MEJA
ASHEKORA BOTI
YAMBI
AMATA
TETALI BITORA
GERME
Less
Less effective
Less effective
Less effective
They are helping the
community
Less effective
Less effective
Less
Less
Less effective
Less effective
Less effective
They effectively screen,
Distribute and Follow up
Less
Less effective
Less
Less
Less effective
Less effective
Less effective
They effectively screen,
Distribute and Follow up
Less
Less effective
Less
Limited awareness,
Knowledge and skill gap
Limited awareness,
Knowledge and skill gap
Knowledge and Skill gap
and Limited awareness
Knowledge and Skill gap
and Limited awareness
They or Development Agent
and Health Extension not
live with us and if it be
better
Knowledge and Skill gap
and Limited awareness
Knowledge and Skill gap
and Limited awareness
Knowledge and Skill gap
BUBESA
Less effective
Less effective
Less effective
Limited awareness,
Knowledge and skill gap
337
Page 3 of 3
Data_Collected_Date
Region S.N.N.P
December 2011
Zone
ALABA SPECIAL
Wednesday, September 3, 2014
Wereda ALABA SPECIAL
Selected Indicator
Major Public Interventions Desired - Percentage of households by type of
intervention desired
Major public interventions desired by the community
Degree of Importance for the community
Better job
1st
2nd
3rd
8.59
15.49
11.89
Cash transfers/social assistance
42.94
5.07
12.20
Cash-for-work activities (not employment)
0.83
3.66
2.44
Food Aid
21.88
27.61
25.61
Food-for-work activities
5.54
7.89
18.60
Fuel subsidies
0.00
0.28
0.00
Medical assistance
0.28
1.41
0.00
Micro-credit programmes
15.79
12.11
11.28
Other (specify)
1.66
2.54
3.96
Rental subsidies
0.28
2.82
0.91
School feeding for children
0.28
0.28
0.91
School fees for children
0.00
0.28
0.00
Subsidized food
1.66
17.46
7.32
Subsidized health care
0.00
2.54
4.57
338
Page 1 of 2

Data_Collected_Date
Region S.N.N.P
December 2011
Zone
ALABA SPECIAL
Wednesday, September 3, 2014
Wereda ALABA SPECIAL
Selected Indicator
Major Public Interventions Desired - Percentage of households by type of
intervention desired
Major public interventions desired by the community
Degree of Importance for the community
Supplementary feeding for women and young children
1st
2nd
3rd
0.28
0.56
0.30
339
Page 2 of 2
WDRP Indicators
Other Community Characteristics
340

Wereda Disaster
Risk Profile
Data_Collected_Date
December 2011
Region S.N.N.P
Selected Indicator
Kebele Name
Zone ALABA SPECIAL
Capacity: Community Based Organizations in the Wereda
Name_Of_Organization
Est._Year
Formal/Informal
MESERAK
GORTANCHO
KOBO GETO
East Gortancho Cooperatives
Youth League
1998
2001
Formal
Formal
Disaster Risk Management and Food
Security Sector (DRMFSS)
Wednesday, September 3, 2014
Wereda ALABA SPECIAL
Type of Members
Farmers
Youth
Activity
Less Functional
TEFO CHUFO
Women League
2002
Formal
Women
METO DUBALE
Women League
2002
Formal
Women
HABIBO FURANA
Youth League
2001
Formal
Youth
Habibo Peasant Association
1989
Formal
Farmers
SINBITA
Sinibita Cooperatives
1998
Formal
Farmers
CHEMBULA
Youth League
2001
Formal
Youth
Chambula Cooperatives
1999
Formal
Farmers
WEJEGO YATO
Women League
2002
Formal
Women
ANDEGNA TEFO
Women League
2002
Formal
Women
Teho Cooperative
1995
Formal
Farmers
SORGE DARGOSA
Youth League
2001
Formal
Youth
341
Page 1 of 4

Wereda Disaster
Risk Profile
Data_Collected_Date
December 2011
Region S.N.N.P
Selected Indicator
Kebele Name
Zone ALABA SPECIAL
Capacity: Community Based Organizations in the Wereda
Name_Of_Organization
Est._Year
Formal/Informal
SORGE DARGOSA
Sorge Peasant association
Formal
Disaster Risk Management and Food
Security Sector (DRMFSS)
Wednesday, September 3, 2014
Wereda ALABA SPECIAL
Type of Members
Farmers
Activity
BUKET BAME
Buko Cooperation
1999
Formal
Farmers
HOLUGEB KUKE
Youth League
2001
Formal
Youth
`
Holagaba Cooperative
1998
Formal
Farmers
WETETA
Weteta Peasant Association
1972
Formal
Farmers
ANDEGNA
KONCHA
Women League
Qonich Cooperatives
2001
1998
Formal
Formal
Women
Farmers
KULFO
Kulito Peasant association
1978
Formal
Farmers
Kulito cooperative
1999
Formal
Farmers
LAYEGNAWO
LENDA
Women League
Farmer Union
Formal
Formal
Women
Farmers
Mobilize Women
Mobilize Farmer
TACHEGNAWO
BEDANE
Women League
2002
Formal
Women
Mobilize Women
342
Page 2 of 4

Wereda Disaster
Risk Profile
Data_Collected_Date
December 2011
Disaster Risk Management and Food
Security Sector (DRMFSS)
Wednesday, September 3, 2014
Region S.N.N.P
Selected Indicator
Kebele Name
TACHEGNAWO
BEDANE
HULETEGNA
MEKALA
Zone ALABA SPECIAL
Capacity: Community Based Organizations in the Wereda
Name_Of_Organization
Est._Year
Formal/Informal
Youth League
2002
Formal
Farmer Union
2000
Formal
Edir
1990
Informal
Wereda ALABA SPECIAL
Type of Members
Youth
Farmers
Farmers
Activity
mobilize Youth
Mobilize Farmers
Mobilize Farmer
HULETEGNA
TUKA
Traditional Insurance
Youth League
1975
2002
Informal
Formal
Members
Youth
Mobilizing Members
mobilize Youth
NEGELE WEDESH
Farmer Union
1999
Formal
Farmers
Mobilize farmer
Youth League
2002
Formal
Youth
mobilize Youth
HANTEZO
Farmer Union
1999
Formal
Farmers
Mobilize farmer
Youth League
2002
Formal
Youth
mobilize Youth
AYMELE
Youth League
Formal
Youth
Mobilize Youth
Women League
2002
Formal
Women
Mobilize Women
ANDEGNA TUKA
Women League
Formal
Women
Mobilize Women
343
Page 3 of 4

Wereda Disaster
Risk Profile
Data_Collected_Date
December 2011
Region S.N.N.P
Selected Indicator
Kebele Name
Zone ALABA SPECIAL
Capacity: Community Based Organizations in the Wereda
Name_Of_Organization
Est._Year
Formal/Informal
ANDEGNA TUKA
Farmer Union
Formal
Disaster Risk Management and Food
Security Sector (DRMFSS)
Wednesday, September 3, 2014
Wereda ALABA SPECIAL
Type of Members
Farmers
Activity
Mobilize Farmer
MEJA
Edir
1991
Informal
Farmers
Mobilize Farmers
Youth League
2002
Formal
Youth
mobilize Youth
ASHEKORA BOTI
Mancheno
1999
Informal
Farmers
Mobilize Farmers
Youth League
2002
Formal
Youth
mobilize Youth
YAMBI
Edir
1991
Informal
AMATA
Edir
1993
Informal
Farmers
Mobilize Farmer
TETALI BITORA
Edir
1980
Informal
Farmers
Mobilize Farmers
Youth League
2002
Formal
Youth
mobilize Youth
GERME
Women League
2002
Formal
Women
Mobilize Women
Youth League
2002
Formal
Youth
mobilize Youth
BUBESA
Women League
2002
Formal
Women
Mobilize Women
Farmer Union
1999
Formal
Farmers
Mobilize Farmer
344
Page 4 of 4
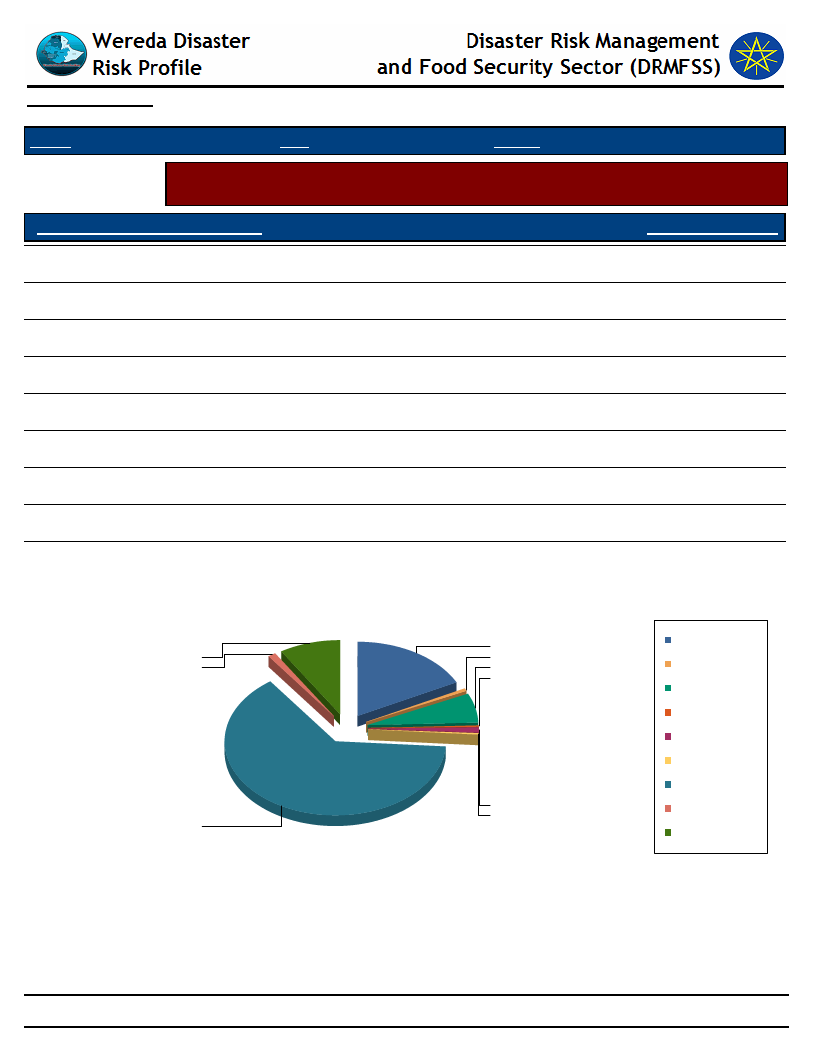
Data_Collected_Date
December 2011
Wednesday, September 3, 2014
Region S.N.N.P
Zone ALABA SPECIAL
Wereda ALABA SPECIAL
Selected Indicator
Supporting Agencies against Disasters - Percentage of households by supporting
institutions to handle or recover from disaster damages
Supporting Agencies Against Disasters
Response_Percentage
National or local authorities
0.28
Local NGOs
1.14
Family members in the same community
17.61
Friends and neighbors in the same community
6.25
Family members outside the community
0.57
Support via contacts working for the authorities
8.81
Support via contacts working for NGOs
1.14
None
63.92
Friends and neighbors outside the community
0.28
Supporting Agencies Against Disasters
8.8
1.1
63.9
17.6
0.6
6.3
0.3
1.1
0.3
Family members in the
same community
Family members outside
the community
Friends and neighbors in
the same community
Friends and neighbors
outside the community
Local NGOs
National or local
authorities
None
Support via contacts
working for NGOs
Support via contacts
working for the
authorities
345
Page 1 of 1
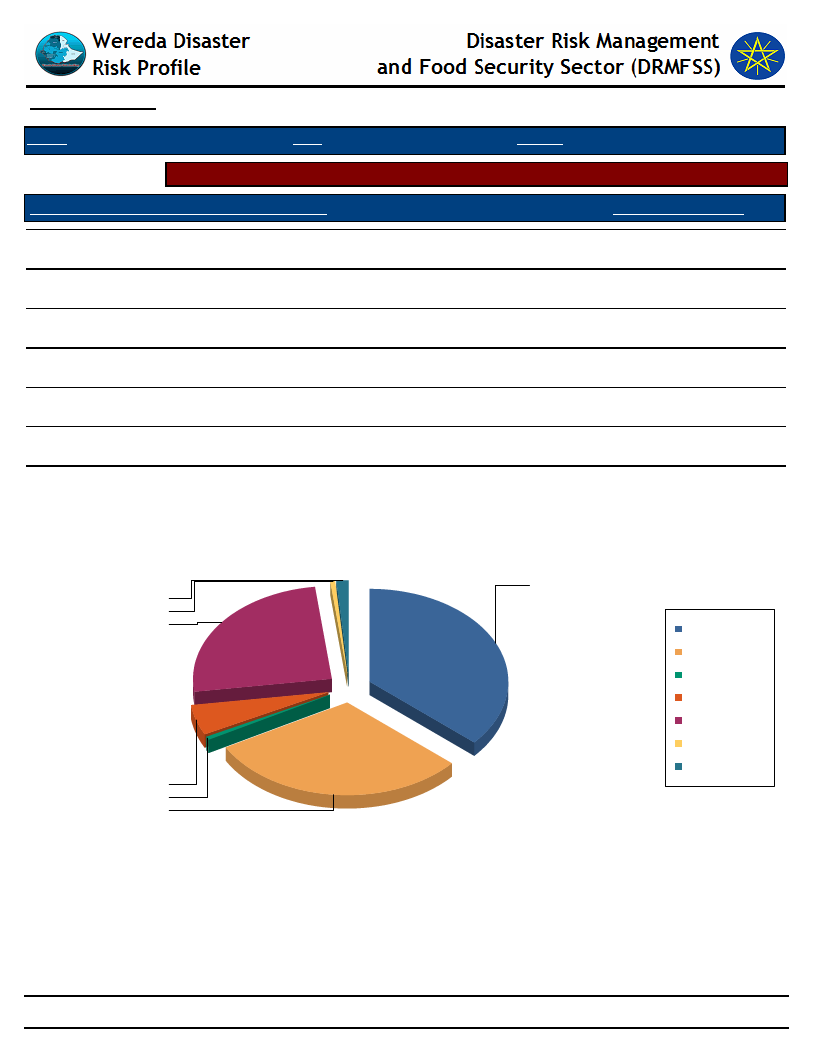
Data_Collected_Date
December 2011
Wednesday, September 3, 2014
Region S.N.N.P
Zone ALABA SPECIAL
Wereda ALABA SPECIAL
Selected Indicator
Types of support received by households during disasters
Type of Support Provided By Supporting Agencies
Response_Percentage
Emergency aid (food, water, shelter, etc.)
25.32
Capital for re-construction of house and property
5.19
New house
0.65
Access to loan for re-construction
30.52
Access to capital or loan for adaptation/protection measures
36.36
Assets such as livestock replenishment
0.65
Other
1.30
Type of Support Provided By Supporting Agencies
36
1
1
25
Access to capital or loan
for adaptation/protection
measures
Access to loan for
re-construction
Assets such as livestock
replenishment
Capital for
re-construction of house
and property
Emergency aid (food,
water, shelter, etc.)
New house
Other
5
1
31
346
Page 1 of 1
Wereda Disaster
Risk Profile
Data_Collected_Date
December 2011
Disaster Risk Management and
Food Security Sector (DRMFSS)
Wednesday, September 3, 2014
Region S.N.N.P
Zone ALABA SPECIAL
Wereda ALABA SPECIAL
Selected Indicator
Government Actors in the Field of Disaster Risk Management - Government actors and their activities in the field
of Disaster Risk Managements
Government Institution
Activity
Description
Activity
Description Activity
Description Activity Description
People In Need
Health Office
Water Resource
Development Office
Livestock Resource
Development and Health
Office
Water supply
Scheme construction
Water Supply
Scheme
Maintenance
Expansion of
Water Supply
Environmental
sanitation and
Drainage
Water supply
Supply of
Sustainable
water Scheme
Management
Mother and
Children Health
Care
Drilling Borehole
Water for
drinking both
for Animal
and Human
Main
Communicabl
e Disease
Prevention
and Control
Community
Awareness
creation and
Capacity For
WASHCO
Forage Development
Aware forage
Development and
Supplying forage
seed and Seeding
Livestock
Production
Supplying
Improved
Varity
Artificial
Inseminating
Supplying
Improved
some
Capacity
Building of
Communit
y water
Scheme
use and
Manageme
nt
Nutrition
Interventio
n Including
OTP and
SC
Water
Supply
Scheme
Constructi
on and
Maintenan
ce
Animal
Health
Service
Treatment
and Vaccine
347
Page 1 of 2

Wereda Disaster
Risk Profile
Data_Collected_Date
December 2011
Disaster Risk Management and
Food Security Sector (DRMFSS)
Wednesday, September 3, 2014
Region S.N.N.P
Zone ALABA SPECIAL
Wereda ALABA SPECIAL
Selected Indicator
Government Actors in the Field of Disaster Risk Management - Government actors and their activities in the field
of Disaster Risk Managements
Government Institution
Activity
Description
Activity
Description Activity
Description Activity Description
Agriculture Office
Wereda Disaster
Preparedness and
Prevention Office (DPPO)
Crop Production and
Management
Early warning
Problem
Early warning
Weekly
Reporting and
Early warning
Monthly
Reporting
Crop Protection
and Management
Disaster
Response
Program
Extension
communicatio
n Service
Provision
Aid supply
and
Beneficiary
Targeting
Productive
Safety Net
Program
Public work
program,
Direct
support
program and
Beneficiary
transfer
EOS or CSI
program
Supplementar
y food
supplying and
Distribution
and oil
Supplying and
Distribution
348
Page 2 of 2
Data_Collected_Date
Region S.N.N.P
December 2011
Zone ALABA SPECIAL
Wednesday, September 3, 2014
Wereda ALABA SPECIAL
Selected Indicator
Non-Government Actors in the Field of Disaster Risk Management -
Non-government actors and their activities in the field of Disaster Risk
Management
Non Governmental Actors
in the Wereda
Activities
UNICEF
On Malaria, Nutrition and Environmental Sanitation
UNICEF
UNICEF
Water Action
Establishing 4 Borehole water scheme
On EOS or CSI screening
Establishing 13 Borehole scheme
Farm Africa
FHE
People In Need
Capacity Building Or Training and Supplying credit access for shoat rearing
Improved Seed Provision
Borehole water supply scheme Established in support of this NGOs
LVI
Improved seed Provision
Save the children
WFP
10 Borehole Schemes Constructed
Supplementary Food supply and Field Monitoring
349
Page 1 of 1

Wereda Disaster
Risk Profile
Data_Collected_Date
December 2011
Region S.N.N.P
Zone
ALABA SPECIAL
Disaster Risk Management
and Food Security Sector (DRMFSS)
Wednesday, September 3, 2014
Wereda ALABA SPECIAL
Selected Indicator
Wereda Strengths, weaknesses, opportunites and treats (SWOT) Analysis
Kebele Name
Strength
Weakness
Opportunity
Threat
MESERAK
GORTANCHO
KOBO GETO
TEFO CHUFO
METO DUBALE
HABIBO FURANA
SINBITA
Community Cooperation
Strong Working People
Development Agent
Presence Proximity to
wereda Capital town
Strong Cooperation Working
People Presence of
Development agent
Good Community Relation
Strong Working People
Presence of Development
agent
High social Relation Good
Working People Community
Cooperation
Community Cooperation
Good Working People Good
Community Cooperation
Development Agent
Presence Health Extension
Community cooperation
Good working People
Presence of Development
Agent
Illiteracy Back Ward
Technology
Illiteracy Bad Topography
Illiteracy Bad Topography
Bad Location or Flood Line
Remote Location from
Wereda Capital Town
Bad Topography Illiteracy
Illiteracy Bad Topography or
Flooding
350
Information Technology 0r Hand
Phone Access Road access
Drought Erosion Snow
Information Technology 0r Hand
Phone Access
Information Technology Or
Hand Phone Access
Drought High Degradation
High soil erosion and
Degradation Drought
Improved Information
Technology. Example Mobile
Phone
Information Technology or
Hand Phone Access Irrigation
Scheme
Flood Drought
High Erosion Drought
Information Technology or
Hand Phone Access Coming of
Agricultural Investors
Every year flooding Snow
Page 1 of 5

Wereda Disaster
Risk Profile
Data_Collected_Date
December 2011
Region S.N.N.P
Zone
ALABA SPECIAL
Disaster Risk Management
and Food Security Sector (DRMFSS)
Wednesday, September 3, 2014
Wereda ALABA SPECIAL
Selected Indicator
Wereda Strengths, weaknesses, opportunites and treats (SWOT) Analysis
Kebele Name
Strength
Weakness
Opportunity
Threat
CHEMBULA
WEJEGO YATO
ANDEGNA TEFO
Cooperation among
Community Strong Working
People Development Agent
Presence
Good Social Relation Good
working People Presence of
Development agent Change
Positive People
Good Community
cooperation Strong Working
People
SORGE DARGOSA
Cooperation
BUKET BAME
HOLUGEB KUKE
Good community relation
Good Working People or
Labour Cooperation among
and Between People
Cooperation among People
Illiteracy
Illiteracy
Illiteracy
Unfavourable Topography
Flood Location Very remote
location from Wereda Capital
or Town
Illiteracy
Information Technology or
Hand Phone Access Road
Access Proximity to Wereda
Capital
Information Technology or
Hand Phone Access Road
access
Information Technology or
Hand Phone Access Road
Construction Started Electric
Line Across the Kebele
Information Technology or
Hand Phone Access
Improved Information
Technology. Example Mobile
Phone or Network access
Information Technology or
Hand Phone and Road Access
Drought Erosion
Drought Erosion
Drought Erosion
High Erosion and Large
Gullies
Every Year Flooding
Occurrence of Drought
Drought Flood
351
Page 2 of 5

Wereda Disaster
Risk Profile
Data_Collected_Date
December 2011
Region S.N.N.P
Zone
ALABA SPECIAL
Disaster Risk Management
and Food Security Sector (DRMFSS)
Wednesday, September 3, 2014
Wereda ALABA SPECIAL
Selected Indicator
Wereda Strengths, weaknesses, opportunites and treats (SWOT) Analysis
Kebele Name
WETETA
ANDEGNA
KONCHA
KULFO
LAYEGNAWO
LENDA
TACHEGNAWO
BEDANE
HULETEGNA
MEKALA
HULETEGNA
TUKA
Strength
Community cooperation
Good Working people
Change positive community
Presence of Development
Agents
Good Working People
Strong Cooperation
Community cooperation
Good working People
Development Agents
Presence
Good Community relation
Good working People
Potential of Land Good
Community Relation
Potential of land Good
Community Relation
Good Community Relation
Good Working People
Weakness
Illiteracy Bad Topography
Illiteracy Bad Landscape
Bad Topography Illiteracy
Flood front area
Increasing of gully expansion
on farm land
Easily Erodible and Soil or
Light soil
Flood Prone area Low
market access
Opportunity
Information Technology or
Hand Phone Access
Information Technology or
Hand Phone and Road Access
Information Technology or
Hand Phone Access
Flood front area
Market access Market access
Mobile access Market access
Information Technology or
Mobile phone access
Development Agent Support
Threat
High erosion Snow Poor or
No road
Information Technology or
Hand Phone and Road
Access
Erosion Drought
No credit access. Every
year flooding and Snow
Occurrence of Drought
Occurrence of Drought
Occurrence of Drought
Input Price and Land
shortage Malaria and
Occurrence of Drought
Input Price Increment and
Every year Flooding snow
Occurrence of Drought
352
Page 3 of 5

Wereda Disaster
Risk Profile
Data_Collected_Date
December 2011
Region S.N.N.P
Zone
ALABA SPECIAL
Disaster Risk Management
and Food Security Sector (DRMFSS)
Wednesday, September 3, 2014
Wereda ALABA SPECIAL
Selected Indicator
Wereda Strengths, weaknesses, opportunites and treats (SWOT) Analysis
Kebele Name
Strength
Weakness
Opportunity
Threat
NEGELE WEDESH
Good Community Relation
Good Working People
HANTEZO
Good Working People
Potential of land
AYMELE
Good Community Relation
Good Working People
ANDEGNA TUKA
Good Community Relation
Good working People
MEJA
Good Community Relation
Good Working People
Cooperation Among and
Between People
ASHEKORA BOTI
Good Community Relation
Good Working People
Cooperation among and
Between people
Flood Prone Area Very
remote location from wereda
Capital and Poor road
Flood Prone area Road
Problem
Flood Prone area
Flood Prone area Easily
erodible soil or light soil
Good Community Relation
Good Working People
Cooperation Among and
Between People
Easily Erodible soil or light
soil
Flood Prone area Very
remote location from Wereda
Capital
Information Technology Mobile
phone access Market Access
Information Technology or
Mobile phone access
Development Agent support and
Market access
Information Technology Mobile
phone access Market access
Information Technology or
Mobile phone access Market
access
Information Technology Mobile
phone access Input Price
increase rainfall shortage
Occurrence of Drought
Information Technology or
Mobile phone access Market
Access
No Credit access, Every
year flooding and Snow
Occurrence of Drought
Water problem and Snow
Input price Increment
No credit Access, Every
year Flooding and Snow
Occurrence of drought
Occurrence of drought
Input price increase, Every
year flooding and Snow
Input Price increase
rainfall shortage
Occurrence of Drought
Information Technology or
Mobile phone access
Market Access
353
Page 4 of 5

Wereda Disaster
Risk Profile
Data_Collected_Date
December 2011
Region S.N.N.P
Zone
ALABA SPECIAL
Disaster Risk Management
and Food Security Sector (DRMFSS)
Wednesday, September 3, 2014
Wereda ALABA SPECIAL
Selected Indicator
Wereda Strengths, weaknesses, opportunites and treats (SWOT) Analysis
Kebele Name
Strength
Weakness
Opportunity
Threat
YAMBI
AMATA
TETALI BITORA
Strong working People
Relatively productive land
Potential of land Good
Community Relation
Good Community Relation
Good Working People
GERME
BUBESA
Productive soil Good
working People Good
Community Relation
Good Community Relation
Good Working People
Strong working People
Relatively productive land
Flood Prone area
Flood prone Area Very
Remote location from
Wereda Capital and Road
Problem
Illiteracy Gully Expansion
and Poor Roads Flood Prone
Area
Flood Prone Area Flood
Prone area
Good land Development Agents
support
Information Technology or
Mobile phone access Market
access
Information Technology Mobile
phone access Market Access
Better Land Information
Technology or Mobile phone
access Development Agent
Support
Development Agent Support
Information Technology Mobile
phone access Market access
No Credit Water Shortage
Flooding, Snow and Gully
Expansion on Farm land
Occurrence of Drought
No Credit access and Every
Year Flooding Snow
Occurrence of Drought
Drought Water Shortage
Every Year Flooding
Every Year Flooding No
Credit access, Every year
flooding and Snow
Occurrence of Drought
354
Page 5 of 5
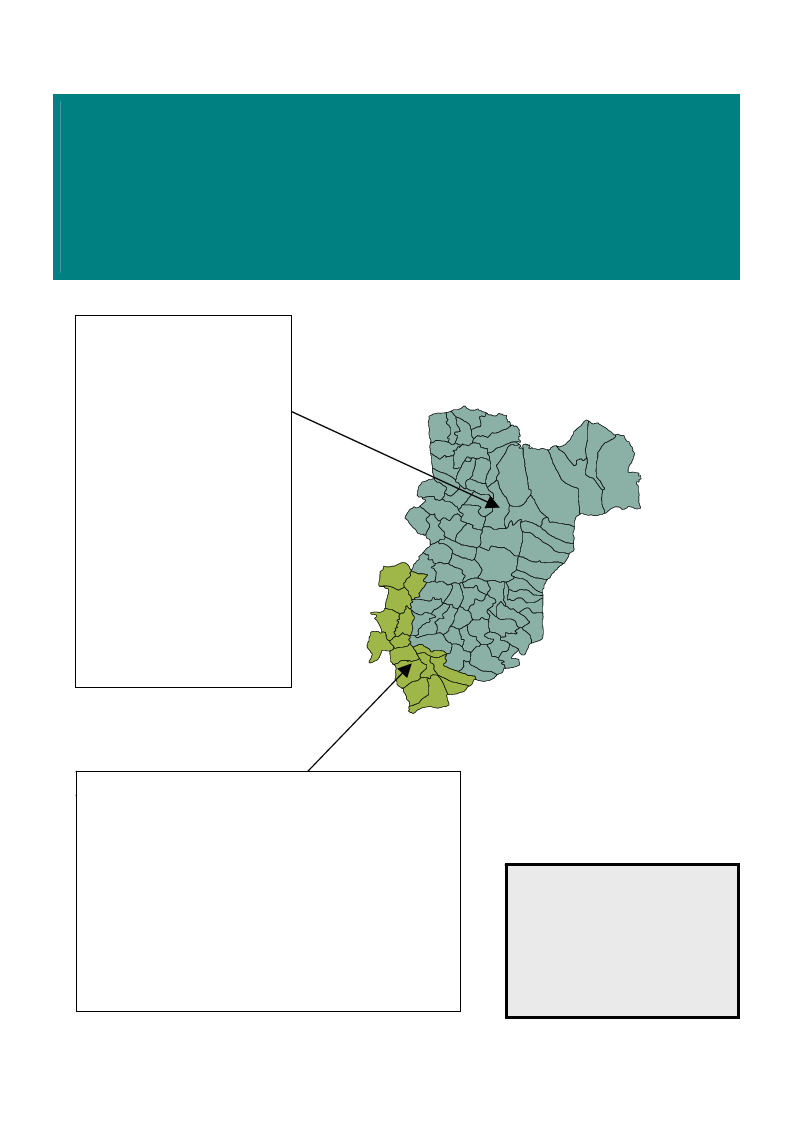
SNNPR Livelihood Zone Reports
Alaba Woreda
Alaba SW Administrative Zone
Alaba-Mareko Lowland
Pepper Livelihood Zone
This relatively food secure zone
has a valuable cash crop
industry that attracts migrant
laborers from other zones. The
population is relatively sparse
and land-holdings are large
enough to allow even poor
households to grow nearly 60%
of their food needs, and to earn
60% of their cash earnings
through the sale of peppers.
Livestock production, especially
cattle, is important including for
the poor through butter sales .
Rain failure has affected
production in recent years, but
floods from the neighboring
highlands are also a frequent
problem although at the same
time as causing damage they
deposit fertile silt.
Badewacho-Alaba Maize Livelihood Zone
LBoawdapowpauclahtioo-nAdleanbsaityM, areizlaetivLeilvyelalirhgoeoladndZhoonldeings per
efyLmatmHihehpcslaisahveroogencogooaoaiaemlaoururvwruwupritiosrnrilcsshkoarrscf.e-tpueeeooeooegi,emTvzolhhnotuccytwiesehpnuoomoakdso,reitrullfretw,lodrdaesiokahlnefhpbga,salhonegiccdograetpflitotyeolieleleluooseatrdfdivdhsnsotodidont,ocetuetdrfidaeaafgconndcrysluarfnnarergtreefetpcogiiodattnopnaairtphSrmatpaionosionrfhseacdhelnsvioepend,turfraidynaroadhwtlpiehims,itoisnrcaelfulriherituerntcgosaarmehtaahrrae-hhsvinetlmmczoaailgsoiiectldsreeuptiisoieoesisznilesvssrztaoannoestioee,orsoairdndeounedelhwanytu.irymccuclronceshtcHetooeoclhheld.,aaiidaatmnnlvoaeeHaiirsrdoaonetdwgt.neomfntyueefameTweedwofeecvcaovifhnloonaiaafaeaeceviovenidrrarnnvenertdikwsnrh,enbdsamaoeieioffnhrdsahsioont,rddaiasson.rrtmampzer,iosliaBckpdtosrgenhaoemmoienasdnnoaeidtzoeyteeegtannaaueorb.dgasfi-epgcnoniecaanmrtlrdrretiotrtoipese-sniorset-rholtleaifnfngt
sinocmluedicnrgopSshaanshdalimveesnteo.ck, poor households make ends meet
by a variety of economic activities, including casual labor,
selling firewood, and petty trade.
Note: This map
shows the pre-2005
census boundaries
N for Alaba woreda,
W fromE which the ‘new’
Alaba woreda was
S
split in 2005.
Contents
Map & livelihood zone description
Population by livelihood zone
Livelihood zone profiles
Key parameters for monitoring
355
SNNPR Livelihood Profile
Population by Livelihood Zone and Kebele (2005)
Woreda:
Zone:
Alaba
Alaba Sw
Woreda population
162,856
Livelihood Zone:
Livelihood Zone:
Livelihood Zone:
Alaba-Mareko Lowland Pepper LZ Badewacho-Alaba Maize LZ
LZ Population:
Population by Kebele:
1Gna Anesha
1Gna Tefo
1Gna Tuka
2Gna Anesha
2Gna Choroko
2Gna Tiefo
2Gna Tuka
Aduna Cholekesa
Aduna Mieno
Ajou Hulako
Alemet Tena
Amata
Anedegna Konecha
Aneshowara Boti
Ayimele
Benede Cholekesa
Besheno
Chubare Mino
Debeso
Felaka
Gedeba
Geremi
Goba Sherero
Gofesa
Gurera Bucho
Habiebo Ferena
Hnetezu Bebisa
Hulategna Konecha
Kuenecho Yayo
Kufa
Kulebi
Layagnawe Bedene
Layagnawo Tuka
Layignawe Lieneda
Negele Wedesha
Rokenenie Tefo
Sanebieta
Soregie Daregosa
Tachegnawo Liened
Tefo Tefo
Tita Libi Tora
Yiamebo
117,574 LZ Population:
45,282 LZ Population:
Population by Kebele:
Population by Kebele:
3,119 1Gna Choroko
3,273
2,637 1Gna Mekala
2,723
2,570 2Gna Mekala
4,760
2,748 Alo Leka
3,997
2,741 Asere
2,583
1,895 Ashoka
4,717
2,045 Chamobula
3,351
2,359 Galeto
1,813
1,674 Hola Geba Kuke
3,812
2,129 Meja
2,580
2,313 Muda Meyafa
3,253
2,481 Shekatana Weladey
3,016
2,086 Tachgnawe Beydene
2,629
2,478 Wenejana Weladeya
2,777
2,356
3,756
6,306
2,644
2,095
2,556
2,691
2,322
4,031
2,782
3,210
2,387
6,181
1,594
2,652
4,010
3,824
2,919
3,571
2,689
1,880
1,670
4,963
3,482
2,606
1,708
1,392
2,020
Note: The 2005 woreda population is that estimated by the Central Statistical Authority. The list of
kebeles in the woreda was taken from the 1994 census and each kebele's 2005 population
calculated by multiplying the 1994 census figure by the increase in total woreda population since
1994. Information from the 1994 census was used in preference to other sources of information
since this represents the main offical source of population data for the woreda. Difficulties were
encountered due to changes in woreda and kebele boundaries since 1994. A number of woredas
have been split since 1994. For as many of these as possible, kebeles existing in 1994 were
divided between the newly formed woredas, based upon information obtained at regional and/or
woreda level. Where kebeles have been renamed or split since 1994, woreda officials were asked
to assign the old 1994 kebele to one or other livelihood zone in the woreda. It was sometimes not
possible to locate a kebele (e.g. because woreda officials did not recognize the name or did not
include the kebele in their list). In these cases a 'not assigned' category has been included in the
population analysis.
356
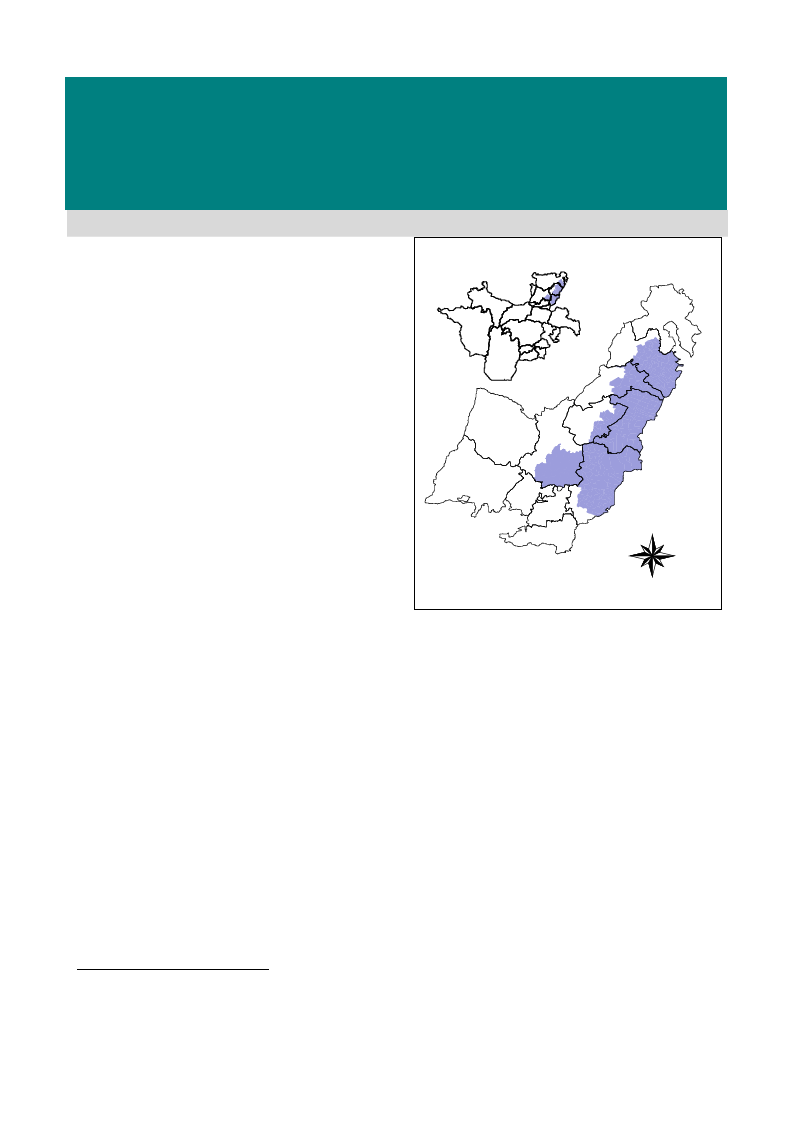
SNNPR Livelihood Profile
Alaba-Mareko Lowland Pepper Livelihood Zone
June 20051
Zone Description
The Alaba-Mareko Lowland Pepper Livelihood Zone is a
relatively food secure area of SNNPR that attracts migrant
labourers from nearby livelihood zones. Households in this
livelihood zone rely on long cycle crops and consequently
any fluctuation in rainfall distribution during the meher
Sodo
season (either insufficient or excessive rainfall) reduces food
and cash incomes at household level. However, if the rains
are optimal, surplus production is possible due to the
Meskanina
Mareko
relatively fertile soils.
Silti
This livelihood zone covers a number of woredas in Hadiya,
Siltie and Gurage Administrative Zones and Alaba special
woreda. The landscape of the zone is flat and short
indigenous shrubs, eucalyptus and acacia trees dominate the
Konteb
Dalocha Lanfro Oromiya
Region
vegetation of the livelihood zone. Remote areas have a
more dense vegetation cover.
The zone is located between the high grounds of Gurage,
Siltie and Hadiya to the west and the Rift Valley to the east.
While the northern part of the zone falls within the
Awash/Rift Valley drainage system, the southern part
Limo
Soro
Angacha
Alaba
Kedida
Gamela
Badawacho
N
belongs to the Omo drainage system. Rains in the
W
E
surrounding highlands cause flooding in Shashego every
year. The flooding temporarily displaces households and
S
damages the meher crops. Although the flooding brings
a benefit in the form of fertile soil (silt) from the highlands, it also partially submerges most of the houses, resulting in
high annual maintenance costs. To control flooding, efforts are required in both the highlands and lowlands.
The zone is sparsely populated and, as a result, households own relatively large areas of land. Mixed farming is the
main livelihood pattern. The cultivation of cash and food crops, as well as animal rearing, are the main sources of both
food and cash income for the majority of households. The main food crop is maize and the main cash crop is pepper.
Other crops include wheat, sorghum, teff and millet. The sale of pepper is the most important source of income for all
wealth groups. A decline in pepper production results in reduced cash income and reduced access to purchased food and
non-food items. The main livestock types reared are cattle, goats, sheep and donkeys.
Access to markets for many farmers in the zone is inadequate due to poor infrastructure and lack of affordable
transportation. In addition, a good local market information network is lacking. The establishment of farmer
cooperatives may help farmers acquire access to credit, technology and information. Cash employment opportunities
may help households to compensate production losses and help improve access to markets in both good years and bad.
There is no labor migration out of the zone; rather, people from outside migrate into the zone in search of work. Local
employment opportunities are limited, however, and are generally restricted to agricultural work. Some poor households
engage in this type of work, but the majority do not.
1Fieldwork for the current profile was undertaken in February and June 2005. The information presented refers to the consumption
year from August 2003 to July 2004 (or Nehase 1995 – Hamle 1996 in the Ethiopian calendar), which was a relatively average year
by local standards (i.e. a year that was neither especially good nor especially bad in terms of food security, when judged in the
context of recent years). Provided there are no fundamental and rapid shifts in the economy, the information in this profile is
expected to remain valid for approximately five years (i.e. until 2010).
357
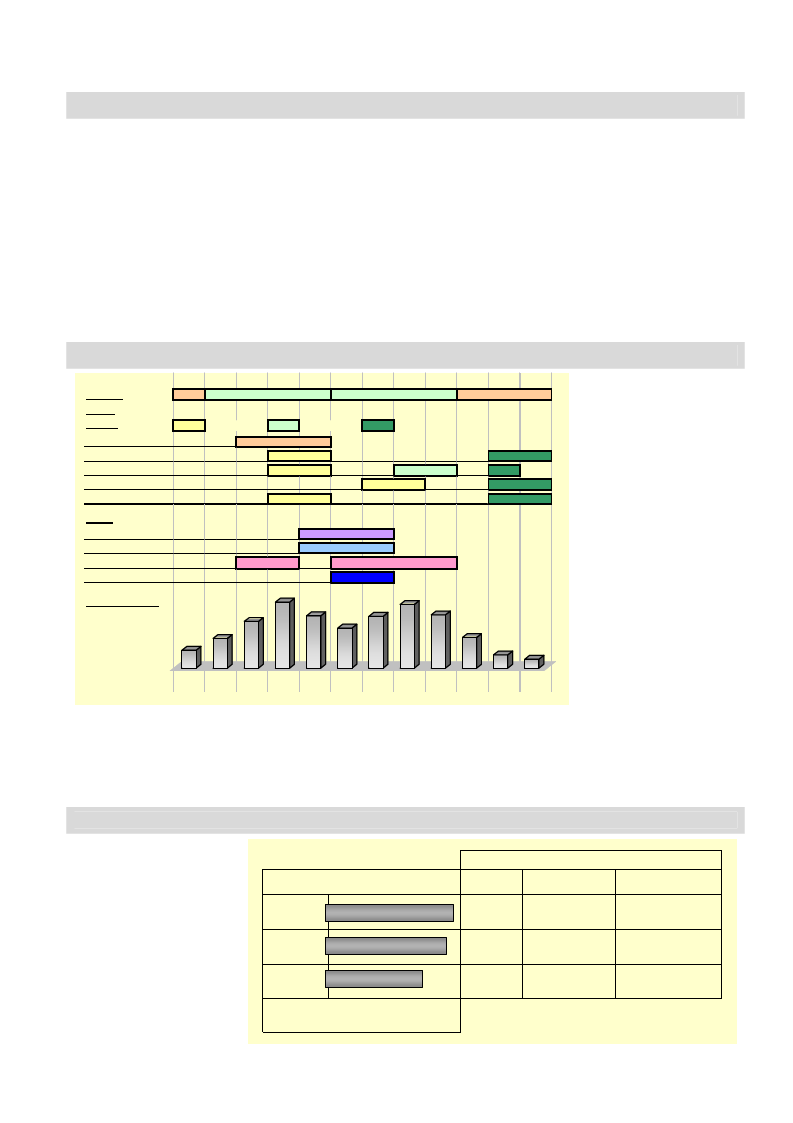
2
Markets
The major markets in the zone are Butajira (Meskan woreda), Worabe (Dalocha woreda), Kulito (Alaba special woreda),
Koshe (Mareko woreda) and Bonesha (Shashego woreda). There is a big variation in the sphere of influence of both
markets. While the range of influence of Bonesha encompasses a small geographic area, that of Butajira and Kulito
stretches as far as Addis Ababa. The importance of Worabe as a market center is associated with the establishment of Siltie
as a separate administrative zone in 2003. This livelihood zone is one of the major suppliers of pepper to Addis Ababa as
well as other parts of the country.
Because of their central location between the densely populated south and Addis Ababa to the north and the availability of
commercial facilities such as communication networks and stores, Butajira and Kulito attract pepper traders from far and
wide. Although the pepper production in Shashego Woreda is as significant as in Alaba, Gurage and Siltie, bad
infrastructure has deterred commercial interaction with external markets.
There are some specialized markets where specific items are exchanged. Doesha, in Shashego, is a major specialized
market for livestock trade. Doesha serves as a livestock market for the local population and as a transit and centre of
exchange for livestock traders from Arsi (Oromiya) and Hossana, Dalocha and Siltie.
Seasonal Calendar
Seasons
Crops
Legend
Land preparation
Pepper
Maize
Teff
Sorghum/millet
Other
Hunger season
Food purchases
Milk production
Floods
Rainfall Pattern
Jan Feb Mar Apr May Jun Jul Aug Sep Oct Nov Dec
Dry
Belg
Meher
Dry
planting
cons. green
harvest
Jan Feb Mar Apr May Jun Jul Aug Sep Oct Nov Dec
Source of rainfall data: National Meteorological Service Agency (NMSA) Data Archives (long-term average).
The zone depends mostly
on long cycle crops and
agricultural activities
occur from March until
November. Land
preparation usually begins
before the kremt rains and
harvesting of the long
cycle crops starts in
November.
The months of May to
July are described as the
hunger season, the period
when household grain
reserves are depleted and
households depend on the
market for their food
needs. As household food
demand increases and
market supply shrinks,
food prices increase
during these months.
The prices of staple foods tend to follow the agricultural season and the amount harvested. Food prices steadily increase
until harvest and then decline as the harvest yields more supply. Poor production at harvest time in a bad year may prolong
(or exacerbate) the period of high staple prices, just as good production will keep prices low for longer. This is also true for
the main cash crop in the zone. Poorer households tend to sell their harvest immediately after harvest, while better off
households may sell some of the harvest immediately and store a portion to sell later when prices are more favourable.
Wealth Breakdown
Wealth at the household
level is determined primarily
by two factors: (i) the size of
land cultivated and (ii) the
number of livestock owned.
Cattle, particularly plow
oxen, are the most important
productive assets. By
contrast, shoats are kept
mainly to generate cash
income on a regular basis.
Wealth Group Information
HH size Land area cultivated
Livestock
Poor
5-6
0.75 - 1.25 ha
0-2 cattle, 1-3 shoats
Middle
6-7
Better-off
6-8
0% 10% 20% 30% 40%
% of population
1.25 - 1.75 ha
1 plow ox, 2-4 cattle, 5-
7 shoats, 1 donkey
2 - 3 ha
2 plow oxen, 5-6 cattle,
6-8 shoats, 1-2 donkeys
Alaba-Mareko Lowland Pepper Livelihood Zone
358
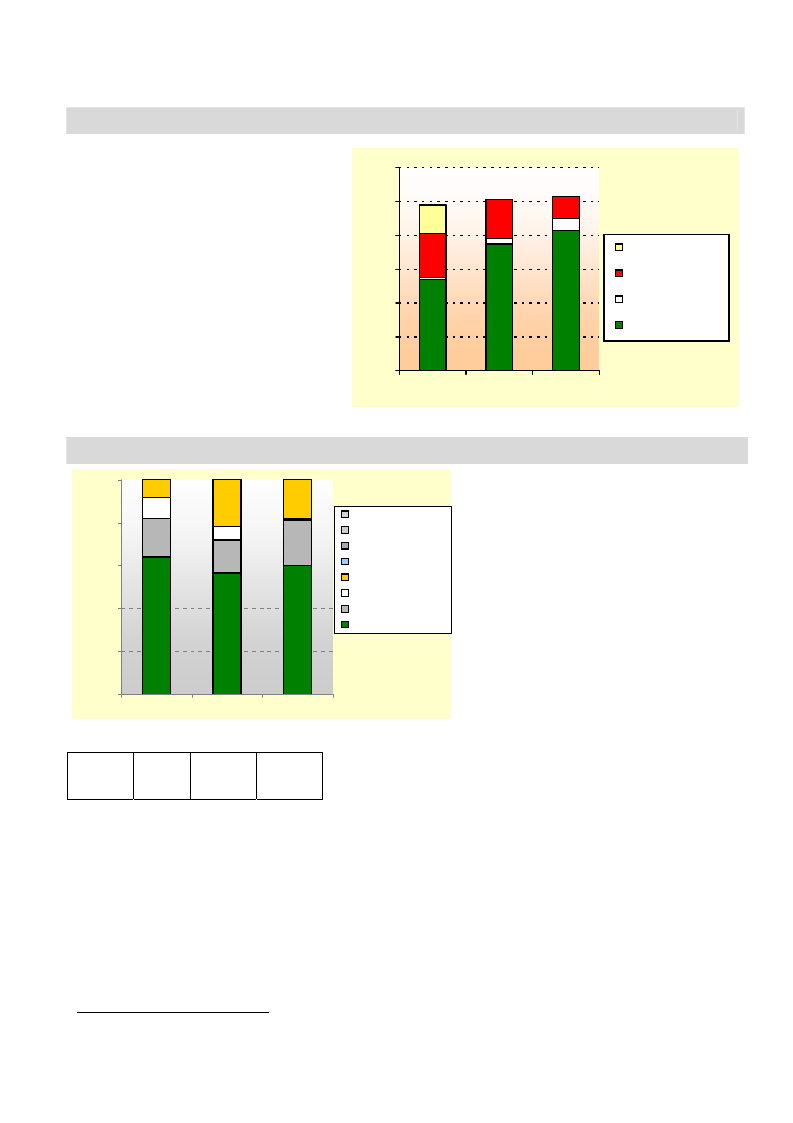
3
Ownership of a pair of oxen enables better off households to rent in the land of poor households for a share of half or more
of the crop after harvest.
Sources of Food: An average year (2003-04)
The graph shows the pattern of access to food
for different types of household in a year of
average crop production (2003-2004). Own
crop production was the most important source
of food for all wealth groups in that year and its
contribution to annual food requirements
increased with wealth. The contribution of
livestock products (milk and butter) was small,
but also increased with wealth. In contrast, the
contribution of purchased food (mostly maize,
sorghum and meat) decreased with wealth.
Only poor households benefited from relief
assistance.
Better off and middle households had similar
options for obtaining food. However, the
relative contributions of the food sources varied
because of differences in land and livestock
holdings and in the use of agricultural inputs.
120%
100%
80%
60%
40%
20%
food aid
purchase
livestock products
own crops
0%
Poor
Middle Better off
Food access is expressed as a percentage of minimum food requirements, taken
as an average food energy intake of 2100 kilocalories per person per day.
Sources of Cash: An average year (2003-04)
100%
80%
60%
40%
20%
other
petty trade
self-employment
employment
livestock sales
l/stock prod. sales
other crop sales
pepper sales
0%
Poor
Middle
Better off
The graph provides a breakdown of total cash income according to income
source.
Annual
income
(ETB)
800-
1200
1500-
2500
2500-
3000
The graph presents the sources of cash income
for households in different wealth groups for
the period August 2003 – July 2004.2 The sale
of crops, livestock and livestock products
(mainly butter and eggs) were the income-
generating options common to all wealth groups
in the reference year. The amounts of income
obtained from these sources differed
significantly by wealth group, however,
resulting in a nearly three-fold difference in
total cash income between poor and better off
households.
The quantities of pepper sold ranged from about
100-150 kg for poor households to 250-350 kg
for better off households in the reference year.
Middle and better off households typically
obtained a better price for their pepper
compared to poor households.
2 It should be noted that incomes are slightly lower than the average in Shashego woreda than in other parts of this livelihood zone.
This is because market access is difficult due to poor roads. As a result, farmers have difficulty marketing their production.
Alaba-Mareko Lowland Pepper Livelihood Zone
359
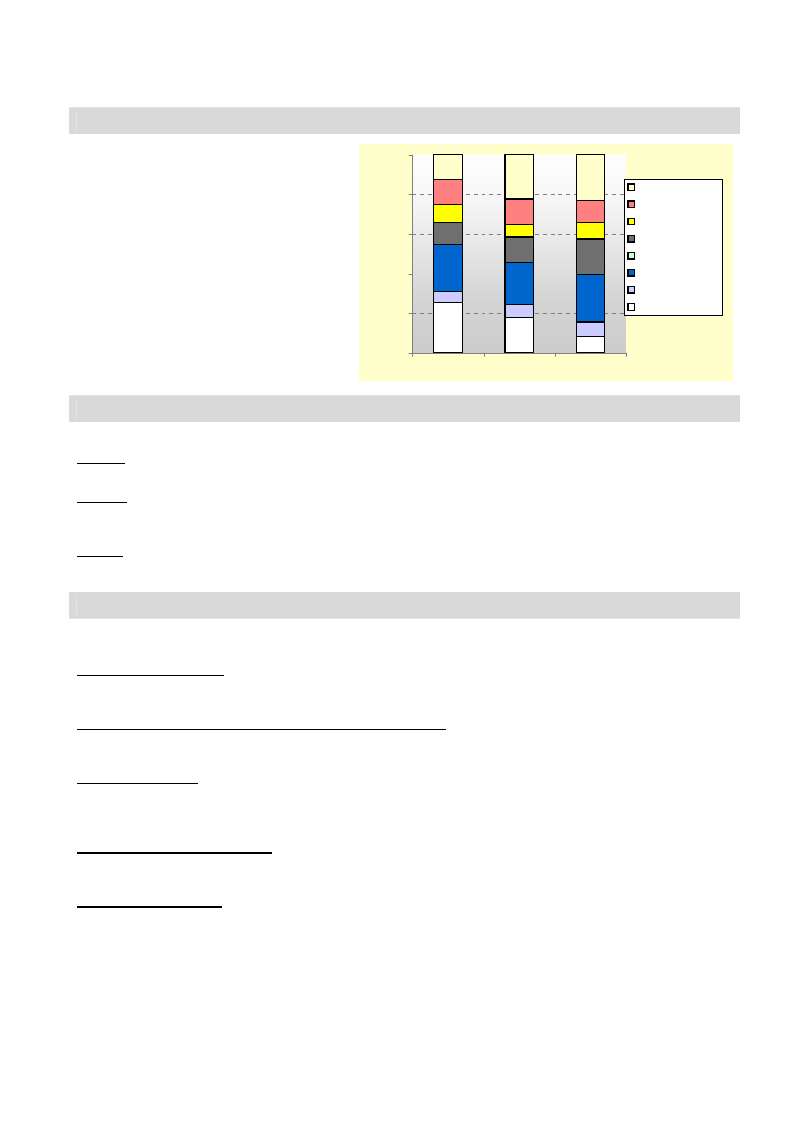
4
Expenditure Patterns: An average year (2003-04)
The graph presents the expenditure patterns for
the period August 2003 – July 2004. The most
obvious difference between the wealth groups
is the percentage of expenditure on staple food.
About a quarter of poor household income
went toward the purchase of staple food,
compared with less than 10% in the case of the
better off.
The category ‘household items’ includes
coffee, salt, soap, grinding and kerosene.
‘Other’ includes tax, social obligations,
ceremonies and savings. ‘Inputs’ includes
livestock drugs, seeds, fertilizer and, in the
case of the better off, agricultural labor.
Expenditure on most items (except staple food)
increased with wealth.
100%
80%
60%
40%
20%
0%
Poor
other
clothes
social serv.
inputs
water
HH items
non-staple food
staple food
Middle Better off
Hazards
The main hazards affecting the zone are:
Drought. Mixed farming is the main means of livelihood and agriculture is entirely rainfed in this livelihood zone.
Frequent drought has been the main cause of production failure in recent years.
Flooding. Flooding is a recurrent hazard that forces people to leave their localities in June and July every year. Flooding
is always the result of the rains in the neighboring highlands. In some instances, untimely rains in the highlands cause
unexpected flooding in the lowlands (particularly in Shashego woreda) and claim human and animal life.
Malaria. Malaria is one of the leading causes of morbidity throughout the year. It reduces labor availability and forces
households to expend precious income on medicines. Unlike other mosquito-infested areas, malaria is not a seasonal
phenomenon in this livelihood zone and occurs throughout the year.
Response Strategies
Households pursue a number of strategies to cope with hazards. The main strategies for the Alaba-Mareko Lowland
Pepper Livelihood Zone are as follows:
Increased sale of livestock. This is an option for better off and middle households only, since poor households have such
small livestock holdings. Most households try to maintain their productive assets until all efforts to protect asset depletion
are exhausted.
Switch expenditure towards the purchase of cheaper staple foods. All wealth groups reduce non-food expenditure by
either purchasing lower quality items or reducing the quantity, or both. Expenditure that is ‘saved’ in this way can then be
used to purchase cheap staple foods.
Increased land rental. Renting and selling land was previously a common practice in this livelihood zone. Although a
permanent transfer of land through sale is constitutionally prohibited, there was sale of land through traditional agreements
until recently. Due to government intervention, the sale of land is no longer practiced. However, renting land to better off
households is widely practiced by the poor, particularly in years of poor crop production.
Reduced number of meals per day. A shift in consumption patterns is another response strategy employed by all wealth
groups. Though the extent to which the different wealth groups deviate from the normal consumption habit varies, all
households tend to rely on a lower quality and quantity of food in bad years.
Short distance migration. Households residing in the flat lowlands migrate to the nearby highlands in June and July. The
movement of people with their livestock is a reciprocal seasonal interdependence between the highlanders and the
lowlanders. The highlanders in turn move their livestock to the lowlands to share the pasture in the lowlands during the
dry season. The pasture that thrives after the floodwaters recede is generally sufficient to support local livestock as well as
the livestock of the highlanders.
Alaba-Mareko Lowland Pepper Livelihood Zone
360

5
Indicators of Imminent Crisis
The graphic presents the
Season Month Indicator
likely sequence of
indicators in the lead up
to a food or income
crisis. There is a wide
range of key indicators
Belg
season
Dry
Feb
Mar
Apr
May
Jun
Delayed start to or failure of belg rains
Early cessation or poor distribution and intensity of belg rains
Excessive flooding during June-July
for the zone, including
Meher Jul
those related to rainfall,
season Aug Delayed start to green maize harvest
staple food prices, and
Sept Early cessation or poor distribution and intensity of kremt rains
the timing and quantity
Oct
of harvests.
Dry
Nov Unusually high staple food prices during and after main harvest period
Maize is the main staple
food. The consumption
season
Dec Low prices for pepper during and after harvest period
Jan
of green maize plays an
important role as a means of escaping the hunger season, particularly in August and September. If the belg rains are late,
this delays the start of the green maize harvest and prolongs the hunger season.
As pepper is the only cash crop and the main income-generating option in this livelihood zone, production failure or
decreased prices present a severe economic challenge for all wealth groups. Pepper prices are determined not only by
production in this livelihood zone, but also by production in other pepper-producing areas, and should be closely
monitored.
Alaba-Mareko Lowland Pepper Livelihood Zone
361
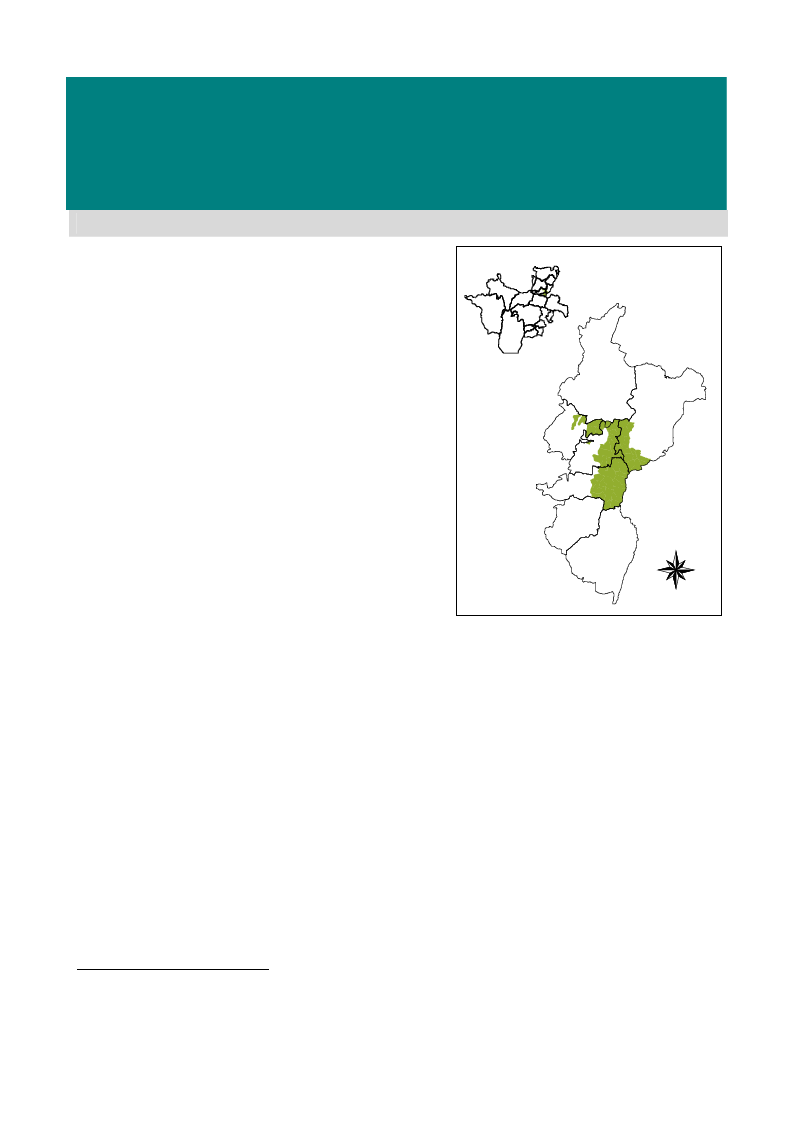
SNNPR Livelihood Profile
Badewacho-Alaba Maize Livelihood Zone
March 20051
Zone Description
Low population density, relatively large landholdings per
household, flat and fertile soils, and a woina dega agro-ecology
together provide a conducive environment for agricultural
production in the Badewacho-Alaba Maize Livelihood Zone.
Mixed farming is the means of livelihood for households and
agriculture is predominantly rainfed. Maize is the major food crop,
and in years of good production, the zone supplies a large amount
of green maize to Addis Ababa and nearby markets. However, the
limiting factor to agricultural production is rainfall, and recurrent
drought has been the cause of frequent production shortfalls in
recent years.
The Badewacho-Alaba Maize Livelihood Zone includes part of
Alaba Special Woreda and most of Badawacho Woreda. It is
located along the Addis-Arba Minch road, which is one of the
major commercial lifelines of the country. Relatively good access
to major nearby markets (Wolayita, Shashamene, Kulito and
Awassa) and distant markets (Addis Ababa) offers a special
advantage to this livelihood zone. Access to local markets is also
fair, as there are two relatively large markets in Shone and Hadilo.
Limo
Angacha
Kedida
Gamela
Alaba
Badawacho
Oromiya Region
Damote Gale
The landscape is flat and much of the area is deforested. Scattered
indigenous shrubs and eucalyptus trees dominate the remaining
vegetation.
Damot Weyde
N
W
E
The livelihood pattern is primarily dedicated to rainfed crop
S
production. The main staple food crop is maize, which is
supplemented with haricot beans, sorghum, and finger millet. The dominant cash crops are teff and maize. Poor
households grow the same crops as middle and better off households, but to a lesser extent. Middle and better off
households use improved seeds and fertilizers. Better off households employ poor household members for land
preparation, weeding, harvesting and threshing. Poor households rent out their land and sell their manual labor locally
to better off households. They cannot afford many agricultural inputs.
The majority of households in the zone either own or have access to some livestock. For the poor, one sheep and goat
may be owned or accessed through a yerbee contract, whereby they look after livestock of better off households and in
return are allowed to take the milk and a share of the progeny. Middle households are in a more secure position and
own small stock, cattle and at least one ox. The better off have more livestock than other households, owning at least
two oxen and a small herd of cattle. Livestock graze on communal grazing lands. After the harvest, farmers let the
cattle roam the fields to consume the crop residues.
For all households, agricultural production is the most important food source, followed by market purchase. For the
poor, food aid has been equally if not more important than purchased food in recent years. Households obtain most of
their cash income from crop, livestock and livestock product sales. Poor households supplement these sources with
firewood sales, small-scale petty trade, and casual employment. Casual employment includes both local agricultural
work for better off households (particularly during the planting and harvesting seasons) and migratory work (in the
neighboring Alaba-Mareko Lowland Pepper Livelihood Zone and on state sugarcane plantations in Oromiya).
1Fieldwork for the current profile was undertaken in February-March 2005. The information presented refers to the consumption
year from July 2003 to June 2004 (or Hamle 1995 – Sene 1996 in the Ethiopian calendar), which was a relatively average year by
local standards (i.e. a year that was neither especially good nor especially bad in terms of food security, when judged in the context
of recent years). Provided there are no fundamental and rapid shifts in the economy, the information in this profile is expected to
remain valid for approximately five years (i.e. until 2010).
362
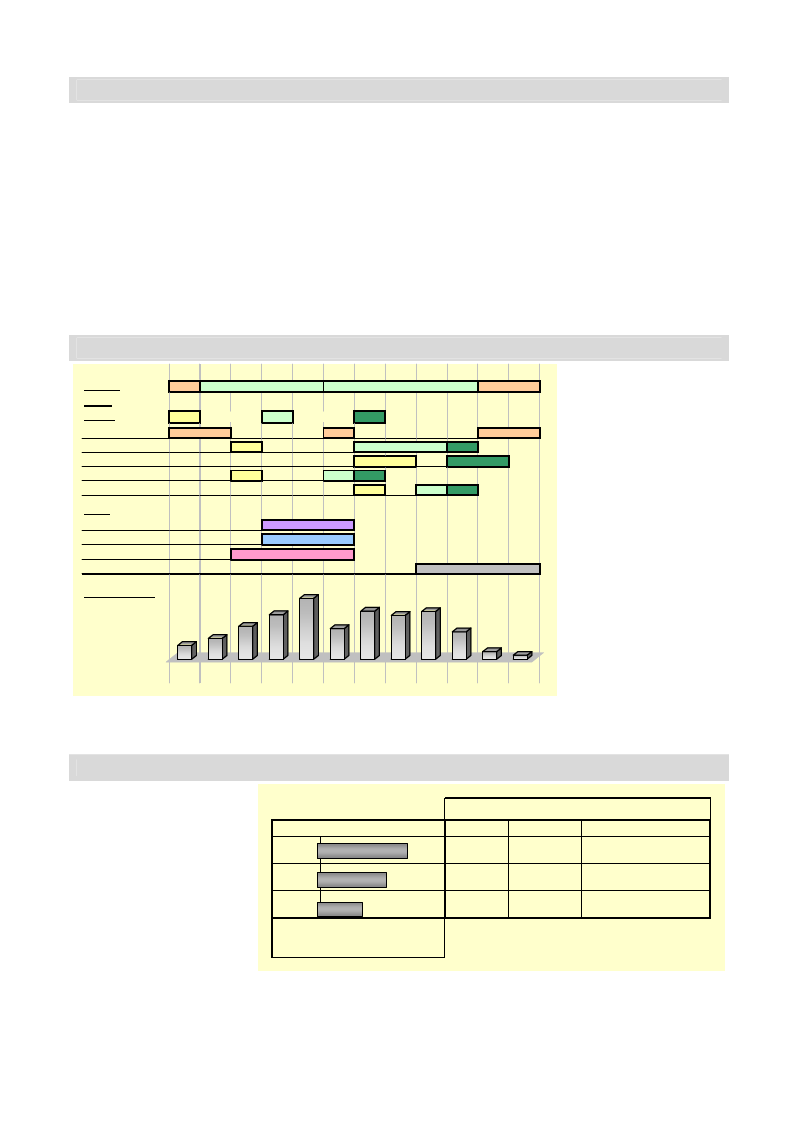
2
Markets
The principal food and cash crops are maize and teff and nearly every household grows these crops to a certain extent.
Green maize is produced and consumed by all households, but is sold primarily by the better off and is exported outside
the zone to the market in Addis Ababa. Livestock sales are also important in terms of cash income, but are more
important for the middle and better off households than for poor households.
Market access for the majority of households in the zone is fair due to the tarmac road that demarcates the zone’s
western border. Only households that live in the eastern part of the zone have difficulty reaching the market, especially
in the rainy season when feeder road conditions are poor.
The Shone market is the largest market in the zone and is where most households go to purchase staple foods and sell
agriculture and livestock products. The Hadilo market, which is situated along the main tarmac road, is the zone’s
principal market for shoats.
As in many other areas in the region, agricultural production determines the market price of staple food in the zone.
When there is a good harvest prices remain low until May, when household reserves become depleted. At this time,
poor households rely on the purchase of maize, enset and sweet potato until the next green maize harvest.
Seasonal Calendar
Seasons
Crops
Legend
Land preparation
Maize
Teff
Haricot beans (1)
Haricot beans (2)
Jan Feb Mar Apr May Jun Jul Aug Sep Oct Nov Dec
Dry
Belg rains
Meher rains
Dry
planting
cons. green
harvest
Other
Hunger season
Food purchases
Livestock sales
Labor migration
Rainfall Pattern
Land preparation occurs
before and at the start of the
two rainy seasons. Maize
and haricot beans are planted
in March, while teff and a
second season of haricot
beans are planted in July.
Green maize becomes
available in July, together
with the first bean harvest,
marking the end of the
hunger season. The main
harvest period for maize, teff
and second-season haricot
beans occurs in October –
November.
The months of April to June
are the hunger season, the
period when household grain
Jan Feb Mar Apr May Jun Jul Aug Sep Oct Nov Dec
reserves are depleted and
many households depend on
Source of rainfall data: National Meteorological Service Agency (NMSA) Data Archives (long-term average). the market for their food
needs. As household food
demand increases and market supply shrinks, food prices increase during these months. Livestock sales peak during
these months, as households sell their livestock in order to obtain cash to purchase food.
Wealth Breakdown
The main determinants of
wealth in this zone are land
Wealth Group Information
ownership and livestock
HH size Land cultivated Livestock
holdings. Better off households Poor
own more land and rent in
6-7 members 0.5 - 1 ha
0-1 cattle, 2-4 shoats
additional land from poorer
households. Since they usually
do not have enough household
members to cultivate their land,
Middle
Better-off
6-8 members
7-8 members
1 - 1.5 ha
1.5 - 2.5 ha
1 ox, 4-6 cattle, 4-8 shoats, 1
donkey
2 oxen, 5-9 cattle, 6-10 shoats,
1 donkey
better off households hire local
laborers to assist in food and
0%
20%
40%
60%
% of population
cash crop cultivation. They are
better able to afford agricultural
Inputs, such as improved seed (for maize and teff), inorganic fertilizers and pesticides, than other wealth groups. These
households also have larger herds of livestock, including a pair of plow oxen.
Middle households cultivate less land than the better off (1-1.5 hectares) and therefore produce less food and cash crops.
Badewacho-Alaba Maize Livelihood Zone
363
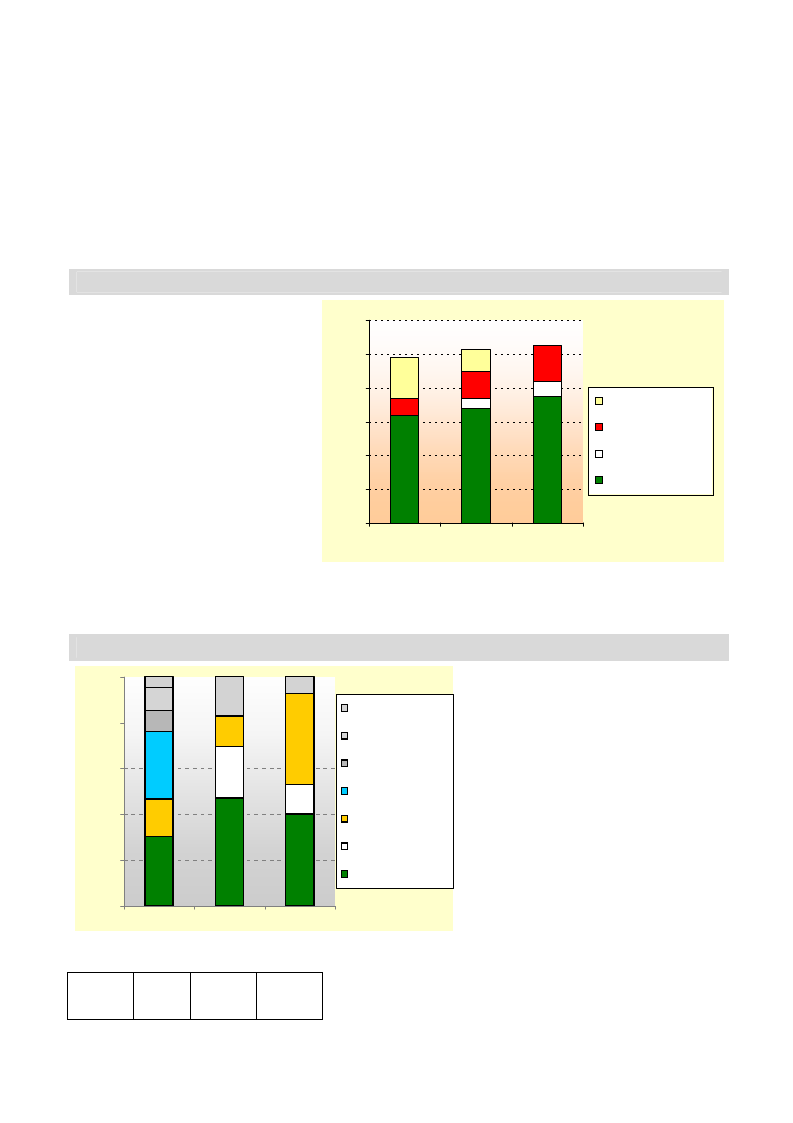
3
Like the better off, middle households invest in agricultural inputs, but to a lesser degree. Their livestock herd is smaller
than the better off as they have limited resources (land, capital, and labor) to maintain a larger herd. Furthermore,
middle households own only one plow ox. To compensate, middle households borrow and lend oxen to plow their land.
Poor households cultivate small plots of land (less than 1 hectare). Due to their limited agricultural resources (i.e. oxen
and inputs), the poor rent out some of their land to the better off. On the remainder of their land, they cultivate some teff
(for cash) and food crops such as maize, haricot beans, sweet potatoes and local vegetables. For the majority of poor
households, livestock ownership is limited to a couple of goats or sheep and some chickens. In some areas, their
livestock is held in yerbee. As mentioned above, this is an agreement between better off and poor households, whereby
the better off give livestock to the poor, who feed them in exchange for a predetermined number of offspring. Unlike
the other two wealth groups, the poor lack livestock products and obtain less income from livestock sales. Furthermore,
the lack of plow oxen constrains the amount of land the poor can cultivate and, therefore, the amount of food and cash
income they can obtain through crop production.
Sources of Food: An average year (2003-04)
The graph shows the pattern of access to
food for different types of household in a
year of average crop production (2003-
2004). Own crop production was the most
important source of food for all wealth
groups in that year and its contribution to
annual food needs increased with wealth.
If households consumed all of the teff they
produced, rather than selling it, the
contribution of own crop production
would be much higher. However, it
makes economic sense to sell teff, a high
value crop, and purchase cheaper cereals.
120%
100%
80%
60%
40%
20%
food aid
pur chas e
livestock products
ow n crops
Own crop production and market purchase
were common sources of food for all
wealth groups, but other options were
0%
Poor
Middle Better off
important to specific wealth groups. Poor
and middle households benefited from
relief assistance, while livestock products
Food access is expressed as a percentage of minimum food requirements, taken as
an average food energy intake of 2100 kilocalories per person per day.
were relevant to better off and middle households only. In recent years, food aid has been distributed every year in this
livelihood zone.
Sources of Cash: An average year (2003-04)
100%
80%
60%
other
petty trade
self-employment
casual employment
The graph presents the sources of cash income
for households in different wealth groups for the
period July 2003 – June 2004. For the better off
and middle wealth groups, the sale of own
crops, livestock and livestock products were the
most important means of generating cash
income. These households also obtained some
income from ‘other’ sources, including the sale
of eucalyptus poles and straw.
40%
livestock sales
l/stock prod. sales
20%
crop sales
0%
Poor
Middle
Better off
The graph provides a breakdown of annual cash income according to income
source.
Annual
income
(ETB)
800-
1200
1500-
2000
2500-
3000
Casual employment, both local and migratory,
was the main alternative cash income source for
poor households. Any hazard affecting crops
not only affects their own crop production but
also their income from local employment, as
better off households tend to employ less
external labor in bad years.
Poor households supplemented their main
income sources with self-employment and other
income
sources, which include firewood sales, very
small-scale trading and renting out their land.
Badewacho-Alaba Maize Livelihood Zone
364
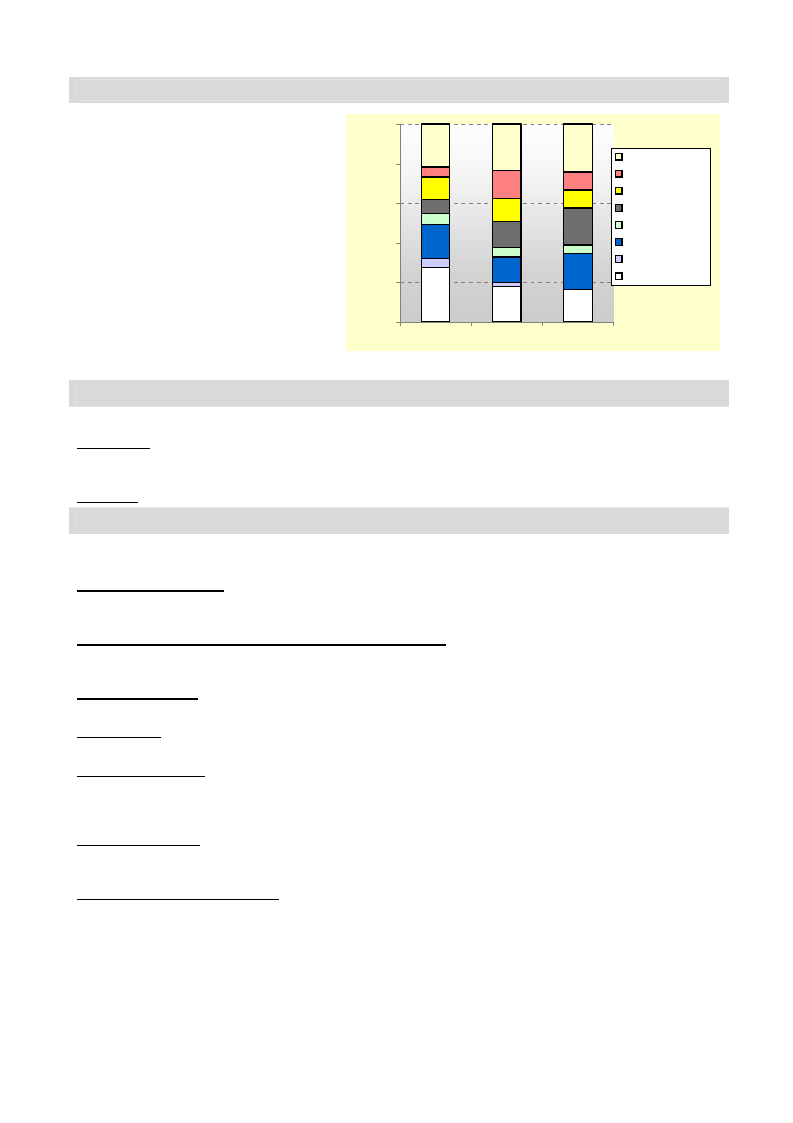
4
Expenditure Patterns: An average year (2003-04)
The graph presents the expenditure patterns
for the period July 2003 – June 2004. The
most obvious difference between the wealth
groups is the percentage of expenditure on
staple food. About 25-30% of poor
household income went toward the purchase
of staple food, compared with about 15% in
the case of the better off.
The category ‘household items’ includes
coffee, salt, soap, grinding and kerosene.
‘Other’ includes tax, social obligations,
ceremonies and savings. ‘Inputs’ includes
livestock drugs, seeds, and fertilizer.
Expenditure on most items (except staple
food) increased with wealth. Unlike many
other livelihood zones, households expend
money on water in this livelihood zone.
100%
80%
60%
40%
20%
0%
Poor
other
clothes
social serv.
inputs
water
HH items
non-staple food
staple food
Middle Better-off
Hazards
The main hazards affecting the zone are:
Erratic rains. Mixed farming is the main means of livelihood and agriculture is entirely rainfed in this livelihood zone.
Inadequate and uneven distribution of rainfall is the major recurrent hazard that affects crop production. In addition,
hailstorms in August – October can damage crops.
Crop pests. Stalk borer is a problem for maize production in this livelihood zone, reducing yields in some years.
Response Strategies
Households pursue a number of strategies to try and cope with hazards. The main strategies for the Badewacho-Alaba
Maize Livelihood Zone are as follows:
Increased sale of livestock. Middle and better off households may increase the sale of their livestock in order to
purchase more food. Middle may sell 1 or 2 extra goats, while better off households may be able to sell more shoats and
possibly a calf. If the situation is serious they may sell more livestock and possibly an ox.
Switch expenditure towards the purchase of cheaper staple foods. All households in the zone may reduce their
non-food expenditure to purchase more food, and also may buy cheaper foods such as kocho (enset ‘bread’), sweet and
Irish potatoes.
Increased land rental. Poor households rent out all of their cultivable land and increase their labor sales in bad years.
Middle households sometimes also implement this strategy, especially if they forecast a poor harvest.
Firewood sales. Although the poor normally rely on firewood sales as a source of cash income, they may increase
firewood sales either by cutting their own tree reserves or wild trees.
Increased sale of labor. This is an important strategy employed mostly by poorer households, but middle households
may also sell their labor. Within the zone, labor is expanded to the off-farm sector, road construction, and/or
development projects, if available. Many laborers also migrate to the sugar plantations in Wonji and Methara to find
work.
Increased grain trade. Households buy cheaper staple foods in the market in Serado and transport them to the more
expensive market in Shone. This option is often employed by the middle and better off households, but some poorer
households may borrow cash from other to respond similarly.
Forage for wild foods for livestock. In years when pasture is insufficient, middle and better off households may
forage for livestock fodder. In most cases they select the leaves of the fig tree that is found in the zone.
Badewacho-Alaba Maize Livelihood Zone
365
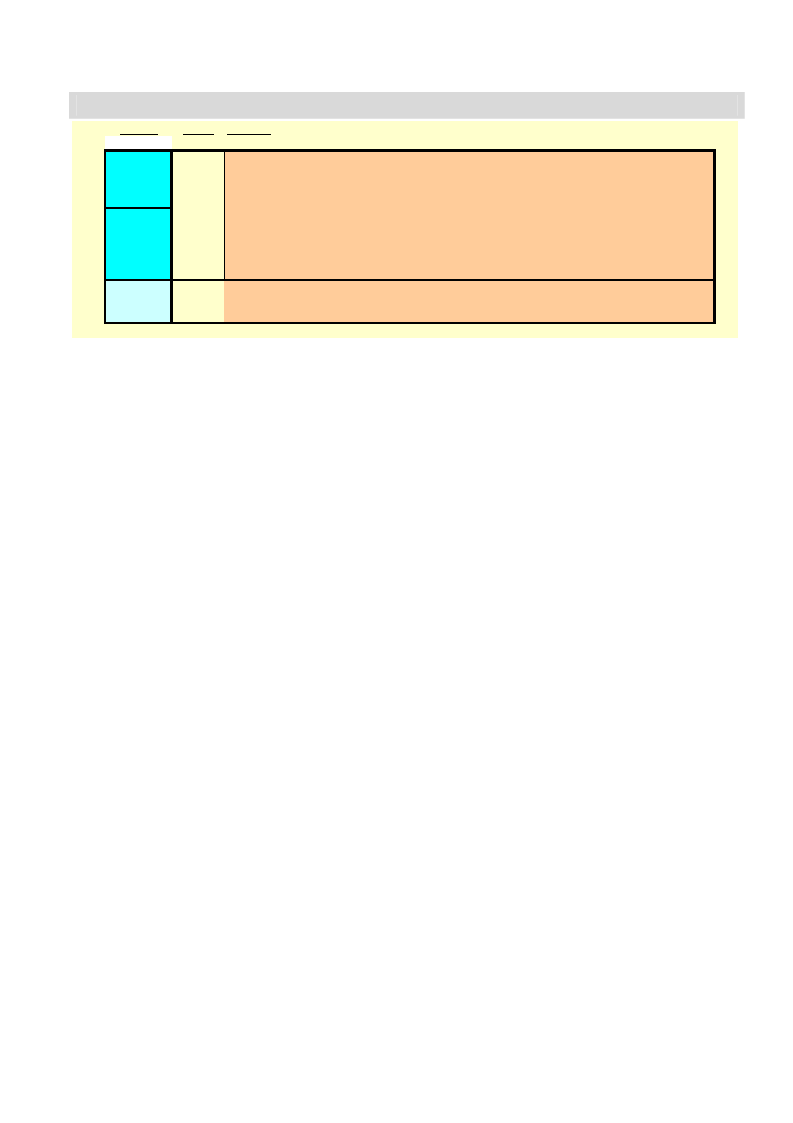
5
Indicators of Imminent Crisis
Season Month Indicator
Belg
season
Meher
season
Dry
season
Feb
Mar
Apr
May
Jun
Jul
Aug
Sept
Oct
Nov
Dec
Jan
Delayed availability and high prices for belg season inputs
Delayed start to, or failure of, the belg rains
High maize prices and low livestock prices in April- June
High maize prices and low livestock prices in April- June
Delayed start to, or failure of, the kremt rains. Delayed green bean harvest
Delayed start to green maize harvest. Delayed availability of meher season inputs
Irregular or excessive rainfall and hailstorms (Aug - Oct). Crop pest infestation (Aug - Sept)
Abnormally large numbers of people migrate for work (Sept - Dec)
Excessive rainfall damages dry harvest. Failure of meher season harvests
High cereal prices during and after main harvest period
High cereal prices during and after main harvest period
The graphic presents the likely sequence of indicators in the lead up to a food or income crisis. There is a wide range of key
indicators for the zone, including those related to rainfall, staple food and livestock prices, labor migration, crop pests and
the timing and quantity of harvests.
Maize is the main staple food. The consumption of green maize plays an important role as a means of escaping the hunger
season, particularly in August and September. If the belg rains are late, this delays the start of the green maize harvest and
prolongs the hunger season.
Badewacho-Alaba Maize Livelihood Zone
366
SNNPR Livelihood Profile
Key Parameters for Monitoring Livelihoods at Woreda Level
Woreda:
Zone:
Alaba
Alaba SW
LIVELIHOOD ZONES IN THE WOREDA
LZ code
Livelihood Zone
AMP
Alaba-Mareko Lowland Pepper LZ
BAM
Badewacho-Alaba Maize LZ
CROPS
A: MAIN CROPS GROWN, BY LIVELIHOOD ZONE
1= major crop for the LZ, 2 = minor crop
Importance for woreda Crop
AMP
1 Major
maize
1
2 Major
wheat
1
3 Major
sorghum
1
4 Major
pepper
1
5 Major
teff
2
6 Major
haricot beans - meher
7 Minor
millet
2
8 Minor
haricot beans - belg
9
10
11
12
BAM
1
2
1
1
2
B: MAIN CROPS SOLD, BY LIVELIHOOD ZONE
1= major source of cash income for the LZ, 2 = minor source
Importance for woreda Crop
AMP
1 Major
wheat
1
2 Major
pepper
1
3 Major
teff
2
4 Minor
maize
5
6
7
BAM
1
2
LIVESTOCK - MAIN TYPES SOLD, BY LIVELIHOOD ZONE
1= major source of cash income for the LZ
Importance for woreda Livestock type
AMP
BAM
1 Major
cattle
1
1
2 Major
goats
1
1
3
4
OTHER SOURCES OF CASH INCOME
1= major source of cash income for the LZ
Importance for woreda Source of cash income
AMP
BAM
1
2
3
4
5
6
Note: A Key parameter is defined as a source that contributes significantly to total food/cash income, so that
a reducton in access to that source may have a significant effect on total income. A major source is one that
contributes 10% or more to minimum annual food energy needs for two or more wealth groups (either
directly as food or if used to purchase food). A minor source contributes 5%-10% to annual food needs.
367