


NATIONAL
DISASTER RISK MANAGEMENT COMMISSION
(NDRMC)
WOREDA DISASTER RISK PROFILE (WDRP)
REGION: SNNP
ZONE: SILTIE
WEREDA: HULBAREG
December, 2020
Addis Ababa

About the National Disaster Risk Management Commission (NDRMC)
The National Disaster Risk Management Commission (NDRMC) was reestablished in
December 2015 and recognized by an act of Council of Ministers (Regulation No.
363/2015) as an autonomous Federal Government office mandated to conduct
appropriate activities for the comprehensive implementation and realization of the
objectives of the National Disaster Risk Management Policy and Strategy and to
coordinate, monitor and provide appropriate support with respect to activities
carried out by the lead sector institutions.
Address: Kirkos Sub-city Behind Dembel City Center, Addis Ababa, Ethiopia.
P.O.Box: 5686
Tele: 0115524259/4272
Website: www.dppc.gov.et
© 2020 National Disaster Risk Management Commission. All rights reserved
Printed in Addis Ababa, Ethiopia.
Citation- This Document May be Cited as Follows:
National Disaster Risk Management Commission (2020), Hulbareg Woreda Disaster
Risk Profile, Addis Ababa, Ethiopia.

PREFACE
Ethiopia is well aware of the impact that disasters can have on the
development goals that we are rigorously pursuing through our
Growth and Transformation Plan II. With this recognition we started
a paradigm shift a few years ago, largely triggered by the revised
National Policy and Strategy on Disaster Risk Management.
To make the DRM Programme implementation in the country well-informed, a
comprehensive information management system is required. We have been undertaking
a comprehensive risk assessment exercise under which Disaster Risk Profiles are being
prepared for each district and at sub-district levels in the country.
This Wereda Disaster Risk Profile establishes an extensive database on disaster risk
elements that will help decision makers at all levels to be better informed at community
and Wereda level about the characteristics of potential hazards, their potential
exposure, vulnerabilities of communities, capacities and that can also be an input for
Wereda Disaster Risk Reduction Plans and area specific early warning tools.
Wereda Disaster Risk Profiles developed are publically available here for the use of all
development partners and government sectors at all levels. Also, other data sources of
NDRMC, such as Desinventar, Livelihood Baseline and the Early Warning information will
be integrated and harmonized with this Information Management System.
Finally, we need to acknowledge the support of partners who have funded this
programme and we also look for the support of donors and all development partners in
order to achieve the ambitious indicators of this risk information and providing every
district with the disaster risk profile and their respective risk-informed plans.
H.E. Ato Mitiku Kassa
Commissioner
National Disaster Risk Management Commission (NDRMC)
The Federal Democratic Republic of Ethiopia (FDRE)

PREFACE
Woreda Disaster Risk Profiling (WDRP) is a government owned
Programme undertaken by the National Disaster Risk
Management Commission (NDRMC) in collaboration with regional
DRM offices and development partners to provide baseline
information for disaster risk management practices and
activities in the country. The Programme is designed by taking
into account the experiences gained from the implementation of pervious strategies
and actions like the Hygo Framework for Action (2000-2015) and the Sendai Framework
for Disaster Risk Reduction (2015-2030).
WDRP is composed of diversified indicators including hazard related issues, crop and
livestock production, landholding and environmental issues, human and livestock health
issues, education and social issues at wereda and kebele level. It provides basic and
detailed indicators with both quantitative and qualitative information which obtained
from both primary and secondary data sources.
Moreover, two pages summary of profiles is also prepared to help users easily
understand WDRP results for each wereda without going into detail for all indicators.
In addition to this booklet, developed profiles are uploaded on WDRP website
(http://profile.ndrmc.gov.et) to be viewed by all users; we encourage all DRM actors
at all levels to use this profile as baseline information for all DRM initiatives.
This WDRP booklet was produced through exemplary collaboration of all concerned
bodies and I would like to give my deepest gratitude to all who directly or indirectly
contribute for the success of the Programme particularly for data enumerators and
supervisors, data encoders and profile development teams, consultants and advisors,
partner ministries and all DRM stakeholders.
Abraham Abebe
Director
Disaster Risk Reduction and Rehabilitation Directorate (DRRRD)
National Disaster Risk Management Commission (NDRMC)
Contents
No. Indicator Name
Preliminary Information
I
Preface
II
Wereda Location in Ethiopian Map
III
WDRP Methodology
IV
Summary Profile
Hazard Related Characteristics
1
Biological Hazards of the Wereda
2
Geological Hazards of the Wereda
3
Hydro Metrological Hazards of the Wereda
4
Socio Economic Hazards of the Wereda
5
Technological Hazards of the Wereda
6
Disaster Characteristics By Kebele
7
Hazards: Conflict as an Issue
Page
1
2
3
4
5
6
7
19
8
Frequency of Disaster Occurrence
24
9
Household Exposure to Hazards
25
10
Months of Occurrence of Frequent Disasters
26
11
Conflicts: Perception of households on conflict issues - Is conflict an issue in this
Community?
27
12
Conflicts: Perception of households on conflict issues - Who To Turn To in case
Of Conflict?
28
13
Losses from Disasters - Losses from all disasters (household response in %)
29
14
Losses from Disasters - Main Losses by Type of Disasters (household response in %) 30
15
Losses from Disasters - Secondary Losses by Type of Disasters (household response 32
in %)
No. Indicator Name
Page
16
Seasonal Calendar for Hazards, Activities and Income Level By Kebele
34
Infrastructure Access Characteristics
47
17
Physical Vulnerability: Access to Roads & Urban Centers - Households access to
road and urban center
48
18
Physical Vulnerability: Access to Electricity - Households’ access and utilization of
electricity
49
19
Physical Vulnerability: Type of Dwelling Units - Households’ type of dwelling houses 50
Socio Demographic Characteristics
51
20
Economic Vulnerability: Level of Migration - Migration level and its characteristics 52
by Kebele
21
Economic Vulnerability: Household Migration - Household migration and reason for
migration
54
22
Economic Vulnerability: Household Migration - Disasters as a triggering factor for
migration (households response in %)
55
23
Demography: Population Structure
56
24
Demography: Population Trends and Ethnic Groups
58
25
Social Vulnerability: Household Demographic Characteristics - Demographic
characteristics of households
59
26
Social Vulnerability: Level of Educational Attainment - Education status of
household members
60
27
Social Vulnerability: Gender Parity - Gender parity in education level (7+ years)
and household heading
61
Environmental Characteristics
62
28
Environmental Situation: Environmental Problems - Major environmental problems
by Kebele
63
29
Environmental Situation: General Land Quality - Perceptions of the community
64
on changes in the general quality of land over a decade
30
Environmental Situation: Changes in Landscape - Changes observed by the
community on landscape and the problems due to the changes
66
31
Environmental Situation: Land-Use other than crop production - Types of land use
other than crop production across Kebeles
68
No. Indicator Name
Page
32
Environmental Situation: Deforestation - Observed changes over levels of
deforestation by the community and its problems
70
33
Environmental Situation: Natural Resources Availability - Natural resources
available and changes observed by the community
72
34
Environmental Situation: Rainfall & Temperature - Observed changes on rainfall
and temperature by the community over the last decade
79
35
Environmental Situation: Reasons for Environmental Changes
82
36
Environmental Situation: Soil Erosion - Observed changes on levels of soil erosion
by the community
83
Livelihood, Occupation and Source of food
85
Economic Vulnerability: Major Occupational Categories - Major categories of
37
occupation and percent of population engaged in the occupation by Kebele
86
38
Economic Vulnerability: Livelihoods - Households important sources of
Livelihood (response in %)
88
39
Economic Vulnerability: Occupational Categories - Percent of population above 15
years age by occupation categories
91
40
Economic Vulnerability: Sources of Food - Households source for different food
items (response in %)
92
Crop Production
94
41
Hazards: Change in Crop Damages - Proportion of total crop damage (percentage
response by households)
95
42
Hazards: Change in Crop Damages - Major reasons for crop damage (percentage
response by households)
96
43
Hazards: Change in Crop Damages - Proportion of Damage for Major Crops
(percentage response by households)
97
44
Hazards: Change in Crop Damages - Reasons for Damage of Major Crops
(percentage response by households)
98
45
Agricultural Situation: Change in Crops Grown - Five major crops grown by
proportion of total cultivated land
100
46
Agricultural Situation: Access to Extension - Perception of the community on
Access to Agricultural extension Services
104
47
Economic Vulnerability: Crops Grown - Types of crops grown by households
106
Economic Vulnerability: Crops Grown - Proportion of households by amount of yield
48
of major crops (last year)
107
No. Indicator Name
Page
49
Economic Vulnerability: Crops Grown - Proportion of households by amount of yield
of major crops (Five years ago)
108
50
Economic Vulnerability: Land Ownership and Quality - Landownership of households 109
51
Economic Vulnerability: Land Ownership and Quality - Farmers’ perception on the
quality of their agricultural land
110
52
Agricultural Situation: Access to Inputs - Perception of the community on access
to improved agricultural inputs
111
53
Agricultural Situation: Water for irrigation - Access to water for irrigation in the
community
113
54
Agricultural Situation: Soil Fertility - Perception of the community on soil fertility
and its change over time
114
55
Economic Vulnerability: Status of Agriculture - Methods of tillage, Irrigation and
other agricultural input utilization by households
116
56
Economic Vulnerability: Change in Agricultural Situation - Households
perception on changes of crop type, size of cultivated area and crop yields
117
57
Economic Vulnerability: Crops Grown - Number of crops grown by households
119
Livestock Production
120
58
Agricultural Situation: Status of Livestock Disease - Change In Livestock Disease
Status By Kebele
121
59
Livestock Prevalent of Diseases & Veterinary Facility - Livestock Diseases
Prevalence
123
60
Livestock Prevalent of Diseases & Veterinary Facility - Evaluation of Access to
Veterinary Services and Livestock Drugs
124
61
Agricultural Situation: Water Availability for Livestock - Water availability for
livestock in the community
125
62
Agricultural Situation: Livestock Diversity - Type of livestock and their economic
127
importance in the community
63
Economic Vulnerability: Livestock Ownership and Changes - Percentage of
households by number and type of livestock owned
131
64
Economic Vulnerability: Livestock Ownership and Changes - Households’ perception
on changes in livestock number in the last five years (response in %)
133
No. Indicator Name
Page
65
Agriculture (Livestock): Pasture Availability - Households’ perception on access and
quality of pasture
138
66
Agriculture (Livestock): Pasture Availability - Households’ perception on
problematic months for pasture availability
139
67
Agriculture (Livestock): Water Availability - Households’ response on water
availability for livestock
140
68
Agriculture (Livestock): Water Availability - Households’ perception on problematic
months of water availability for livestock
141
69
Agriculture (Livestock): Water Availability - Sources of water for livestock
(households response in %)
142
Access to Markets and Credit
143
70
Economic Vulnerability: Proportion of Produce Sold and Market - Proportion of
crops and livestock sold from total production and markets
144
71
Economic Vulnerability: Kebele Access to Markets - Access to market by Kebele
146
72
Economic Vulnerability: Formal & Informal Transfers - Percentage of households
reporting received formal transfers
147
73
Capacity: Access to Credit Facilities - Households access to credit facilities
149
74
Capacity: Access to Credit Facilities - Percentage of households by major reasons
of borrowing money
150
75
Capacity: Access to Credit Facilities - Percentage of households by major sources
of credit
151
76
Capacity: Access to Credit Facilities - Percent of households with ability to raise
500 birr in one week
152
Health and Sanitation Characteristics
153
77
Household Access to Health Facilities - Where do patients go for health care?
154
78
Hazards: Health problems and changes over the last decade
156
79
Household Health Status - Households’ health condition and major health problems 158
No. Indicator Name
Page
80
Household Access to Sanitation - Percentage of households with access to different
kind of toilet facilities
160
81
Household Access to Drinking Water - Sources of drinking water for households
(response in %)
161
82
Household Access to Drinking Water - Households’ methods of treating drinking
water
162
83
Household Access to Drinking Water - Number of times households fetch water in a
week
163
84
Household Access to Drinking Water - Time taken per day to fetch water for
households
164
Coping Mechanisms and Preparedness Measures
165
85
Capacity: Community Preparedness against Sudden Onset Disasters
166
86
Capacity: Community Preparedness against Increase in Disaster Intensity
169
87
Capacity: Community Preparedness against Disasters
171
88
Hazard: Coping and recovering during last Disaster
175
89
Capacity: Type Community Participation
182
90
Capacity: Recovery from Losses from Disasters - Percentage of Households who
have managed to recover from losses of disasters
183
91
Capacity: Coping Strategies Adopted by Households - Main coping strategies
adopted by households to recover from respective losses
184
92
Capacity: Coping Strategies Adopted by Households - Percentage of households
by frequency of main coping strategies adopted
189
93
Capacity: Alternative Livelihood Sources - Alternative livelihood sources suggested
by the community
191
94
Capacity: Recovery from Losses from Disasters - Percentage of households
recovered from past disasters by type of Disasters
194
95
Capacity: Recovery from Losses from Disasters - Proportion of households
recovered by type of Losses
195
No. Indicator Name
Page
96
Capacity: Coping Options if More Resources Available - What coping strategy could
be adopted if more resource were available?
196
97
Capacity: Coping Strategies Adopted by Households - Percentage of households by
major type of coping strategies adopted (at least once)
197
98
Capacity: Coping Strategies Adopted by Households - Main coping strategies
adopted by households for respective disasters
199
99
Capacity: Coping Strategies Adopted by Households - Secondary coping strategies
adopted by households for respective disasters
205
Community Perception and Suggestions
208
Interventions: Community Perception on Mediums to Influence DRM Actors -
100
Community perception on the effectiveness of institutional channels to use to
209
influence DRM actors
Interventions: Community Perception on their Knowledge used in DRM Process -
101
Perception of the community on how their knowledge influences the priorities and 215
measures of DRM actors
102
Interventions: Suggestions to DRM Actors in the Area - Community suggested
measures to DRM actors in the area for effective DRM actions
217
103
Economic Vulnerability: Community Suggestions to Improve Economic Situation -
Community suggested measures to improve the economic situation of the area
222
104
Community Awareness of Disaster Risk Management System and Actors
225
Community Perception of DRM System and Actors - Perception of the community on
105
the effectiveness of DRM system in helping them to prevent, cope and recover
232
from disasters
106
Major Public Interventions Desired - Percentage of households by type of
intervention desired
236
Others
238
107
Capacity: Community Based Organizations
239
108
Supporting Agencies against Disasters - Percentage of households by supporting
institutions to handle or recover from disaster damages
240

No. Indicator Name
Page
109
Type of Support Received From Supporting Agencies – Household responses of types
of support received from supporting agencies
241
110
Government Actors in the Field of Disaster Risk Management - Government actors
and their activities in the field of Disaster Risk Managements
242
111
Non-Government Actors in the Field of Disaster Risk Management - Non-government
actors and their activities in the field of Disaster Risk Management
243
112
Interventions: Community Suggestions to Development Actors
244
113
Wereda SWOT Analysis
251
METHODOLOGY
WDRP Content :
• Comprehensive information on disaster risk components
(Hazards, Vulnerability and Capacity)
• Multi-sectoral and multi-hazard information.
Research Approach:
• Mixed Approach
• Both quantitative and qualitative information
Data Sources:
• Primary Data:
Household Questionnaires: statistically significant number
(around 400 households).
Focus Groups Discussions: One per kebele
Key Informant Interviews: with major woreda level government
and non-government DRM actors
Problem Tree Analyses : to see the cause and effect of disasters
• Secondary Data:
collected relevant to WDRP indicators:
LIU, SERA Project, Risk baseline, other ministries…
Sampling Technique:
• Multistage cluster sampling
• Both Probability and Non-probability sampling
Methods of Analysis:
• Descriptive Statistics
• Textual Analysis
• Cispro and SPSS
• Automate WDRP software

WEREDA
SUMMARY DISASTER RISK PROFILE
INFORMATION
Wereda Disaster Risk ProfilingProgramme: SNNP
Disaster Risk Profile: Silti Zone Wulbareg Wereda
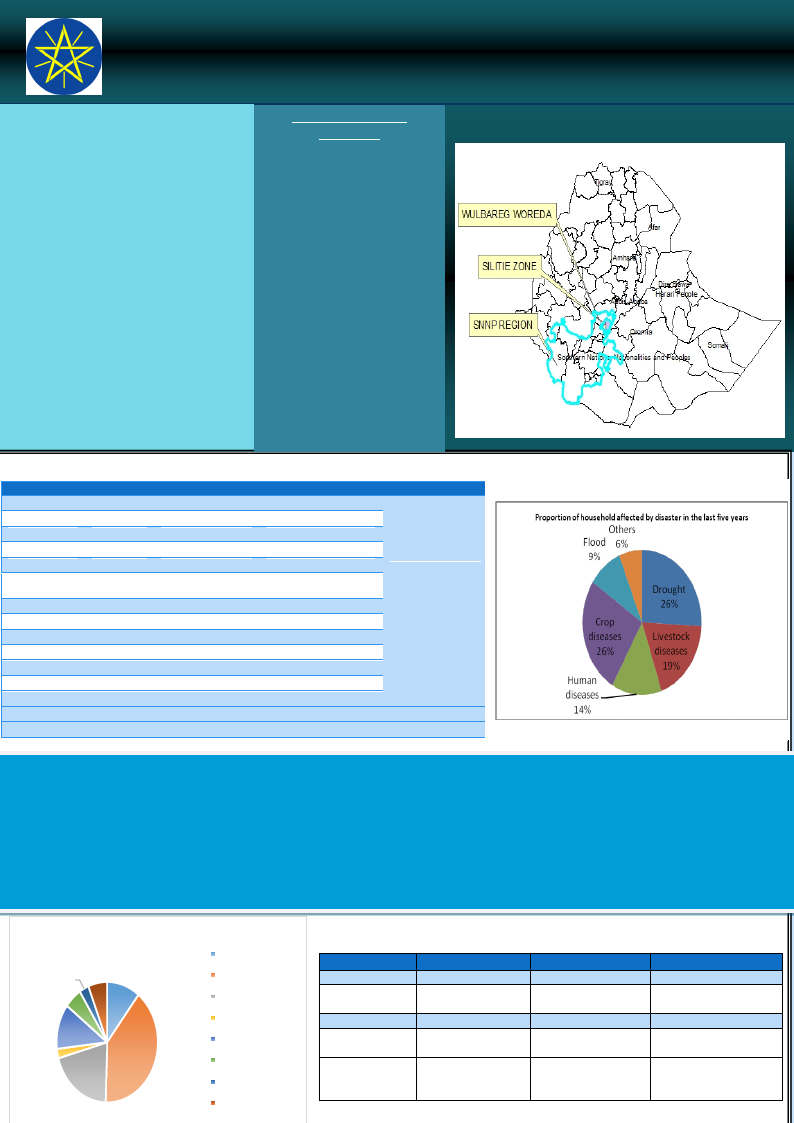
SUMMARY OF WEREDA PROFILE
Crop pes ts and diseases, Drought a nd l i ves tock
di s eases and are the three major dis a s ter ri s ks
mos t a ffecting the livelihood of the communi ty
i n the Woreda. The capaci ty of the communi ty
to wi ths ta nd di s a s ters i s wea k due to ma ny
fa ctors such as poor economic condition, lack of
a wa reness, large family s ize, poor a dopti on of
i mproved agricultural technologies and practices
a nd l a ck of i nfra s tructures . Soi l eros i on,
deforestation a nd pes ts a re a mong the ma jor
envi ronmenta l probl ems whi ch a re s everel y
i ncrea s i ng from ti me to ti me.
Di fferent na tura l res ource cons erva ti on
a cti vi ti es , cons tructi on of roa ds a nd
devel opment of wa ter s ources a nd s a vi ng
i ns titution a re recommended i n the a rea . More
works a re required in a rea s of envi ronmenta l
s a ni ta ti on i ncl udi ng ponds a nd other wa ter
s ources a nd pers ona l s a ni ta ti on. Improvi ng
uti l ization of i mproved agricul tura l i nputs a nd
i rri ga ti on i s a l s o i mporta nt.
LIVELIHOOD ZONE
SUMMARY
MAJOR DISASTERS REPORTED IN WEREDA
Kebele
A/Z/S HIDGER
A/GIMBA
A/GIMBA
A/AC HAM
A/YO DE
Disaster 1
Drought
Drought
Drought
Drought
Crop dis.
Disaster 2
Livestock disease
Flood
Livestock Disease
Livestock diseases
Drought
Disaster 3
Human diseases
Human diseases
Human diseases
Livestock Disease
ANG YO DE Drought
Livestock Disease
BILA WANJA
B/KITKITA
DATE WEZIR
DEMEQ E
KEBELE 01
O / WACHO
T/ TEMEDE
W /s h ama
Bole
Drought
Drought
Drought
Drought
Drought
Drought
Livestock di
Drought
Drought
Frost
Livestock Disease
Human Disease
Human Disease
Livestock disease
Human diseases
Crop pest and disea.
Human diseases
Human dis.
Livestock diseases
Human Disease
Livestock disease
Livestock disease
Human diseases
Flood
Human diseases
Livestock diseases
Flood
LIU Info
Chronic
Hazards:
BJB LZ:
Drought, livestock
diseases
(p ast eurellosis,
internal and
external parasites,
and blackleg) and
conflict
OAP LZ:
SHORT NARRATIVE ON MAJOR DISASTERS:
Drought is the major disaster which is caused by s hortage of ra in i n particular during belg a nd meher s easons a nd uneven dist ribution of rain fall and res ul ts
i n l ow productivi ty, yi eld reduction, food s hortage, malnutrition and hunger. Crop pests a nd diseases ca use major damage on crop production. On the other
ha nd,, Black leg, LSD, FMD, Newcastle diseases a d Anthrax a re the major l ivestock diseases i n the area. Ma laria, diarrhoea , typhoi d a nd typhus a nd other
wa ter borne diseases frequently occur i n the area which resulted i n illness, deaths a nd l oss of i ncome (asset depletion) due to medical expenses. Storm a nd
fl oodi ng a re a ddi ti ona l ha za rds hous ehol ds fa ce i n the w ereda .
Proportion of households by types of disaster loss
suffered
Physical damages on
3.03 6.06
houses and property
Crop damage
5.56
10.61
Livestock damage
Death of household
12.12
members
Illness/health problems
2.53
39.90
20.20
Loss of income
Other losses/damages
No Losses
Disasters
Dro u g ht
Crop pests and
di s e ases
Live stock diseases
Human diseases
Fl o o ds
EFFECT OF DISASTERS
Loss 1
Crop damage
Crop damage
Loss 2
Livestock damage
Loss of income
Death of animals
Reduce animal products
Illness/health problems Death of humans
Damage on water
point s, ponds and
wells
Land degradation and
(gully formation)
Loss 3
Loss of pasture and water
Loss of saving
Loss of income
Loss of income for
medicat io n
Damage on crop and
pasture land
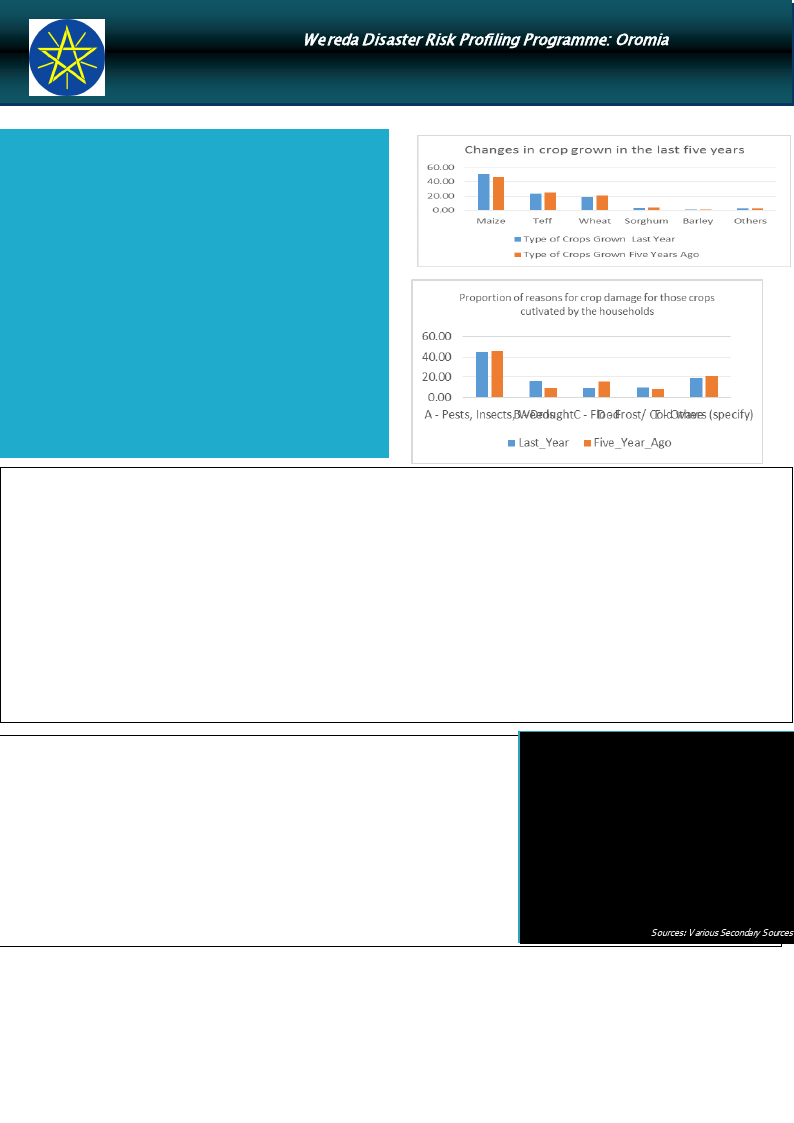
We reda Disaster Risk Profiling Programme: Oromia
Disaster Risk Profile: Silti Zone Wulbareg Wereda
HOUSEHOLD AND COMMUNITY
VVULUNLNERERAABBILILITITYY
Crop production is the major livelihood activityin the wereda followed by livestock
production. Access to utilization of inputs (fertilizer, improved seed and pesticides)
and agricultural extension service is reported well in the woreda. March is the most
problematic month in terms of water and pasture availability for livestock .
Households obtain crops and livestock products required for consumption mainly
through own production since they are practising mixed farming. During dryseason,
market value of livestock is low (mainly due to poor body condition of the animals)
while price of crops is very high which caused asset depletion and food insecurity as
households have to sell more livestock to purchase food consumption.
Of the total households interviewed cash for work and food for work constitute a
large proportion that they are helped in formal government transfer. Moreover,
about most the households reported that it would be possible to raise Birr 500 in one
week implying their vulnerability to a sudden on-set of disasters. Youngsters migrate
to other areas for economic purposes (for better job opportunities) particularly to
urban areas.
Lack of clean drinking water, poor sanitation, presence of malaria prone areas and
malnutrition due to drought make the community more vulnerable to human
diseases in the area. Choosing migration rather than solving the root cause of
disasters; large household size and lack of family planning; illiteracy; deforestation;
dependency syndrome and poor natural resource conservation activities are also
additional vulnerability factors in the wereda.
Acces s ibility:
Access to road and urban centre: about 2/3rd of the households have dirty road (which is difficult for vehicle) leading to their house, while 20% of the households do not
have road. Average time taken to reach the nearest paved road is one hour. On the other hand, average time taken to reach the nearest urban centre is more than 50
minutes.
Access to electricity is almost nil, and very few households (3%) are located in the community with electricityand only 1.9 % of the households are actually connected to
electric power.
Access to veterinary facility: of the total households surveyed, 26% and 36% of them reported adequate and good) access to veterinary service and livestock drugs
respectively.
Access to market is reported to be adequate but low market price of livestock and high price of crops during dry season indicated as market problem in the wereda.
Access to agricultural extension service is reported to be good, 92% of the households surveyed have received agricultural extens ion service.
Access to fertilizer, pesticides and improved seeds: of the total households surveyed in the wereda, above half the households have used any type of fertilizer and
pesticide in crop production. Likewise, 95% of the households reported using improved variety of seeds.
Access to water and sanitation: about 3/4th of the population primarily obtain drinking water from rivers and bono, and 90% of the households use the water without
making any type of treatment. With regard to sanitation, 96% of the households use outdoor latrine.
Access to credit: Above 50% % of the households borrowed money mainly from formal credit institutions and friends/relatives. But they used the money borrowed to
purchase agricultural.
Level of Awareness and Institutional Development
The literacy level of the population above 7 years of age is 17.75%, out of which 42%% of them completed only
below first grade level, while 48% and 8.7% of the population attended primary and secondary school respectively.
With regard to gender parity in education, proportion of female students dominates at below first grade level, but
their number dwindles and highly dominated by males as the education level gets higher.
Community awareness about disaster risk management system and actors is relatively good. There are many
community based organizations in the area, such as saving and credit institutions, farmers cooperatives (which
supply commodities with fair price), agricultural cooperatives (which are engaged in inputs supply), and other
organizations with various activities like Edir and Ekub. There are some NGOs operating in the area such as Goal,
CDA and SLM project which are engaged in different activities such as Improving health, Supporting vulnerable
children and women, natural resource management.
InfoBits:
Population
Sex ratio
Urban Population
Mean Altitude
Mean Slope
Measles caseload
PLWHA on ART
Under-five children eligible
for supplementary feeding
: 79971(2007)
: 51% F/49% M
: 2197 (2007)
:
:
: 1(2004-2009)
:
:
S ources: V arious Secondary S ources
COMMUNITY CAPACITY TO COPE
Selling more livestock than usual, consumption rather than sale of crop surplus, looking for alternative (additional) jobs an d increasing working hours are the general coping
mechanisms adopted by households during disasters. For crop pests and diseases, they use chemical spray and sometimes sweep the crop with tree branches and also
demarcate plots with ash.
Saving resources (crops and money), selling animals and saving the money in bank or purchasing crops and making area closure are among the most frequent preparedness
measures taken byhouseholds against drought.
Strong social network is present in the area, which can be gauged from the fact that free use of oxen labour, human labour and pack animals and cash loan (with no
interest) is very common. Community participation in the development activity of the area like infrastructure development is very good.
Crop and livestock diversity: average number of crop grown is only 1.2, and the two major crops grown are maize, wheat, teff and barely, while the major type of livestock
reared in the wereda include cattle, goat, sheep, and donkey.
WDRP Indicators
Hazard Related Characteristics
1
Wereda Disaster
Risk Profile
National Disaster Risk Management
Commission (NDRMC)
Data_Collected_Date
Tuesday, July 9, 2019
Region S.N.N.P
Zone
SILTIE
Wereda
HULBAREG
Selected Indicator
Biological Hazards of the Wereda
Hazard_Name
Hazard_Sub_Type
Crop diseases and pests
Hazard_Sub_Type
Human diseases
Livestock disease
LSD, FMD, Anthrax
Cause_Of_Hazard
Increasing temperature
Rain fall fluctuation
Poor agronomic practices
Biological hazards
Sanitation problem
Malarial mosquitoes
Lack of water
Lack of pasture and water
Poor management
Lack of adequate drugs and treatment
Effects_Of_Hazard
Loss of crop yield
Loss of income
Death of human beings
Shortage of power for labor work
Loss of income
Death of livestock
Reduction of body condition
Loss of income
Reduction of livestock product
Page 1 of 1
2

Wereda Disaster
Risk Profile
National Disaster Risk Management
Commission (NDRMC)
Data_Collected_Date
Tuesday, July 9, 2019
Region S.N.N.P
Zone
SILTIE
Wereda
HULBAREG
Selected Indicator
Geological Hazards of the Wereda
Hazard_Name
Hazard_Sub_Type
No Geological hazards
Cause_Of_Hazard
No Geological hazards
Effects_Of_Hazard
Page 1 of 1
3

Wereda Disaster
Risk Profile
National Disaster Risk Management
Commission (NDRMC)
Data_Collected_Date
Tuesday, July 9, 2019
Region S.N.N.P
Zone
SILTIE
Wereda
HULBAREG
Selected Indicator
Hydro Metrological Hazards of the Wereda
Hazard_Name
Hazard_Sub_Type
Drought
Flood
Frost/Cold Waves
Cause_Of_Hazard
Hydro metrological hazards
Erratic rainfall
Deforestation
Heavy rainfall
Gully erosion
-
Effects_Of_Hazard
Loss of crop
Loss of livestock product
Loss of saving
Soil erosion
Land degradation
Crop and pasture loss
Loss of crop and pasture
Livestock damage
Human diseases
Page 1 of 1
4

Wereda Disaster
Risk Profile
National Disaster Risk Management
Commission (NDRMC)
Data_Collected_Date
Tuesday, July 9, 2019
Region S.N.N.P
Zone
SILTIE
Wereda
HULBAREG
Selected Indicator
Socio Economic Hazards of the Wereda
Hazard_Name
Cause_Of_Hazard
Hazard_Sub_Type
Socio economic hazards
No Socio economic hazards
Effects_Of_Hazard
Page 1 of 1
5
Wereda Disaster
Risk Profile
National Disaster Risk Management
Commission (NDRMC)
Data_Collected_Date
Tuesday, July 9, 2019
Region S.N.N.P
Zone
SILTIE
Wereda
HULBAREG
Selected Indicator
Technological Hazards of the Wereda
Hazard_Name
Cause_Of_Hazard
Hazard_Sub_Type
Technological Hazards
No Technological Hazards
Effects_Of_Hazard
Page 1 of 1
6

Wereda Disaster
Risk Profile
National Disaster Risk Management
Commission (NDRMC)
Data_Collected_Date
Tuesday, July 9, 2019
Region S.N.N.P
Zone SILTIE
Wereda HULBAREG
Selected Indictor:
Kebele Name
ALBEZER ZEMU
SHIDGER
Disaster Characteristics By Kebele
Disaster_Type Common Period
Year
Worst_ Trends of
Occured Year Effects
Root Causes
Drought
April up to
August
1977 and 1977
2008
Decreased
Deforestation
and absence
of Meher rain
fall
Livestock
diseases
Human
diseases
June up to
October
2008 and 2008
2009
September up to
December
1985 and 1986
1997
Decreased
The coming
of Camels
form
pastoralist
area, using
communal
pasture and
using river
water for
livestock
Decreased
The presence
of mosquito
breading site,
less
prevention on
measures of
the disease
and less
health
extension
service
Effects
Shortage of
food and
death of
livestock
Death of
livestock and
loss of asset
Death of
human and
loss of house
hold asset
Vulnerability
Dependent on
nature, depend on
rain feed
agriculture and less
income
diversification
Lack of awareness,
lack of animal
health extension
and open grazing
Unwise disposal of
waste
Coping Strategy
Migration and
consume inedible
fruit
Vaccinate the health
one and treat the
infected one
Using traditional
medicine
7
Page 1 of 12

Wereda Disaster
Risk Profile
National Disaster Risk Management
Commission (NDRMC)
Data_Collected_Date
Tuesday, July 9, 2019
Region S.N.N.P
Zone SILTIE
Wereda HULBAREG
Selected Indictor:
Kebele Name
AMBERCHO
GIMBA
Disaster Characteristics By Kebele
Disaster_Type Common Period
Year
Worst_ Trends of
Occured Year Effects
Root Causes
Drought
April up to
January
1977 and 1977
2005
Decreased
Deforestation
and fluctuate
rain fall
distribution
Flood
June
2008
2008
Decreased Environmenta
l degradation
Effects
Food
shortage,
migration,
pasture
shortage and
loss of house
hold asset
Damage
cultivated
land and
destruction
of home
Vulnerability
Dependency on rain
feed agriculture
and poor
environmental
protection activity
Dependency on
nature
Human
diseases
March up to
August
1965
1965
Decreased
Water
pollution,
poor
sanitation
and food
shortage
Death, affect
social
interaction
and affect
the
productive
labor
Poor hygiene and
sanitation and poor
access to health
service
Coping Strategy
Migration to high
land area and selling
productive and
unproductive asset
for food purchase
Support each other
to minimize the
negative impact
drain out excess
water from farm
land.
Who we have the
capacity can get
medicine from urban
area and using
traditional medicine.
8
Page 2 of 12

Wereda Disaster
Risk Profile
National Disaster Risk Management
Commission (NDRMC)
Data_Collected_Date
Tuesday, July 9, 2019
Region S.N.N.P
Zone SILTIE
Wereda HULBAREG
Selected Indictor:
Kebele Name
AMBERCHO
GIMBA
Disaster Characteristics By Kebele
Disaster_Type Common Period
Livestock
diseases
June up to
December
Year
Occured
2008 and
2009
Worst_
Year
2008
Trends of
Effects
Decreased
Root Causes
The coming
of camels
from
pastoralist
area
Effects
Death of
livestock,
force the
community
to aid and
distribution
of crop
calendar
Vulnerability
Using of communal
land and using of
communal livestock
water
AMOBARACHO
ACHAM
ANGAMO YODE
Drought
February up to
August
Livestock
diseases
August up to
January
Crop diseases
January and
February
1977 and 1977
2008
Decreased
Deforestation
and global
warming
2008-200 2009
9
Increased
Free grazing
land and
Coming of
camel from
pastoral area
After
2005
2007-20 Increased
08
Climate
change
Death of
human being,
livestock,
migration
and loss of
house hold
asset
Death of
livestock,
loss of asset
and the
community
affected by
disease
Loss of
economy
Dependency on rain
feed agriculture,
lack of perennial
crop production and
lack of irrigation
scheme.
Lack of vaccination
and lack of
treatment
Depend on crop
production
Coping Strategy
Treatment for the
infected, using
traditional medicine,
vaccinate the
healthy one and
shower the infected
one using cold water
with traditional
medicine
Migration, selling of
asset and searching
of labor for work
Vaccination and
treatment is the
measure but has no
more effective
To diversified
generating income
9
Page 3 of 12

Wereda Disaster
Risk Profile
National Disaster Risk Management
Commission (NDRMC)
Data_Collected_Date
Tuesday, July 9, 2019
Region S.N.N.P
Zone SILTIE
Wereda HULBAREG
Selected Indictor:
Kebele Name
ANGAMO YODE
Disaster Characteristics By Kebele
Disaster_Type Common Period
Livestock
diseases
August
Year
Occured
2008
Worst_
Year
2008
Trends of
Effects
Decreased
Root Causes
Immigration
of camels
Effects
Vulnerability
Loss of house
hold assets
Depend on
communal land for
grazing
BILA WANJA
Drought
Drought
Frost / Cold
waves
Livestock
diseases
June and July
December up to
August
November up to
January
May up to
January
2007
2007
1977 and 1977
2008
1974 and 2009
2009
2008
2008
Decreased
Decreased
Deforestation
and high
population
growth
Increased
Decreased
The coming
of camels
from pastoral
area
Deforestation
and lack of
rain fall
Food
shortage,
death of
human being
and
migration
Killing of
wild animal
and destruct
irrigated
crop
Death of
livestock and
loss of asst
Depend on rain fall
Dependency on rain
feed agriculture
and limited income
generating activity
Low environmental
protection activity
and nature
dependent
Using of communal
land
Coping Strategy
Using traditional
medicine and taking
them to health
center
Diversification of
livelihood
Migrate to the high
land area and to
develop saving
culture
Using shade food
seeding and consult
health professionals
Vaccinate the health
one, treating the
infected one and
shower the infected
one through cold
water
10
Page 4 of 12

Wereda Disaster
Risk Profile
National Disaster Risk Management
Commission (NDRMC)
Data_Collected_Date
Tuesday, July 9, 2019
Region S.N.N.P
Zone SILTIE
Wereda HULBAREG
Selected Indictor:
Kebele Name
BRHAN KITKITA
Disaster Characteristics By Kebele
Disaster_Type Common Period
Drought
April up to
August
Year
Occured
1977,
1987 and
2004
Worst_
Year
1977
Trends of
Effects
Decreased
Root Causes
Deforestation
and
fluctuated
rain fall
Livestock
diseases
April up to
December
2008 and 2009
2009
Increased
The coming
of camels
from
pastoralist
area
Human
diseases
January up to
April
1979
Frost / Cold
waves
December up to
January
2009
1979
2009
Decreased
Food
shortage,
lack of
portable
water and
sanitation
poor
Increased
Chilly
weather
Effects
Vulnerability
Loss of crop
and death of
human being
and animal
Loss of
livestock,
affects
agricultural
activities and
affect the
economic
activities
Death of
human being
and loss of
house hold
asset for
medicine
Dependency on
nature, less income
diversification and
dependent on rain
feed agriculture
Using of communal
land and using of
rivers for livestock
water
Sanitation problem
and using of
untreated drinking
water
Crop damage
and affect
the health of
the
community
Nature dependency
Coping Strategy
Migration to
highlands and selling
of livestock in
minimize price for
food purchase.
Vaccinate the
healthy one, treat
the infected one
,using traditional
medicine and shower
using cold water.
Treat the infected
one, using of
traditional medicine
and vaccinate the
healthy one
Protect from the
negative impact of
disaster
11
Page 5 of 12

Wereda Disaster
Risk Profile
National Disaster Risk Management
Commission (NDRMC)
Data_Collected_Date
Tuesday, July 9, 2019
Region S.N.N.P
Zone SILTIE
Wereda HULBAREG
Selected Indictor:
Kebele Name
BRHAN KITKITA
DATE WEZIR 6
Disaster Characteristics By Kebele
Disaster_Type Common Period
Crop diseases April up to June
Year
Occured
2009
Worst_
Year
2009
Trends of
Effects
Increased
Root Causes
Appearance
of stock borer
Drought
April up to
August
1966-197 1977
7
Decreased
Deforestation
and
environmenta
l degradation
Human
diseases
Livestock
diseases
September up to
December
1952-197 1952
7
June up to
December
2008-200 2008
9
Decreased
Decreased
Poor
sanitation,
the presence
of mosquito
breading site
shortage of
food and lack
of pure water
The coming
of camels
from
pastoralist
area
Effects
Vulnerability
Loss of crop
Death of
human being,
loss of house
hold asset
and
migration
Loss of house
hold asset for
medication
and death of
human being
Produce the same
crop year after year
in a given area and
poor crop
protection activity
Dependency on rain
feed agriculture,
lack of saving
culture and less
income
diversification
Poor hygiene and
sanitation and
unwise waste
disposal
Death of
livestock and
loss of
household
asset
Less availability of
animal health
extension worker
and using of
communal land
Coping Strategy
Using pesticide
Migration to highland
area
Using of traditional
medicine and
transport the
infected by human
power to health
post.
Vaccinate the
healthy one, treat
the infected one,
using of traditional
medicine and shower
the infected one by
cold water and
traditional medicine.
12
Page 6 of 12

Wereda Disaster
Risk Profile
National Disaster Risk Management
Commission (NDRMC)
Data_Collected_Date
Tuesday, July 9, 2019
Region S.N.N.P
Zone SILTIE
Wereda HULBAREG
Selected Indictor:
Kebele Name
DATE WEZIR 6
Disaster Characteristics By Kebele
Disaster_Type Common Period
Year
Worst_ Trends of
Occured Year Effects
Root Causes
Flood
June
2006
2006
Decreased
Climate
change and
deforestation
DEMEQE
Drought
April up to
August
1965,
1977 and
2004
1977
Decreased Deforestation
Human
diseases
Livestock
diseases
September up to
February
1976 and 1976
1983
June up to
January
2008 and 2008
2009
Decreased
Decreased
Poor hygiene
and
sanitation
and presence
of mosquito
breeding site
The coming
of camels
from
pastoralist
area
Effects
Vulnerability
Damage
livestock and
damage
annual and
perennial
crop
Death of
human being
and
livestock,
migration
and loss of
asset
Loss of asset
and death of
human being
Nature dependency
and poor
environmental
protection activity
Low awareness,
dependency on rain
feed agriculture
and single income
generating activity
Less awareness,
unwise waste
disposal and less
access to health
service
Death of
livestock,
loss of
household
asset and
economic
crisis
Using of communal
land and less
awareness how to
control the
prevalence rate /
isolation of the
infected one from
the health.
Coping Strategy
Report the problem
to wereda,
construction of
cut-off drain and
drain out excess
water from crop land
Migrate to high land
area and to develop
culture of saving.
Treat the infected
one who have the
capacity to afford
health cost and using
traditional medicine
Vaccinate the health
one, treated the
infected one and
shower the infected
one by cold water
with soap and
traditional medicine.
13
Page 7 of 12

Wereda Disaster
Risk Profile
National Disaster Risk Management
Commission (NDRMC)
Data_Collected_Date
Tuesday, July 9, 2019
Region S.N.N.P
Zone SILTIE
Wereda HULBAREG
Selected Indictor:
Kebele Name
KEBELE 01
Disaster Characteristics By Kebele
Disaster_Type Common Period
Year
Worst_ Trends of
Occured Year Effects
Root Causes
Drought
July up to
September
1976-197 1977
7
Decreased
Fluctuated
rain fall
distribution
and
deforestation
Human
diseases
LSD
December up to
March
July up to
September
1976-197 1976
7
2008-200 2009
9
Decreased
Poor
sanitation
and unwise
use of
disposal
Increased
The coming
of camels
from
pastoralist
area and un
proper use of
free grazing
system.
Effects
Vulnerability
Food
shortage,
death and
loss of
productive
labor
Death, illness
and loss of
productive
labor
Death of
livestock,
illness and
loss of assets
Depend on rain fall
agriculture and
poor soil and water
conservation
practice.
Air pollution, poor
hygiene and
sanitation and less
health extension
service.
Free grazing system
Coping Strategy
Migrate to highland
area and selling of
house hold asset.
Using of traditional
medicine and pray to
God.
Vaccinate the health
one and treat the
infected one
14
Page 8 of 12

Wereda Disaster
Risk Profile
National Disaster Risk Management
Commission (NDRMC)
Data_Collected_Date
Tuesday, July 9, 2019
Region S.N.N.P
Zone SILTIE
Wereda HULBAREG
Selected Indictor:
Kebele Name
OBISO WACHO
Disaster Characteristics By Kebele
Disaster_Type Common Period
Drought
September up to
July
Year
Occured
1977 and
2004
Worst_
Year
1977
Trends of
Effects
Decreased
Root Causes
Deforestation
, climate
change and
land
degradation
Human
diseases
June up to
August
1972 and 1972
1980
Decreased
The presence
of mosquito
breeding site
and poor
sanitation
Flood
May up to
August
1976
1976
Decreased
Deforestation
and climate
change
Effects
Vulnerability
Shortage of
food, crop
damage,
migration,
loss of asset
and
eradication
of social
interaction.
Death of
human being,
loss of house
hold asset
and loss of
the
productive
capacity of
people.
Crop
damage, loss
of
infrastructur
e and create
migration of
people from
their
residents.
Dependent on rain
feed asset for food
purchasing, low
income
diversification, low
saving culture and
dependent on
annual crop.
Poor sanitation and
poor quality of
potable water
Create dependency
Coping Strategy
To diversified
generating income,
sell livestock for
food purchase and
improve saving and
feeding culture.
Using of traditional
medicine and report
the problem to
higher officials
Using a cut-off drain
to protect
homestead and
migrate to save area
15
Page 9 of 12

Wereda Disaster
Risk Profile
National Disaster Risk Management
Commission (NDRMC)
Data_Collected_Date
Tuesday, July 9, 2019
Region S.N.N.P
Zone SILTIE
Wereda HULBAREG
Selected Indictor:
Kebele Name
OBISO WACHO
TODE TEMEDE
Disaster Characteristics By Kebele
Disaster_Type Common Period
Year
Worst_ Trends of
Occured Year Effects
Root Causes
LSD
June and
2008 and 2008
Decreased The coming
January
2009
of camels
from
pastoralist
area
Animal
May
Disease
2008
2008
Decreased In migration
of camels
Crop diseases July
2007
2007
Decreased Lack of rain
fall
WERABAT SHAMA
Drought
April up to
August
Human
diseases
June up to
August
Livestock
diseases
June up to
December
1977
1977
1984
1984
2008 and 2008
2009
Decreased
Decreased
Decreased
Climate
change,
absence of
rain fall and
deforestation
Climate
change, poor
portable
water and
sanitation
problem
Coming of
Camels from
pastoralist
Effects
Vulnerability
Death of
livestock and
loss of house
hold asset
Using of communal
land and communal
livestock drinking
water
Loss of
livestock
Loss of crop
Death, loss
of asset and
migration
Death and
loss of assets
Using of communal
land for animal
grazing place
Lack of pesticide
and un proper use
of chemicals
Dependency on
nature, single
income generating
and rain feeding
agriculture
Poor hygiene and
sanitation
Death of
livestock and
assets
Using of communal
land and using of
rivers for livestock
drinking
Coping Strategy
Vaccination, isolated
the infected animal
and shower the
infected with cold
water.
To develop
cooperation system
To diversified other
income generation
system
Migration to high
land area and
minimize the family
size
Treatment for the
infection one and
use traditional
medicine
Vaccinate the
healthy one and
treatment for the
infected one
16
Page 10 of 12
Wereda Disaster
Risk Profile
National Disaster Risk Management
Commission (NDRMC)
Data_Collected_Date
Tuesday, July 9, 2019
Region S.N.N.P
Zone SILTIE
Wereda HULBAREG
Selected Indictor:
Kebele Name
BOLE
Disaster Characteristics By Kebele
Disaster_Type Common Period
Year
Worst_ Trends of
Occured Year Effects
Root Causes
Drought
February to
August
1977 and 1977
2003
E.C
Decreased
Environmenta
l degradation,
deforestation
and
population
growth
Human
diseases
June up to
August
Flood
July
1968,
2005,
1978,
1994
1961,
2008
1968
1961
Decreased
Poor hygiene
and
sanitation,
Lack of
access to
pure water,
Unwise
disposal of
waste
Decreased Deforestation
Effects
Vulnerability
Death of
human being,
migration,
Loss of
household
asset for
food
purchase
Death of
human being,
Illness, Loose
of asset for
medication
Lack of awareness,
Dependency on rain
feed agriculture,
Illiteracy,
Dependency on
single income
generating activity
and poor saving
culture.
lack of awareness,
Illiteracy
Crop
damage, Loss
of asset,
Disturbance
of
agricultural
activity
Dependency on
nature, Dependency
on a single income
generating activity
Coping Strategy
Migration, Selling of
livestock and
unproductive asset
for food purchase,
Consume wild plant
and departure of
household member.
Pray to God /Allah /,
Migration, Use of
traditional medicine
Pray to God /Allah /,
Using of cut off
drain and
construction of
water ways
17
Page 11 of 12

Wereda Disaster
Risk Profile
National Disaster Risk Management
Commission (NDRMC)
Data_Collected_Date
Tuesday, July 9, 2019
Region S.N.N.P
Zone SILTIE
Wereda HULBAREG
Selected Indictor:
Kebele Name
BOLE
Disaster Characteristics By Kebele
Disaster_Type Common Period
LSD
January and
February
Year
Occured
2008 and
2009
Worst_
Year
2008
Trends of
Effects
Decreased
Root Causes
Shortage of
water and
pasture
IMPORTANT: The years and months mentoned in this report are according to Ethiopian Calendar (EC).
Effects
Death of
livestock,
Disturbance
of
agricultural
calendar,
Loss of asset
for
medication,
Affect the
health of
human being
Vulnerability
Using of communal
land and water and
lack of awareness
about livestock
diseases
Coping Strategy
Traditional
treatment and
vaccination
18
Page 12 of 12
Wereda Disaster
Risk Profile
Data_Collected_Date
Region S.N.N.P
Zone SILTIE
Selected Indictor:
KebeleName
BOLE
Hazards: Conflict as an Issue
Description_Of_Conflict
OBISO WACHO
No conflict
KEBELE 01
ANGAMO YODE
No conflict on resource
AMOBARACHO ACHAM
No conflict at the moment
TODE TEMEDE
There is conflict on resource
DEMEQE
WERABAT SHAMA
BILA WANJA
AMBERCHO GIMBA
ALBEZER ZEMU
SHIDGER
DATE WEZIR 6
BRHAN KITKITA
No conflict
National Disaster Risk Management
Commission (NDRMC)
Tuesday, July 9, 2019
Wereda HULBAREG
Change_In_Last_Decade
Main_Causes_Of_Conflict
Decreasing
No formal document and
loss of productivity
19
Page 1 of 1

Wereda Disaster Risk
Profile
Data_Collected_Date
National Disaster Risk Management
Commission (NDRMC)
Tuesday, July 9, 2019
Region S.N.N.P
Zone
SILTIE
Wereda
HULBAREG
Selected Indicator: Hazard Situation During Last Disaster - Characteristics of most recent disasters that affected the community
KebeleName
Types of Disasters
Hazard_Description
Effect_Of_Disaster
Most_Severly_Affected
Reason
ALBEZER ZEMU
SHIDGER
Livestock disease
AMBERCHO GIMBA
Livestock disease
AMOBARACHO
ACHAM
ANGAMO YODE
Livestock disease
Drought, livestock
disease and crop
disease
The disease were attack many
livestock and kill the majority and it
stays about 7 month because of the
outbreak the majority of the
community member asset can
diminished and this affect the social
interaction of the community
The disease out break covers the
whole Keble and it attacks like stocks
especially the fatty one and kills
them and it stays about eight months.
The disease kills many livestock and
stay up to now
High loss of livestock and it stay more
than four month
It create social and
economic crisis and
loss of house hold
asset
Women
It affects the
productive capacity of
the whole community
and this leads to
production loss, loss
of house hold asset for
medicine and loss of
livestock.
Loss off asset and
economic hardship
Elders, disable, women
and children
Children and women
Loss of assets
Children and elders
Women are mostly
affected by the
disease that they
are more
responsible to
manage their family
and more
dependent on
livestock products.
They are less
mobile and more
dependent on
livestock and
livestock products
They are mastery
depend on livestock
products
No job opportunity
20
Page 1 of 4

Wereda Disaster Risk
Profile
Data_Collected_Date
National Disaster Risk Management
Commission (NDRMC)
Tuesday, July 9, 2019
Region S.N.N.P
Zone
SILTIE
Wereda
HULBAREG
Selected Indicator: Hazard Situation During Last Disaster - Characteristics of most recent disasters that affected the community
KebeleName
BILA WANJA
BRHAN KITKITA
DATE WEZIR 6
DEMEQE
Types of Disasters
Livestock disease
Livestock disease
Livestock disease
Livestock disease
Hazard_Description
The disease stays for above 6 month
and covers the whole Keble and kills
many animal
It attacks many fat animals and stay
for about eight months
It attacks many animal especially
fattest and kill the majority of the
infected and it stays about 8 month
The disease outbreak affects many
animal especial the fat one and kills
the majority and it stays about eight
month and the disease also
transmitted to human being treating
the infected one by cold water and
soap.
Effect_Of_Disaster
Loss of livestock and
affect the agricultural
activity and postponed
seasonal calendar
Most_Severly_Affected
House hold head is
mostly affected by the
disaster
Loss of livestock and
affect the economic
activity of the
community
Women, children and
elders
Loss of livestock and
affected the economic
activity
Women, children and
elders
Loss of household
asset for mediation,
loss livestock and
economic crisis
Children, women and
elders are most severely
affected by the disaster
Reason
Because they are
responsible to
manage the over all
activities of the
house hold
members
They are not mobile
and they are more
dependent on
livestock and
livestock products.
They are more
dependent on
livestock and
livestock products
They are socially as
well as
economically highly
dependent on
livestock and
livestock products
and they are less
mobile than other
community
members.
21
Page 2 of 4
Wereda Disaster Risk
Profile
Data_Collected_Date
National Disaster Risk Management
Commission (NDRMC)
Tuesday, July 9, 2019
Region S.N.N.P
Zone
SILTIE
Wereda
HULBAREG
Selected Indicator: Hazard Situation During Last Disaster - Characteristics of most recent disasters that affected the community
KebeleName
KEBELE 01
Types of Disasters
Livestock disease out
break
Hazard_Description
The disease out break kills fat
animals and it stays from June /2008/
up to January/2009/
OBISO WACHO
Livestock disease
TODE TEMEDE
WERABAT SHAMA
Animal disease,
drought and soil
erosion
Live stock disease
It kills many fat animals in all round
of the Keble and it stays about 7
month
High number of animal loss
The disease out break attacks
fattened animals and kills the
majority of the infected one and it
stays about 8 month.
Effect_Of_Disaster
The disease is
transmitted to human
being and affect the
health condition of
the community and
loss of livestock and
house hold assets.
Loss of livestock,
affect the economic
activity of people and
social crisis
Loss of income and
migration
Most_Severly_Affected
Children, elders and
women
All the community
members are affected
by the disaster but
children and elders are
more affected.
Poor people and elders
Loss of livestock,
economic crisis and
disturbance of
agricultural crop
calendar
Women, elders and
children
Reason
They are not mobile
and depend on
livestock and their
products.
Most of the
community
members are
depend on livestock
and their products.
Lack of income and
limitation of
resource
Because they are
more dependent on
livestock and their
products and they
have no opportunity
to get the resource
and economically
they are
dependent.
22
Page 3 of 4
Wereda Disaster Risk
Profile
Data_Collected_Date
National Disaster Risk Management
Commission (NDRMC)
Tuesday, July 9, 2019
Region S.N.N.P
Zone
SILTIE
Wereda
HULBAREG
Selected Indicator: Hazard Situation During Last Disaster - Characteristics of most recent disasters that affected the community
KebeleName
BOLE
Types of Disasters
Livestock diseases
Hazard_Description
The disease out break covers a large
area and attacks many fat animals
and it stays about ten months.
Effect_Of_Disaster
Loss of livestock, loss
of house hold asset for
medication,
Disturbance of
agricultural crop
calendar.
Most_Severly_Affected
Women, children and
elders are more affected
by the disease.
Reason
They are less
mobile and more
dependent on
livestock and their
product.
23
Page 4 of 4
Data_Collected_Date
Region S.N.N.P
Zone SILTIE
Selected Indictor: Frequency of Disaster Occurrence
Wereda HULBAREG
Tuesday, July 9, 2019
Conflicts
Crop diseases
Drought
Economic / Price shock
Flood
Forest Fires
Frost / Cold waves
Heavy Rain
Human diseases
Landslide
Livestock diseases
Road Accident
Storms / hail storm
100.00
1.92
33.65
20.19
42.31
1.92
0.96
11.54
48.08
39.42
100.00
6.06
18.18
15.15
60.61
100.00
100.00
100.00
7.41
14.81
16.67
61.11
100.00
11.11
28.40
58.02
2.47
100.00
100.00
24
Page 1 of 1
Data_Collected_Date
Region S.N.N.P
Zone SILTIE
Selected Indictor: Household Exposure to Hazards
Disaster Type
Drought
Livestock diseases
Human diseases
Crop diseases
Flood
No Disaster
Storms / hail storm
Conflicts
Frost / Cold waves
Heavy Rain
Road Accident
Economic / Price shock
No Disaster
Landslide
Heat waves/ High temp
Forest Fires
Tuesday, July 9, 2019
Wereda HULBAREG
General_Exposure
35.79
14.97
13.02
12.80
7.38
3.47
3.04
3.04
2.17
1.08
1.08
0.87
0.65
0.43
0.22
Last_Five_Years_Exposure
25.81
18.87
13.67
26.03
9.33
0.22
1.30
1.74
0.87
0.22
0.43
0.65
0.43
0.43
25
Page 1 of 1
Wereda Disaster
Risk Profile
Data_Collected_Date
Region S.N.N.P
Selected Indictor:
Zone SILTIE
Months of Occurrence of Frequent Disasters
National Disaster Risk Management
Commission (NDRMC)
Tuesday, July 9, 2019
Wereda HULBAREG
Crop diseases
Drought
Flood
Frost / Cold waves
Human diseases
Landslide
Livestock diseases
4.55
6.82
2.27
9.09
15.91
11.36
6.82
6.82
18.18
18.18
1.61
14.52
3.23
11.29
11.29
48.39
3.23
3.23
3.23
7.69
3.85
57.69
23.08
7.69
33.33
66.67
8.57
8.57
8.57
2.86
5.71
5.71
20.00
22.86
5.71
2.86
8.57
100.00
2.94
5.88
23.53
29.41
20.59
11.76
5.88
26
Page 1 of 1
Data_Collected_Date
Tuesday, July 9, 2019
Region S.N.N.P
Zone SILTIE
Wereda HULBAREG
Selected Indictor:
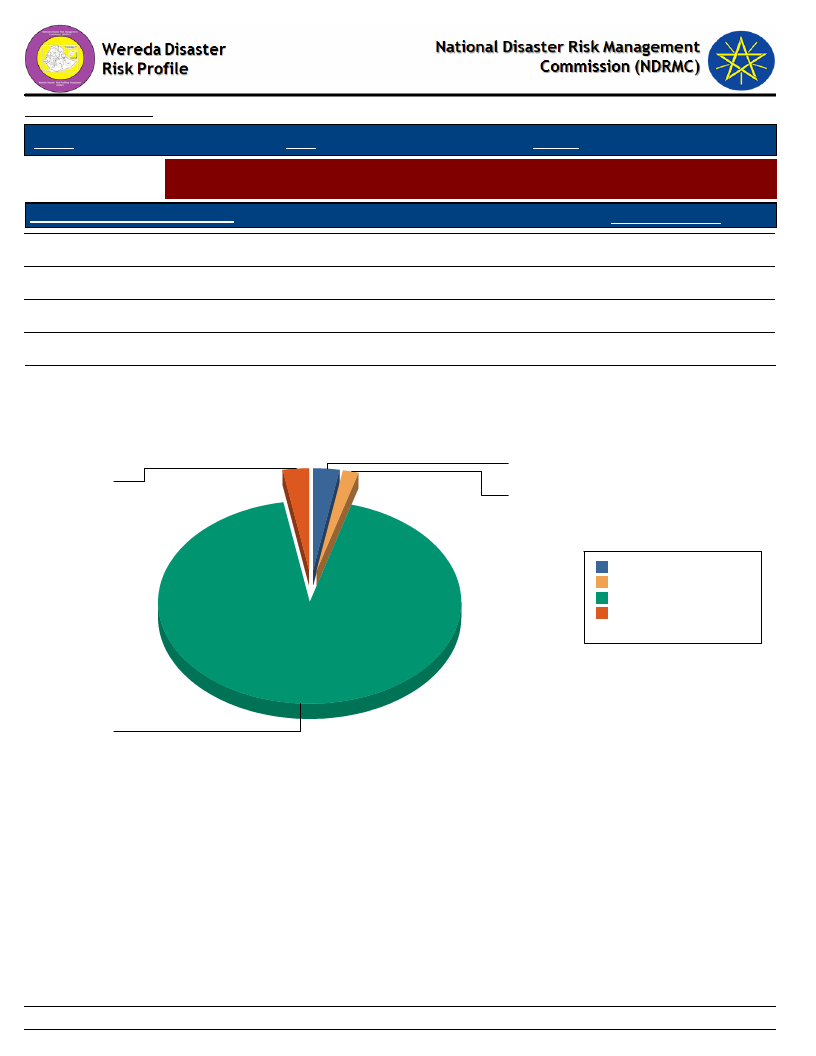
Conflicts: Perception of households on conflict issues - Is conflict an issue in this
community?
Is Conflict an Issue in Community?
Response_Percent
Yes
2.71
No
92.71
DK
2.88
NA
1.69
Is Conflict an Issue in Community?
DK
Yes
2.9
2.7
NA
1.7
DK
2.9 2.9%
NA
1.7 1.7%
No 92.7 92.7%
Yes 2.7 2.7%
Total: 100.0 100.0%
No
92.7
27
Page 1 of 1
Data_Collected_Date
Region S.N.N.P
Zone SILTIE
Tuesday, July 9, 2019
Wereda HULBAREG
Selected Indictor:
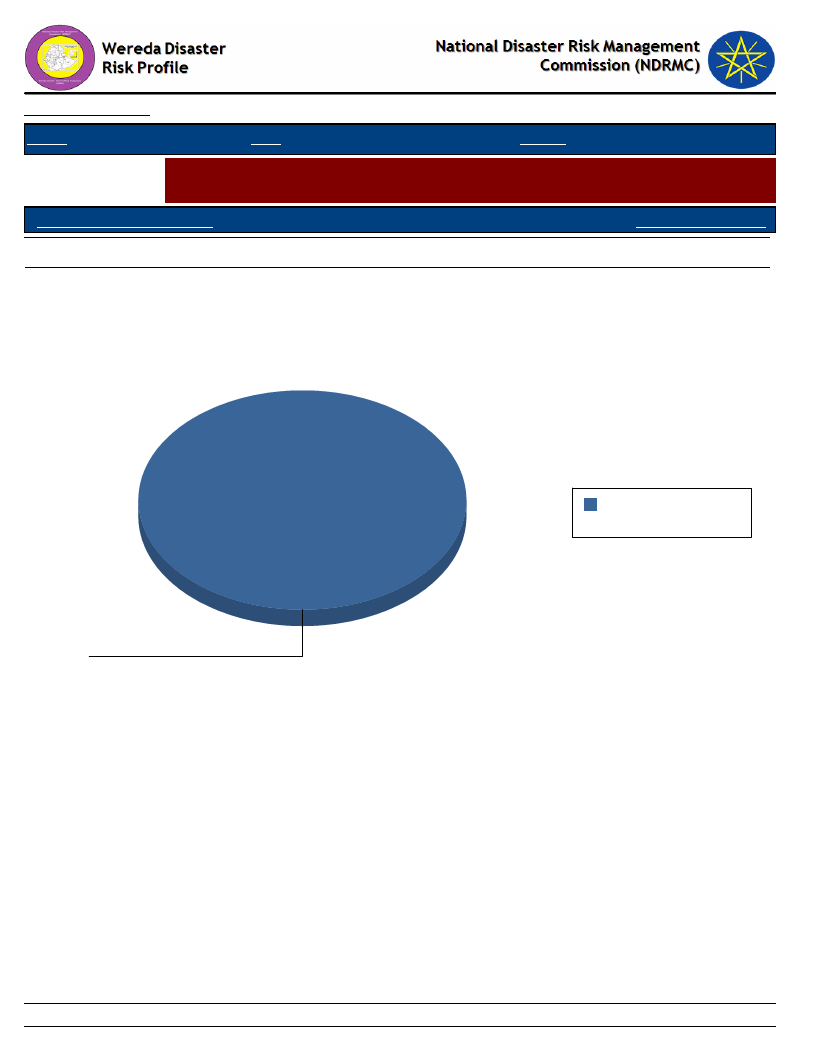
Conflicts: Perception of households on conflict issues - Who To Turn To in case
of Conflict?
Who To Turn During Conflict?
Response_Percentage
Elders
100.00
Who To Turn During Conflict?
Elders
100
Elders 100 100.0%
Total: 100 100.0%
28
Page 1 of 1
Data_Collected_Date
Region S.N.N.P
Zone SILTIE
Tuesday, July 9, 2019
Wereda HULBAREG
Selected Indictor: Losses from Disasters - Losses from all disasters (household response in %)
Type of Loss
Main_Loss_Percent
Secondary_Loss_Percent
Physical damages on houses and property
8.04
6.55
Crop damage
41.74
17.93
Livestock damage
19.87
16.55
Death of household members
2.01
0.69
Illness/health problems
13.17
10.69
Loss of access to social services, including school
0.00
0.69
Loss of income
6.03
34.83
Loss of savings
0.89
10.69
Lost access to grazing land
0.00
0.34
Lost access to water source
2.90
1.03
29
Page 1 of 1
Wereda Disaster
Risk Profile
National Disaster Risk Management
Commission (NDRMC)
Data_Collected_Date
Region S.N.N.P
Zone SILTIE
Wereda HULBAREG
Tuesday, July 9, 2019
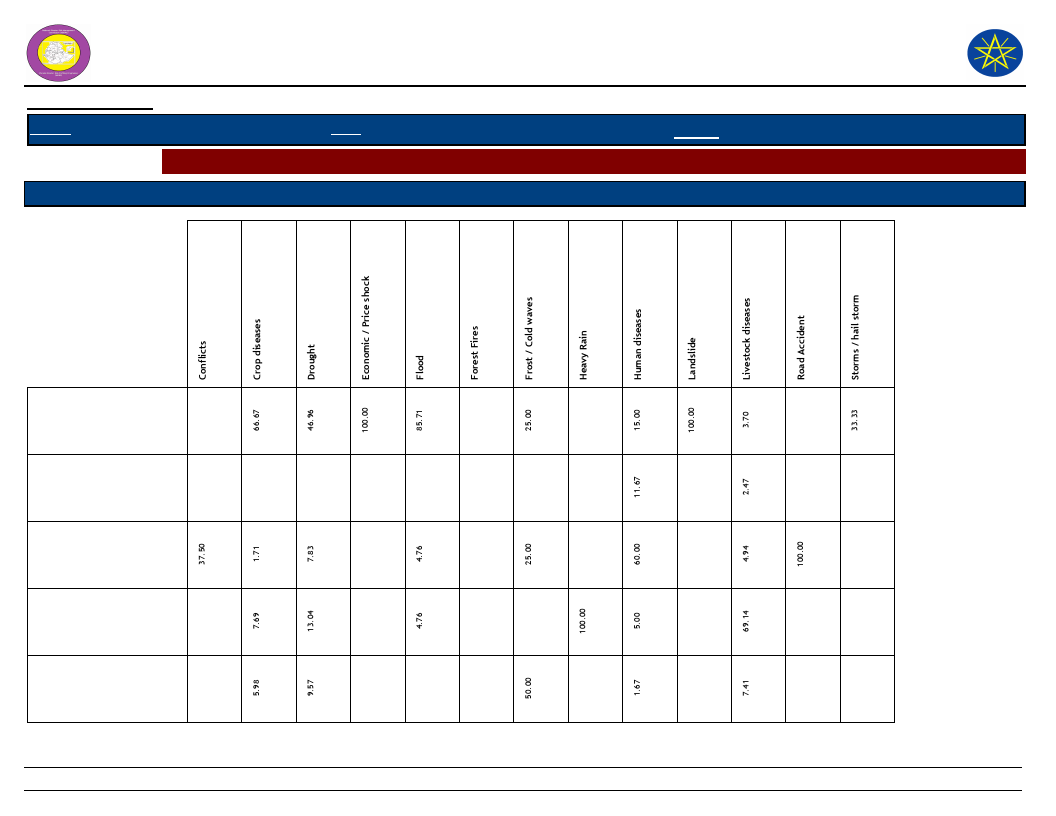
Selected Indictor: Losses from Disasters - Main Losses by Type of Disasters (household response in %)
Type of Loss
Type of Disasters which mainly caused Listed Losses
Crop damage
Death of household
members
Illness/health problems
Livestock damage
Loss of income
30
Page 1 of 2

Wereda Disaster
Risk Profile
National Disaster Risk Management
Commission (NDRMC)
Data_Collected_Date
Region S.N.N.P
Zone SILTIE
Wereda HULBAREG
Tuesday, July 9, 2019
Selected Indictor: Losses from Disasters - Main Losses by Type of Disasters (household response in %)
Type of Loss
Type of Disasters which mainly caused Listed Losses
Loss of savings
Lost access to water
source
No Losses
Other losses/damages
Physical damages on
houses and property
31
Page 2 of 2
Wereda Disaster Risk
Profile
Data_Collected_Date
Region S.N.N.P
Zone SILTIE
National Disaster Risk Management
Commission (NDRMC)
Wereda HULBAREG
Tuesday, July 9, 2019
Selected Indictor: Losses from Disasters - Secondary Losses by Type of Disasters (household response in %)
Type of Loss
Type of Disasters which caused Listed Secondary Losses
Crop damage
Death of household
members
Illness/health problems
Livestock damage
Loss of access to social
services, including school
50.00
18.60
10.39
8.00
100.00
2.33
8.14
20.78
8.00
26.74
10.39
100.00
28.00
2.60
32
11.36
34.88
100.00
9.09
100.00
2.27
16.28
Page 1 of 2

Wereda Disaster Risk
Profile
Data_Collected_Date
Region S.N.N.P
Zone SILTIE
National Disaster Risk Management
Commission (NDRMC)
Wereda HULBAREG
Tuesday, July 9, 2019
Selected Indictor: Losses from Disasters - Secondary Losses by Type of Disasters (household response in %)
Type of Loss
Type of Disasters which caused Listed Secondary Losses
Loss of income
50.00
36.05
37.66
Loss of savings
6.98
14.29
Lost access to grazing land
Lost access to water source
1.30
Physical damages on houses
and property
1.16
2.60
36.00
8.00
50.00
100.00
15.91
12.00
33
11.36
16.28
6.98
2.33
4.65
18.60
Page 2 of 2

Wereda Disaster
Risk Profile
Data_Collected_Date
National Disaster Risk Management
Commission (NDRMC)
Tuesday, July 9, 2019
Region S.N.N.P
Zone SILTIE
Wereda HULBAREG
Selected Indictor: Seasonal Calendar for Hazards, Activities and Income Level By Kebele
Month of Hazard
Major_Problems /Disasters
Hazard Severity
Rank
Agricultural_Activities
Kebele Name ALBEZER ZEMU SHIDGER
E - Jan (Tir)
Shortage of potable water for human and animal
1
Plough
Income
Level Rank
1st
F - Feb (Yekatit)
Shortage of potable water for human and animal
3
Plough
2nd
G - Mar (Megabit)
Shortage of food
3
Sowing
3rd
H - Apr (Meazea)
Shortage of food
1
Plough
5th
I - May (Ginbot)
Shortage of food
2
Sowing
9th
J - Jun (Sene)
Shortage of food
3
Weeding and cultivation
10th
K - Jul (Hamle)
Shortage of food
3
Plough
11th
L - Aug (Nehase)
Shortage of food
3
Sowing
12th
A - Sep (Meskerem)
Human disease
1
Weeding
8th
B - Oct (Tikimt)
Human disease
1
Weeding
7th
C - Nov (Hidar)
Human disease
3
Cultivation
6th
D - Dec (Tahsas)
Human disease
2
Harvesting
4th
NOTE: Hazard Severity Rank helps prioritize the more severe hazards that have occurred in the months of disaster occurrence, 3 being the worst and 1
the least severe hazards.
34
Page 1 of 13

Wereda Disaster
Risk Profile
Data_Collected_Date
National Disaster Risk Management
Commission (NDRMC)
Tuesday, July 9, 2019
Region S.N.N.P
Zone SILTIE
Wereda HULBAREG
Selected Indictor: Seasonal Calendar for Hazards, Activities and Income Level By Kebele
Month of Hazard
Major_Problems /Disasters
Hazard Severity
Rank
Agricultural_Activities
Kebele Name AMBERCHO GIMBA
E - Jan (Tir)
Cold weather
2
Trashing and plough
Income
Level Rank
1st
F - Feb (Yekatit)
Shortage of water and pasture
2
Cultivation
2nd
G - Mar (Megabit)
Shortage of water and pasture
3
Plough
3rd
H - Apr (Meazea)
Shortage of water and pasture
2
Plough
6th
I - May (Ginbot)
Shortage of water and pasture
1
Sowing
7th
J - Jun (Sene)
Shortage of food
1
Plough
10th
K - Jul (Hamle)
Shortage of food
2
Sowing
11th
L - Aug (Nehase)
Shortage of food
3
Weeding and cultivation
12th
A - Sep (Meskerem)
Human disease
3
Weeding and planting cabbage
9th
B - Oct (Tikimt)
Human disease
1
Weeding
8th
C - Nov (Hidar)
Human disease
2
Harvesting
5th
D - Dec (Tahsas)
Human disease
3
Harvesting
4th
NOTE: Hazard Severity Rank helps prioritize the more severe hazards that have occurred in the months of disaster occurrence, 3 being the worst and 1
the least severe hazards.
35
Page 2 of 13

Wereda Disaster
Risk Profile
Data_Collected_Date
National Disaster Risk Management
Commission (NDRMC)
Tuesday, July 9, 2019
Region S.N.N.P
Zone SILTIE
Wereda HULBAREG
Selected Indictor: Seasonal Calendar for Hazards, Activities and Income Level By Kebele
Month of Hazard
Major_Problems /Disasters
Hazard Severity
Rank
Agricultural_Activities
Kebele Name AMOBARACHO ACHAM
E - Jan (Tir)
Raise of temperature
2
Trashing
Income
Level Rank
2nd
F - Feb (Yekatit)
Raise of temperature
3
Trashing and plough
3rd
G - Mar (Megabit)
Water shortage
3
Plough
4th
H - Apr (Meazea)
Shortage of pasture
2
Sowing and plough
5th
I - May (Ginbot)
Shortage of pasture
3
Weeding and plough
9th
J - Jun (Sene)
Food shortage
1
Sowing
10th
K - Jul (Hamle)
Food shortage
2
Weeding
11th
L - Aug (Nehase)
Food shortage
3
Weeding
12th
A - Sep (Meskerem)
Food shortage
2
Weeding
6th
B - Oct (Tikimt)
Human disease
1
Weeding
7th
C - Nov (Hidar)
Human disease
2
Harvesting
8th
D - Dec (Tahsas)
Human disease
3
Harvesting
1st
NOTE: Hazard Severity Rank helps prioritize the more severe hazards that have occurred in the months of disaster occurrence, 3 being the worst and 1
the least severe hazards.
36
Page 3 of 13

Wereda Disaster
Risk Profile
Data_Collected_Date
National Disaster Risk Management
Commission (NDRMC)
Tuesday, July 9, 2019
Region S.N.N.P
Zone SILTIE
Wereda HULBAREG
Selected Indictor: Seasonal Calendar for Hazards, Activities and Income Level By Kebele
Month of Hazard
Major_Problems /Disasters
Hazard Severity
Rank
Agricultural_Activities
Kebele Name ANGAMO YODE
E - Jan (Tir)
Crop disease
2
Plough
Income
Level Rank
2nd
F - Feb (Yekatit)
1
Plough
4th
G - Mar (Megabit)
Livestock disease
1
Plough
8th
H - Apr (Meazea)
1
Plough
5th
I - May (Ginbot)
Drought
2
Sowing
6th
J - Jun (Sene)
1
Sowing
7th
K - Jul (Hamle)
1
Weeding
12th
L - Aug (Nehase)
Flood
2
Sowing
11th
A - Sep (Meskerem)
1
Weeding
10th
B - Oct (Tikimt)
1
Harvesting
9th
C - Nov (Hidar)
1
Harvesting
3rd
D - Dec (Tahsas)
1
Harvesting
1st
NOTE: Hazard Severity Rank helps prioritize the more severe hazards that have occurred in the months of disaster occurrence, 3 being the worst and 1
the least severe hazards.
37
Page 4 of 13

Wereda Disaster
Risk Profile
Data_Collected_Date
National Disaster Risk Management
Commission (NDRMC)
Tuesday, July 9, 2019
Region S.N.N.P
Zone SILTIE
Wereda HULBAREG
Selected Indictor: Seasonal Calendar for Hazards, Activities and Income Level By Kebele
Month of Hazard
Major_Problems /Disasters
Hazard Severity
Rank
Agricultural_Activities
Kebele Name BILA WANJA
E - Jan (Tir)
Shortage of water and pasture
2
Trashing
Income
Level Rank
1st
F - Feb (Yekatit)
Shortage of water and pasture
3
Fencing the backyard
2nd
G - Mar (Megabit)
Shortage of food
1
Plough
3rd
H - Apr (Meazea)
Shortage of food
1
Plough
4th
I - May (Ginbot)
Shortage of food
2
Sowing
5th
J - Jun (Sene)
Shortage of food
3
Weeding, plough and cultivating
6th
K - Jul (Hamle)
Shortage of food
3
Sowing
11th
L - Aug (Nehase)
Shortage of food
3
Weeding and cultivating
12th
A - Sep (Meskerem)
Human disease /Malaria /
3
Construction of cut off drain
10th
B - Oct (Tikimt)
Human disease/Malaria /
2
Feeding livestock
9th
C - Nov (Hidar)
Human disease Typhoid and typhus /
2
Harvesting
8th
D - Dec (Tahsas)
Human disease
3
Harvesting
7th
NOTE: Hazard Severity Rank helps prioritize the more severe hazards that have occurred in the months of disaster occurrence, 3 being the worst and 1
the least severe hazards.
38
Page 5 of 13

Wereda Disaster
Risk Profile
Data_Collected_Date
National Disaster Risk Management
Commission (NDRMC)
Tuesday, July 9, 2019
Region S.N.N.P
Zone SILTIE
Wereda HULBAREG
Selected Indictor: Seasonal Calendar for Hazards, Activities and Income Level By Kebele
Month of Hazard
Major_Problems /Disasters
Hazard Severity
Rank
Agricultural_Activities
Kebele Name BOLE
E - Jan (Tir)
Shortage of water and water borne diseases
2
plough with land tools, Threshing
Income
Level Rank
2nd
F - Feb (Yekatit)
Shortage of water
3
plough with land tools, sowing potato
3rd
G - Mar (Megabit)
Shortage of water
3
Plough with animal
4th
H - Apr (Meazea)
Shortage of water and food
3
Plough, sowing
5th
I - May (Ginbot)
Shortage of water and food
1
Sowing, planting cabbage
6th
J - Jun (Sene)
Shortage of food
2
Plough
10th
K - Jul (Hamle)
Shortage of food
3
Plough and sowing
11th
L - Aug (Nehase)
Shortage of food
3
Weeding and cultivation
12th
A - Sep (Meskerem)
Human disease
1
Fencing and transplanting
9th
B - Oct (Tikimt)
Human disease
2
Weeding and feeding livestock
8th
C - Nov (Hidar)
Human disease
3
Cultivating perennial crop and harvesting
7th
D - Dec (Tahsas)
Human disease
3
Harvesting and threshing
1st
NOTE: Hazard Severity Rank helps prioritize the more severe hazards that have occurred in the months of disaster occurrence, 3 being the worst and 1
the least severe hazards.
39
Page 6 of 13

Wereda Disaster
Risk Profile
Data_Collected_Date
National Disaster Risk Management
Commission (NDRMC)
Tuesday, July 9, 2019
Region S.N.N.P
Zone SILTIE
Wereda HULBAREG
Selected Indictor: Seasonal Calendar for Hazards, Activities and Income Level By Kebele
Month of Hazard
Major_Problems /Disasters
Hazard Severity
Rank
Agricultural_Activities
Kebele Name BRHAN KITKITA
E - Jan (Tir)
Water shortage and forage shortage
1
Plough
Income
Level Rank
1st
F - Feb (Yekatit)
Food shortage, Water shortage and forage shortage
3
Plough
2nd
G - Mar (Megabit)
Food shortage, Water shortage and forage shortage
3
Plough
3rd
H - Apr (Meazea)
Food shortage, Water shortage and forage shortage
3
Sowing
4th
I - May (Ginbot)
Food shortage, Water shortage and forage shortage
3
Sowing
5th
J - Jun (Sene)
Food shortage
2
Plough
10th
K - Jul (Hamle)
Food shortage
2
Sowing
11th
L - Aug (Nehase)
Human disease
3
Sowing
12th
A - Sep (Meskerem)
Human disease
3
Weeding
9th
B - Oct (Tikimt)
Human disease
2
Weeding
8th
C - Nov (Hidar)
Human disease
2
Harvesting
7th
D - Dec (Tahsas)
Human disease
1
Trashing
6th
NOTE: Hazard Severity Rank helps prioritize the more severe hazards that have occurred in the months of disaster occurrence, 3 being the worst and 1
the least severe hazards.
40
Page 7 of 13

Wereda Disaster
Risk Profile
Data_Collected_Date
National Disaster Risk Management
Commission (NDRMC)
Tuesday, July 9, 2019
Region S.N.N.P
Zone SILTIE
Wereda HULBAREG
Selected Indictor: Seasonal Calendar for Hazards, Activities and Income Level By Kebele
Month of Hazard
Major_Problems /Disasters
Hazard Severity
Rank
Agricultural_Activities
Kebele Name DATE WEZIR 6
E - Jan (Tir)
Shortage of water and pasture
2
Plough
Income
Level Rank
2nd
F - Feb (Yekatit)
Shortage of food, water and pasture
3
Plough
3rd
G - Mar (Megabit)
Shortage of food, water and pasture
3
Plough
4th
H - Apr (Meazea)
Shortage of food, water and pasture
2
Sowing
5th
I - May (Ginbot)
Shortage of food, water and pasture
2
Sowing
6th
J - Jun (Sene)
Food shortage
3
Cultivation
7th
K - Jul (Hamle)
Food shortage
2
Sowing
11th
L - Aug (Nehase)
Food shortage
1
Weeding
12th
A - Sep (Meskerem)
Human disease
2
Cultivation and livestock feeding
10th
B - Oct (Tikimt)
Human disease
3
Harvesting
9th
C - Nov (Hidar)
Frosty disease
3
Harvesting
8th
D - Dec (Tahsas)
Frosty disease
2
Trashing
1st
NOTE: Hazard Severity Rank helps prioritize the more severe hazards that have occurred in the months of disaster occurrence, 3 being the worst and 1
the least severe hazards.
41
Page 8 of 13

Wereda Disaster
Risk Profile
Data_Collected_Date
National Disaster Risk Management
Commission (NDRMC)
Tuesday, July 9, 2019
Region S.N.N.P
Zone SILTIE
Wereda HULBAREG
Selected Indictor: Seasonal Calendar for Hazards, Activities and Income Level By Kebele
Month of Hazard
Major_Problems /Disasters
Hazard Severity
Rank
Agricultural_Activities
Kebele Name DEMEQE
E - Jan (Tir)
Rise of sun heat, drought and shortage of water
1
Trashing
Income
Level Rank
1st
F - Feb (Yekatit)
Shortage of water and rise of sun heat
2
Plough
4th
G - Mar (Megabit)
Shortage of water and rise of sun heat
3
Plough
5th
H - Apr (Meazea)
Shortage of water and rise of sun heat
3
Plough and sowing
6th
I - May (Ginbot)
Shortage of water and rise of sun heat
3
Sowing
7th
J - Jun (Sene)
Shortage of food
1
Plough and sowing
8th
K - Jul (Hamle)
Shortage of food
2
Sowing, plough and cultivation
9th
L - Aug (Nehase)
Shortage of food
3
cultivation
12th
A - Sep (Meskerem)
Human disease
1
Planting cabbage and fencing
11th
B - Oct (Tikimt)
Human disease
2
Feeding livestock
10th
C - Nov (Hidar)
Human disease
3
Harvesting
3rd
D - Dec (Tahsas)
Human disease
2
Harvesting and trashing
2nd
NOTE: Hazard Severity Rank helps prioritize the more severe hazards that have occurred in the months of disaster occurrence, 3 being the worst and 1
the least severe hazards.
42
Page 9 of 13

Wereda Disaster
Risk Profile
Data_Collected_Date
National Disaster Risk Management
Commission (NDRMC)
Tuesday, July 9, 2019
Region S.N.N.P
Zone SILTIE
Wereda HULBAREG
Selected Indictor: Seasonal Calendar for Hazards, Activities and Income Level By Kebele
Month of Hazard
Major_Problems /Disasters
Hazard Severity
Rank
Agricultural_Activities
Kebele Name KEBELE 01
E - Jan (Tir)
Shortage of drinking water
2
Trashing
Income
Level Rank
2nd
F - Feb (Yekatit)
Shortage of drinking water
3
Trashing and plough
3rd
G - Mar (Megabit)
Shortage of food
1
plough
4th
H - Apr (Meazea)
Shortage of food
1
Sowing and plough
5th
I - May (Ginbot)
Shortage of food
1
Weeding and plough
9th
J - Jun (Sene)
Shortage of food
2
Plough and sowing
10th
K - Jul (Hamle)
Shortage of food
2
Sowing
11th
L - Aug (Nehase)
Shortage of food
3
Weeding
12th
A - Sep (Meskerem)
Human disease out break
1
Weeding
6th
B - Oct (Tikimt)
Human disease out break
2
Weeding
7th
C - Nov (Hidar)
Human disease out break
2
Harvesting
8th
D - Dec (Tahsas)
Human disease out break
3
Harvesting
1st
NOTE: Hazard Severity Rank helps prioritize the more severe hazards that have occurred in the months of disaster occurrence, 3 being the worst and 1
the least severe hazards.
43
Page 10 of 13
Wereda Disaster
Risk Profile
Data_Collected_Date
National Disaster Risk Management
Commission (NDRMC)
Tuesday, July 9, 2019
Region S.N.N.P
Zone SILTIE
Wereda HULBAREG
Selected Indictor: Seasonal Calendar for Hazards, Activities and Income Level By Kebele
Month of Hazard
Major_Problems /Disasters
Hazard Severity
Rank
Agricultural_Activities
Kebele Name OBISO WACHO
E - Jan (Tir)
Shortage of water and shortage of pasture
2
Plough crop land
Income
Level Rank
1st
F - Feb (Yekatit)
Shortage of water and shortage of pasture
3
Plough crop land
2nd
G - Mar (Megabit)
Shortage of food
1
Plough by animal power
3rd
H - Apr (Meazea)
Shortage of food
1
Sowing
4th
I - May (Ginbot)
Shortage of food
2
Cultivation and plough
10th
J - Jun (Sene)
Shortage of food
3
Plough and sowing
9th
K - Jul (Hamle)
Shortage of food
3
Sowing
11th
L - Aug (Nehase)
Shortage of food
3
Sowing and weeding
12th
A - Sep (Meskerem)
Human disease
3
Weeding
8th
B - Oct (Tikimt)
Human disease
2
Harvesting
7th
C - Nov (Hidar)
Human disease
1
Harvesting
6th
D - Dec (Tahsas)
Human disease
1
Trashing
5th
NOTE: Hazard Severity Rank helps prioritize the more severe hazards that have occurred in the months of disaster occurrence, 3 being the worst and 1
the least severe hazards.
44
Page 11 of 13

Wereda Disaster
Risk Profile
Data_Collected_Date
National Disaster Risk Management
Commission (NDRMC)
Tuesday, July 9, 2019
Region S.N.N.P
Zone SILTIE
Wereda HULBAREG
Selected Indictor: Seasonal Calendar for Hazards, Activities and Income Level By Kebele
Month of Hazard
Major_Problems /Disasters
Hazard Severity
Rank
Agricultural_Activities
Kebele Name TODE TEMEDE
E - Jan (Tir)
1
Planting vegetable by irrigation
Income
Level Rank
3rd
F - Feb (Yekatit)
1
Tilling lands by hand to vegetable
4th
G - Mar (Megabit)
Malaria
1
Tilling lands for maize if their is rain fall
5th
H - Apr (Meazea)
1
Tilling second round for maize farm land
6th
I - May (Ginbot)
1
Selling maize and sorghum
7th
J - Jun (Sene)
Animal disease
---------
Seeding of sorghum
8th
K - Jul (Hamle)
Crop disease
1
Tilling of land for Maher crop production
11th
L - Aug (Nehase)
Flood
---------
Seeding of wheat and teff
12th
A - Sep (Meskerem)
Flood
2
Weeding
10th
B - Oct (Tikimt)
Malaria
3
Weeding
9th
C - Nov (Hidar)
Malaria
3
Collection of Maher and Belg crop
2nd
D - Dec (Tahsas)
1
Harvesting
1st
NOTE: Hazard Severity Rank helps prioritize the more severe hazards that have occurred in the months of disaster occurrence, 3 being the worst and 1
the least severe hazards.
45
Page 12 of 13

Wereda Disaster
Risk Profile
Data_Collected_Date
National Disaster Risk Management
Commission (NDRMC)
Tuesday, July 9, 2019
Region S.N.N.P
Zone SILTIE
Wereda HULBAREG
Selected Indictor: Seasonal Calendar for Hazards, Activities and Income Level By Kebele
Month of Hazard
Major_Problems /Disasters
Hazard Severity
Rank
Agricultural_Activities
Kebele Name WERABAT SHAMA
E - Jan (Tir)
Shortage of water
2
Plough
Income
Level Rank
1st
F - Feb (Yekatit)
Shortage of water
3
Land preparation
2nd
G - Mar (Megabit)
Shortage of food and water
3
Plough
6th
H - Apr (Meazea)
Shortage of food and water
2
Sowing
7th
I - May (Ginbot)
Shortage of food and water
3
Plough, weeding and cultivated
8th
J - Jun (Sene)
Shortage of food
3
Plough
10th
K - Jul (Hamle)
Shortage of food
3
Sowing
11th
L - Aug (Nehase)
Shortage of food
1
Weeding
12th
A - Sep (Meskerem)
Human disease
2
Weeding
9th
B - Oct (Tikimt)
Human disease
2
Harvesting
5th
C - Nov (Hidar)
Human disease
3
Harvesting
4th
D - Dec (Tahsas)
Human disease
3
Trashing
3rd
NOTE: Hazard Severity Rank helps prioritize the more severe hazards that have occurred in the months of disaster occurrence, 3 being the worst and 1
the least severe hazards.
46
Page 13 of 13
WDRP Indicators
Infrastructure Access Characteristics
47
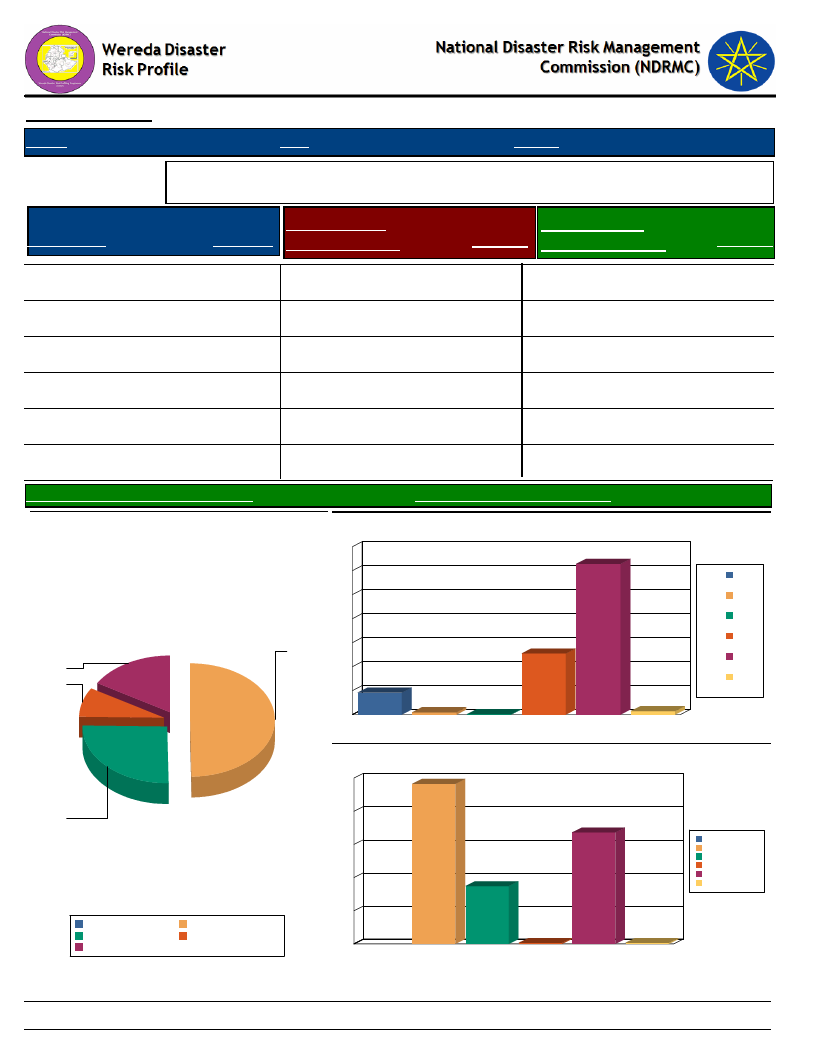
Data_Collected_Date
Region S.N.N.P
Zone SILTIE
Tuesday, July 9, 2019
Wereda HULBAREG
Selected Indicator
Type of Road
Physical Vulnerability: Access to Roads & Urban Centres - Households access to
road and urban centre
Time to Nearest
Response Paved Road (Mins.)
Time To Nearest
Response Urban Center (Mins.)
Response
Yes, partly paved road
3.43 30 – 60 min
25.45 1 - 2 hrs
48.29
Yes, gravel road
10.77 1 – 2 hrs
9.14 2 - 4 hrs
17.46
3 – 4 hrs
0.16 More than 6 hrs
0.33
More than 4 hrs
1.47
Yes, paved
6.85 Less than 30 min
62.81 Less than 1 hr
33.61
No road
20.72 2 – 3 hrs
0.98 4 - 6 hrs
0.33
Avg Time To Nearest Urban Center(Mins.)
Type of Road
21
7
3
11
Yes, gravel road
Yes, paved
No road
Yes, partly paved road
94.27
Avg_Time_To_Nearest_Paved_Road
41.11
Time to reach the nearest paved road from the HH
70
63
60
1 – 2 hrs
50
2 – 3 hrs
40
3 – 4 hrs
30
25
30 – 60 min
20
Less than 30 min
10
9
0
1 – 2 hrs
1
2 – 3 hrs
0
3 – 4 hrs
30 – 60 min
Less than 30
min
1
More than 4
hrs
More than 4 hrs
Time to reach nearest urban center from the HH
50
48
40
34
30
20
17
1 - 2 hrs
2 - 4 hrs
4 - 6 hrs
Less than 1 hr
More than 6 hrs
10
0
0
0
1 - 2 hrs
2 - 4 hrs
4 - 6 hrs
Less than 1 hr More than 6 hrs
48
Page 1 of 1
Data_Collected_Date
Region S.N.N.P
Zone SILTIE
Tuesday, July 9, 2019
Wereda HULBAREG
Selected Indicator
Physical Vulnerability: Access to Electricity - Households access and utilization
of electricity
Household_Located_In_Electricity
3.49
Household_Connected_To Electricity
1.98
49
Page 1 of 1
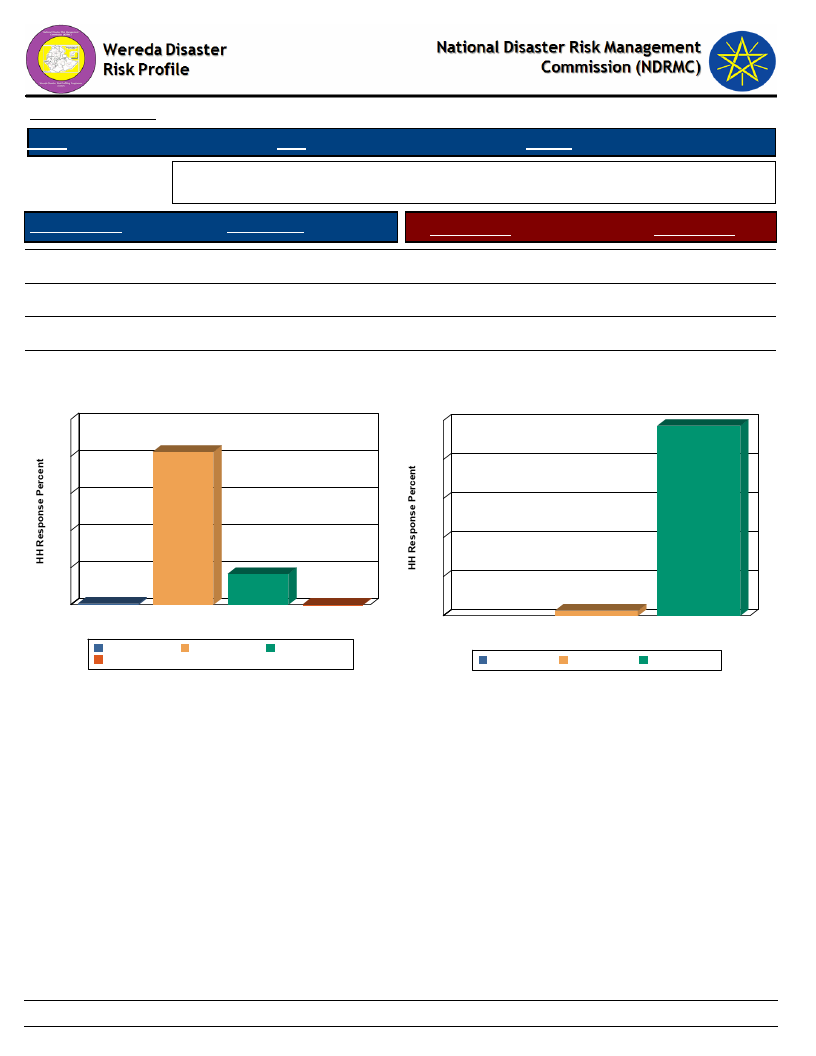
Data_Collected_Date
Region S.N.N.P
Zone SILTIE
Tuesday, July 9, 2019
Wereda HULBAREG
Selected Indicator
Floor Structure
Physical Vulnerability: Type of Dwelling Units - Households type of dwelling
houses
HH Response
Type of Floor
HH Response
Tin house
16.64
Concrete
2.69
Wood and mud
0.16
Non-Concrete
97.31
Mobile home
0.65
Thatched
82.54
Floor Structure
100
83
80
Type of Floor
100
97
80
60
60
40
40
20
17
20
1
0
0
Mobile home
Thatched
Tin house Wood and mud
0
Floor Structure
Mobile home
Wood and mud
Thatched
Tin house
3
Concrete
Type of Floor
Concrete
Non-Concrete
Non-Concrete
50
Page 1 of 1
WDRP Indicators
Socio Demographic Characteristics
51
Wereda Disaster
Risk Profile
Data_Collected_Date
National Disaster Risk Management
Commission (NDRMC)
Tuesday, July 9, 2019
Region S.N.N.P
Selected Indicator
Kebele Name
BOLE
Zone SILTIE
Wereda HULBAREG
Economic Vulnerability: Level of Migration - Migration level and its characteristics by Kebele
Approx_No. Age_Group
Sex
Migration_Period
Migration Trend
Migration_Reason
No data
---------
Destination
OBISO WACHO
---------
KEBELE 01
---------
ANGAMO YODE
AMOBARACHO ACHAM
TODE TEMEDE
DEMEQE
More than
100
Youth
More people
Youth and
worker
More than
60
Youth
Both
After December
Increased
M
January
Decreased
Male
January
Increased
Increased
To find job
opportunity and
generate income
Searching of
additional income
generating activities
To search job
opportunity and to
generate income
Urban area
Urban area
Urban area
WERABAT SHAMA
Increased
BILA WANJA
Increased
AMBERCHO GIMBA
Increased
ALBEZER ZEMU
SHIDGER
DATE WEZIR 6
Increased
Increased
52
Page 1 of 2

Wereda Disaster
Risk Profile
National Disaster Risk Management
Commission (NDRMC)
Data_Collected_Date
Tuesday, July 9, 2019
Region S.N.N.P
Zone SILTIE
Wereda HULBAREG
Selected Indicator
Economic Vulnerability: Level of Migration - Migration level and its characteristics by Kebele
Kebele Name
BRHAN KITKITA
Approx_No. Age_Group
Sex
Migration_Period
Migration Trend
Migration_Reason
Increased
Destination
53
Page 2 of 2
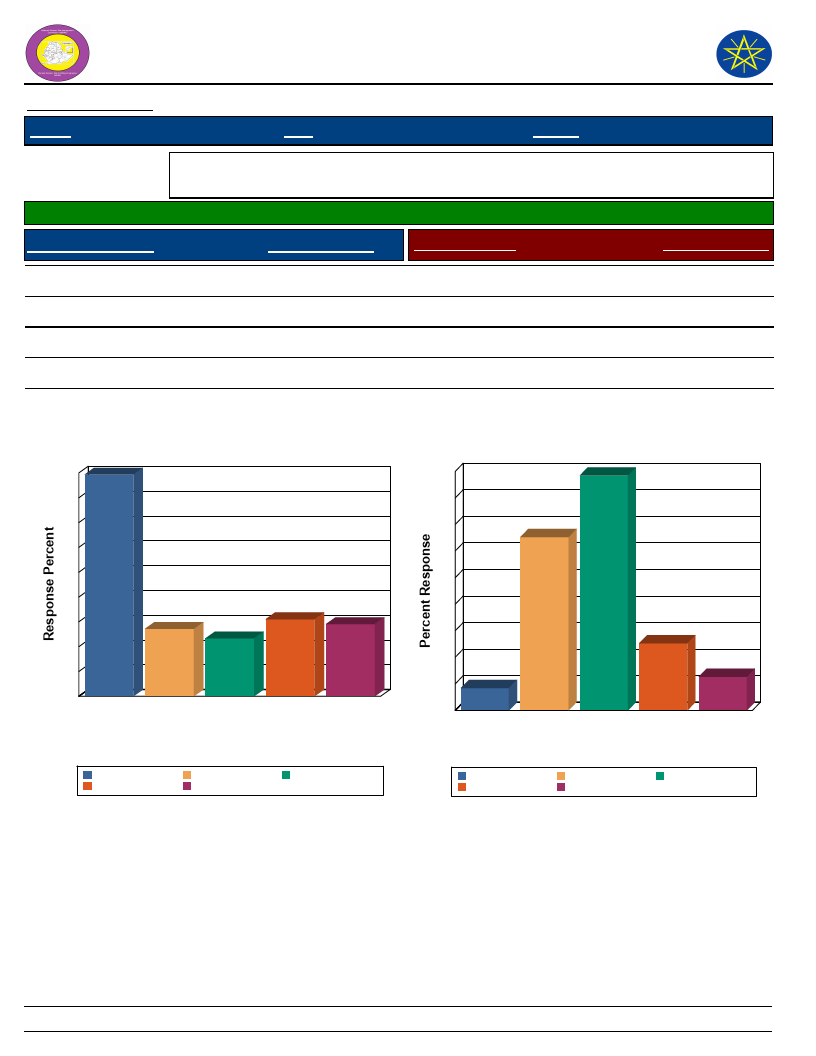
Wereda Disaster
Risk Profile
Data_Collected_Date
Region S.N.N.P
Zone SILTIE
National Disaster Risk Management
Commission (NDRMC)
Tuesday, July 9, 2019
Wereda HULBAREG
Selected Indicator
Economic Vulnerability: Household Migration - Household migration and reason
for migration
Households who migrated (%)
3.08
Duration of Migration
Response Percent
Migration Reason
Response Percent
Less than 2 weeks
Two weeks – month
3 – 6 months
> 6 months
A month – 3 months
15.53
14.56
13.59
44.66
11.65
Family reasons
Looking for work
Away at school
Other
Working elsewhere
32.63
44.21
4.21
12.63
6.32
Duration of Migration
45
45
40
35
30
25
20
15
14
16
15
12
10
5
0
>6
months
3 – 6 A month – Less than
months 3 months 2 weeks
Duration of Migration
Two
weeks –
month
> 6 months
Less than 2 weeks
3 – 6 months
Two weeks – month
A month – 3 months
Migration Reason
45
44
40
35
33
30
25
20
15
10
54
13
6
0
Away at Family Looking
school reasons for work
Other Working
elsewhere
Migration Reason
Away at school
Other
Family reasons
Working elsewhere
Looking for work
54
Page 1 of 1
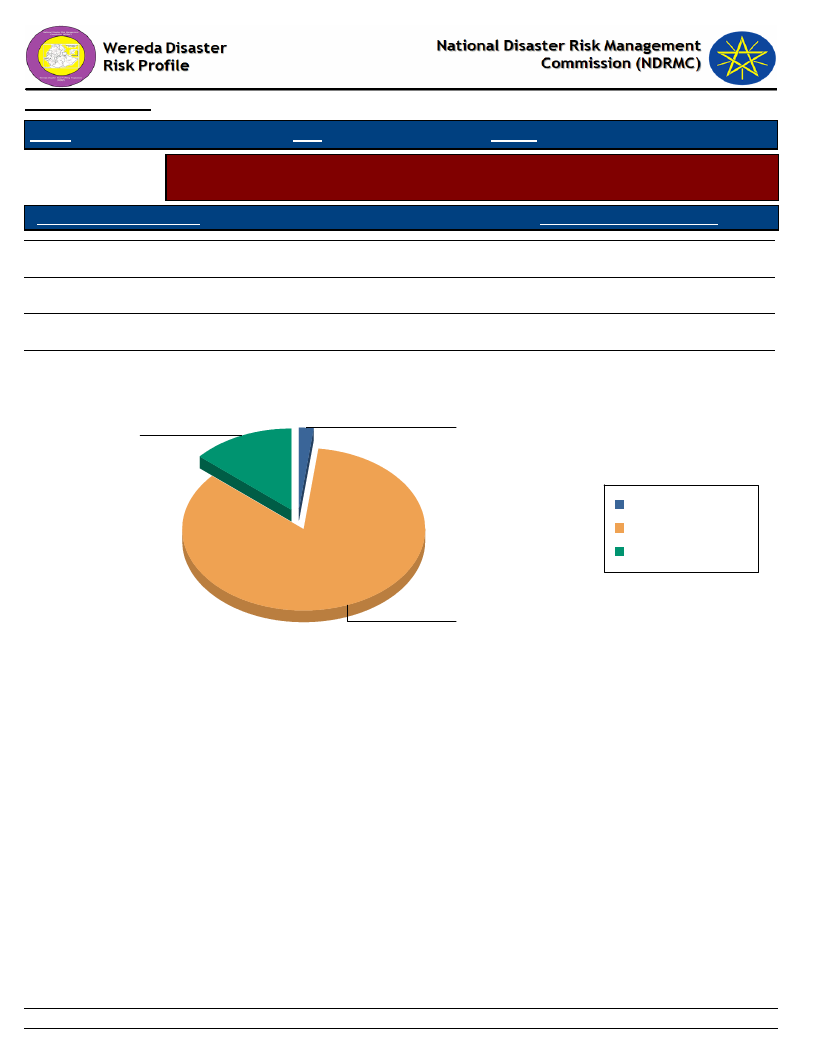
Data_Collected_Date
Tuesday, July 9, 2019
Region S.N.N.P
Zone SILTIE
Wereda HULBAREG
Selected Indicator
Economic Vulnerability: Household Migration - Disasters as a triggering factor for
migration (households response in %)
Is Migration Due to Hazard?
HH Response - Due To Hazard
No
85.59
Yes
13.71
Migration partly because of such impacts
1.93
Is Migration Due to Hazard?
Yes
13.7
Migration partly because of such
impacts
1.9
Migration partly because
of such impacts
No
Yes
No
85.6
55
Page 1 of 1
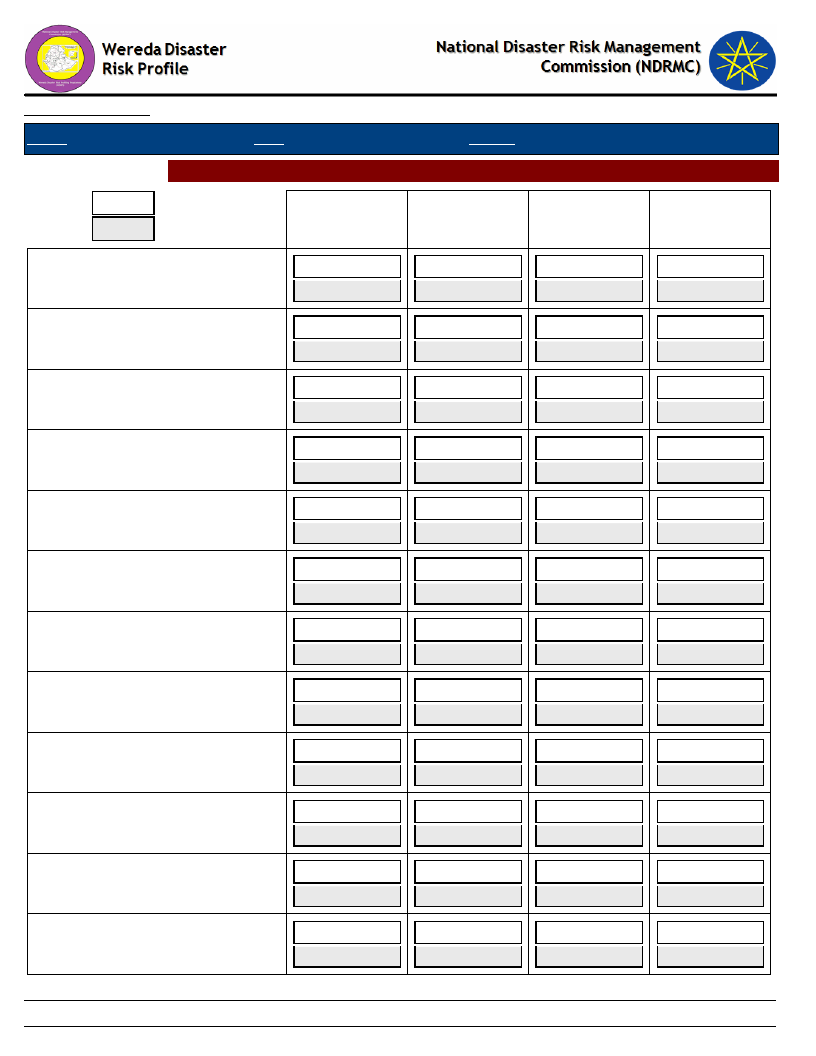
Data_Collected_Date
Region S.N.N.P
Zone SILTIE
Selected Indictor: Demography: Population Structure
KEY:
Male
Female
A-Children
(0-12 yrs)
ALBEZER ZEMU SHIDGER
-
-
AMBERCHO GIMBA
55
45
AMOBARACHO ACHAM
-
45
ANGAMO YODE
-
-
BILA WANJA
54
46
BOLE
54
46
BRHAN KITKITA
-
-
DATE WEZIR 6
54
46
DEMEQE
54
46
KEBELE 01
54
46
OBISO WACHO
-
-
TODE TEMEDE
-
-
Wereda HULBAREG
Tuesday, July 9, 2019
B-Youth
(12-25 yrs)
-
-
48
52
-
-
-
-
48
52
48
52
-
-
49
51
48
52
48
52
-
-
-
-
C-Working
(25-55 yrs)
-
-
43
57
-
-
-
-
43
57
43
57
-
-
44
56
43
57
44
56
-
-
44
56
D-Older
(Above 55
-
-
48
52
-
-
-
-
49
51
50
50
-
-
48
52
50
50
50
50
-
-
50
50
56
Page 1 of 2
Data_Collected_Date
Region S.N.N.P
Zone SILTIE
Selected Indictor: Demography: Population Structure
A-Children
(0-12 yrs)
WERABAT SHAMA
-
-
Wereda HULBAREG
Tuesday, July 9, 2019
B-Youth
(12-25 yrs)
-
-
C-Working
(25-55 yrs)
-
-
D-Older
(Above 55
-
-
57
Page 2 of 2

Data_Collected_Date
Region S.N.N.P
Zone SILTIE
Wereda HULBAREG
Tuesday, July 9, 2019
Selected Indicator
Demography: Population Trends and Ethnic Groups
Kebele Name
Population Change Trend
Population Change Reasons
Ethnic_Groups
BOLE
OBISO WACHO
KEBELE 01
ANGAMO YODE
AMOBARACHO
ACHAM
TODE TEMEDE
DEMEQE
WERABAT SHAMA
BILA WANJA
AMBERCHO GIMBA
ALBEZER ZEMU
SHIDGER
DATE WEZIR 6
BRHAN KITKITA
Increased
Increased
Increased
Increased
Increased
Increased
Increased
Increased
Increased
Increased
Increased
Increased
Increased
More children and low death rate
More children
Un proper usage of family planning
More children
Un proper use of family planning
and health extension service
Lack of awareness about family
planning
More children
More children and poor family
planning
More children and low death rate
More children
More children
More children
More children
Silte
Silte
silte
Silte
Silte
Silte
Silte
Silte
Silte
Silte
Silte
Silte
58
Page 1 of 1
Data_Collected_Date
Tuesday, July 9, 2019
Region S.N.N.P
Zone
SILTIE
Wereda HULBAREG
Selected Indicator
Social Vulnerability: Household Demographic Characteristics - Demographic
characteristics of households
Demographic Indicator
Indicator_Value Comments
Average household size
6.0
Sex ratio
947.0 Number of females per 1000 males
Child sex ratio (under 14 yrs)
903.0 Number of females per 1000 males
Adult sex ratio (18 & Above yrs)
1,026.0 Number of females per 1000 males
Dependency ratio ([(0-14)+(64+)] / (15-64)
0.8
yrs)
59
Page 1 of 1
Wereda Disaster
Risk Profile
Data_Collected_Date
National Disaster Risk Management
Commission (NDRMC)
Tuesday, July 9, 2019
Region S.N.N.P
Selected Indicator
General Awareness
Zone
SILTIE
Wereda HULBAREG
Social Vulnerability: Level of Educational Attainment - Education status of household members
Percentage Educational Level
Percentage
Read and understand text - Yes, easily
Read and understand text - Yes, with
difficulty
Can write letters - Yes, easily
Can write letters - Yes, with difficulty
General Literacy Rate
Proportion of literate population (7+) to total 7+
population
27.95
14.84
From Proportion of population (7+) - Less than 1st grade completed
Primary Education (Grade 1 - 6) Student
25.82
13.31
Secondary School Education (7 - 12) Student
From Proportion of population (7+) - Technical / vocational
certificate or diploma
From Proportion of population (15+) - Technical
From Proportion of population (15+) - Pursuing or completed
University
UNIVERSITY DEGREE
From Proportion of population (7+) - Pursuing University degree
From Proportion of population (7+) - University degree or higher
From Proportion of population (15+) - Less than 1st grade
From Proportion of population (15+) - Primary (1-6)
From Proportion of population (15+) - Secondary (7-12)
Percentage
17.75
Adult Literacy Rate
Proportion of literate population (15+) to total 15+
population
41.94
48.58
8.72
0.21
0.29
0.38
0.14
0.27
0.10
50.21
38.32
10.52
Percentage
15.82
60
Page 1 of 1

Data_Collected_Date
Tuesday, July 9, 2019
Region S.N.N.P
Zone SILTIE
Wereda HULBAREG
Selected Indicator
Educational Level
Social Vulnerability: Gender Parity - Gender parity in education level (7+ years)
and household heading
Male_Percent
Female_Percent
From Proportion of population (7+) - Less than 1st grade
completed
From Proportion of population (7+) - Technical / vocational
certificate or diploma
From Proportion of population (7+) - University diploma
40.02
50.00
0.00
59.98
50.00
0.00
From Proportion of population (7+) - Pursuing University degree
75.00
25.00
From Proportion of population (7+) - University degree or higher
0.00
100.00
Primary Education (Grade 1 - 6) Student
57.34
42.66
Secondary School Education (7 - 12) Student
69.42
30.58
Male Head of HH
91.44
Female Head of HH
8.56
61
Page 1 of 1
WDRP Indicators
Environmental Characteristics
62

Data_Collected_Date
Region S.N.N.P
Zone SILTIE
Wereda HULBAREG
Tuesday, July 9, 2019
Selected Indicator
Environmental Situation: Environmental Problems - Major environmental
problems by Kebele
KebeleName
Problem_1
Problem_2
Problem_3
Problem4
BOLE
Soil erosion
Deforestation
Water pollution
OBISO WACHO
Soil erosion
Deforestation
Pests
Water change
KEBELE 01
Soil erosion
Deforestation
Pests
ANGAMO YODE
Soil erosion
Pests
Water pollution
Deforestation
AMOBARACHO
ACHAM
TODE TEMEDE
Land degradation
Soil erosion
Deforestation
Deforestation
Crop pests
Pests
Water pollution
DEMEQE
Soil erosion
Water pollution
Deforestation
Pests
WERABAT SHAMA
Soil erosion
Degradation
Climate change
BILA WANJA
Deforestation
Soil erosion
Water pollution
Crop pest
AMBERCHO GIMBA
Soil erosion
Deforestation
Pests
ALBEZER ZEMU
SHIDGER
DATE WEZIR 6
Soil erosion
Soil erosion
Deforestation
Degradation
pests
Pests
BRHAN KITKITA
Soil erosion
Deforestation
crop pest
63
Page 1 of 1
Data_Collected_Date
Tuesday, July 9, 2019
Region S.N.N.P
Zone SILTIE
Wereda HULBAREG
Selected Indicator
Environmental Situation: General Land Quality - Perceptions of the community
on changes in the general quality of land over a decade
KebeleName
Current_Situation
Change_Last_Decade
Comment
BOLE
Grazing land change to crop
land
OBISO WACHO
KEBELE 01
Bare land change in to forest
land
Severely degraded
Over last decade grazing
land size becomes decline
and crop land size becomes
increased.
Increase
Increase
ANGAMO YODE
AMOBARACHO
ACHAM
Low quality of land
Degraded and fragmented
Decreasing
Decrease
TODE TEMEDE
Increasing of population
growth and availability
of pasture for livestock.
Due to the establishment
of environmental
rehabilitation program
Due to demographic
pressure and continuous
plough of cultivated land
Due to use of expired
fertilizer
Due to over grazing and
un proper land use
system the land use
condition is poor and it
should be improved
through conservation
measures.
DEMEQE
Grazing land changing to crop
land
WERABAT SHAMA
BILA WANJA
AMBERCHO
GIMBA
ALBEZER ZEMU
SHIDGER
Grazing land changed in to
cultivated land
Grazing land change to
cultivated land
Grazing land changed in to
crop land
Grazing land change in to
cultivated land
DATE WEZIR 6
Grazing land in to crop land
Increasing
Increase
Increase
Increase
Remaining the same
Increase
64
Due to high rate of
population that force to
get additional crop land
Due to high population
growth
Due to high population
growth the land changed
Because of high
population growth
Due to the presence of
soil and water
conservation institution
Due to high population
growth
Page 1 of 2

Data_Collected_Date
Tuesday, July 9, 2019
Region S.N.N.P
Zone SILTIE
Wereda HULBAREG
Selected Indicator
Environmental Situation: General Land Quality - Perceptions of the community
on changes in the general quality of land over a decade
KebeleName
Current_Situation
Change_Last_Decade
Comment
BRHAN KITKITA
Grazing land change in to
crop land
Increase
Due to high population
the land use change
65
Page 2 of 2
Data_Collected_Date
Tuesday, July 9, 2019
S.N.N.P
Region
Selected Indicator
Zone SILTIE
Wereda HULBAREG
Environmental Situation: Changes in Landscape - Changes observed by the
community on landscape and the problems due to the changes
KebeleName
Changes_Observed
Problems_Due_To_Changes
BOLE
OBISO WACHO
KEBELE 01
ANGAMO YODE
AMOBARACHO ACHAM
TODE TEMEDE
Over last decade grazing
land changed in to crop
land and due to the
presence of high livestock
in a given area
Land use, degraded land
were rehabilitate and land
cover
Land use changed over last
decades due to soil erosion
and less of soil fertility
Changed from annual crop
to chat and incent
The forest land change in
to cultivated land and the
coverage will be diminished
and changed to bare land
and the severity of
degradation level increased
Grazing land to farm land
Shortage of pasture of livestock, soil erosion and
loss of land productivity
Due to lack of awareness and high population
rate
Loss of productivity and decreasing of income
No problem
Food shortage and loss of forest product.
Lack of livestock portage and grazing land
DEMEQE
WERABAT SHAMA
BILA WANJA
AMBERCHO GIMBA
ALBEZER ZEMU SHIDGER
DATE WEZIR 6
Grazing land changing in to
crop land
Grazing land changed to
cultivated land
The land use system and
the land cover were
diminished
Grazing land change in to
crop land
Grazing land change in to
crop land
Grazing land changed in to
crop land
Lack of pasture land, Economic problem and
nutrition problem
Shortage of pasture for their animal and low
productivity of livestock
Due to the change of grazing land in to crop land
livestock forage problem can be the big problem
and loss of the upper land cover the soil fertility
can be decline
Shortage of animal pasture and economic crisis
Shortage of pasture
Shortage of animal pasture
66
Page 1 of 2

Data_Collected_Date
Tuesday, July 9, 2019
S.N.N.P
Region
Selected Indicator
Zone SILTIE
Wereda HULBAREG
Environmental Situation: Changes in Landscape - Changes observed by the
community on landscape and the problems due to the changes
KebeleName
Changes_Observed
Problems_Due_To_Changes
BRHAN KITKITA
Grazing land change in to
crop land
Shortage of pasture and reduction of animal
products
67
Page 2 of 2

Wereda Disaster Risk
Profile
Data_Collected_Date
Region S.N.N.P
Zone SILTIE
National Disaster Risk Management
Commission (NDRMC)
Tuesday, July 9, 2019
Wereda HULBAREG
Selected Indicator
Kebele Name
Environmental Situation: Land-Use other than crop production - Types of land use other than crop production
across Kebeles
Landuse_1
Comments_1
Landuse_2
Comments_2
Landuse_3
Comments_3
BOLE
OBISO WACHO
Grazing and Forest land
Grazing and forest
Less production size /
its important /
Less productivity
KEBELE 01
ANGAMO YODE
AMOBARACHO ACHAM
TODE TEMEDE
Communal land /bare/
Harvesting annual crop
Grazing and forest
Cultivated land
Less productive and
less important
More than 50% of the
total land
The land is
fragmented /loss
productivity/ and the
production is
good/important for
the community/
50%
Forest land /bush/
Grazing land
Grazing land
Very important
and conserved
Small land
10%
Forest land
Forest
Around river
2%
DEMEQE
WERABAT SHAMA
BILA WANJA
AMBERCHO GIMBA
Grazing land
Grazing land
Grazing land
Grazing land
Less production size
Less productive size
The production size
Loss productive size
Forest land
Forest land
Forest land
Forest land
Less production
size
Less productive
size
The production
size
Loss productive
size
68
Page 1 of 2
Wereda Disaster Risk
Profile
Data_Collected_Date
Region S.N.N.P
Zone SILTIE
National Disaster Risk Management
Commission (NDRMC)
Tuesday, July 9, 2019
Wereda HULBAREG
Selected Indicator
Kebele Name
ALBEZER ZEMU
SHIDGER
DATE WEZIR 6
BRHAN KITKITA
Environmental Situation: Land-Use other than crop production - Types of land use other than crop production
across Kebeles
Landuse_1
Comments_1
Landuse_2
Comments_2
Landuse_3
Forest
Less production size
Grazing
Less production
size
Grazing land
Grazing land
The production size is
less
Less productive
Forest land
Forest land
The production
size is less
Less productive
Comments_3
69
Page 2 of 2

Data_Collected_Date
Region S.N.N.P
Zone SILTIE
Tuesday, July 9, 2019
Wereda HULBAREG
Selected Indicator
KebeleName
Environmental Situation: Deforestation - Observed changes over levels of
deforestation by the community and its problems
Changes_Observed
Problems_Due_To_Changes
BOLE
OBISO WACHO
KEBELE 01
ANGAMO YODE
AMOBARACHO
ACHAM
TODE TEMEDE
Improvement of
afforestation and
replanting activity,
productive safety net
program and public
work, but still their is
deforestation.
Decrease
Level of deforestation
decrease over a time
Decreasing
Deforestation is
increased in order to
get cultivated land
Increasing
Shortage of fuel wood
Climate change, rain season fluctuation, loss of
construction material and fuel wood are the main problem
faced by the community due to deforestation but currently
it becomes changing through afforestation.
Increasing of warm and creation of irregular rain fall
The expansion of un wanted plant which have the negative
impact on natural environment
Drought and land degradation and production and
productivity is decline.
High temperature
DEMEQE
WERABAT SHAMA
BILA WANJA
There is a progressive
change in replanting
the bare land through
safety net program
By establishing
productive safety net
program and mass
mobilization to
decrease
deforestation
Increase
AMBERCHO GIMBA
Decrease
Health problem, land degradation, less productivity of land
and drought
Shortage of fuel wood, climate change and rain fall
fluctuation
The raise of temperature and distribution of health and loss
of fire wood and construction material.
Shortage of fuel wood, construction material and forest
production
70
Page 1 of 2

Data_Collected_Date
Region S.N.N.P
Zone SILTIE
Tuesday, July 9, 2019
Wereda HULBAREG
Selected Indicator
KebeleName
Environmental Situation: Deforestation - Observed changes over levels of
deforestation by the community and its problems
Changes_Observed
Problems_Due_To_Changes
ALBEZER ZEMU
SHIDGER
DATE WEZIR 6
Decrease
Decrease
Shortage of construction material and fuel wood
Lack of forest products, fuel wood and rain fall fluctuation
BRHAN KITKITA
Decrease
Shortage of fuel wood
71
Page 2 of 2
Wereda Disaster
Risk Profile
National Disaster Risk Management
Commission (NDRMC)
Data_Collected_Date
Region S.N.N.P
Zone SILTIE
Wereda HULBAREG
Tuesday, July 9, 2019
Selected Indicator
KebeleName
Environmental Situation: Natural Resources Availability - Natural resources available and changes observed by
the community
ALBEZER ZEMU SHIDGER
Resources_1
Land
Resources_3
Forest
Observed_Change_1
Decreased
Observed_Change_3
Decrease
Problems_Changes_1
Land holding become minimize
Problems_Changes_3
Construction and fuel wood shortage
Resources_2
Observed_Change_2
Problems_Changes_2
Water
Decrease
Water shortage
Resources_4
Observed_Change_4
Problems_Changes_4
KebeleName
AMBERCHO GIMBA
Resources_1
Land
Observed_Change_1
Land becomes fragmented
Problems_Changes_1
Resources_2
Land holding capacity becomes decrease
and shortage of food
Water
Observed_Change_2
Become decrease
Problems_Changes_2
Shortage of animal and human water
Resources_3
Observed_Change_3
Problems_Changes_3
Resources_4
Observed_Change_4
Problems_Changes_4
Forest
Become decrease
Fuel wood and shortage of construction
material
KebeleName
AMOBARACHO ACHAM
72
Page 1 of 7
Wereda Disaster
Risk Profile
National Disaster Risk Management
Commission (NDRMC)
Data_Collected_Date
Region S.N.N.P
Zone SILTIE
Wereda HULBAREG
Tuesday, July 9, 2019
Selected Indicator
Resources_1
Observed_Change_1
Problems_Changes_1
Environmental Situation: Natural Resources Availability - Natural resources available and changes observed by
the community
Land
Resources_3
Forest
Fertility decreased
Observed_Change_3
Decreased
Loss of production
Problems_Changes_3
Drought and fluctuation
Resources_2
Observed_Change_2
Problems_Changes_2
Water
Decreased
Loss of human and animal
Resources_4
Observed_Change_4
Problems_Changes_4
Fuel wood
Decreased
Construction and fuel wood problem
KebeleName
ANGAMO YODE
Resources_1
Land
Observed_Change_1
Increasing
Problems_Changes_1
Increasing of soil erosion
Resources_3
Observed_Change_3
Problems_Changes_3
Water
Decreasing
Lack of house hold water consumption
Resources_2
Observed_Change_2
Problems_Changes_2
Forest
Increasing
Increasing of wild animal
Resources_4
Observed_Change_4
Problems_Changes_4
KebeleName
BILA WANJA
73
Page 2 of 7

Wereda Disaster
Risk Profile
National Disaster Risk Management
Commission (NDRMC)
Data_Collected_Date
Region S.N.N.P
Zone SILTIE
Wereda HULBAREG
Tuesday, July 9, 2019
Selected Indicator
Resources_1
Observed_Change_1
Problems_Changes_1
Resources_2
Environmental Situation: Natural Resources Availability - Natural resources available and changes observed by
the community
Land
Resources_3
Forest
decline
Observed_Change_3
Decrease
Deforestation and land degradation
Water
Problems_Changes_3
Resources_4
Deforestation makes the forest land in to
bare and crop land
Observed_Change_2
Decrease
Problems_Changes_2
Deforestation affect surface and ground
water availability
KebeleName
BOLE
Resources_1
Land
Observed_Change_1
Decrease
Problems_Changes_1
Shortage of crop land and food shortage
Resources_2
Observed_Change_2
Problems_Changes_2
Water
Decrease
Death of animal
Observed_Change_4
Problems_Changes_4
Resources_3
Observed_Change_3
Problems_Changes_3
Resources_4
Observed_Change_4
Problems_Changes_4
Forest
Decrease
Shortage of fuel wood and change of
weather condition
KebeleName
BRHAN KITKITA
74
Page 3 of 7
Wereda Disaster
Risk Profile
National Disaster Risk Management
Commission (NDRMC)
Data_Collected_Date
Region S.N.N.P
Zone SILTIE
Wereda HULBAREG
Tuesday, July 9, 2019
Selected Indicator
Resources_1
Observed_Change_1
Problems_Changes_1
Resources_2
Environmental Situation: Natural Resources Availability - Natural resources available and changes observed by
the community
Land
Resources_3
Forest
Decrease
Observed_Change_3
Decrease
Loss of productive land and shortage of
food
Water
Problems_Changes_3
Resources_4
Shortage of fuel wood and construction
material and climate change
Observed_Change_2
Problems_Changes_2
Decrease
Water shortage
Observed_Change_4
Problems_Changes_4
KebeleName
DATE WEZIR 6
Resources_1
Land
Observed_Change_1
Decrease
Problems_Changes_1
Resources_2
Shortage of crop and grazing land leads to
loss of production
Water
Resources_3
Observed_Change_3
Problems_Changes_3
Resources_4
Forest
Decrease
Raise of temperature, rain fall fluctuation
and health problem
Wood
Observed_Change_2
Decrease
Problems_Changes_2
Shortage of animal and human drinking
water
KebeleName
DEMEQE
Observed_Change_4
Problems_Changes_4
Decrease
Lack of fuel wood and construction material
75
Page 4 of 7
Wereda Disaster
Risk Profile
National Disaster Risk Management
Commission (NDRMC)
Data_Collected_Date
Region S.N.N.P
Zone SILTIE
Wereda HULBAREG
Tuesday, July 9, 2019
Selected Indicator
Resources_1
Observed_Change_1
Problems_Changes_1
Resources_2
Environmental Situation: Natural Resources Availability - Natural resources available and changes observed by
the community
Land
Resources_3
Water
Land fragmentation and fertility problem
Observed_Change_3
Water resource shortage increase
Shortage of cultivated land and food
shortage
Forest
Problems_Changes_3
Resources_4
Health and sanitation problem
Observed_Change_2
Decrease
Problems_Changes_2
Shortage of fuel wood and forest product
and drought
KebeleName
KEBELE 01
Resources_1
Land
Observed_Change_1
Fertility level decline
Problems_Changes_1
Resources_2
Production and productivity is decreased
/food shortage/
River
Observed_Change_2
Diminished
Problems_Changes_2
Water stress
Observed_Change_4
Problems_Changes_4
Resources_3
Observed_Change_3
Problems_Changes_3
Resources_4
Observed_Change_4
Problems_Changes_4
Forest
Decrease
Construction /fuel wood become less/
KebeleName
OBISO WACHO
76
Page 5 of 7
Wereda Disaster
Risk Profile
National Disaster Risk Management
Commission (NDRMC)
Data_Collected_Date
Region S.N.N.P
Zone SILTIE
Wereda HULBAREG
Tuesday, July 9, 2019
Selected Indicator
Resources_1
Environmental Situation: Natural Resources Availability - Natural resources available and changes observed by
the community
Land
Resources_3
Water
Observed_Change_1
Increase
Observed_Change_3
Increase
Problems_Changes_1
Resources_2
Observed_Change_2
Before the last decade due to soil erosion
production become decline
forest
Increase
Problems_Changes_3
Resources_4
Observed_Change_4
Due to the presence of water harvesting
structure and other percolation and
currently it is good but for the last decades
we face water stress.
Problems_Changes_2
Deforestation is the main problem of the
community before the last decade and it
graduates soil erosion and loss of forest
products.
KebeleName
TODE TEMEDE
Problems_Changes_4
Resources_1
Land
Resources_3
Water
Observed_Change_1
Increasing
Observed_Change_3
Constant
Problems_Changes_1
Increasing of temperature
Problems_Changes_3
Resources_2
Observed_Change_2
Problems_Changes_2
Forest
Decreasing
Drought
Resources_4
Observed_Change_4
Problems_Changes_4
KebeleName
WERABAT SHAMA
77
Page 6 of 7
Wereda Disaster
Risk Profile
National Disaster Risk Management
Commission (NDRMC)
Data_Collected_Date
Region S.N.N.P
Zone SILTIE
Wereda HULBAREG
Tuesday, July 9, 2019
Selected Indicator
Resources_1
Observed_Change_1
Problems_Changes_1
Resources_2
Environmental Situation: Natural Resources Availability - Natural resources available and changes observed by
the community
Land
Resources_3
Water
The land become fragmented and fertility
decline
Less land holding capacity, less production
and shortage of food
Forest
Observed_Change_3
Problems_Changes_3
Resources_4
Decrease
Shortage of water for domestic animal and
house hold consumption
Observed_Change_2
Problems_Changes_2
Decrease
Shortage of fuel wood, construction material
and wood product
Observed_Change_4
Problems_Changes_4
78
Page 7 of 7
Wereda Disaster
Risk Profile
National Disaster Risk Management
Commission (NDRMC)
Data_Collected_Date
Region S.N.N.P
Selected Indicator
Zone SILTIE
Wereda HULBAREG
Environmental Situation: Rainfall & Temperature - Observed changes on rainfall and temperature by the
community over the last decade
Rainfall
Temperature
Tuesday, July 9, 2019
Kebele Name
Changes Observed Problems
Changes Observed
Problems
BOLE
OBISO WACHO
KEBELE 01
ANGAMO YODE
AMOBARACHO
ACHAM
TODE TEMEDE
DEMEQE
Improvement in
duration, intensity
and distribution of
rain fall
Its good
Level of rain fall
becoming
decrease
Decreasing and un
regular rain fall
Fluctuated
Decreasing
By improving
environmental
protection
activities to
improve rain fall
Crop damage and shortage of water
Rain season fluctuation, heavy rain
fall, erratic rain fall and drought,
but currently it become changing.
Expose to drought
Exposed to flood
Drought, loss of production and loss
of pasture.
Loss of crop productivity
Flood and loss of assets
Increase
Health problem and crop damage
Increase
Disturbance of human health
Temperature
increase from time
to time
Increasing
Un safety life and increasing of human
and animal decrease
To increase frequency of drought
Increased
Increasing
Increase
Human and animal disease increased,
death and loss of assets.
Drought
Health problem
79
Page 1 of 3

Wereda Disaster
Risk Profile
National Disaster Risk Management
Commission (NDRMC)
Data_Collected_Date
Region S.N.N.P
Selected Indicator
Zone SILTIE
Wereda HULBAREG
Environmental Situation: Rainfall & Temperature - Observed changes on rainfall and temperature by the
community over the last decade
Rainfall
Temperature
Tuesday, July 9, 2019
Kebele Name
WERABAT SHAMA
BILA WANJA
AMBERCHO GIMBA
Changes Observed Problems
Due to the
application of
different
environmental
protection activity
the distribution as
well as intensity
of rain becomes
improved over the
last decade but
before it become
the basic problem
for crop loss
Crop damage and high production
loss
Level of rain fall
the last decade
were fluctuated
Disturbance of production season
and loss of crop
Due to
environmental
protection
practice the
duration and
intensity of rain
fall improved
Loss of crop production
Changes Observed
Problems
Increase
Different health problem and crop
damage
Increase
Due to global
warming the
temperature of
the area becomes
increase
Disturbance of health and loss of crop
product
Human health disturbance and animal
health disturbance
80
Page 2 of 3

Wereda Disaster
Risk Profile
National Disaster Risk Management
Commission (NDRMC)
Data_Collected_Date
Region S.N.N.P
Selected Indicator
Zone SILTIE
Wereda HULBAREG
Environmental Situation: Rainfall & Temperature - Observed changes on rainfall and temperature by the
community over the last decade
Rainfall
Temperature
Tuesday, July 9, 2019
Kebele Name
ALBEZER ZEMU
SHIDGER
DATE WEZIR 6
BRHAN KITKITA
Changes Observed
Increase
Problems
Its distribution,
intensity and
duration
fluctuation is the
basic problem of
the area
Fluctuated
Crop damage and loss of production
Destruction of agricultural crop
calendar
Changes Observed
Problems
Increase
Increase global warming
Increase
Health problem, loss of pasture before
the usual season
Increase
Health problem and loss of crop
81
Page 3 of 3
Data_Collected_Date
Region S.N.N.P
Zone SILTIE
Tuesday, July 9, 2019
Wereda HULBAREG
Selected Indicator
KebeleName
Environmental Situation: Reasons for Environmental Changes
Reason_For_Environmental_Changes
BOLE
OBISO WACHO
KEBELE 01
Population growth and expansion of farm land
ANGAMO YODE
Change of weather condition and expansion of cultivated land
AMOBARACHO ACHAM
Population growth, deforestation and Over grazing
TODE TEMEDE
DEMEQE
The main cause of environmental change is expansion of cultivated land
and high run off water.
Demographic prevalence is the main cause of the environmental change.
WERABAT SHAMA
High population growth
BILA WANJA
AMBERCHO GIMBA
Demographic pressure, expansion of cultivated land, free grazing and
poor management practice.
High population growth and high livestock population
ALBEZER ZEMU SHIDGER
DATE WEZIR 6
Demographic pressure, land degradation, deforestation and global
warming
Topographic situation of the area
BRHAN KITKITA
Traditional agricultural practice, more children and deforestation
82
Page 1 of 1
Data_Collected_Date
Region S.N.N.P
Zone SILTIE
Tuesday, July 9, 2019
Wereda HULBAREG
Selected Indicator
KebeleName
BOLE
OBISO WACHO
KEBELE 01
ANGAMO YODE
Environmental Situation: Soil Erosion - Observed changes on levels of soil
erosion by the community
Changes_Observed
Problems_Observed
Because of different
interventions of
physical soil and
water conservation
measures applied in
bare land and private
land.
Decrease
Level of soil erosion
becoming decreasing
due to water shed
management
Decreasing
Loss of land productivity, land degradation and land
fragmentation
Loss of fertile to soil, land fragmentation, loss of land
productivity and food shortage are the main problems
faced by the community, but currency this becomes
mitigate through soil and water conservation practice.
Increasing of farming land
AMOBARACHO ACHAM
TODE TEMEDE
Increased
Increasing
Land productivity is decreased and the community
faced food shortage for above 6 months per annul.
Loss of soil fertility
DEMEQE
Due to high
intervention of soil
and water
conservation practice
through mass
mobilization free
labor contribution
and productive safety
net program public
work over the last
decade
Land fragmentation, loss of top soil and food shortage
83
Page 1 of 2
Data_Collected_Date
Region S.N.N.P
Zone SILTIE
Tuesday, July 9, 2019
Wereda HULBAREG
Selected Indicator
KebeleName
WERABAT SHAMA
BILA WANJA
AMBERCHO GIMBA
ALBEZER ZEMU
SHIDGER
DATE WEZIR 6
BRHAN KITKITA
Environmental Situation: Soil Erosion - Observed changes on levels of soil
erosion by the community
Changes_Observed
By establishing
productive safety net
program, public work
and mass mobilization
it can be conserve
water and soil at
community and
private land
Increase
Due to mass
mobilization soil and
water conservation
activities improved
Decrease
Problems_Observed
Less production and productivity and shortage of food
Loss of productive land and crop production and
productivity were decline
Loss of crop production, food shortage and land
fragmentation
High production and productivity
Decrease
Decrease
Less crop production, shortage of food and land
fragmentation
Loss of crop products and land fragmentation
84
Page 2 of 2
WDRP Indicators
Livelihood, Occupation and Source
of Food Characteristics
85

Wereda Disaster
Risk Profile
Data_Collected_Date
National Disaster Risk Management
Commission (NDRMC)
Tuesday, July 9, 2019
Region S.N.N.P
Zone
SILTIE
Wereda HULBAREG
Selected Indicator
Economic Vulnerability: Major Occupational Categories - Major categories of occupation and percent of population
engaged in the occupation by Kebele
Occupational Categories and Percent of Population engaged within these occupational categories
Percent (%) of Population
KebeleName
Occupation 1
Population Occupation 2
Population Occupation 3
Population Occupation 4
Population
BOLE
OBISO WACHO
KEBELE 01
Agriculture ( crop
production) -
Agriculture -
Agriculture -
50% Livestock production -
80% Perennial crop production
-
90
Daily labor -
20%
Agriculture ( perennial
30%
-
crop production) -
10%
Livestock production -
10%
-
7
Patty trade -
3
-
ANGAMO YODE
Agriculture -
85
Petty trade -
15
-
-
AMOBARACHO
ACHAM
TODE TEMEDE
Mixed agriculture -
Crop production and
raring of livestock
Crop production -
95
Pity trade - Selling
purchasing consumption
good
95% Livestock production -
3
Daily labor - Migrate
2
-
to urban area
5%
-
-
DEMEQE
Agriculture -
90
Livestock production -
7
Pity trade -
3
-
WERABAT SHAMA
BILA WANJA
AMBERCHO GIMBA
ALBEZER ZEMU
SHIDGER
Agriculture /crop
production annual / -
Agriculture /crop
production / -
Agriculture /crop
production/ -
Agriculture -
85
Agriculture /perennial
crop production / -
75
Livestock production -
5
Petty trade -
25
-
90
Pity trade -
5
Labor work -
80
Livestock production -
10
Patty trade -
86
5
Animal production -
-
5
-
10
-
5
Page 1 of 2
Wereda Disaster
Risk Profile
Data_Collected_Date
National Disaster Risk Management
Commission (NDRMC)
Tuesday, July 9, 2019
Region S.N.N.P
Zone
SILTIE
Wereda HULBAREG
Selected Indicator
Economic Vulnerability: Major Occupational Categories - Major categories of occupation and percent of population
engaged in the occupation by Kebele
Occupational Categories and Percent of Population engaged within these occupational categories
Percent (%) of Population
KebeleName
Occupation 1
Population Occupation 2
Population Occupation 3
Population Occupation 4
Population
DATE WEZIR 6
Perennial crop -
60
Agriculture -
40
-
-
BRHAN KITKITA
Agriculture -
80
Livestock production -
10
Petty trade -
10
-
87
Page 2 of 2

Data_Collected_Date
Region S.N.N.P
Zone SILTIE
Tuesday, July 9, 2019
Wereda HULBAREG
Selected Indicator
Economic Vulnerability: Livelihoods - Households important sources of
livelihood (response in %)
Type of Livelihood Activity
Order of Importnce
Agricultural laborer
1st
2nd
3rd
0.98
4.28
0.95
Animal herder
0.00
3.53
6.67
Basket-making, Mat-making
0.16
0.25
0.00
Buying and selling livestock (cattle, sheep, goats, camels)
0.33
0.00
1.90
Carpenter, Furniture-maker, or Metal-worker
0.00
2.77
2.86
Daily laborer
4.57
29.97
17.14
Henna (decoration)
0.33
0.00
0.00
House-maid (domestic servant)
0.00
0.76
0.00
Making traditional utensils or farm tools
0.98
0.50
0.00
Others
0.33
2.52
2.86
Pottery
0.00
2.27
2.86
Rearing & selling animals (camels, cattle, sheep, goats)
1.31
18.89
14.29
Religious teacher
0.00
0.00
1.90
88
Page 1 of 3

Data_Collected_Date
Region S.N.N.P
Zone SILTIE
Tuesday, July 9, 2019
Wereda HULBAREG
Selected Indicator
Economic Vulnerability: Livelihoods - Households important sources of
livelihood (response in %)
Type of Livelihood Activity
Order of Importnce
1st
2nd
3rd
Salaried job
0.00
1.01
0.00
Sale_Of_Natural_Products - Animal feed (grass, fodder, forage, salty
sand, etc.)
Sale_Of_Natural_Products - Charcoal
0.00
0.25
0.00
0.65
0.00
2.86
Sale_Of_Natural_Products - Construction materials (sand, grass,
wooden poles, etc.)
Sale_Of_Natural_Products - Firewood
0.00
0.00
0.95
0.00
0.76
3.81
Sale_Of_Natural_Products - Wild fruits
0.33
0.00
0.00
Selling Cereal food crops (sorghum, maize, wheat, barley)
84.99
12.59
5.71
Selling Chat / Khat
3.10
11.84
16.19
Selling cooked food
0.00
0.50
2.86
Selling dairy products (milk, butter, ghee, cheese)
0.65
2.77
4.76
Selling eggs (from own chickens) Beekeeping (selling honey
bees-wax, or bee-hives)
Selling fruit juice (orange, etc) or soft drink (Fanta, etc)
0.49
1.51
3.81
0.33
0.00
0.00
Selling meat (from own livestock)
0.49
0.00
2.86
89
Page 2 of 3

Data_Collected_Date
Region S.N.N.P
Zone SILTIE
Tuesday, July 9, 2019
Wereda HULBAREG
Selected Indicator
Economic Vulnerability: Livelihoods - Households important sources of
livelihood (response in %)
Type of Livelihood Activity
Order of Importnce
1st
2nd
3rd
Selling Other foods (sugar, flour, coffee, etc.)
0.00
1.26
0.00
Selling Root crops (Irish potato, sweet potato)
0.00
1.01
1.90
Selling tea, coffee, cake, bread, “areki”, “tella”
0.00
0.00
1.90
Selling Vegetables (onion, tomato, cabbage, pumpkin, etc.)
0.00
0.76
0.95
90
Page 3 of 3

Data_Collected_Date
Region S.N.N.P
Zone SILTIE
Tuesday, July 9, 2019
Wereda HULBAREG
Selected Indicator
Economic Vulnerability: Occupational Categories - Percent of population
above 15 years age by occupation categories
Type of Livelihood Activity
Main Occupation
Secondary Occupation
B)Student
C)Unemployed & seeking work
D)Neither studying nor working nor seeking work
E)Retired/ Old
F)Cultivator
G)Agricultural labourer
H)Livestock rearing
I)Non-agricultural labour
J)Craftsman
K)Shopkeeper and Petty trade
L)Home-maker (housewife)
M)Salaried
N)Chronically ill
O)Physically disabled
P)Others (specify)
R)Herder
S)Herder
1st Occupation
20.44
3.66
1.29
3.50
35.07
3.93
0.05
3.07
0.11
1.13
25.12
0.11
0.81
0.81
0.91
2nd Occupation
2.45
1.96
1.47
2.21
2.21
2.70
14.22
35.29
5.15
17.65
4.17
1.96
2.94
5.64
91
Page 1 of 1
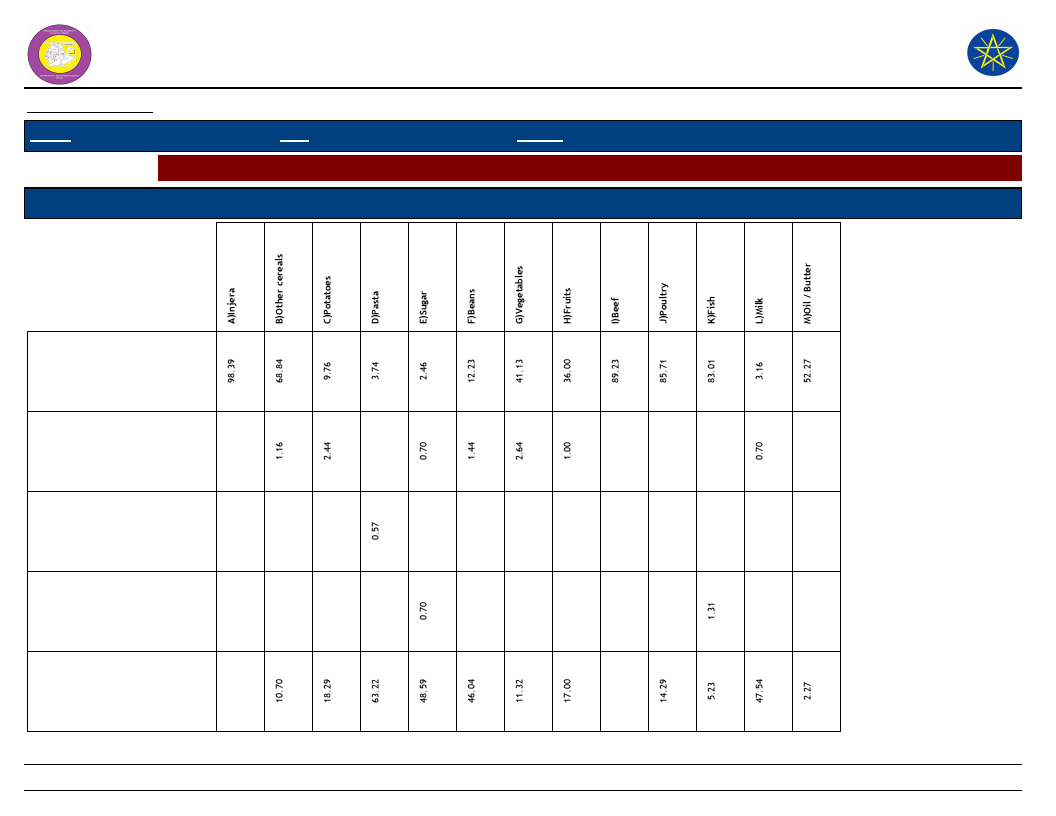
Wereda Disaster Risk
Profile
National Disaster Risk Management
Commission (NDRMC)
Data_Collected_Date
Region S.N.N.P
Zone SILTIE
Wereda HULBAREG
Tuesday, July 9, 2019
Selected Indictor: Economic Vulnerability: Sources of Food - Households source for different food items (response in %)
Source of Food
Types of Food Item
A)Own
cultivation/production
B)Casual labor
C)Borrowed
D)Gifts from
friends/neighbors
E)Purchases from main
shop
92
Page 1 of 2
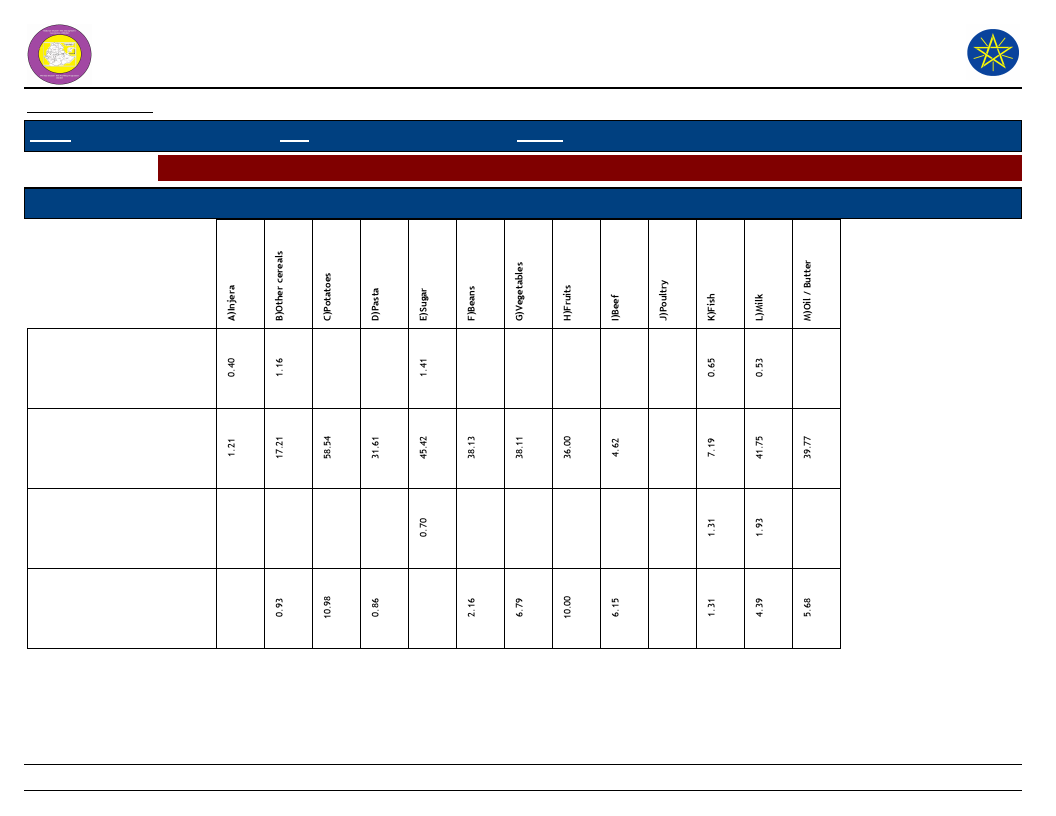
Wereda Disaster Risk
Profile
National Disaster Risk Management
Commission (NDRMC)
Data_Collected_Date
Region S.N.N.P
Zone SILTIE
Wereda HULBAREG
Tuesday, July 9, 2019
Selected Indictor: Economic Vulnerability: Sources of Food - Households source for different food items (response in %)
Source of Food
Types of Food Item
F)Free meals/Food
assistance
G)Purchase from
roadside vendor/tuck
shop
H)Purchase subsidized
food from Kebele shop
K)Other
93
Page 2 of 2
WDRP Indicators
Crop Production Characteristics
94
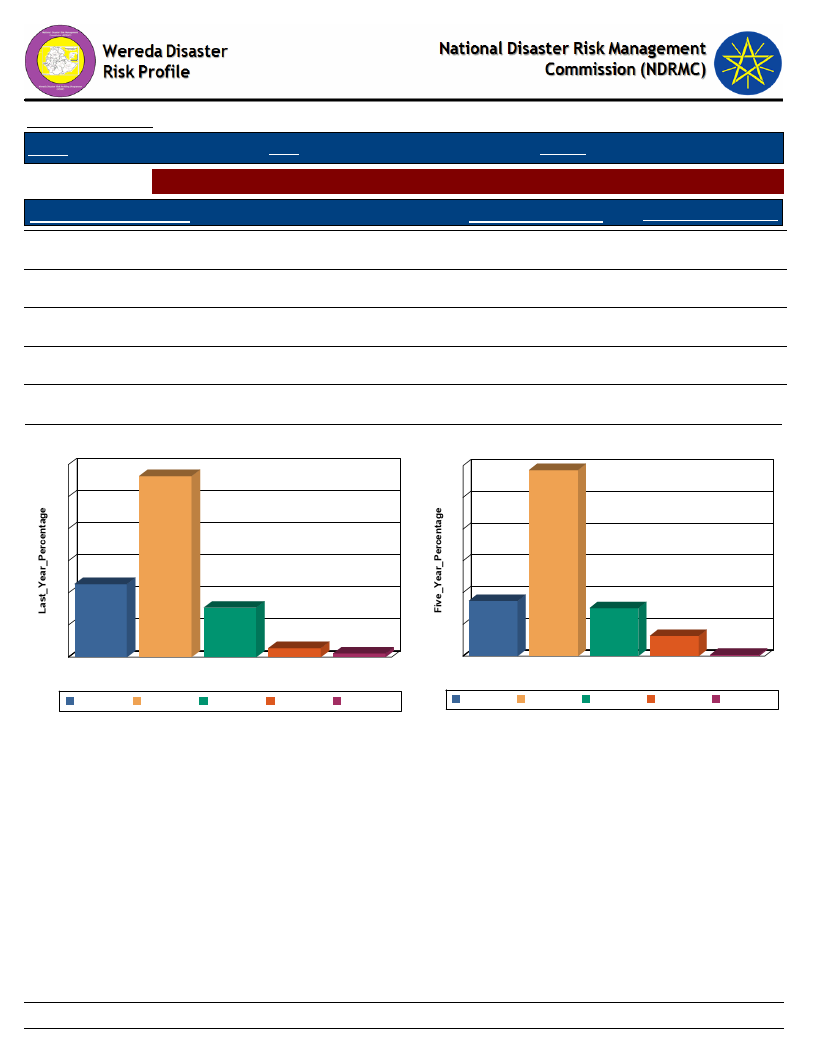
Data_Collected_Date
Region S.N.N.P
Zone SILTIE
Tuesday, July 9, 2019
Wereda HULBAREG
Selected Indictor: Hazards: Change in Crop Damages - Proportion of Total Crop Damage
Extent of Crop Damage (%)
0%
Last_Year_Percentage
22.77
Five_Year_Percentage
17.37
1 - 25 %
56.44
58.62
26 - 50 %
15.42
15.11
51 - 75 %
2.83
6.36
76 - 100 %
1.13
0.42
Extent of Crop Damage Last_Year
60
56
50
40
30
23
20
10
0
0%
0%
15
3
1 - 25 %
26 - 50 %
51 - 75 %
Extent of Crop Damage
1 - 25 %
26 - 50 %
51 - 75 %
1
76 - 100 %
76 - 100 %
Extent of Crop Damage Five Years Ago
60
59
50
40
30
20
17
10
0
0%
0%
15
6
1 - 25 %
26 - 50 % 51 - 75 %
Extent of Crop Damage
0
76 - 100 %
1 - 25 %
26 - 50 %
51 - 75 %
76 - 100 %
95
Page 1 of 1
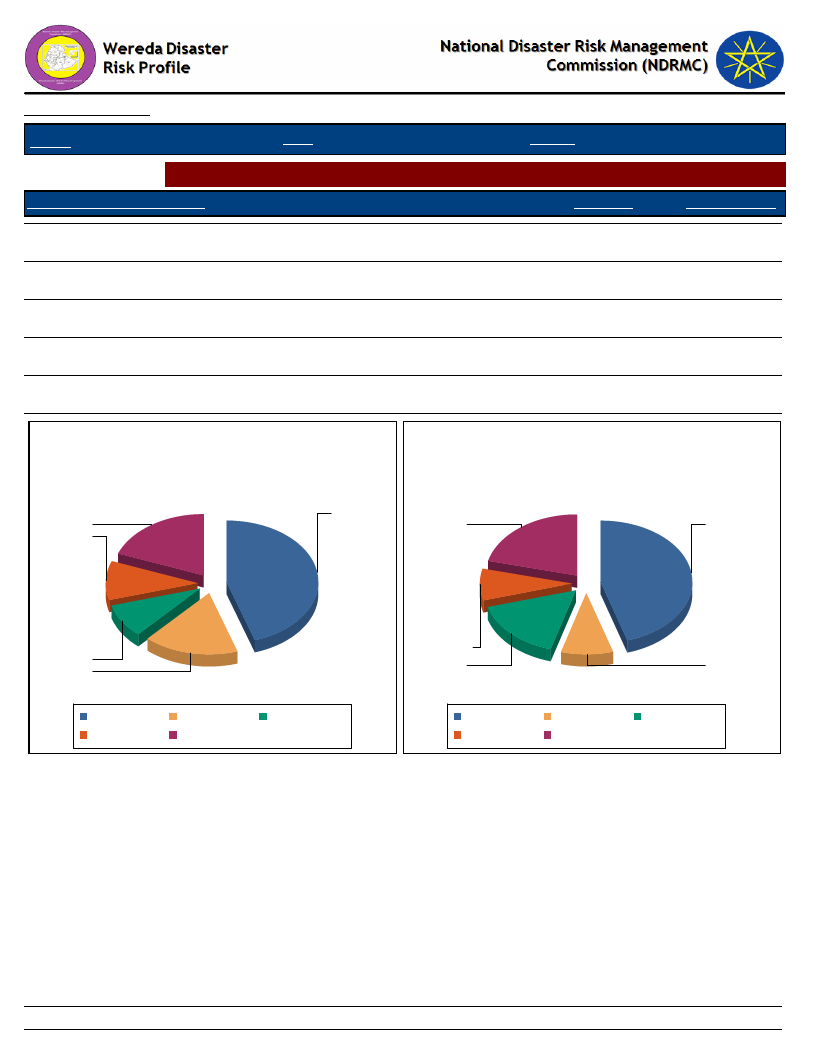
Data_Collected_Date
Tuesday, July 9, 2019
Region S.N.N.P
Zone SILTIE
Wereda HULBAREG
Selected Indictor: Hazards: Change in Crop Damages - Major reasons for crop damage
Major Reason of Crop Damage
Last_Year
Five_Year_Ago
A - Pests, Insects, Weeds
44.92
45.24
B - Drought
16.76
9.18
C - Flood
8.91
16.16
D - Frost/ Cold wave
10.16
8.33
E - Others (specify)
19.25
21.09
Major Reason of Crop Damage -
Last Year
44.9
19.3
10.2
Major Reason of Crop Damage -
Five Years Ago
E - Others
(specify)
A - Pests,
Insects,
Weeds
8.9
16.8
A - Pests, Insects,
Weeds
D - Frost/ Cold wave
B - Drought
E - Others (specify)
C - Flood
D - Frost/ Cold
wave
C - Flood
A - Pests, Insects,
Weeds
D - Frost/ Cold wave
B - Drought
E - Others (specify)
C - Flood
B-
Drought
96
Page 1 of 1
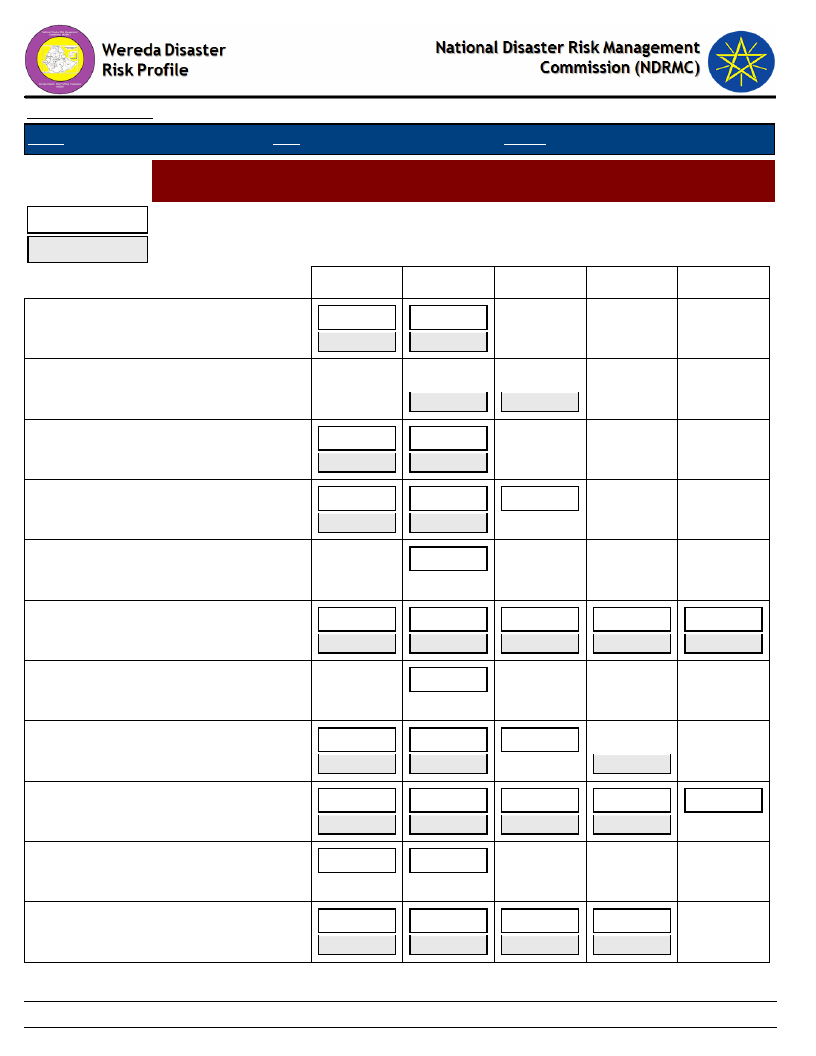
Data_Collected_Date
Region S.N.N.P
Zone SILTIE
Wereda HULBAREG
Selected Indictor:
Last Year
Hazards: Change in Crop Damages - Proportion of Damage for Major Crops
(percentage response by households)
Five Years Ago
Tuesday, July 9, 2019
0%
1-25%
26-50%
51-75%
76-100%
Barley
87.50
42.86
12.50
57.14
Beans
50.00
50.00
Chat
71.43
55.56
28.57
44.44
Enset
16.67
28.57
66.67
71.43
16.67
Linseed
100.00
Maize
Root & tubers
19.50
60.17
15.04
3.06
1.11
12.77
62.01
18.54
4.26
0.91
100.00
Sorghum
Teff
Vegetables
33.33
58.33
8.33
27.59
55.17
13.79
22.42
52.12
18.18
3.03
2.42
21.47
53.11
10.17
12.99
33.33
66.67
Wheat
24.06
54.14
16.54
3.01
16.89
58.78
18.24
2.70
97
Page 1 of 1
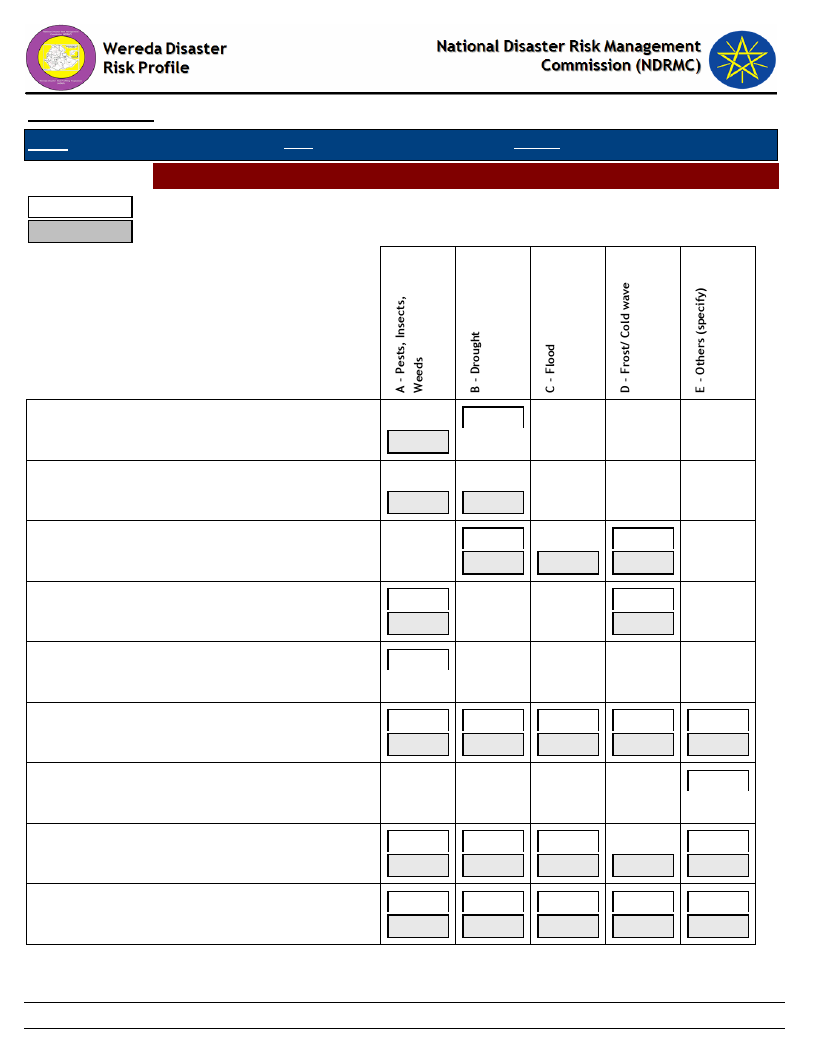
Data_Collected_Date
Region S.N.N.P
Zone SILTIE
Tuesday, July 9, 2019
Wereda HULBAREG
Hazards: Change in Crop Damages - Reasons for Damage of Major Crops
Last Year
Five Years Ago
Barley
Beans
Chat
Enset
Linseed
Maize
Root & tubers
Sorghum
Teff
100.00
100.00
50.00
20.00
40.00
100.00
50.00
50.00
25.00
50.00
50.00
25.00
80.00
60.00
48.15
45.96
24.24
9.82
7.41
17.19
2.02
18.18
4.56
22.46
100.00
62.50
45.00
34.33
38.62
12.50
5.00
9.70
10.34
6.25
10.00
9.70
13.79
5.00
22.39
11.72
18.75
35.00
23.88
25.52
98
Page 1 of 2
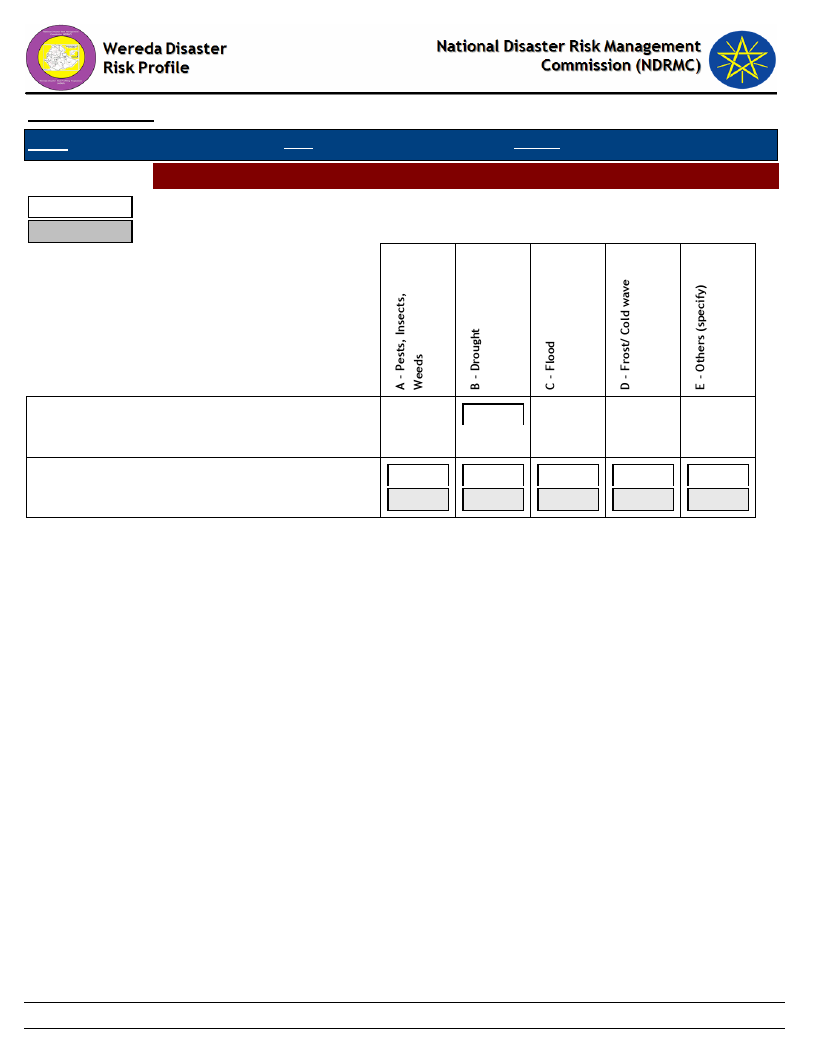
Data_Collected_Date
Region S.N.N.P
Zone SILTIE
Tuesday, July 9, 2019
Wereda HULBAREG
Hazards: Change in Crop Damages - Reasons for Damage of Major Crops
Last Year
Five Years Ago
Vegetables
Wheat
100.00
50.00
2.94
13.73
15.69
17.65
51.22
6.50
17.89
11.38
13.01
99
Page 2 of 2

Wereda Disaster
Risk Profile
Data_Collected_Date
Region
S.N.N.P
Zone
SILTIE
National Disaster Risk Management
Commission (NDRMC)
Tuesday, July 9, 2019
Wereda
HULBAREG
Selected Indictor:
Kebele Name
ALBEZER ZEMU
SHIDGER
Agricultural Situation: Change in Crops Grown - Five major crops grown by proportion of total cultivated land
Major Crops
Main Season
Present
Cropped Area
Five_Years_Ago
Reason_For_Change
Barley
Meher
15
15
Wheat
Meher
25
25
Banana
All Season
25
25
Maize
Belg
30
30
AMBERCHO GIMBA
Teff
---------
25
25
Maize
---------
50
50
Wheat
---------
14
14
Sorghum
---------
5
5
Barley
---------
5
5
AMOBARACHO ACHAM
Sorghum
Belg
3
3
Barley
Meher
2
2
Wheat
Meher
20
20
Teff
Meher
40
40
Maize
Belg
35
35
No change
ANGAMO YODE
Wheat
Meher
30
20
Maize
Belg
25
35
100
Page 1 of 4
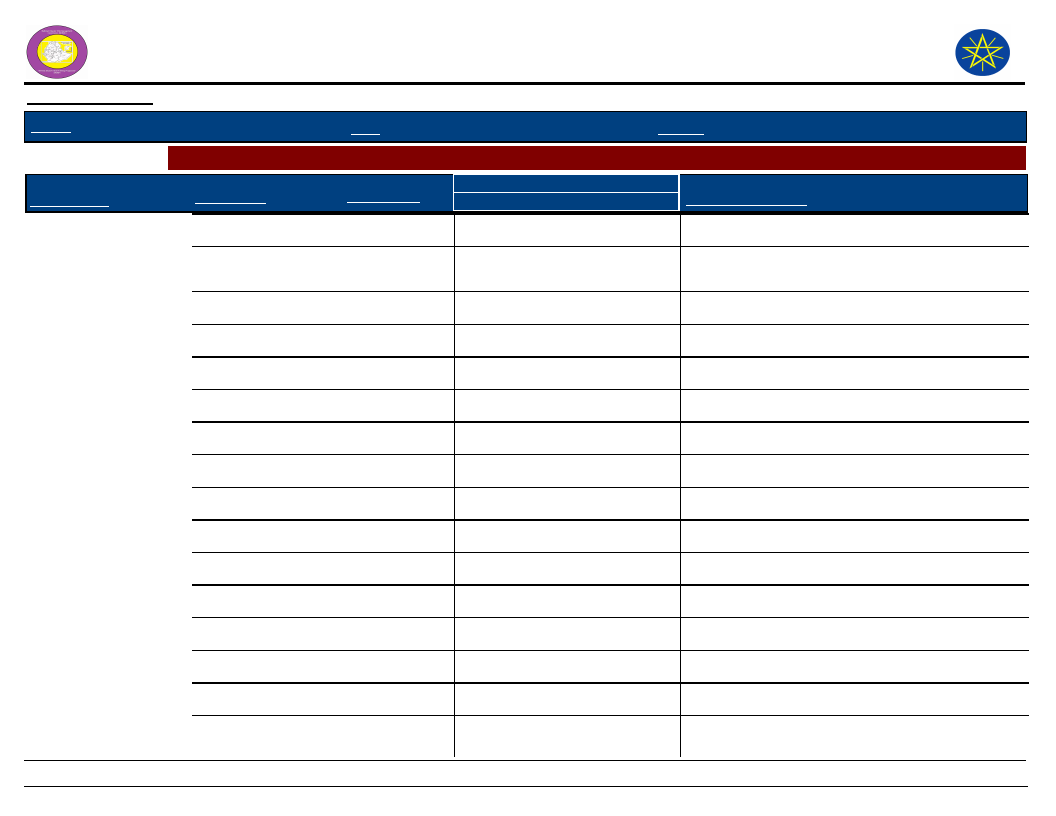
Wereda Disaster
Risk Profile
Data_Collected_Date
Region
S.N.N.P
Zone
SILTIE
National Disaster Risk Management
Commission (NDRMC)
Tuesday, July 9, 2019
Wereda
HULBAREG
Selected Indictor:
Kebele Name
ANGAMO YODE
Agricultural Situation: Change in Crops Grown - Five major crops grown by proportion of total cultivated land
Major Crops
Main Season
Present
Cropped Area
Five_Years_Ago
Reason_For_Change
Teff
Meher
10
5
BILA WANJA
Chat
Teff
Belg and
10
Meher
Meher
10
3
10
No change
Pepper
Meher
5
10
Reduction of market price/disease/
Sorghum
Belg
10
10
No change
Wheat
Meher
35
35
No change
Maize
Belg
40
35
Pepper land change in to maize land
BRHAN KITKITA
Maize
Belg
50
Sorghum
Belg
10
Teff
Meher
30
Wheat
Meher
5
Banana
All Season
5
DATE WEZIR 6
Wheat
Meher
10
10
Banana
All Season
75
75
Maize
Belg
15
15
DEMEQE
Maize
Belg
20
20
101
Page 2 of 4
Wereda Disaster
Risk Profile
Data_Collected_Date
Region
S.N.N.P
Zone
SILTIE
National Disaster Risk Management
Commission (NDRMC)
Tuesday, July 9, 2019
Wereda
HULBAREG
Selected Indictor:
Kebele Name
DEMEQE
Agricultural Situation: Change in Crops Grown - Five major crops grown by proportion of total cultivated land
Major Crops
Main Season
Present
Cropped Area
Five_Years_Ago
Reason_For_Change
Wheat
Meher
50
50
Teff
Meher
20
20
Sorghum
Belg
10
10
KEBELE 01
Sorghum
Belg
3
3
Wheat
Meher
7
7
Teff
Meher
60
60
Maize
Belg
30
30
OBISO WACHO
Maize
Belg
30
30
Teff
Meher
50
50
no change
Wheat
Meher
10
10
Sorghum
Belg
10
10
TODE TEMEDE
Pepper
Belg
10
15
Maize
Belg
45
40
Changing to cash crop
Wheat
Meher
40
35
Increasing productivity
Teff
Meher
5
10
Due to less productivity
WERABAT SHAMA
Sorghum
Belg
10
10
102
Page 3 of 4
Wereda Disaster
Risk Profile
Data_Collected_Date
Region
S.N.N.P
Zone
SILTIE
National Disaster Risk Management
Commission (NDRMC)
Tuesday, July 9, 2019
Wereda
HULBAREG
Selected Indictor:
Kebele Name
WERABAT SHAMA
Agricultural Situation: Change in Crops Grown - Five major crops grown by proportion of total cultivated land
Major Crops
Main Season
Present
Cropped Area
Five_Years_Ago
Reason_For_Change
Maize
Belg
30
30
Teff
Meher
50
50
Wheat
Meher
10
10
BOLE
Maize
Belg
10
10
Banana
All Season
5
5
Wheat
Meher
50
50
No change
Teff
Meher
20
20
Chat
All Season
5
5
103
Page 4 of 4
Data_Collected_Date
Region S.N.N.P
Zone SILTIE
Wereda HULBAREG
Selected Indictor:
Agricultural Situation: Access to Extension - Perception of the community on
Access to Agricultural extension Services
Tuesday, July 9, 2019
KebeleName
Current_Level
Change_In_Last_Decade
Comments
BOLE
Good
OBISO WACHO
Good access
KEBELE 01
ANGAMO YODE
Good
Due to the construction of
farmers training center at
Keble level and the
presence of development
agents and improve
agricultural extension
service
Increased
Increase
Improve access of
agricultural extension
service and technology at
Keble level.
Due to the presence of
agricultural extension
workers at Keble level.
The extension service
should be strengthened
AMOBARACHO
ACHAM
Good
TODE TEMEDE
Increased
The current extension
service is so good the the
farmer training centers
are established at Keble
level and we get any
technology at Keble.
DEMEQE
Good
WERABAT SHAMA Good
BILA WANJA
Good
AMBERCHO GIMBA Good
Increasing
Increase
Increase
Increase
104
There is an increasing of
agricultural extension
services that farmer that
training centers become
established at Keble level
To improve
developmental agents
Because of the
construction of farmers
tanning center at Keble
level
Due to the establish of
agricultural extension
worker at Keble level
Page 1 of 2
Data_Collected_Date
Region S.N.N.P
Zone SILTIE
Wereda HULBAREG
Selected Indictor:
Agricultural Situation: Access to Extension - Perception of the community on
Access to Agricultural extension Services
Tuesday, July 9, 2019
KebeleName
Current_Level
Change_In_Last_Decade
Comments
ALBEZER ZEMU
SHIDGER
Increase
DATE WEZIR 6
Good
BRHAN KITKITA
Good
Increase
Increase
Increase
Due to the presence of
developmental agent at
Keble level the extension
service improved
There is agricultural
development agent at
Keble level
Due to the presences of
agricultural extension
workers at Keble level
105
Page 2 of 2
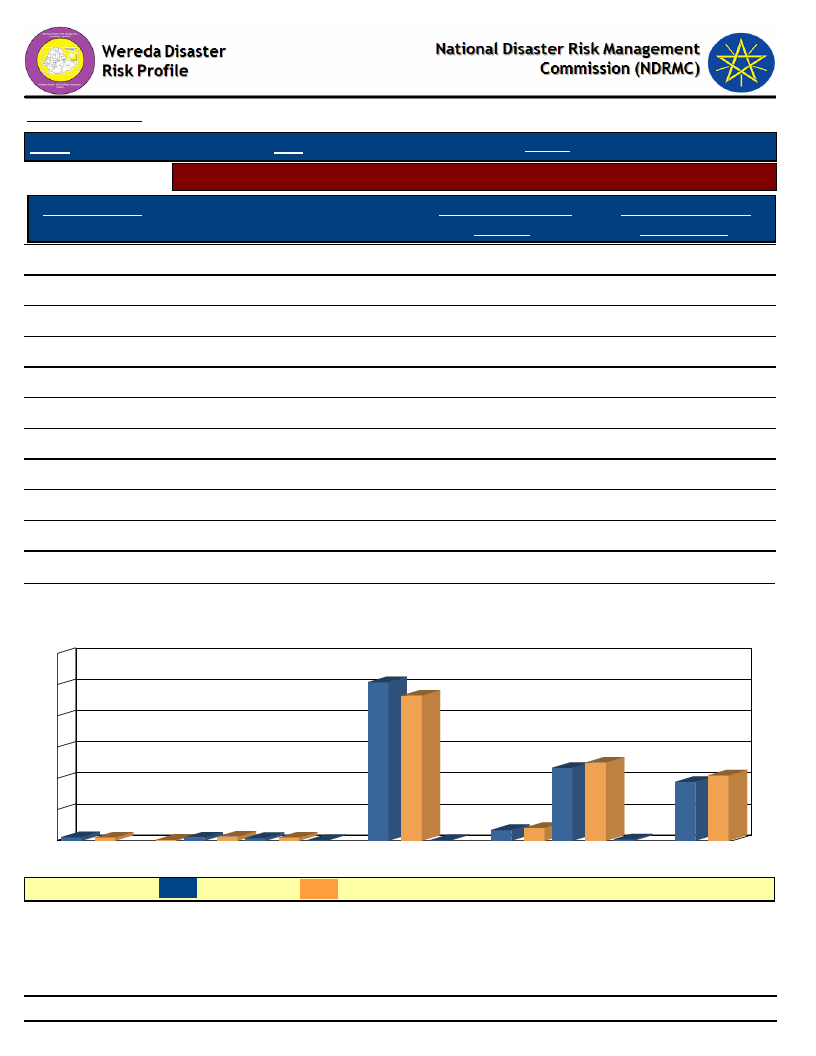
Data_Collected_Date
Region S.N.N.P
Selected Indicator
Major Crop Type
Maize
Teff
Wheat
Sorghum
Barley
Chat
Enset
Vegetables
Linseed
Root & tubers
Beans
Zone SILTIE
Wereda
Tuesday, July 9, 2019
HULBAREG
Economic Vulnerability: Crops Grown - Types of crops grown by households
Type of Crops Grown
Last Year
50.78
Type of Crops Grown
Five Years Ago
46.47
23.34
25.00
18.81
20.90
3.39
4.10
1.13
0.99
0.99
1.27
0.85
0.99
0.42
0.14
0.14
0.28
Types of Crops Grown - Percent Responses of HHs for Last Year as compared to
Five Years Ago
60
51
50
46
40
30
25
23
21
20
19
10
1
1
0
Barley
LEGEND :
0
Beans
1
1
Chat
1
1
Enset
Last year
0
Linseed
Maize
0
Root &
tubers
Five Years Ago
3
4
Sorghum
0
Teff
Vegetables
Wheat
106
Page 1 of 1
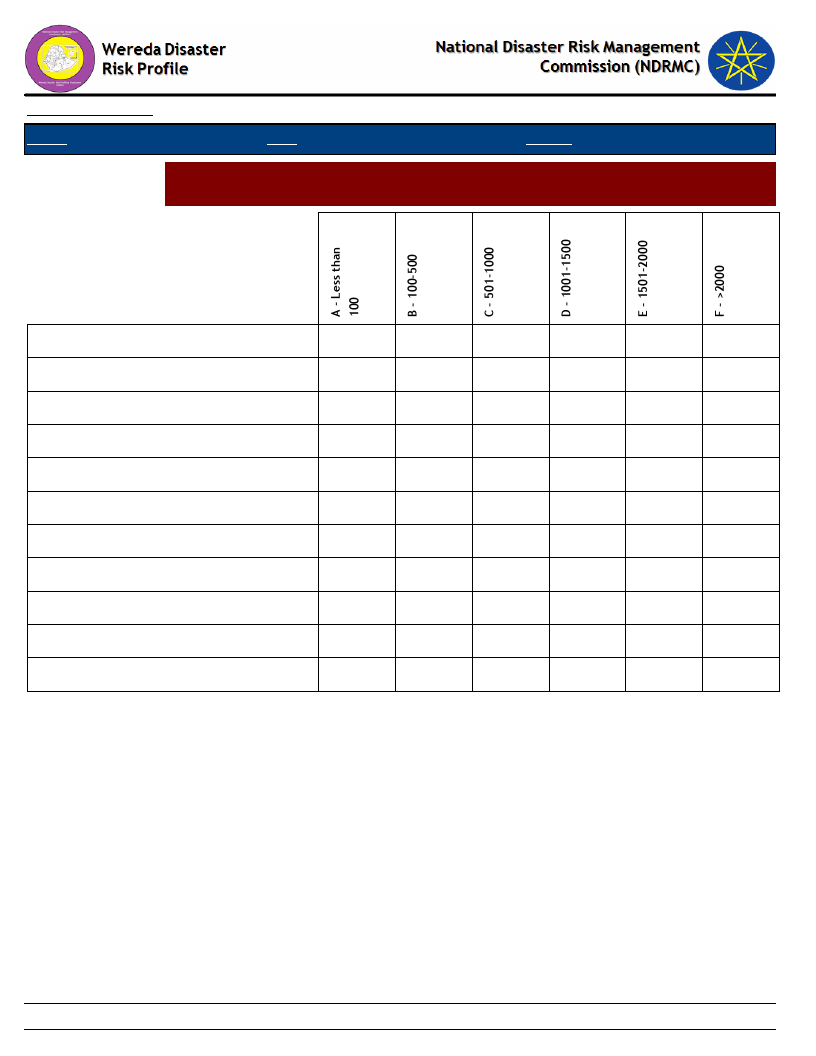
Data_Collected_Date
Region S.N.N.P
Zone SILTIE
Tuesday, July 9, 2019
Wereda HULBAREG
Selected Indictor:
Economic Vulnerability: Crops Grown - Proportion of households by amount of
yield of major crops (last year)
Barley
Beans
Chat
Enset
Linseed
Maize
Root & tubers
Sorghum
Teff
Vegetables
Wheat
100.00
28.57
28.57
28.57
14.29
50.00
50.00
100.00
4.46
47.91
37.33
5.85
1.67
2.79
100.00
20.83
62.50
12.50
4.17
4.85
68.48
23.03
3.64
33.33
33.33
33.33
1.50
38.35
40.60
12.03
5.26
2.26
107
Page 1 of 1
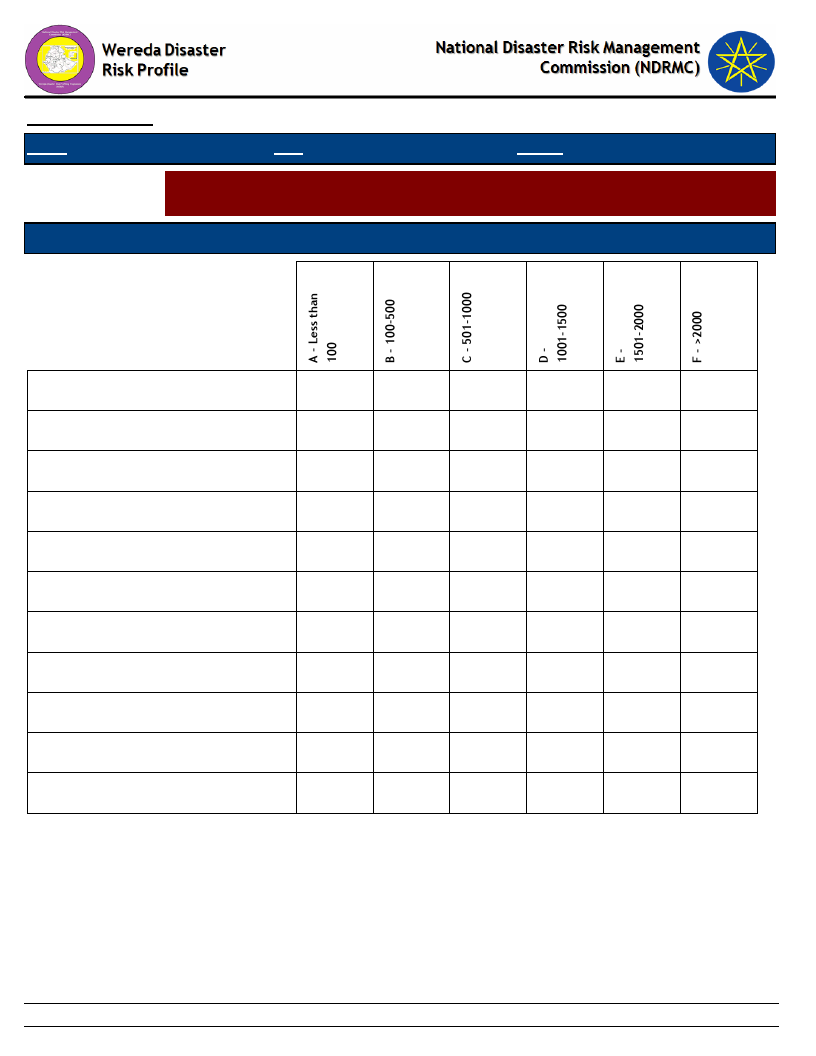
Data_Collected_Date
Region S.N.N.P
Zone SILTIE
Tuesday, July 9, 2019
Wereda HULBAREG
Selected Indictor:
Economic Vulnerability: Crops Grown - Proportion of households by amount of
yield of major crops (Five Years Ago)
Types of Major Crops
Category of Yield used to be obtained five years ago
Barley
Beans
Chat
Enset
Linseed
Maize
Root & tubers
Sorghum
Teff
Vegetables
Wheat
50.00
33.33
100.00
50.00
44.44
85.71
11.11
14.29
11.11
8.81
62.31
21.88
3.34
1.22
2.43
37.93
58.62
3.45
12.43
74.58
9.04
1.69
0.56
1.69
12.84
50.00
27.03
8.11
2.03
108
Page 1 of 1
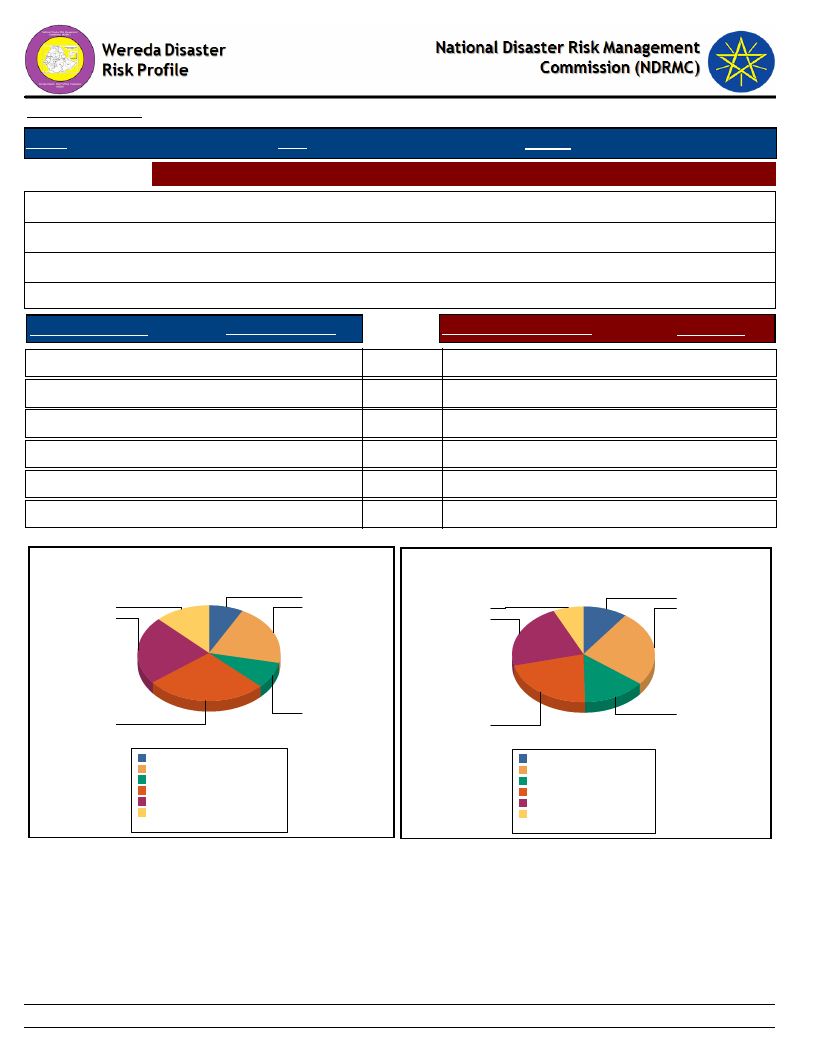
Data_Collected_Date
Tuesday, July 9, 2019
Region S.N.N.P
Zone SILTIE
Wereda HULBAREG
Selected Indictor: Economic Vulnerability: Land Ownership and Quality - Landownership of HHs
Households owning land (%)
Average landholding (in Hectares)s
Households cultivating land in last 12 months (%)
Average quantity of land cultivated (in hectares)
89.59
3.49
94.03
1.75
Range Land Holding
Percent_Response
Range of Cultivated Land
% Response
A - Less than 0.25 ha
8.0
B - 0.25 - 0.50 ha
21.0
D - 0.75 - 1 ha
27.0
E - 1 - 2 ha
23.0
C - 0.5 - 0.75 ha
9.0
F - More than 2 ha
13.0
IMPORTANT: ha = Hectars
Household Responses to Range Land Holding
A - Less than 0.25 ha
9.0
B - 0.25 - 0.50 ha
24.0
D - 0.75 - 1 ha
20.0
E - 1 - 2 ha
20.0
C - 0.5 - 0.75 ha
13.0
F - More than 2 ha
6.0
Household Responses to Range Cultivated Land
7.8
9.3
12.7
20.8
6.3
23.6
23.2
20.4
9.2
27.5
A - Less than 0.25 ha 7.7%
B - 0.25 - 0.50 ha
C - 0.5 - 0.75 ha
20.6%
9.1%
D - 0.75 - 1 ha
27.2%
E - 1 - 2 ha
23.0%
F - More than 2 ha
12.5%
Total:
100.0%
19.7
13.2
A - Less than 0.25 ha 9.3
B - 0.25 - 0.50 ha 23.6
C - 0.5 - 0.75 ha
13.2
D - 0.75 - 1 ha
19.7
E - 1 - 2 ha
20.4
F - More than 2 ha
6.3
Total:
92.6
109
Page 1 of 1
Data_Collected_Date
Tuesday, July 9, 2019
Region S.N.N.P
Zone SILTIE
Wereda HULBAREG
Selected Indictor:
Economic Vulnerability: Land Ownership and Quality - Farmers’ perception on the
quality of their agricultural land
Cropping_Intensity *
Households with enough land for farming
HHs with favourable location of farm
Response
Households with fertile soil
0.51
21.94
Response
Yes
35.80
Highly fertile
1.26
Partially
47.63
Fertile
68.93
No
16.56
Not fertile
29.81
* Cropping Intensity = (Gross Cropped Area / Net Cropped Area )x 100%
Household responses to the type of farm
location
Household responses tp the type of soil
fertility
17
36
30
48
No
Partially Yes
Gross Cropped Area = Irrigated Area + Unirrigated
Area
69
1
Fertile
Highly fertile Not fertile
Net Cropped Area = Total Cultivated Area in last
12 months
110
Page 1 of 1
Data_Collected_Date
Tuesday, July 9, 2019
Region S.N.N.P
Selected Indictor:
KebeleName
BOLE
OBISO WACHO
KEBELE 01
ANGAMO YODE
AMOBARACHO
ACHAM
TODE TEMEDE
DEMEQE
WERABAT SHAMA
BILA WANJA
AMBERCHO
GIMBA
ALBEZER ZEMU
SHIDGER
Zone SILTIE
Wereda HULBAREG
Agricultural Situation: Access to Inputs - Perception of the community on access
to improved agricultural inputs
Current_Level
Change_In_Last_Decade
Comments
Good
Good access to agricultural
input
Good
Good
Good
Good
Good
Good
Good
Good
Increase
Due to the expansion of
farmers cooperative
originations at Keble level
and improve agricultural
inputs.
Increase
Increase
Increasing
Increased
Increasing
Increasing
Increase
Increase
Increase
Increase
In order to maximize
production per hectare
and improve agricultural
input
Due to the presence of
farmers cooperative
organization access to
improved inputs.
The extension service
should be strengthened
The accessibility of
fertilizer
The current government
agricultural policy is god
and the establishment of
agricultural cooperative
improves access to inputs.
Three or more than
development agents in the
Kewble
There is an improvement
in access to improved
agricultural inputs
To improve agricultural
cooperative organization
Because the agricultural
extension service makes it
available
Due to the presence of
agricultural cooperative
organization at Keble level
Due to the presence
agricultural cooperative
organization
111
Page 1 of 2

Data_Collected_Date
Tuesday, July 9, 2019
Region S.N.N.P
Selected Indictor:
KebeleName
DATE WEZIR 6
BRHAN KITKITA
Zone SILTIE
Wereda HULBAREG
Agricultural Situation: Access to Inputs - Perception of the community on access
to improved agricultural inputs
Current_Level
Good
Good
Change_In_Last_Decade
Increase
Increase
Comments
The improvement of
agricultural cooperative
organization at Keble level
Due to the presences of
cooperative organization
to improve agricultural
inputs
112
Page 2 of 2
Data_Collected_Date
Region S.N.N.P
Zone SILTIE
Tuesday, July 9, 2019
Wereda HULBAREG
Selected Indictor:
Agricultural Situation: Water for irrigation - Access to water for irrigation in the
community
KebeleName
Current_Level
Change_In_Last_Decade
Comments
BOLE
Poor
OBISO WACHO
KEBELE 01
ANGAMO YODE
AMOBARACHO
ACHAM
No
Good
Poor
TODE TEMEDE
DEMEQE
WERABAT SHAMA
BILA WANJA
Irrigation water are
accessibility for some area
Poor
No
Poor
AMBERCHO GIMBA
ALBEZER ZEMU
SHIDGER
DATE WEZIR 6
BRHAN KITKITA
Poor
No access
Not enough
There is a progressive access
to water for irrigation by
water harvesting strategy of
house hold and community
pond construction, but water
security is still th
No
The area is exposed to water
scarcity for irrigation.
Currently is not available
Constant
Decreased
Increasing
Increasing
no
Decrease
No change
To improve replenish surface
and ground water through water
harvesting structures and
biological conservation
measures
By construction of irrigation
dam
Due to constriction of water
harvesting pond at household
There is no access to water for
irrigation
Due to deforestation and poor
environmental protection the
use of irrigation can be decline
Not available
No access
Decrease
Due to distribution of irrigation
water sources to urban area
113
Page 1 of 1
Data_Collected_Date
Tuesday, July 9, 2019
Region S.N.N.P
Zone SILTIE
Wereda HULBAREG
Selected Indictor:
Kebele Name
Agricultural Situation: Soil Fertility - Perception of the community on soil fertility
and its change over time
Current_Level
Change_In_Last_Decade
Comments
BOLE
Poor
OBISO WACHO
Good
KEBELE 01
Poor
ANGAMO YODE
Poor soil fertility
Due to the presence of
different interventions by
productive safety net
program, public work and
mass mobilization free
labor contribution there is
an importan
Increase
Decline
Decreasing
Due to continuous plough
of crop land with out
proper management before
the last decade soil erosion
is the basic problem of the
area.
Due to the increment of
soil and water conservation
activity
Soil fertility is decline
because of un proper use of
land
AMOBARACHO
ACHAM
TODE TEMEDE
DEMEQE
Poor
Low fertility
Medium
WERABAT SHAMA
Poor
BILA WANJA
Poor
Decline
Decreasing
Increasing
Increase
Decrease
114
It should be improved by
soil and water conservation
measures
Due to ran of and leaching
of soil
Because of high
intervention of soil and
water conservation
practice through safety net
program
Due to different project
and program attention to
environmental protection
activity the soil fertility of
the area becomes improved
over the last decade
Due to continuous
cultivation and poor
management system the
fertility of soil decline
Page 1 of 2

Data_Collected_Date
Tuesday, July 9, 2019
Region S.N.N.P
Zone SILTIE
Wereda HULBAREG
Selected Indictor:
Kebele Name
Agricultural Situation: Soil Fertility - Perception of the community on soil fertility
and its change over time
Current_Level
Change_In_Last_Decade
Comments
AMBERCHO GIMBA Poor
ALBEZER ZEMU
SHIDGER
Good
DATE WEZIR 6
Poor
BRHAN KITKITA
Good
Increase
Increase
Increase
Increase
Due to poor soil and water
conservation practice
Due to the application of
soil and water conservation
activities through mass
mobilization program
Due to soil and water
conservation practice
through productive safety
net program soil fertility
become improved
Due to the application of
soil and water conservation
practice it can be improved
115
Page 2 of 2
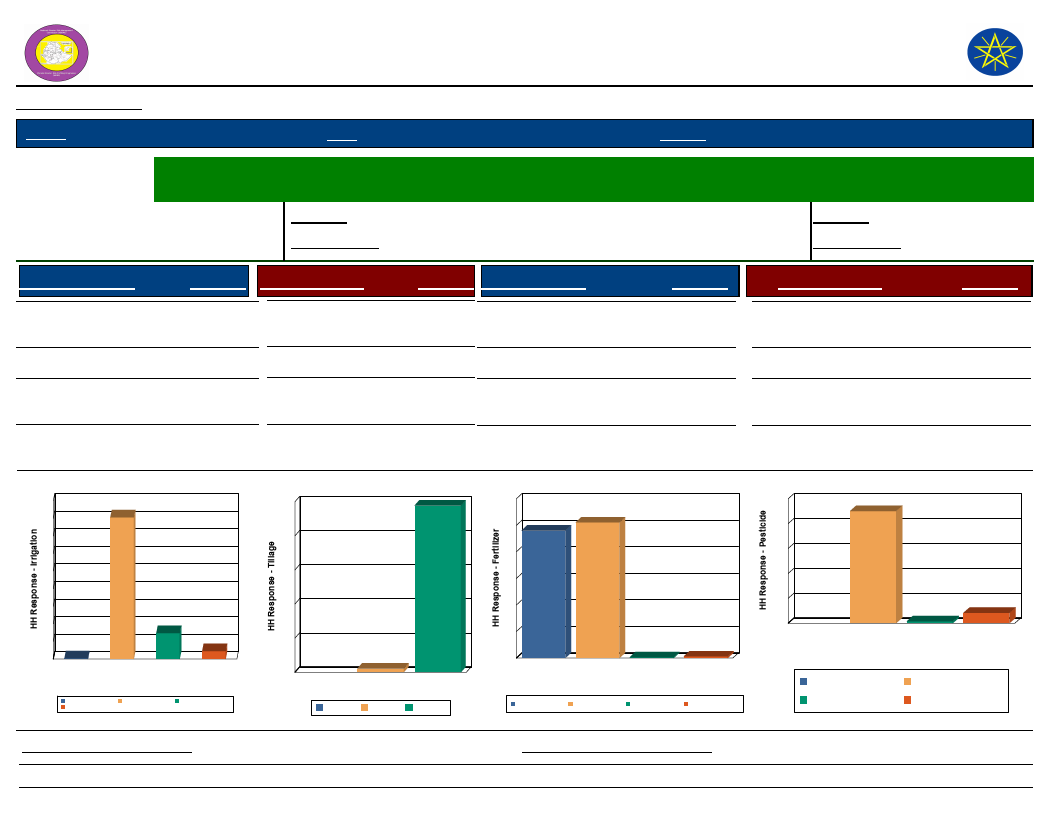
Wereda Disaster
Risk Profile
Data_Collected_Date
Region S.N.N.P
Zone SILTIE
National Disaster Risk Management
Commission (NDRMC)
Tuesday, July 9, 2019
Wereda HULBAREG
Selected Indictor:
Economic Vulnerability: Status of Agriculture - Methods of tillage, Irrigation and other agricultural input utilization
by households
Percentage of
Irrigated Area
Last Year
Five Years Ago
Percentage of households
with irrigated area
Last Year
Five Years Ago
5.69
12.40
Source of Irrigation
Response Method of Tillage
Response Type of Fertilizer
Response
Type of Pesticide
Response
River/Lake/Pond
4.46 Oxen
97.79 Chemical
51.04
Birkas (tanks)
0.32 Manual
2.21
Other (specify)
14.65
No Irrigation
(Rain-fed)
80.57
Source of Irrigation
90
81
80
70
60
50
40
30
20
15
10
4
0
0
Birkas (tanks)
Other (specify)
No Irrigation (Rain-fed)
River/Lake/Pond
Source of Irrigation
Birkas (tanks)
River/Lake/Pond
No Irrigation (Rain-fed)
Other (specify)
Method of Tillage
100
98
80
60
40
20
2
0
Manual
Oxen
Method of Tillage
Manual Oxen
Natural/Animal manure
Both Chemical and
Natural
None
0.32
48.01
0.64
Type of Fertilizer
60
51
50
48
40
30
20
10
0
Both
Chemical and
Natural
0
Chemical Natural/Animal
manure
Type of Fertilizer
Both Chemical and
Natural
Chemical
Natural/Animal manure
1
None
None
Chemicals (insecticides,
fungicide, etc)
Natural methods
None
90.11
1.59
8.29
Type of Pesticide
100
90
80
60
40
20
8
2
0
Chemicals
Natural
None
(insecticides,
methods
fungicide, etc)
Type of Pesticide
Natural methods
Chemicals (insecticides,
fungicide, etc)
None
Proportion_Improved_Seeds
95.02
Proportion_Agriculture_Service
116
92.24
Page 1 of 1
Data_Collected_Date
Region S.N.N.P
Zone SILTIE
Wereda HULBAREG
Tuesday, July 9, 2019
Selected Indictor:
Economic Vulnerability: Change in Agricultural Situation - Households perception
on changes of crop type, size of cultivated area and crop yields
Proportion of households reporting change in crops grown
Adequate fertilizer
28.53
%
1st
2nd
3rd
11.24
19.83
15.71
Adequate irrigation available
1.12
Adequate rainfall
7.30
4.29
Insufficient fertilizer
1.69
25.00
Less rainfall
12.92
0.86
2.86
More drought resistant crop
5.06
18.97
27.14
More Market Availability
10.11
5.17
34.29
More pest resistant crop
7.87
12.93
1.43
More yielding crop
21.35
17.24
14.29
Other
21.35
Proportion of households reporting change in size of area cultivated
26.43 %
Addition of area
1st
2nd
3rd
23.49
4.35
Adequate fertilizer
7.83
19.57
7.81
Adequate rainfall
6.63
3.26
9.38
Insufficient fertilizer
4.82
14.13
4.69
Insufficient rainfall
15.66
1.56
Landslides
15.22
117
Page 1 of 2
Data_Collected_Date
Region S.N.N.P
Zone SILTIE
Wereda HULBAREG
Tuesday, July 9, 2019
Selected Indictor:
Economic Vulnerability: Change in Agricultural Situation - Households perception
on changes of crop type, size of cultivated area and crop yields
1st
2nd
3rd
Loss of area
14.46
3.26
More yielding crop
6.63
14.13
10.94
Other
12.05
Salinity problem
5.42
11.96
Water logging
3.01
14.13
Proportion of households reporting change in crop yield
Adequate fertilizer
Adequate irrigation available
Adequate rainfall
Better yielding crop
Improved variety of seeds
Insufficient fertilizer
Insufficient irrigation available
Insufficient rainfall
Other
88.04
%
1st
2nd
3rd
47.28
17.17
21.34
0.54
0.61
3.99
0.87
3.35
5.98
43.26
21.95
27.90
32.17
6.52
2.83
1.22
0.36
1.74
0.91
2.54
0.43
0.30
4.89
1.52
118
Page 2 of 2
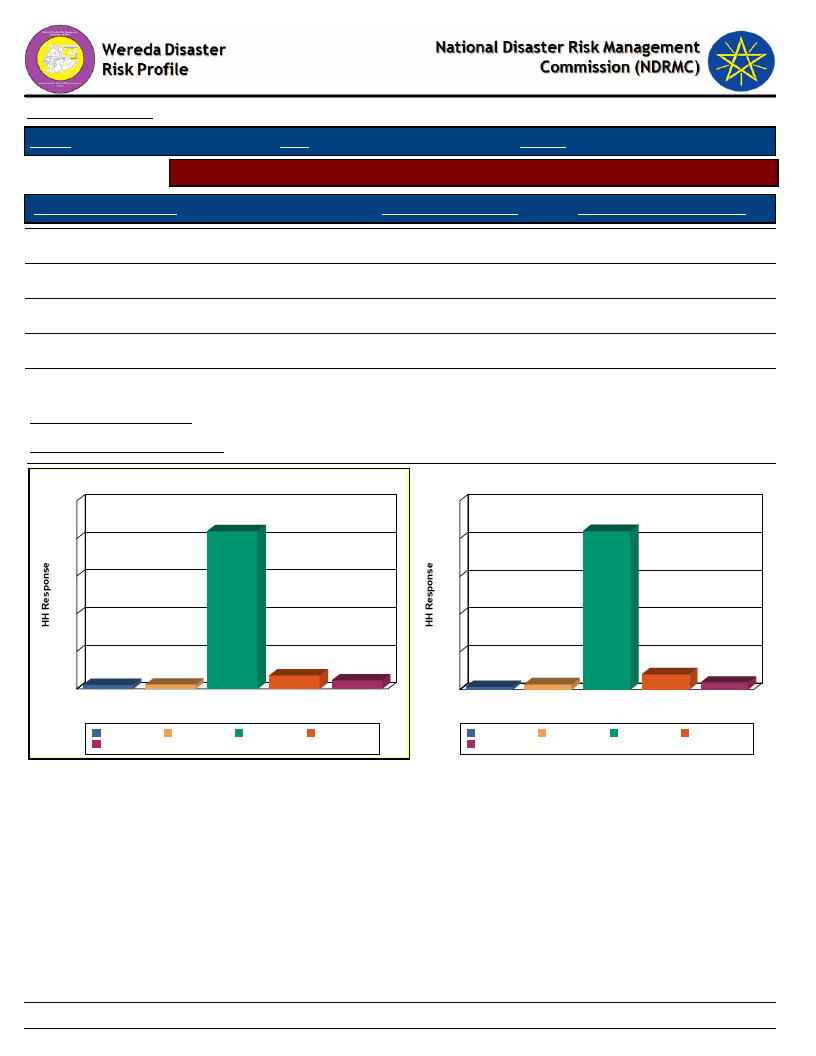
Data_Collected_Date
Tuesday, July 9, 2019
Region S.N.N.P
Zone SILTIE
Wereda HULBAREG
Selected Indicator
Economic Vulnerability: Crops Grown - Number of crops grown by households
Number of Crops Grown
Crops Grown Last Year
Crops Grown Five Years Ago
One type
83.88
84.04
Two types
4.53
3.67
Three types
7.21
8.05
Four types
2.26
2.82
Five types
2.12
1.41
Avg Crops Grown Last Year
Avg Crops Grown Five Years Ago
1.12
1.12
Number of Crops Grown Last Year
100
84
80
Number of Crops Grown five years ago
100
84
80
60
60
40
40
20
2
0
Five types
7
2
Four types One type Three types
Number of Crops Grown
5
Two types
Five types
Two types
Four types
One type
Three types
20
1
0
Five types
8
3
4
Four types One type Three types Two types
Number of Crops Grown
Five types
Two types
Four types
One type
Three types
119
Page 1 of 1
WDRP Indicators
Livestock Production Characteristics
120

Data_Collected_Date
Tuesday, July 9, 2019
Region S.N.N.P
Zone SILTIE
Wereda HULBAREG
Selected Indictor:
Kebele Name
BOLE
OBISO WACHO
KEBELE 01
ANGAMO YODE
Agricultural Situation: Status of Livestock Disease - Change in Livestock Disease
Status
Current_Level
Change_Over_Last_Decade
Comment
Anthrax, Black leg and
lump skin disease
Anthrax, black leg and
lump skin disease
Lump and skin disease,
anthrax and black leg
Lump skin disease
The prevalence of those
disease increase in the last
decade
Decrease
Increase and decrease
respectively
Un control free grazing
system
Due to the expansion of
animal extension program
Controlling immigrants
from postural area
AMOBARACHO
ACHAM
Anthrax, black leg and
lump skin disease
Decreased and increased
respectively
TODE TEMEDE
DEMEQE
Lumpy skin disease
Anthrax, Black leg and
lump skin disease
Increasing
Decreasing
WERABAT SHAMA
Anthrax, black leg and
lump skin disease
Decrease
BILA WANJA
Anthrax, black leg and
lump skin disease
Decrease
AMBERCHO GIMBA
ALBEZER ZEMU
SHIDGER
Anthrax, black leg and
lump skin disease
Lump skin disease
Decrease
Increase
The livestock vaccination
system contribute to the
controlling of common
disease and due to the
coming of camels from
pastoralist area the
prevalence is increas
Un effectiveness of
medicine
Du to animal health
extension service the
prevalence of common
diseases become decrease
Due to animal health
extension service
improvement the
prevalence of the animal
disease be come decrease
Because of animal health
extension service
vaccination can be
minimize the disease
Due to access for health
extension service
Due to camel migration it
can be increase
121
Page 1 of 2
Data_Collected_Date
Tuesday, July 9, 2019
Region S.N.N.P
Zone SILTIE
Wereda HULBAREG
Selected Indictor:
Kebele Name
DATE WEZIR 6
BRHAN KITKITA
Agricultural Situation: Status of Livestock Disease - Change in Livestock Disease
Status
Current_Level
Anthrax, black leg and
lump skin disease
Anthrax, black leg and
lump skin disease
Change_Over_Last_Decade
Decrease
Decrease and increase
Comment
Due to good animal health
extension service
Due to animal health
extension service it can be
decrease
122
Page 2 of 2
Data_Collected_Date
Tuesday, July 9, 2019
Region S.N.N.P
Zone SILTIE
Wereda HULBAREG
Selected Indictor: Livestock Diseases Prevalece
Type of livestock diseases affected households in the last five years (households reporting in %)
1st
2nd
3rd
African horse disease
7.57
3.28
2.82
Anthrax affecting cattle
25.49
25.55
13.23
Black leg
14.97
11.68
19.52
CBPP
1.32
0.18
Contagious Caprine PLeuropneumonia (CCPP)
0.99
0.91
1.95
DK
0.33
Faciolosis
1.81
0.73
4.12
Foot and mouth disease
1.81
3.10
6.94
Heart water
0.36
Internal & External Parasites (Tick, mange, helminthiasis, fasci
0.66
1.09
1.95
Liverfluke (Sheep and cattle)
1.15
4.74
0.22
Lumpy Skin Disease (LSD)
34.05
26.64
16.49
Lymphangitis
0.18
3.04
Newcasle disease (Chicken)
0.66
6.93
14.32
No Disease
5.76
4.56
1.74
Pasteurellosis
2.55
1.52
PPR
0.18
7.81
Sheep pox
2.14
4.01
3.04
Tick born diseases
1.46
1.30
Trypanosomiasis
1.32
1.82
123
Page 1 of 1
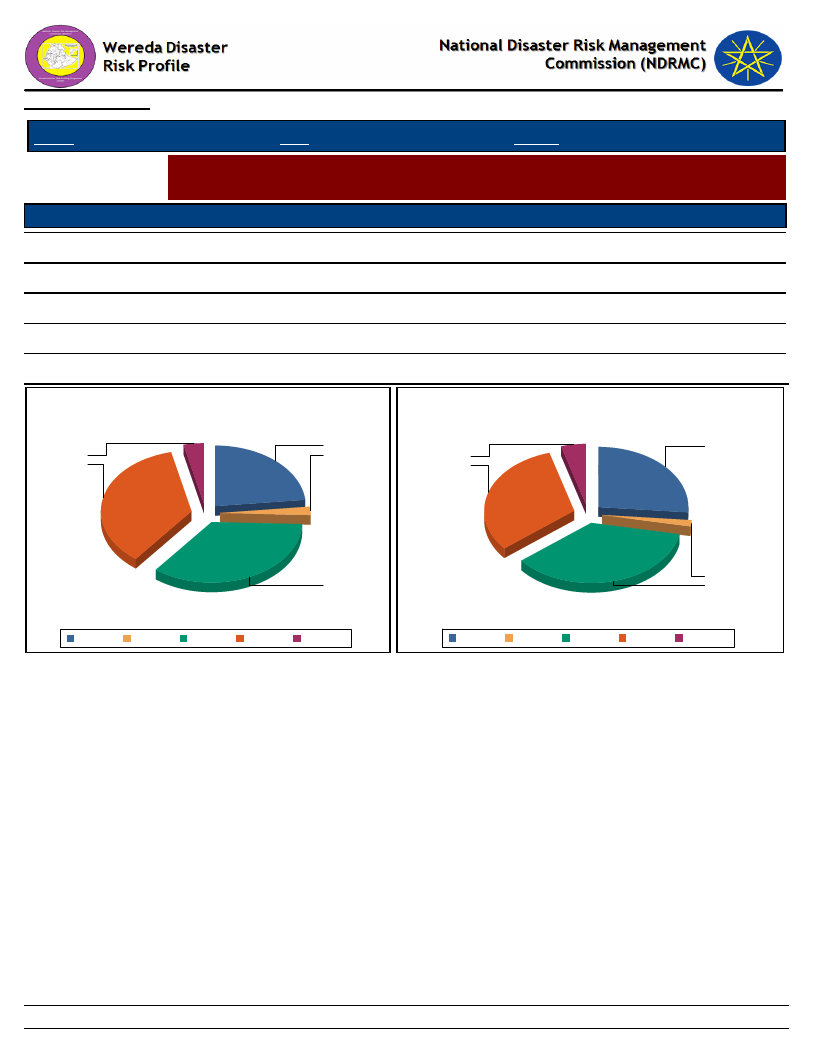
Data_Collected_Date
Tuesday, July 9, 2019
Region S.N.N.P
Selected Indictor:
Level of Access
Excellent
Good
Adequate
Poor
Very poor
Zone SILTIE
Wereda HULBAREG
Evaluation of Access to Veternary Services and Livestock Drugs
Households’ evaluation on access to drugs and veterinary services
Veternary Service
Livestock_Drugs
2.33
1.67
35.05
36.00
23.26
26.50
35.88
31.50
3.49
4.33
Level of Access to Veternary Services
Access Level of Livestock Drugs
23
27
3
2
4
36
32
35
Adequate Excellent
Good
Poor
Very poor
2
36
Adequate Excellent
Good
Poor
Very poor
124
Page 1 of 1
Data_Collected_Date
Tuesday, July 9, 2019
Region S.N.N.P
Selected Indictor:
Zone SILTIE
Wereda HULBAREG
Agricultural Situation: Water Availability for Livestock - Water availability for
livestock in the community
KebeleName
Current_Level
Change_In_Last_Decade
Comments
BOLE
Poor
OBISO WACHO
KEBELE 01
ANGAMO YODE
AMOBARACHO
ACHAM
No enough
Poor
Poor
Poor
TODE TEMEDE
DEMEQE
Low accesses water for
livestock
Poor
WERABAT SHAMA
Poor
BILA WANJA
Poor
There is a progress in access
to water for domestic
animals through water
harvesting strategy, but still
water scarcity is a big
challenge of the area
Increase
Decrease
Constant
Deceased
Constant
Increasing
Increase
Decrease
Lack of river water during
dry season
Due to high intervention of
water harvesting
Water harvesting structure
should be strengthened
To improve water
harvesting structure and at
house hold and community
level.
Even if there is a progress
in access to water for
domestic animals through
water harvesting structure
construction at house hold
as well as community level
sti
Due to the presence of
water harvesting structure
at house hold level as well
as community level access
to water for domestic
animal over last decade
improved
Because of river and spring
shrives water for domestic
animal become poor
125
Page 1 of 2

Data_Collected_Date
Tuesday, July 9, 2019
Region S.N.N.P
Selected Indictor:
Zone SILTIE
Wereda HULBAREG
Agricultural Situation: Water Availability for Livestock - Water availability for
livestock in the community
KebeleName
Current_Level
Change_In_Last_Decade
Comments
AMBERCHO GIMBA
Poor
ALBEZER ZEMU
SHIDGER
Poor
DATE WEZIR 6
BRHAN KITKITA
Poor
Not enough
Increase
Increase
Poor
Decrease
Due to the construction of
water harvesting at the
community and house hold
level
Because of water
harvesting and other
surface and ground water
recharge
Poor
Due to high temperature
126
Page 2 of 2

Data_Collected_Date
Tuesday, July 9, 2019
Region S.N.N.P
Zone SILTIE
Wereda HULBAREG
Selected Indictor:
Agricultural Situation: Livestock Diversity - Type of livestock and their economic
importance in the community
Kebele Name
ALBEZER ZEMU
SHIDGER
Type of Livestock
Oxe and Cow
Donkeys
Avg_Number
1
1
Economic_Importance_Rank
High important for plough and gives to
milk and milk product
Important for transport
Camels: Female
0
Camels: Female
0
Camels: Female
0
AMBERCHO GIMBA
Donkeys
1
Important for transportation
Sheep
Goats
Oxe and Cow
Camels: Female
1
Important for additional income
generating
2
Important for additional income
generating
3
Very important for plough and milk
production
0
AMOBARACHO
ACHAM
Oxe and Cow
Sheep
3
They are very important for plough and
for milk production.
4
Its important for selling
Goats
3
Its important for selling
Donkeys
Camels: Female
1
It is important for transporting crop
products
0
ANGAMO YODE
Camels: Female
0
Sheep
1
For selling
Donkeys
2
For transportation
Goats
1
For selling
Oxe and Cow
3
For plough and milk production
BILA WANJA
Oxe and Cow
1
Very important for plough and milk
production
127
Page 1 of 4

Data_Collected_Date
Tuesday, July 9, 2019
Region S.N.N.P
Zone SILTIE
Wereda HULBAREG
Selected Indictor:
Agricultural Situation: Livestock Diversity - Type of livestock and their economic
importance in the community
Kebele Name
BILA WANJA
Type of Livestock
Sheep
Avg_Number
2
Economic_Importance_Rank
Important for getting additional income
Goats
1
Important for getting additional income
Camels: Female
0
Camels: Female
0
BOLE
Goats
0
Important to sell and get money.
Sheep
0
Important to sell and get money.
Donkeys
---------
1
To transport goods from farm to home
and home to market.
0
BRHAN KITKITA
Oxe and Cow
Donkeys
Sheep
2
To plough crop land and it gives milk
product.
1
Important for transporting crop
products to the market
0
Important for selling and to get income
Goats
1
Important for selling and to get income
Oxe and Cow
Camels: Female
2
Very important for plough cultivated
land and to gave milk production
0
DATE WEZIR 6
Oxe and Cow
Sheep
2
Very important for plough and give milk
production
1
Important to sell and get income
Goats
1
Important to sell and get income
Donkeys
Camels: Female
1
Important to transport farm inputs and
crop product
0
DEMEQE
Camels: Female
0
Goats
1
Important for selling and get income
128
Page 2 of 4

Data_Collected_Date
Tuesday, July 9, 2019
Region S.N.N.P
Zone SILTIE
Wereda HULBAREG
Selected Indictor:
Agricultural Situation: Livestock Diversity - Type of livestock and their economic
importance in the community
Kebele Name
DEMEQE
Type of Livestock
Sheep
Avg_Number
1
Economic_Importance_Rank
Important for selling and get income
Donkeys
1
Important for transport
KEBELE 01
Oxe and Cow
Donkeys
2
Important for plough and giving milk
production
1
It important for transportation
Oxe and Cow
Goats
Camels: Female
2
Very important for plough and to get
milk and milk product
3
Important for selling and house hold
consumption
0
Camels: Female
0
OBISO WACHO
Camels: Female
0
Donkeys
Sheep
0
Important for transportation of crop and
crop products
1
Important for income generating
Oxe and Cow
Goats
1
Very important for plough and milk
products respectively
1
Important for income generating
TODE TEMEDE
Oxe and Cow
Goats
2
For farming practice and milk
production
1
For selling and meat
Donkeys
1
For transporting
Sheep
1
For selling and meat
Camels: Female
0
WERABAT SHAMA
Camels: Female
0
Camels: Female
0
Sheep
1
Important for economy seeking and
getting income
129
Page 3 of 4
Data_Collected_Date
Tuesday, July 9, 2019
Region S.N.N.P
Zone SILTIE
Wereda HULBAREG
Selected Indictor:
Agricultural Situation: Livestock Diversity - Type of livestock and their economic
importance in the community
Kebele Name
WERABAT SHAMA
Type of Livestock
Goats
Oxe and Cow
Avg_Number
1
2
Economic_Importance_Rank
Important for economy seeking and
getting income
Very important for plough and milk
production respectively
130
Page 4 of 4
Wereda Disaster
Risk Profile
Data_Collected_Date
National Disaster Risk Management
Commission (NDRMC)
Tuesday, July 9, 2019
Region S.N.N.P
Zone SILTIE
Wereda HULBAREG
Selected Indictor:
Economic Vulnerability: Livestock Ownership and Changes - Percentage of households by number and type of
livestock owned
Bee keeping
A - None
88.09
B - 1 to 5
7.34
C - 6 to 10
2.28
D - 11 to 50
0.98
E - 51 to 100
0.65
F - More
than 100
0.16
Camels: Female
99.35
0.33
Camels: Male
99.67
0.33
Camels: Young Female
99.35
0.65
Camels: Young Male
98.69
0.65
0.33
Cattle: Female
59.71
31.16
6.53
2.61
Cattle: Male bulls
60.03
34.91
3.26
0.82
0.33
0.33
Cattle: Mature Female
30.18
49.92
14.19
3.92
0.65
Cattle: Mature Male
28.71
42.90
23.16
3.10
0.82
0.82
Cattle: under 1 year
47.15
43.23
7.67
1.63
Donkeys
34.58
57.75
6.04
1.63
Goats
56.61
14.36
16.64
5.06
4.89
0.65
Horses
99.35
0.33
0.33
131
Page 1 of 2
Wereda Disaster
Risk Profile
Data_Collected_Date
National Disaster Risk Management
Commission (NDRMC)
Tuesday, July 9, 2019
Region S.N.N.P
Zone SILTIE
Wereda HULBAREG
Selected Indictor:
Economic Vulnerability: Livestock Ownership and Changes - Percentage of households by number and type of
livestock owned
A - None
B - 1 to 5
C - 6 to 10
D - 11 to 50
E - 51 to 100
Mules
98.53
1.31
0.16
F - More
than 100
Poultry
23.65
6.69
15.66
9.30
16.48
9.46
Sheep
74.88
10.77
9.62
2.12
1.31
0.82
132
Page 2 of 2

Data_Collected_Date
Region S.N.N.P
Zone SILTIE
Wereda HULBAREG
Tuesday, July 9, 2019
Selected Indicator
Economic Vulnerability: Livestock Ownership and Changes - Households
perception on changes in livestock number in the last five years (response in %)
Type of Livestock Owned
Changes Observed By Households
Bee keeping
A - Decreased
15.29
B - Remained the Same
76.47
C - Increased
8.24
Camels: Female
1.10
98.90
Camels: Male
100.00
Camels: Young Female
100.00
Camels: Young Male
0.54
99.46
Cattle: Female
36.63
50.87
12.50
Cattle: Male bulls
37.16
50.82
12.02
Cattle: Mature Female
52.31
36.62
11.07
Cattle: Mature Male
49.38
34.92
15.70
Cattle: under 1 year
35.10
51.20
13.70
Donkeys
27.98
56.18
15.84
Goats
39.73
46.22
14.05
Horses
1.08
96.24
2.69
Mules
4.23
94.71
1.06
Poultry
40.93
39.31
19.76
Sheep
34.57
54.65
10.78
133
Page 1 of 3
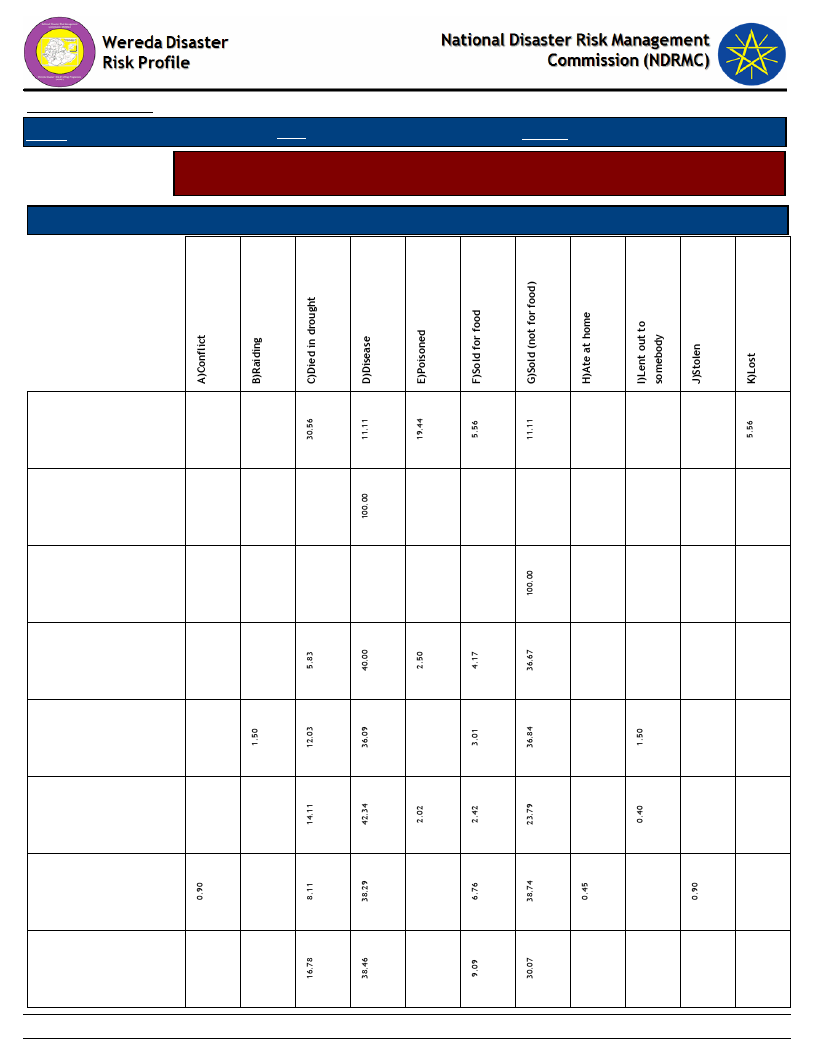
Data_Collected_Date
Region S.N.N.P
Zone SILTIE
Wereda HULBAREG
Tuesday, July 9, 2019
Selected Indicator
Economic Vulnerability: Livestock Ownership and Changes - Households
perception on changes in livestock number in the last five years (response in %)
Type of Livestock Owned
Reason for Decrease in Livestock Number
Bee keeping
Camels: Male
Camels: Young
Male
Cattle: Female
Cattle: Male bulls
Cattle: Mature
Female
Cattle: Mature
Male
Cattle: under 1
year
134
Page 2 of 3
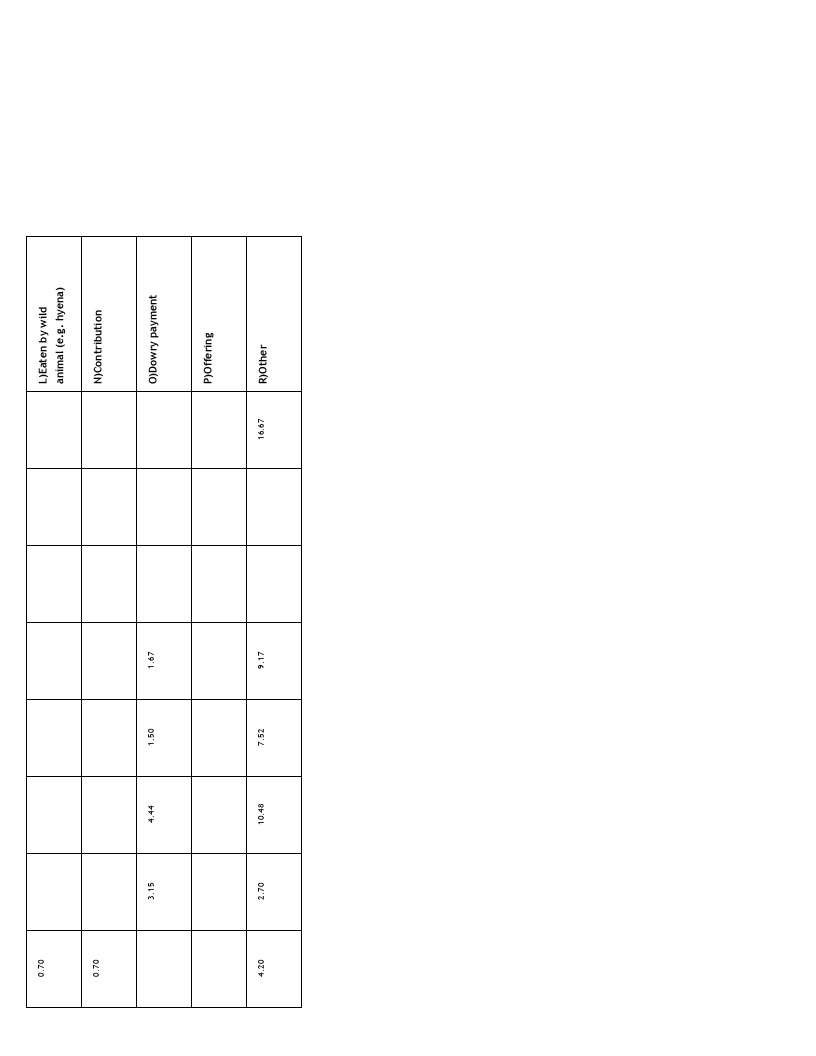
135
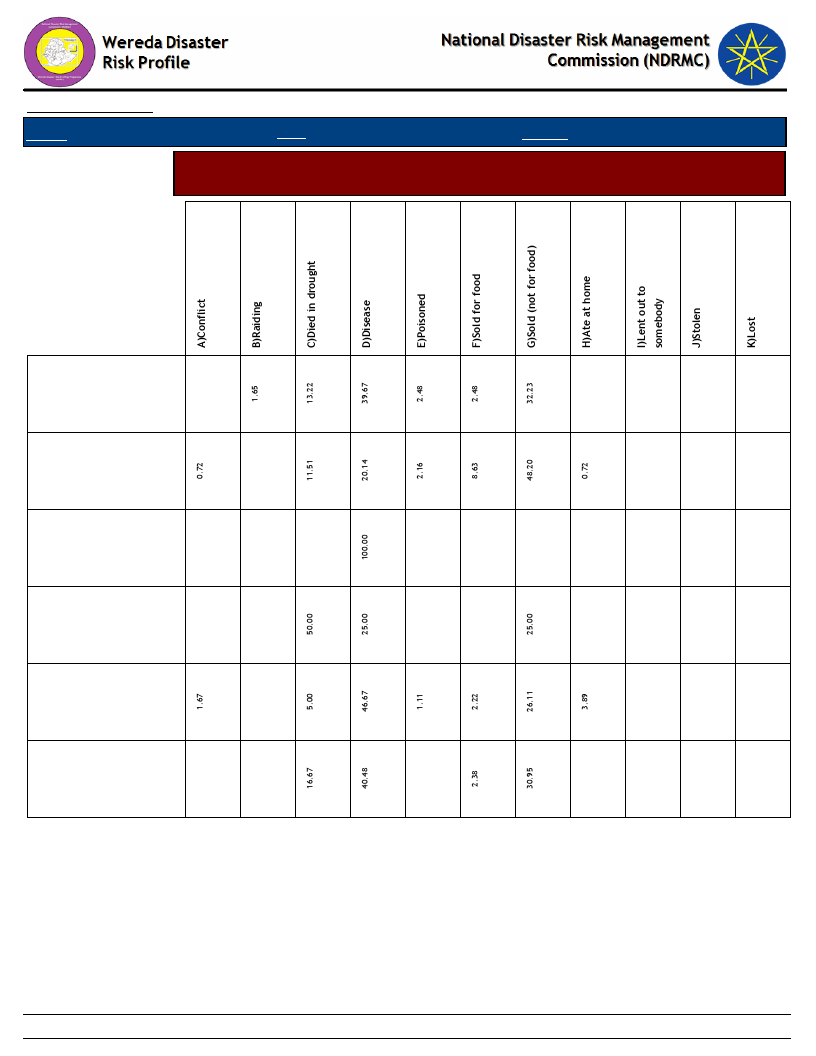
Data_Collected_Date
Region S.N.N.P
Zone SILTIE
Wereda HULBAREG
Tuesday, July 9, 2019
Selected Indicator
Economic Vulnerability: Livestock Ownership and Changes - Households
perception on changes in livestock number in the last five years (response in %)
Donkeys
Goats
Horses
Mules
Poultry
Sheep
136
Page 3 of 3
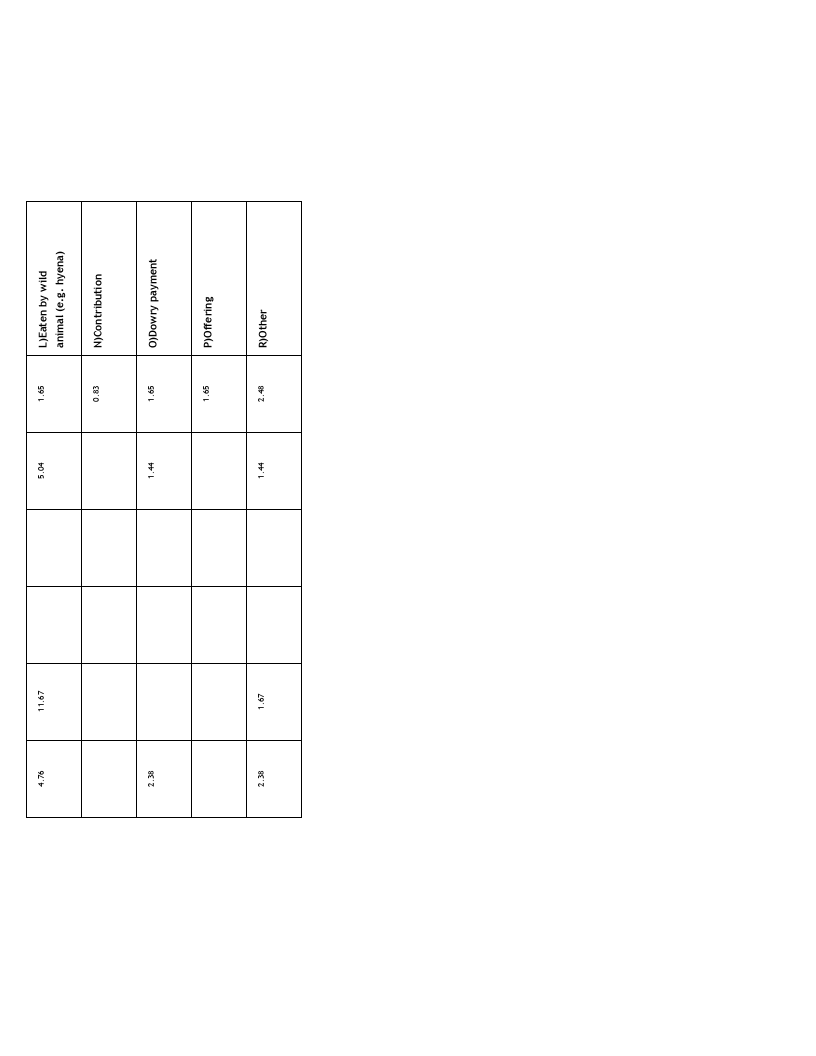
137
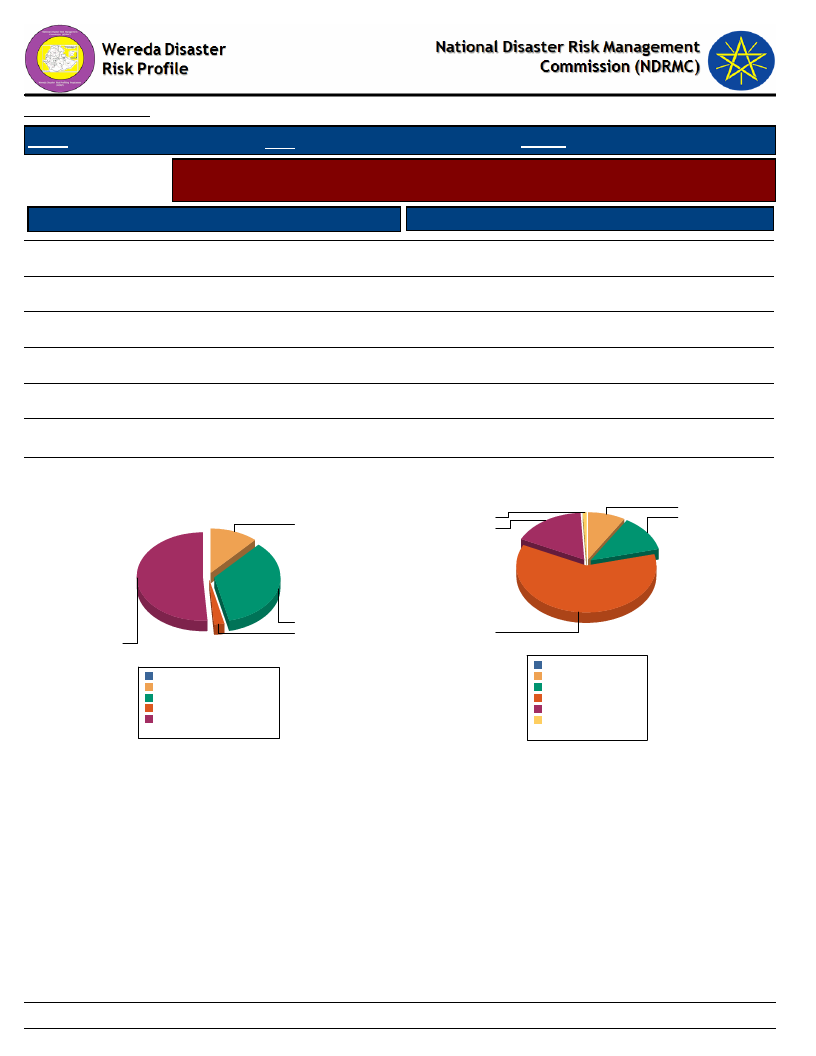
Data_Collected_Date
Tuesday, July 9, 2019
Region S.N.N.P
Zone SILTIE
Wereda HULBAREG
Selected Indicator
Agriculture (Livestock): Pasture Availability - Households perception on access
and quality of pasture
Access to Pasture
Response Percent
Quality of Pasture
Response Percent
Occasionally
34.77
B - Good
8.54
Seldom available
50.99
C - Adequate
12.73
Never available
11.75
D - Poor
61.14
E - Very poor
16.92
F - DK
0.84
Regularly available
2.48
Household responses to Access to Pasture for
Livestock
11.8
Household responses to Quality of Pasture
8.5
0.8
12.7
16.9
51.0
34.8
2.5
Never available
Occasionally
Regularly available
Seldom available
0.0%
11.8%
34.8%
2.5%
51.0%
Total:
100.0%
61.1
B - Good
0.0%
8.5%
C - Adequate
D - Poor
E - Very poor
F - DK
12.7%
61.0%
16.9%
0.8%
Total:
100.0%
138
Page 1 of 1
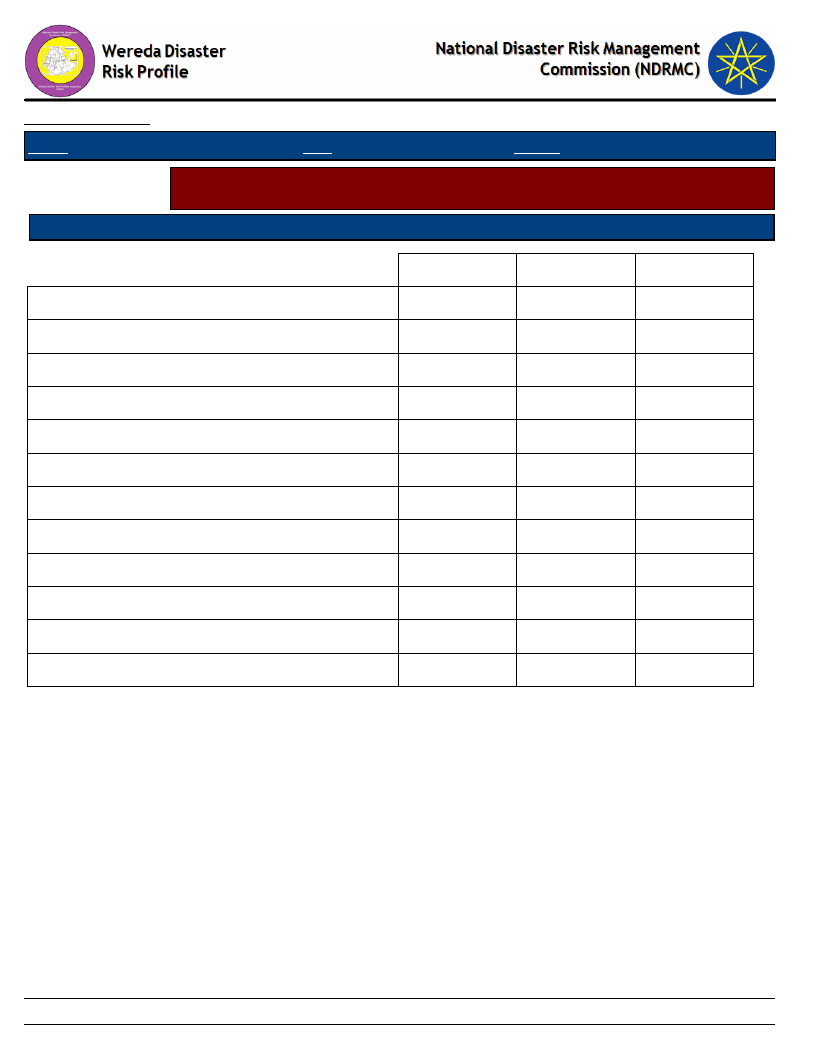
Data_Collected_Date
Region S.N.N.P
Zone SILTIE
Tuesday, July 9, 2019
Wereda HULBAREG
Selected Indicator
Agriculture (Livestock): Pasture Availability - Households perception on
problematic months for pasture availability
Problematic Months
Order of Severity
A - Sep (Meskerem)
B - Oct (Tikimt)
C - Nov (Hidar)
D - Dec (Tahsas)
E - Jan (Tir)
F - Feb (Yekatit)
G - Mar (Megabit)
H - Apr (Meazea)
I - May (Ginbot)
J - Jun (Sene)
K - Jul (Hamle)
L - Aug (Nehase)
1st
0.33
0.33
9.83
33.67
26.17
9.33
13.17
6.17
0.67
0.33
2nd
0.33
0.33
9.68
33.72
26.54
10.02
13.86
5.51
3rd
0.34
0.34
0.34
0.67
10.74
33.39
26.34
8.39
14.26
5.20
139
Page 1 of 1
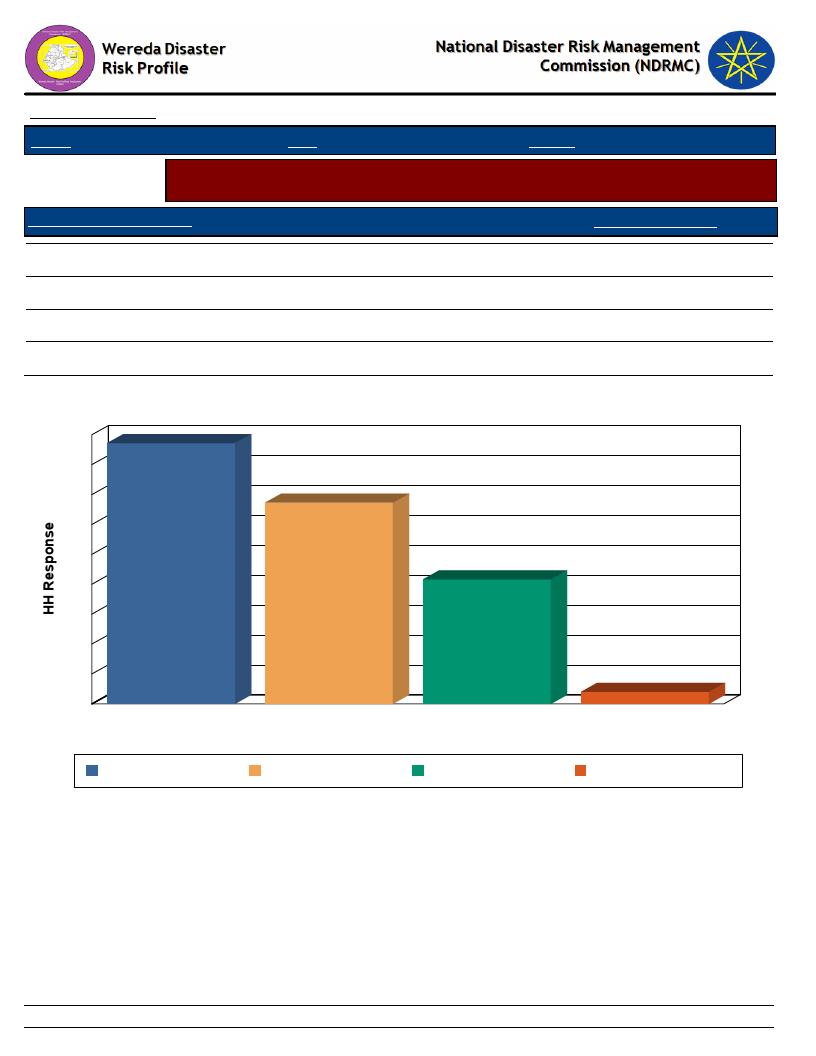
Data_Collected_Date
Region S.N.N.P
Zone SILTIE
Tuesday, July 9, 2019
Wereda HULBAREG
Selected Indicator
Agriculture (Livestock): Water Availability - Households response on water
availability for livestock
Access to Water - Livestock
Household Response
A - Regularly available
B - Occasionally
C - Seldom available
D - Never available
43.58
33.63
20.80
1.99
Household Access to Water for Livestock
45
44
40
35
34
30
25
21
20
15
10
5
0
A - Regularly available
B - Occasionally
C - Seldom available
Access to Water - Livestock
2
D - Never available
A - Regularly available B - Occasionally
C - Seldom available
D - Never available
140
Page 1 of 1
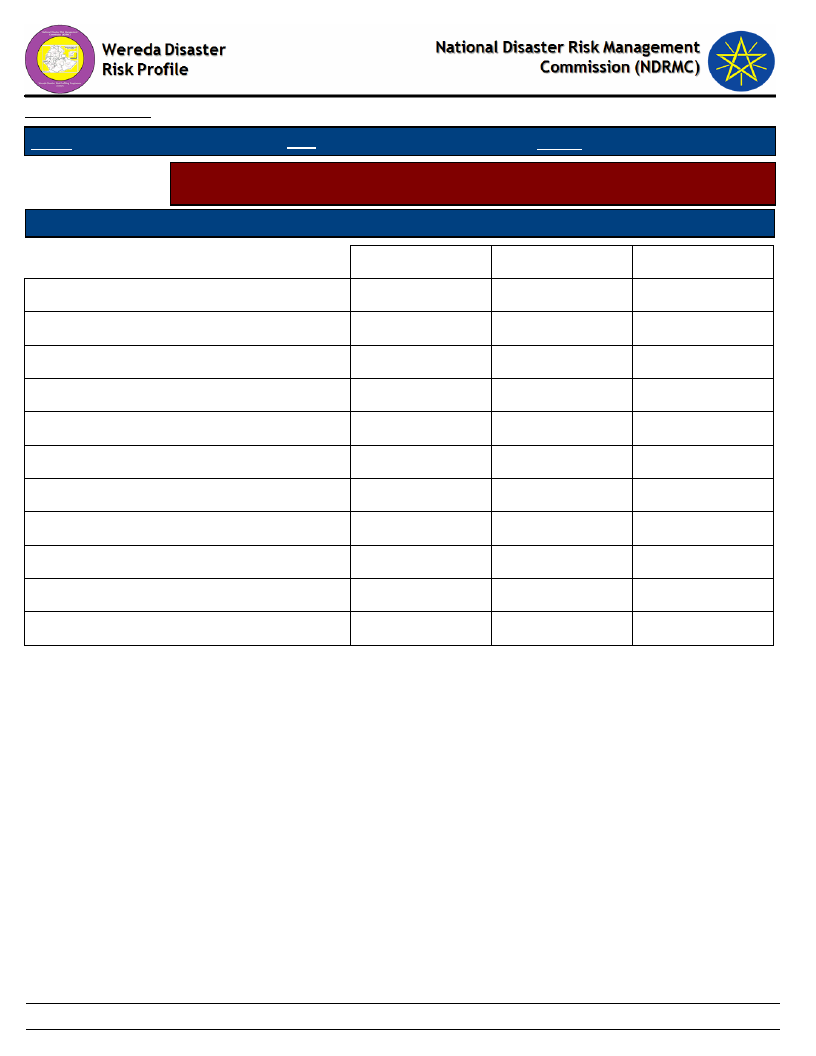
Data_Collected_Date
Region S.N.N.P
Zone SILTIE
Tuesday, July 9, 2019
Wereda HULBAREG
Selected Indicator
Agriculture (Livestock): Water Availability - Households perception on
problematic months for water availability for Livestock
Problematic Months
Order of Severity
A - Sep (Meskerem)
B - Oct (Tikimt)
D - Dec (Tahsas)
E - Jan (Tir)
F - Feb (Yekatit)
G - Mar (Megabit)
H - Apr (Meazea)
I - May (Ginbot)
J - Jun (Sene)
K - Jul (Hamle)
L - Aug (Nehase)
1st
0.95
0.48
5.94
31.12
36.58
20.43
2.38
1.90
0.24
2nd
6.00
34.29
36.21
18.71
4.08
0.48
0.24
3rd
0.50
6.30
33.75
39.55
18.89
0.50
0.50
141
Page 1 of 1
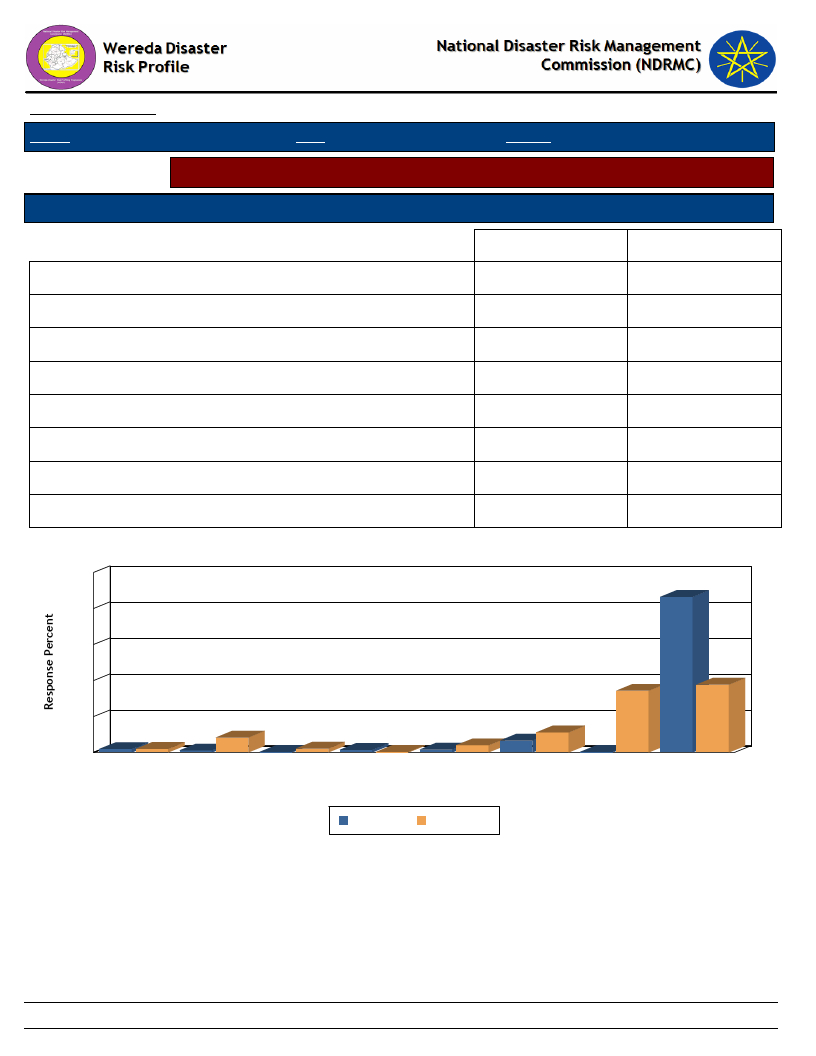
Data_Collected_Date
Region S.N.N.P
Zone SILTIE
Tuesday, July 9, 2019
Wereda HULBAREG
Selected Indicator
Sources of water for livestock (households response in %)
Type of Livestock Owned
Changes Observed By Households
Communal tap (Bono)
Open/Deep well
Other
Piped water outside the house
Pond or lake (fenced)
Pond or lake (open access)
Rainwater harvesting
River, stream
Dry Season
1.99
1.16
0.33
1.50
1.66
6.64
0.33
86.38
Wet Season
2.00
8.33
2.17
0.33
4.00
11.17
34.33
37.67
Household Responses to Type of Water Source and Season for Livestock
100
86
80
60
40
20
2
2
0
8
1
Communal tap Open/Deep well
(Bono)
0
2
2
0
2
4
11
7
Other
Piped water
Pond or lake
Pond or lake
outside the
(fenced)
(open access)
Type ohfouWseater Source & Season
Dry Season
Wet Season
34
0
Rainwater
harvesting
38
River, stream
142
Page 1 of 1
WDRP Indicators
Access to Market and Credit
143
Wereda Disaster
Risk Profile
Data_Collected_Date
National Disaster Risk Management
Commission (NDRMC)
Tuesday, July 9, 2019
Region S.N.N.P
Zone SILTIE
Wereda HULBAREG
Selected Indictor:
KebeleName
BOLE
OBISO WACHO
Economic Vulnerability: Proportion of Produce Sold and Market - Proportion of crops and livestock sold from total
production and markets
Market_For_Crops
Market_For_Livestock_Produce
Percent
Livestock_Sold
Total_% Comments
Sold
Urban area
Urban area (Hulbareg)
10%
70%
(Hulbareg)
Urban area
Urban area
10%
50%
KEBELE 01
Urban area
Urban area /Kerate and Kutere/
90
50
/Werabe/
ANGAMO YODE
Kerate market
Kerate market
60
50
AMOBARACHO
In local market near
In local market near by the
10
ACHAM
by the wereda
wereda /Kerate/
/Kerate/
TODE TEMEDE
Kerate market and
Kerate and Dalocha
40
Daloch market
DEMEQE
At Keble level in
Urban area
10
agricultural
cooperative
organization
WERABAT SHAMA
Urban area
Urban area
10
30
Most of the community sell the
large of livestock produce for
purchasing other consumption
good such as salt and fuel but
from the total produce of crop
and livestock the larger share
kept for house hold consumption.
45
The community of this Keble not
sell maize and sorghum the only
selling is wheat
30
30
144
Page 1 of 2
Wereda Disaster
Risk Profile
Data_Collected_Date
National Disaster Risk Management
Commission (NDRMC)
Tuesday, July 9, 2019
Region S.N.N.P
Zone SILTIE
Wereda HULBAREG
Selected Indictor:
KebeleName
BILA WANJA
Economic Vulnerability: Proportion of Produce Sold and Market - Proportion of crops and livestock sold from total
production and markets
Market_For_Crops
Market_For_Livestock_Produce
Percent
Livestock_Sold
Total_% Comments
Sold
Urban area
Urban area
50
10
AMBERCHO GIMBA
Urban area
Urban area
10
25
ALBEZER ZEMU
SHIDGER
DATE WEZIR 6
BRHAN KITKITA
Urban area
At Keble level
In local market
Urban area
Urban area
Urban area
10
25
10
60
The people are more dependent
on perennial crop production
10
20
145
Page 2 of 2
Data_Collected_Date
Region S.N.N.P
Selected Indicator
Kebele Name
BOLE
OBISO WACHO
KEBELE 01
ANGAMO YODE
AMOBARACHO ACHAM
TODE TEMEDE
DEMEQE
WERABAT SHAMA
BILA WANJA
AMBERCHO GIMBA
ALBEZER ZEMU SHIDGER
DATE WEZIR 6
BRHAN KITKITA
Tuesday, July 9, 2019
Zone SILTIE
Wereda HULBAREG
Economic Vulnerability: Kebele Access to Markets - Access to market by Kebele
Market_Access_Comments
There is no access to market due to lack of road access and there is seasonal market
price fluctuation in crop products during contribution period.
Seasonal problem on market price of crop product is the main problem of the area.
We have access to market both Hulbareg and Werabe, but our main problem is seasonal
market price fluctuation for our product.
The accessibility of market for this area is not facilitated the community sell their crop
product and animal Kerate which found 24 km distance from the Keble.
The local population have access to market near by the wereda capital Kerate which is
around 7 km far from the Keble center, but seasonal fluctuation of market price is the
most common problem in the area.
To reach market place high distance and lack of road to transport their products due to
these problem the community does not found good product price.
Seasonal market fluctuation for crop products especially at the period of contribution.
There is a seasonal price fluctuation for crop products especially at contribution period
the price of crop became lower.
We have access to market but there is seasonal problems in market price on crop
productive and high tax rate at market place is the main problem.
Seasonal problem for crop products price fluctuation and transportation cost of
products to the market.
Seasonal price fluctuation on crop products and accessibility of market is less that we
get the access for different urban area.
Seasonal market price problem for crop products
Seasonal market price problem for our product is the main problem.
146
Page 1 of 1
Data_Collected_Date
Region S.N.N.P
Zone SILTIE
Tuesday, July 9, 2019
Wereda HULBAREG
Selected Indicator
Economic Vulnerability: Formal & Informal Transfers - Percentage of
households reporting received formal transfers
Type of Formal Transfer
Food aid
HH Response Type of Informal Transfer
Formal
5.40 Remittances (from relative living elsewhere)
HH Response
3.11
Food-for-Work project
12.42 Zakaat
0.99
Cash-for-Work project
14.50 Other cash gift
0.82
Faffa
4.42 Cash loan (no interest)
4.11
Free cash
0.17 Food or grain gift
1.15
Seeds
1.86 Grain loan (no interest)
1.81
Credit support
3.92 Seed gift
0.16
Livestock
Seed loan
0.66
Tools
Free labour
1.81
Blood money – compensation
0.17
Free use of pack animals (camels or donkeys)
1.15
Restocking of poorer relatives
0.66
Distribution of meat to neighbours after a slaughter
1.81
takes place
Sacrifice made to feed the poor
0.49
Donation or loan of milking animals to a relative or
0.82
friend
Donations of cash or animals to disaster stricken
0.49
people
Free use of oxen or plough
5.26
147
Page 1 of 2
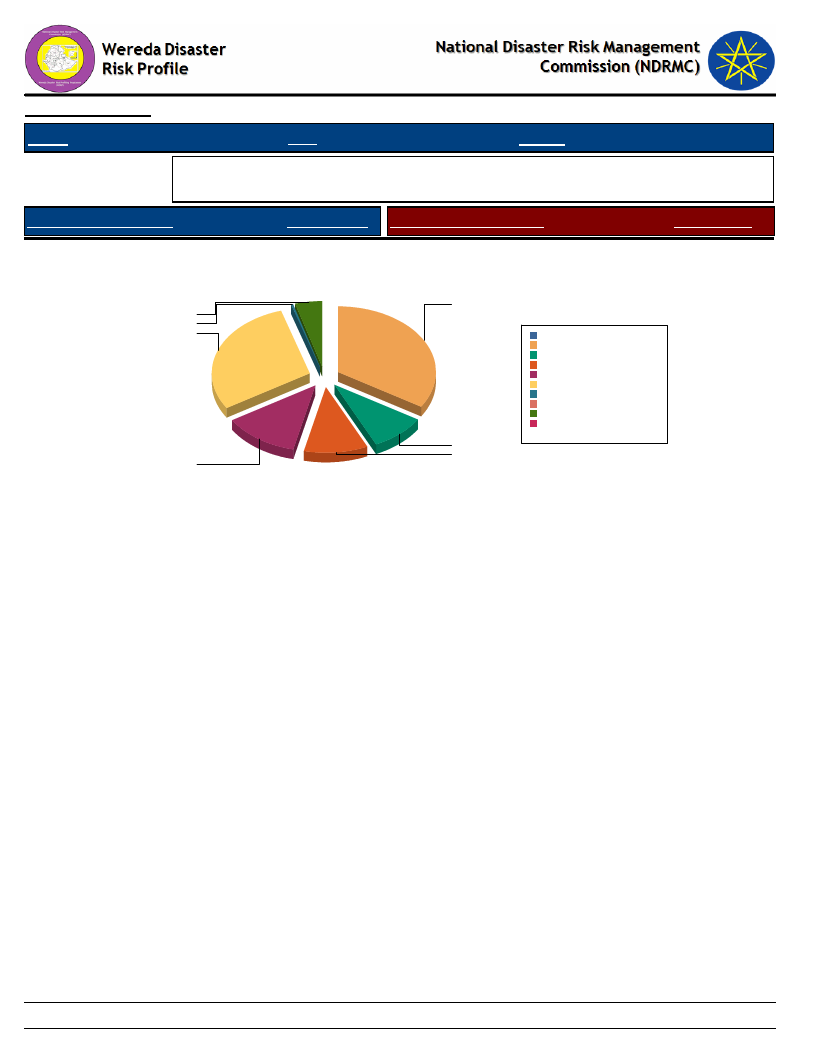
Data_Collected_Date
Tuesday, July 9, 2019
Region S.N.N.P
Zone SILTIE
Wereda HULBAREG
Selected Indicator
Economic Vulnerability: Formal & Informal Transfers - Percentage of
households reporting received formal transfers
Type of Formal Transfer
HH Response Type of Informal Transfer
Formal
Type of Formal Transfer Received By Households
HH Response
1.9
0.2
12.4
5.4
14.5
3.9
4.4
0.0%
Cash-for-Work project 34.0%
Credit support
9.2%
Faffa
10.4%
Food aid
12.6%
Food-for-Work project 29.1%
Free cash
0.4%
Livestock
0.0%
Seeds
4.4%
Tools
0.0%
Total:
100.0%
148
Page 2 of 2
Data_Collected_Date
Tuesday, July 9, 2019
Region S.N.N.P
Zone SILTIE
Wereda HULBAREG
Selected Indicator
Capacity: Access to Credit Facilities - Households access to credit facilities
Type of Access To Credit Facilities
Indicator_Value
Households with membership in any credit /micro finance society (%)
Households who borrowed any money in the last one year (%)
Households who tried to borrow 1-2
Households who tried to borrow 3-4
Households who tried to borrow 5 & Above
Households who managed to get credit 1-2
Households who managed to get credit 3-4
Households who managed to get credit 5 & Above
Average No. of HHs Tried to get Credit
Average No. HHs Managed to get Credit
18.98
18.20
87.90
10.48
1.61
93.16
5.13
1.71
1.23
1.56
149
Page 1 of 1
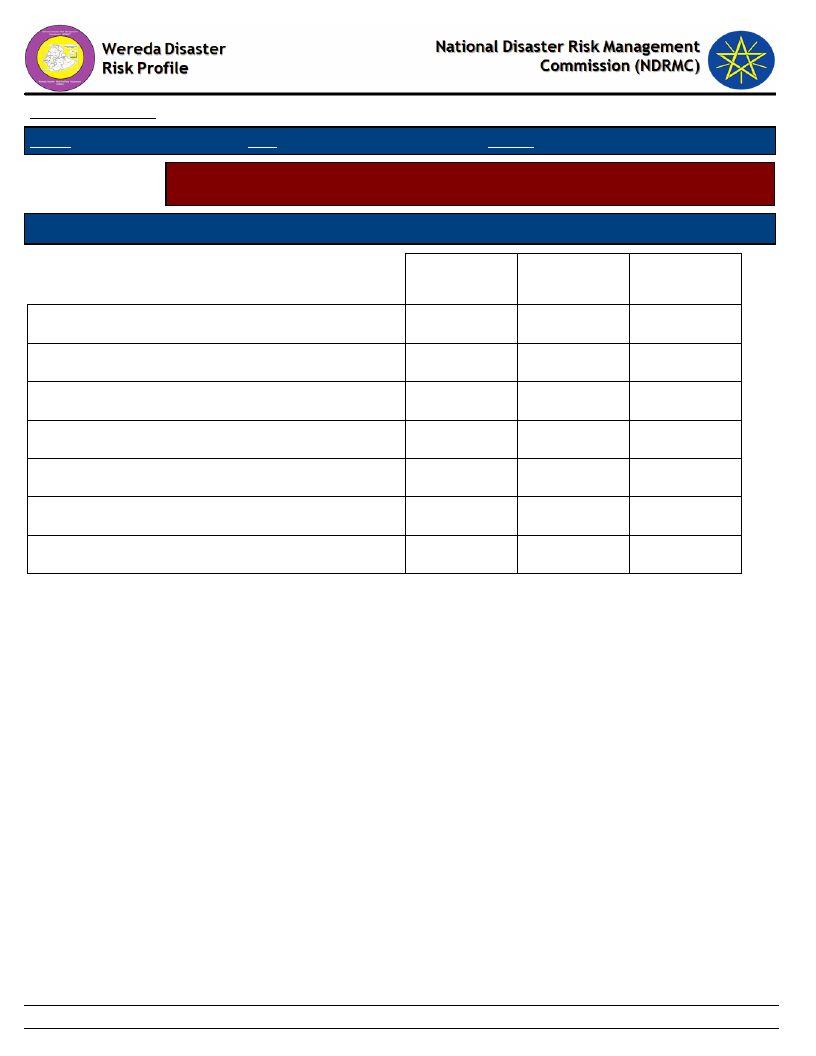
Data_Collected_Date
Region S.N.N.P
Zone SILTIE
Wereda HULBAREG
Tuesday, July 9, 2019
Selected Indicator
Capacity: Access to Credit Facilities - Percentage of households by major
reasons of borrowing money
Type of Borrowing Reason
Degree of Importance of the Borrowing Reasons - HH Respones
Buy agricultural input
Buy food
Buy or rent land
Others (specify)
Pay for education
Pay for health care
Pay for social event
1st
Important
42.37
15.25
4.24
18.64
3.39
11.02
5.08
2nd
Important
15.79
5.26
13.16
5.26
15.79
18.42
26.32
3rd
Important
72.73
18.18
9.09
150
Page 1 of 1

Data_Collected_Date
Tuesday, July 9, 2019
Region S.N.N.P
Zone SILTIE
Wereda HULBAREG
Selected Indicator
Capacity: Access to Credit Facilities - Percentage of households by major
sources of credit
Major Sources of Credit for Households
Degree of Importance of the Credit Source
Bank/formal lending institution
Friends/relatives
1st
Important
60.34
12.07
2nd
Important
28.57
21.43
3rd
Important
25.00
Help associations (Edir)
0.86
Informal savings group (Ekub)
Local shops / moneylenders
Neighbors
Others (specify)
1.72
2.59
6.90
15.52
14.29
35.71
50.00
25.00
151
Page 1 of 1
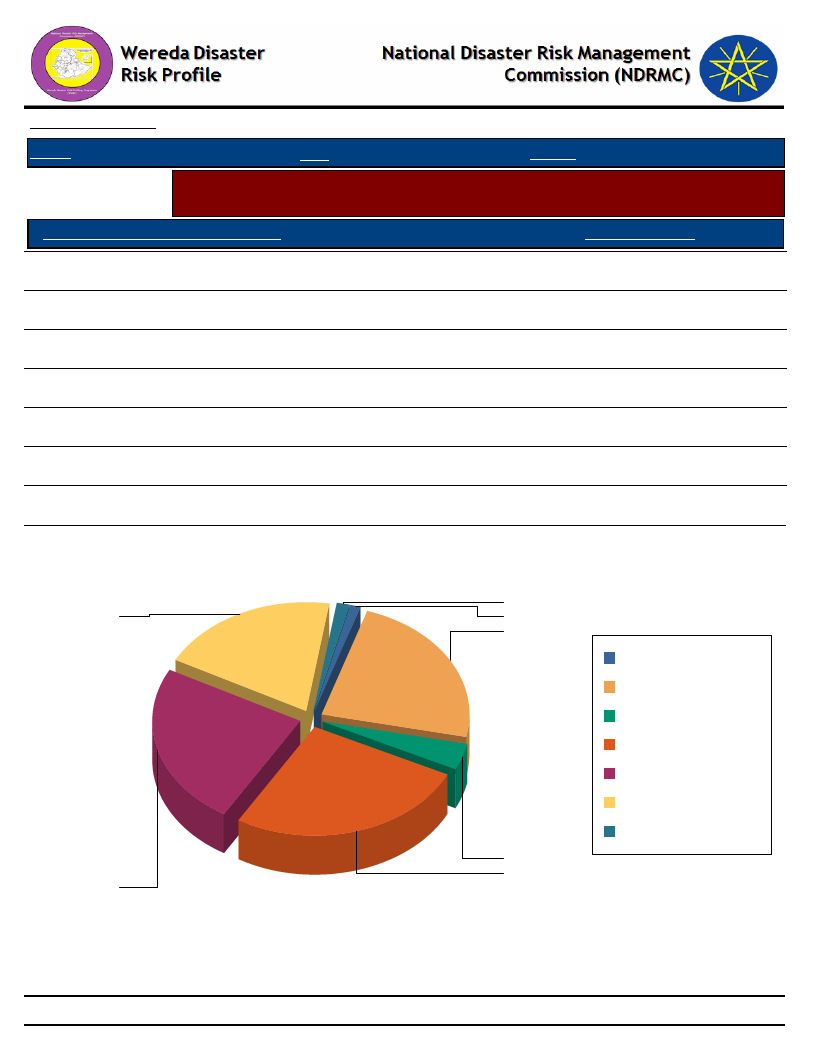
Data_Collected_Date
Tuesday, July 9, 2019
Region S.N.N.P
Zone SILTIE
Wereda HULBAREG
Selected Indicator
Capacity: Access to Credit Facilities - Percent of households with ability to raise
500 birr in one week
HH Ability To Raise 500 Br in One Week
Response_Percent
Yes, we would use our savings
20.10
Yes, by borrowing money
26.69
Yes, with some help from others
1.39
Yes, by selling asset or livestock
24.26
Perhaps, but I doubt it
3.99
No, it would be impossible
23.57
DK
1.21
Households' Ability To Raise 500 Br in One Week
1
20
1
24
DK
No, it would be
impossible
Perhaps, but I doubt it
Yes, by borrowing
money
Yes, by selling asset or
livestock
Yes, we would use our
savings
Yes, with some help
from others
4
27
24
152
Page 1 of 1
WDRP Indicators
Health and Sanitation
Characteristics
153
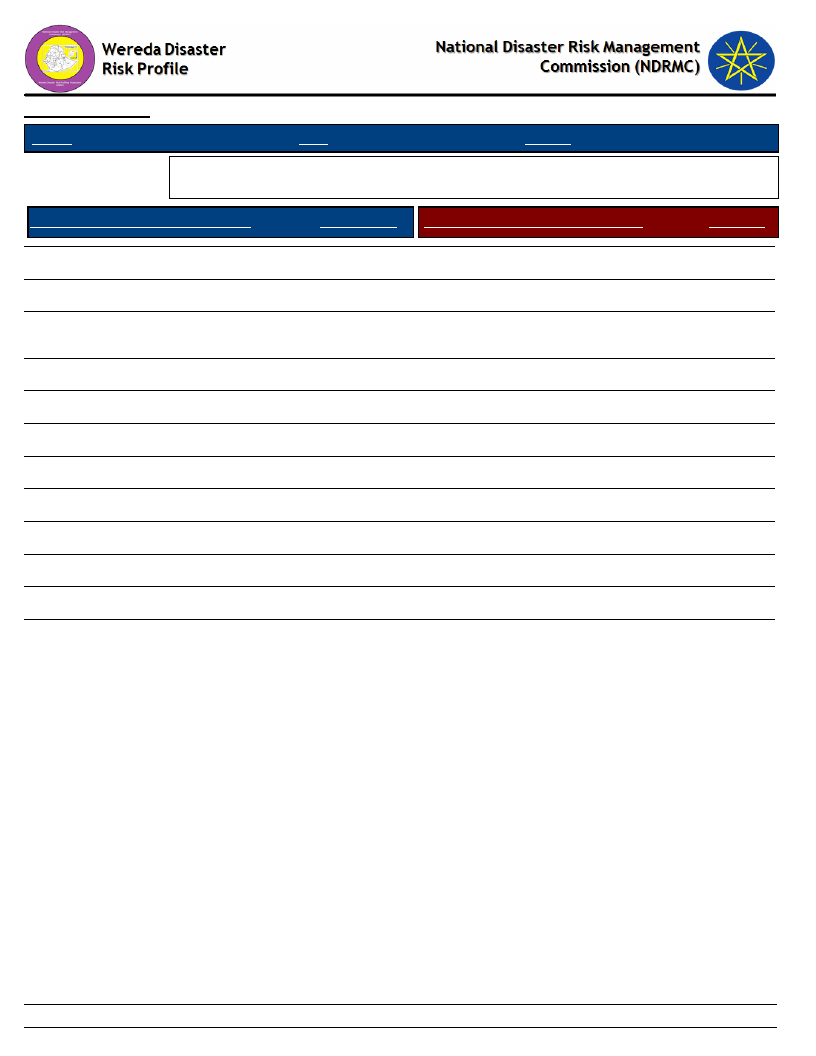
Data_Collected_Date
Region S.N.N.P
Zone SILTIE
Tuesday, July 9, 2019
Wereda HULBAREG
Selected Indicator
Household Access to Health Facilities - Where do patients go for health care?
Constraints to adequate healthcare
Where do Patients Go for Healthcare
HH Response Constraints to Adequate Health Care
Response
Did not get Health Care
Central Hospital
District/Municipal hospital/health
centre/ clinic
Other public
Mission facility
Spiritual healer
Other
Community health worker
Private hospital/clinic
Pharmacy
Other private
Traditional healer
4.05
4.93
13.02
48.80
0.25
0.38
0.25
17.70
2.15
1.01
6.70
0.76
No money for treatment costs
No money for travel
Poor quality of service
Not aware about any health facility
NA
76.92
7.69
7.69
7.69
3.85
154
Page 1 of 2
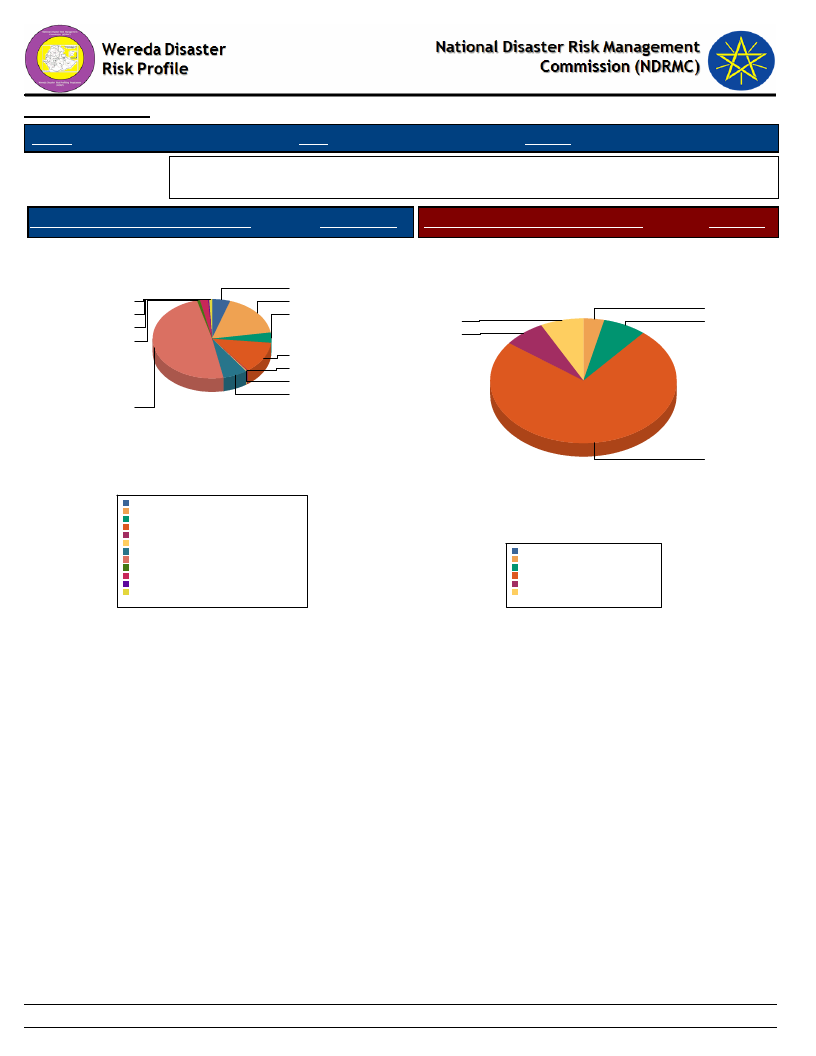
Data_Collected_Date
Region S.N.N.P
Zone SILTIE
Tuesday, July 9, 2019
Wereda HULBAREG
Selected Indicator
Household Access to Health Facilities - Where do patients go for health care?
Constraints to adequate healthcare
Where do Patients Go for Healthcare
HH Response Constraints to Adequate Health Care
Response
Where Do Patients go for Health care?
5
1
18
0
4
2
1
13
0
0
7
49
Constraints to Adequate Health Care
4
8
8
8
Central Hospital
Community health worker
Did not get Health Care
District/Municipal hospital/health centre/ clinic
Mission facility
Other
Other private
Other public
Pharmacy
Private hospital/clinic
Spiritual healer
Traditional healer
4.9%
17.7%
4.0%
13.0%
0.2%
0.2%
6.7%
48.8%
1.0%
2.1%
0.4%
0.8%
Total:
100.0%
77
NA
No money for travel
No money for treatment costs
Not aware about any health facility
Poor quality of service
0.0%
3.7%
7.4%
74.1%
7.4%
7.4%
Total:
100.0%
155
Page 2 of 2
Data_Collected_Date
Region S.N.N.P
Zone SILTIE
Tuesday, July 9, 2019
Wereda HULBAREG
Selected Indicator
Hazards: Health problems and changes over the last decade
Kebele Name
Health_Problems
Changes_In_Last_Decade
BOLE
OBISO WACHO
KEBELE 01
ANGAMO YODE
AMOBARACHO
ACHAM
TODE TEMEDE
DEMEQE
WERABAT SHAMA
BILA WANJA
AMBERCHO GIMBA
ALBEZER ZEMU
SHIDGER
DATE WEZIR 6
Malaria, Typhoid, kidney and water born disease Caused
By Poor hygiene and sanitation and presence of mosquito
breeding site and illness.
Malaria, typhus and typhoid Caused By Presence of
mosquito breeding site, death, poor sanitation and affect
the production capacity.
Water born disease /kidney, typhoid and typhus/ Caused
By Water pollution, poor hygiene and sanitation and it
effect on economic cries and health distribution
Diarrhea and malaria Caused By Poor sanitation
Malaria Caused By Appearance of of water logging,
unwise use of mosquito net and affect the production
capacity of the community
Typhoid and typhus Caused By Un proper dirking water
and loss of human productivity
Malaria, typhoid and typhus Caused By Poor hygiene and
sanitation, shortage of pure water and presence of
mosquito breeding site.
Malaria, typhoid and typhus Caused By Mosquito breeding
site and poor sanitation
Malaria, typhoid and typhus Caused By Water logging
area, presence of mosquito breading site and lack of
potable water and impact on human health and death of
infant.
Malaria, typhoid, typhus and blood pressure Caused By
The presence of mosquito s breading site and sanitation
problem and impacts on illness and death
Malaria, typhoid and typhus Caused By The presence of
mosquito breading site, poor sanitation and water
logging area that effect death and illness
Malaria, typhus and typhoid Caused By Poor hygiene and
sanitation, unwise waste disposal and lack of pure water
and affect the production of capacity of the community
Decrease
Decreased
Increase
Decreasing
Decreased
Decreasing
Decrease
Decrease
Decrease
Decrease
Decrease
Decrease
156
Page 1 of 2
Data_Collected_Date
Region S.N.N.P
Zone SILTIE
Tuesday, July 9, 2019
Wereda HULBAREG
Selected Indicator
Hazards: Health problems and changes over the last decade
Kebele Name
Health_Problems
Changes_In_Last_Decade
BRHAN KITKITA
Malaria, typhoid and typhus Caused By Presences of
mosquito breading site and poor sanitation
Decrease
157
Page 2 of 2
Wereda Disaster
Risk Profile
Data_Collected_Date
National Disaster Risk Management
Commission (NDRMC)
Tuesday, July 9, 2019
Region S.N.N.P
Zone SILTIE
Wereda HULBAREG
Selected Indicator
Household Health Status - Households health condition and major health problems
Health Condition
HH Response Population Sickness
HH Response Children Sickness
HH Response
Good health
Ill for <3 months
Ill for more than three months
75.66
16.89
7.45
Chronic fever
Malaria
Diarrhea
Stomach pain
Asthma
Mental illness
Others
Tuberculosis
Meningitis
Pneumonia/ lung problem
Hyper tension
Eye problems
Back ache
Headache
12.73
15.48
6.37
6.99
1.50
4.12
26.34
2.75
0.37
7.12
3.12
2.62
1.25
9.24
Chronic fever
Malaria
Diarrhea
Tuberculosis
Pneumonia/ lung problem
Eye problems
Stomach pain
Others
Headache
14.91
14.91
14.29
4.97
11.80
0.62
1.24
27.95
7.45
158
Page 1 of 2
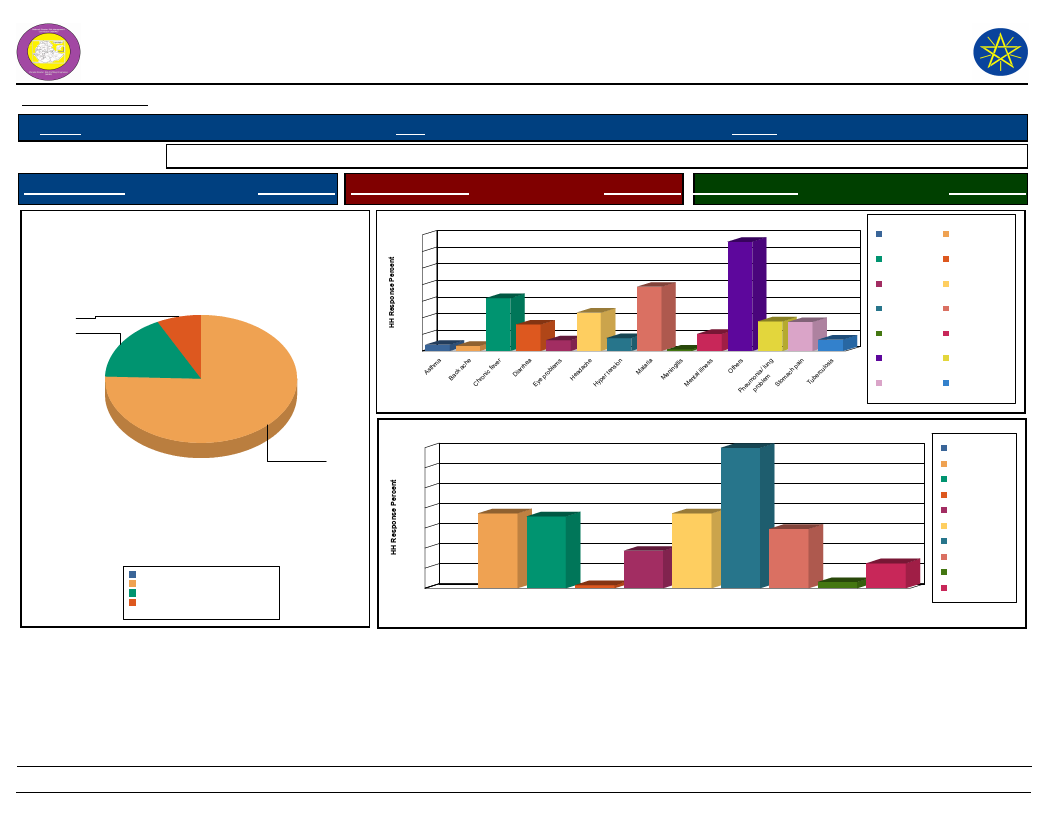
Wereda Disaster
Risk Profile
Data_Collected_Date
National Disaster Risk Management
Commission (NDRMC)
Tuesday, July 9, 2019
Region S.N.N.P
Zone SILTIE
Wereda HULBAREG
Selected Indicator
Household Health Status - Households health condition and major health problems
Health Condition
HH Response Population Sickness
HH Response Children Sickness
HH Response
Health Condition of the Community
7.5
16.9
75.7
Good health
Ill for <3 months
Ill for more than three months
0.0%
75.7%
16.9%
7.4%
Total:
100.0%
Population Sickness in the Community
28
26
24
20
16
13
12
8
4
2
1
0
a
Asthm
Back ache Chronic fever
15
9
6
3
3
4
0
Diarrhea
s
problem
Eye
Headache Hyper tension
alaria
M
eningitis
M
ental illness
M
Population Sickness
7
7
3
OtherPsneumopnroiab/lelumng
pain
ach
Stom
Tuberculosis
Asthma
Chronic fever
Eye problems
Hyper tension
Meningitis
Others
Stomach pain
Back ache
Diarrhea
Headache
Malaria
Mental illness
Pneumonia/ lung
problem
Tuberculosis
Children Sickness in the Community
28
28
Chronic fever
24
Diarrhea
20
Eye problems
16
15
14
15
Headache
12
12
Malaria
8
7
4
1
0
5
1
Others
Pneumonia/ lung
problem
Stomach pain
Tuberculosis
Chronic fever Diarrhea Eye problems Headache
Malaria
Others
Pneumonia/ Stomach pain Tuberculosis
lung problem
Children Sickness
159
Page 2 of 2
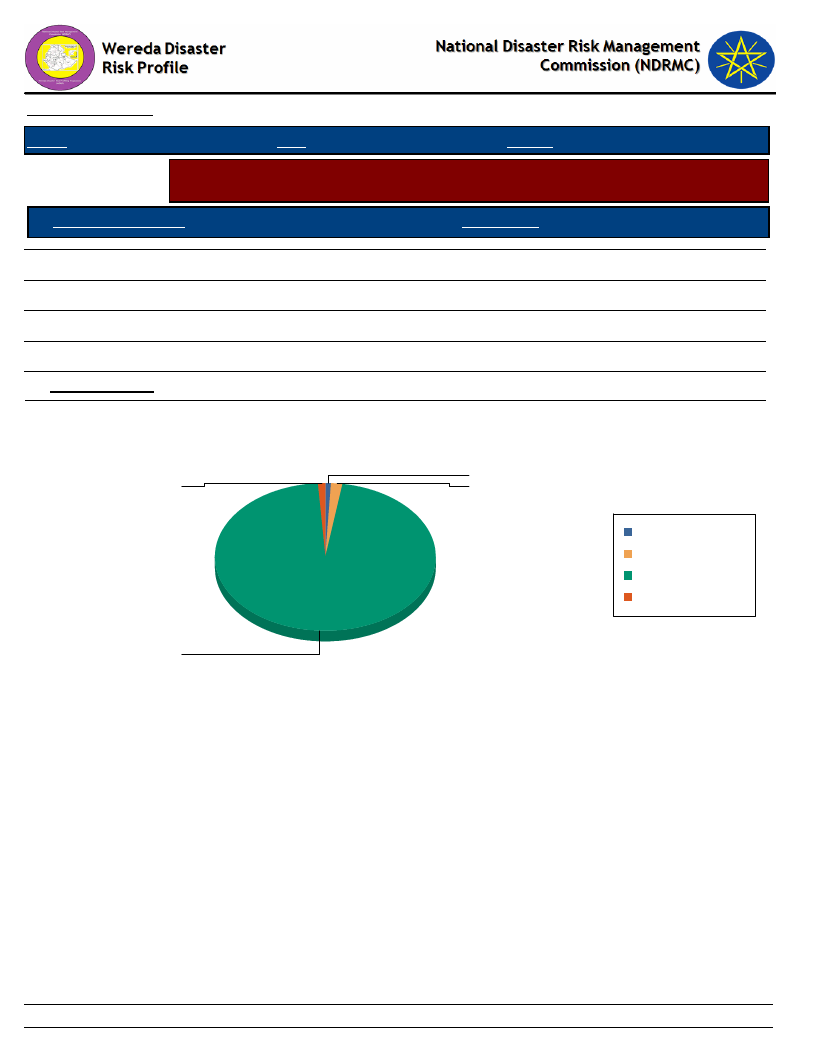
Data_Collected_Date
Tuesday, July 9, 2019
Region S.N.N.P
Zone SILTIE
Wereda HULBAREG
Selected Indicator
Household Access to Sanitation - Percentage of households with access to
different kind of toilet facilities
Type of Toilet Facility
HH Response
Modern water closet
Ventilated, build in latrine
Outdoors latrine/hole on plot
No facilities/Open Space
HH Sharing Toilet
0.82
0.98
96.40
1.80
2.13
Household Responses to the type of toilet facilities in the community
0.8
1.0
1.8
Modern water closet
No facilities/Open Space
Outdoors latrine/hole on
plot
Ventilated, build in
latrine
96.4
160
Page 1 of 1
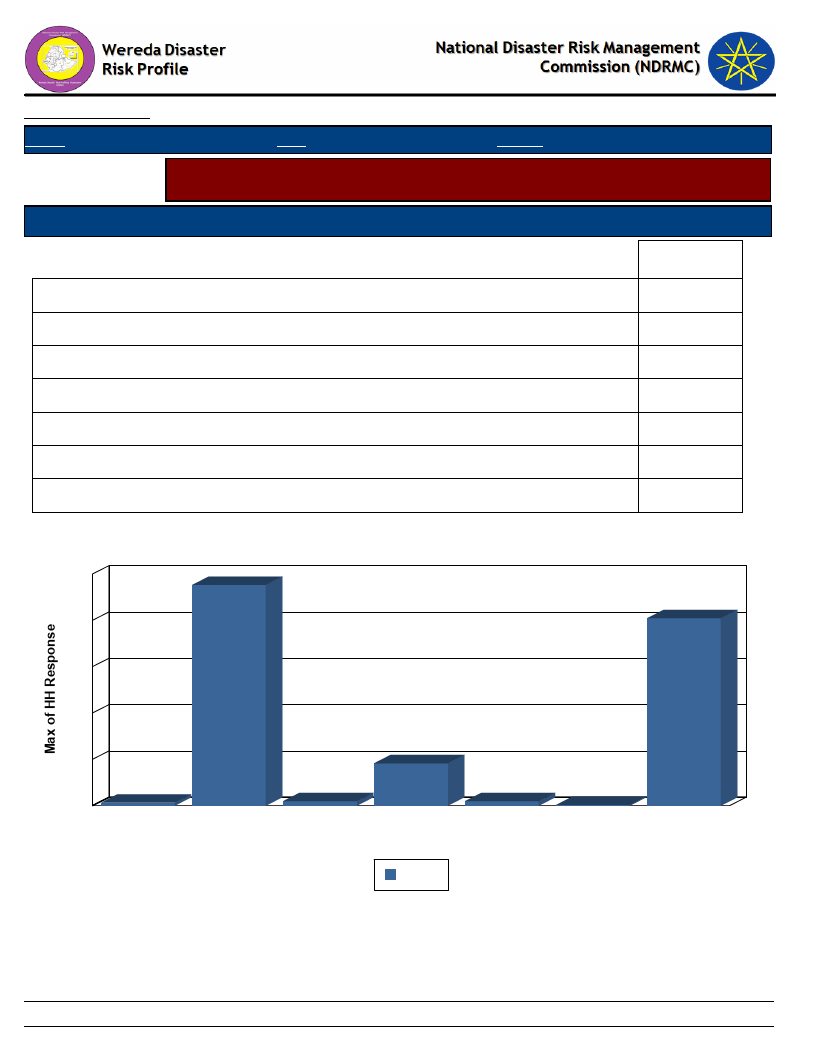
Data_Collected_Date
Region S.N.N.P
Zone SILTIE
Wereda HULBAREG
Tuesday, July 9, 2019
Selected Indicator
Household Access to Drinking Water - Sources of drinking water for households
(response in %)
Sources of drinking water for Households
Priority of the Water Source
Main
Birka
Communal tap (Bono)
Other
Piped water outside the house
Pond or lake (fenced)
Pond or lake (open access)
River, stream
0.65
47.63
0.98
9.14
0.98
0.16
40.46
Source of Drinking Water & Type of Source
50
48
40
40
30
20
10
1
1
0
Birka
Communal tap
Other
(Bono)
9
Piped water
outside the
house
Main
1
Pond or lake
(fenced)
0
Pond or lake
(open access)
River, stream
161
Page 1 of 1
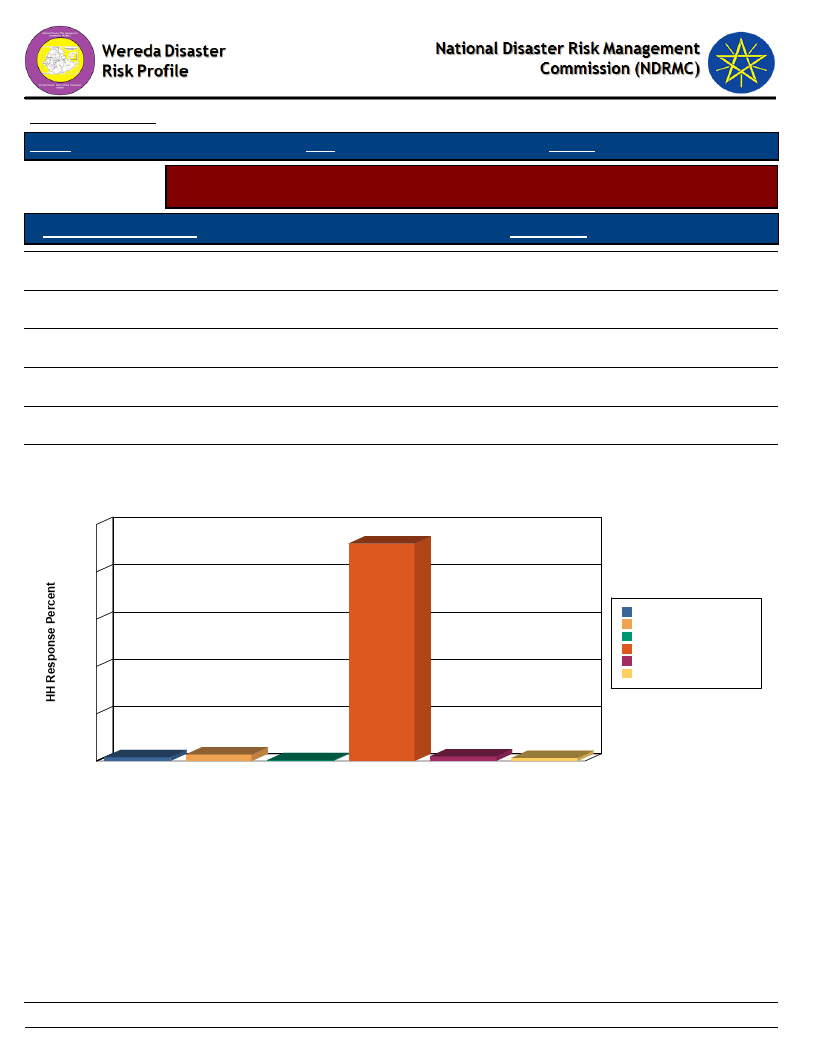
Data_Collected_Date
Region S.N.N.P
Zone SILTIE
Wereda
Tuesday, July 9, 2019
HULBAREG
Selected Indicator
Household Access to Drinking Water - Households methods of treating drinking
water
Method of Treating Water
HH Response
Boil
1.64
Water Guard
1.31
Use filter
1.97
Other chemicals
0.33
Other Method (specify)
91.95
None
2.79
Method of Treating Water by Households
100
92
80
Boil
60
None
Other chemicals
Other Method (specify)
40
Use filter
Water Guard
20
2
0
Boil
3
None
0
Other
chemicals
Other Method
(specify)
Water Treatment Method
2
Use filter
1
Water Guard
162
Page 1 of 1
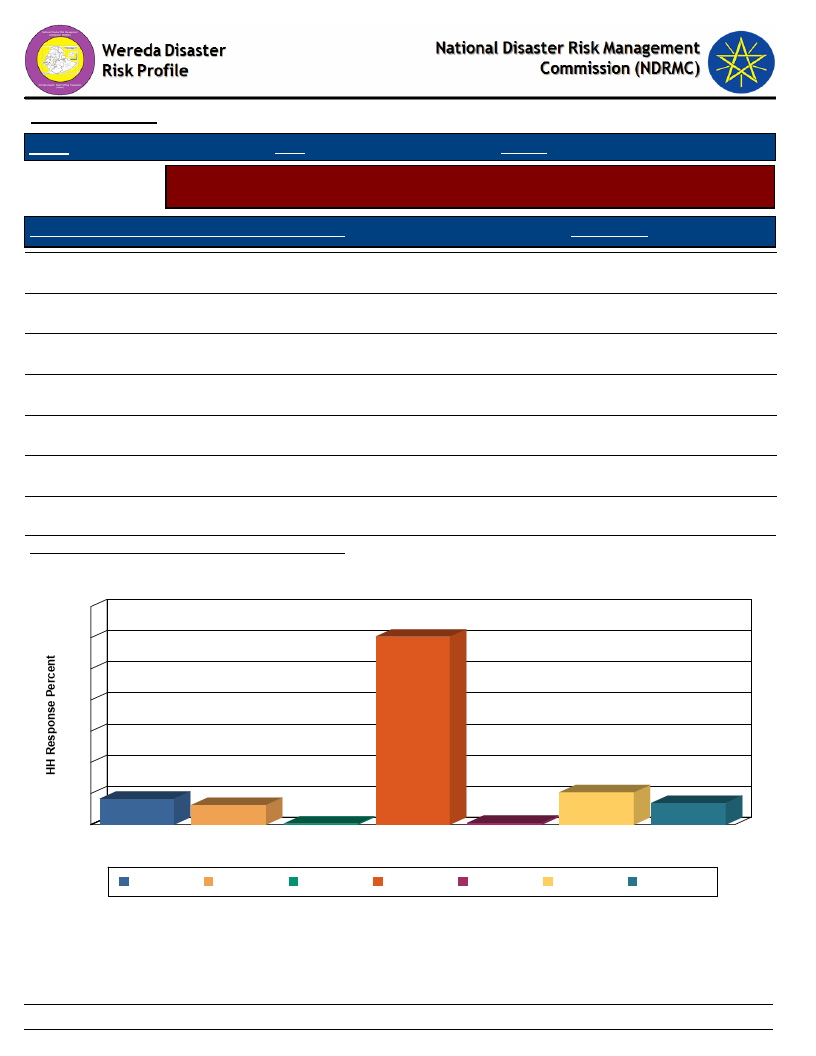
Data_Collected_Date
Tuesday, July 9, 2019
Region S.N.N.P
Zone SILTIE
Wereda HULBAREG
Selected Indicator
Household Access to Drinking Water - Number of times households fetch water
in a week
Number of Times Households Fetch Water in a Week
HH Response
Once
0.33
Twice
7.01
Three times
10.44
Four times
6.36
Five times
8.32
Six times
0.65
Seven times
60.36
Average Number of Times HH Fetch Water Per Week
6.40
Number of Times HH Fetch Water in a Week
70
60
60
50
40
30
20
10
8
0
Five times
6
Four times
0
1
Once
Seven times
Six times
Number of Times HH Fetch Water in a Week
10
Three times
7
Twice
Five times
Four times
Once
Seven times Six times
Three times
Twice
163
Page 1 of 1
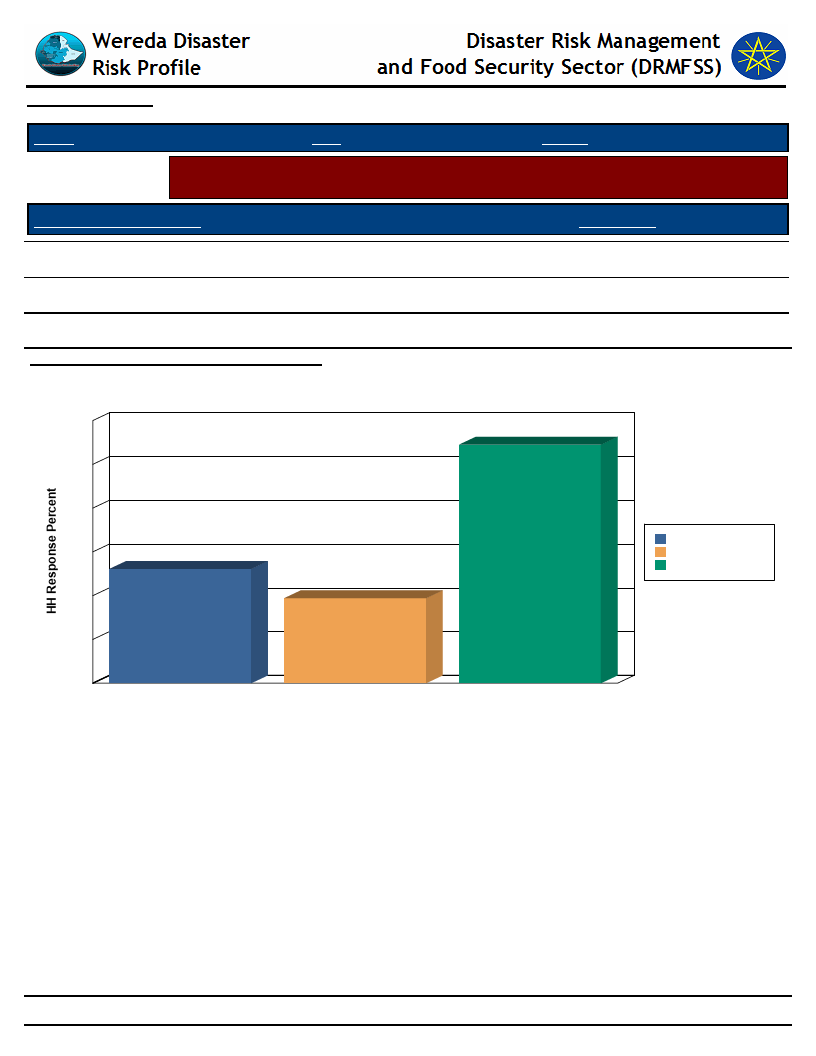
Data_Collected_Date
Tuesday, July 9, 2019
Region S.N.N.P
Zone SILTIE
Wereda HULBAREG
Selected Indicator
Household Access to Drinking Water - Time taken per day to fetch water for
households
Time Taken To Fetch Water
HH Response
Less than 30 min
54.49
30 min - 1 hr
19.41
1 hr and Above
Average Number of Times Taken To Fetch Water
26.10
55.60
Time Taken To Fetch Water for the HH
60
54
50
40
30
26
19
20
1 hr and Above
30 min - 1 hr
Less than 30 min
10
0
1 hr and Above
30 min - 1 hr
Less than 30 min
Time Taken To Fetch Water
164
Page 1 of 1
WDRP Indicators
Coping Mechanisms and
Preparedness
165
Wereda Disaster Risk
Profile
Data_Collected_Date
Region S.N.N.P
Zone SILTIE
Selected Indicator
KebeleName
Capacity: Community Preparedness against Sudden Onset Disasters
Precaution_1
Comment_1
Precaution_2
BOLE
OBISO WACHO
Develop a mitigation
measure according to
the type of disaster.
Report the problem
to higher officials
To minimize the
negative effect of
the disaster and to
resist the effect.
To get support
technically and
materially
Shifting the way of
living /livelihood /
adaptive measure
Migrate to safe
area
KEBELE 01
ANGAMO YODE
AMOBARACHO
ACHAM
Pray to God
To improve cut-off
drain system
Report the disaster
to Keble and wereda
office
To get a solution for
our problem from
God.
migration to safe
area
Cut-off drain
minimize the effect
of flood
Because
governmental
officials are
responsible to
searching the
mitigation measures
for disaster.
Storing crop
products for house
hold consumption
rather than selling
Searching of
additional support
from urban family
members
National Disaster Risk Management
Commission (NDRMC)
Tuesday, July 9, 2019
Wereda HULBAREG
Comment_2
In order to survive
and adapt the
effect
To save our selves
from the negative
impact of the
disaster
In order to protect
our selves from the
sudden-onset
disaster effect.
They can be
prevent famine and
mal-nutrition
Precaution_3
Pray to God
/Allah / and
report to
higher official
Develop a
mitigation
measure for
the negative
impact
Comment_3
To get external
support and
spiritual
strength
If it is possible
to minimize the
severity of the
problem
Because they are
better of the rural
community
166
Page 1 of 3

Wereda Disaster Risk
Profile
Data_Collected_Date
Region S.N.N.P
Zone SILTIE
National Disaster Risk Management
Commission (NDRMC)
Tuesday, July 9, 2019
Wereda HULBAREG
Selected Indicator
Capacity: Community Preparedness against Sudden Onset Disasters
KebeleName
TODE TEMEDE
DEMEQE
WERABAT SHAMA
BILA WANJA
AMBERCHO GIMBA
ALBEZER ZEMU
SHIDGER
Precaution_1
During water shade
management to
prevent flood
Develop mitigation
mitigation measure
according to the type
of disaster
Report the problem
to higher office
Report the problem
to higher officials
Selling livestock and
save money
Develop a controlling
strategy depend on
type of disaster
Comment_1
In order to prevent
run of water
To minimize the
severity of the
disaster
Precaution_2
Not sending of
animal to distance
area
Selling household
asset
Comment_2
To prevent
transmitted disease
To use the resource
for the period of
disaster
To get additional
support from
external charity
organization
To get support from
different actors
Cash easily managed
and transfer from
place to place
To minimize the
negative impact of
the disaster and its
severity
Develop a
mitigation
measures for the
negative impact
Searching support
from urban family
members
Report the problem
to higher officials
Saving house hold
asset and dump a
stock
In order to
minimize the
severity of the
disaster
In order to save our
selves from the
negative impact of
the disaster
To get technical
and material
support from
external bodies
To get resource at
time of disaster
Precaution_3
Comment_3
Selling of
livestock and
save money in
micro finance
institution
Struggle to
survive as much
as possible
Money is easily
managed and
compare to
other assets it is
less exposed to
disaster.
In order to feet
with the disaster
Using
traditional way
of mitigation
measure
To minimize the
negative impact
of a disaster and
its severity.
167
Page 2 of 3
Wereda Disaster Risk
Profile
Data_Collected_Date
Region S.N.N.P
Zone SILTIE
National Disaster Risk Management
Commission (NDRMC)
Tuesday, July 9, 2019
Wereda HULBAREG
Selected Indicator
KebeleName
Capacity: Community Preparedness against Sudden Onset Disasters
Precaution_1
Comment_1
Precaution_2
Comment_2
Precaution_3
Comment_3
DATE WEZIR 6
BRHAN KITKITA
Discussed the issue at
Keble level and
report to Wereda
To get external
support to minimize
the negative impact
of the disaster
Preparing mitigation
measures depend on
the type of disaster
To minimize its
negative effect
Pray to God and
save house hold
asset for the time
of disaster
To get protection
from Allah and to
get resource at the
period disaster
Report the problem
to higher officials
To get technical as
well as material
and financial
support
Develop a
mitigation
measure
depend on the
type of disaster
To minimize the
severity of the
disaster
168
Page 3 of 3

Wereda Disaster
Risk Profile
Data_Collected_Date
Region S.N.N.P
Zone SILTIE
National Disaster Risk Management
Commission (NDRMC)
Tuesday, July 9, 2019
Wereda HULBAREG
Selected Indicator
Capacity: Community Preparedness against Increase in Disaster Intensity
KebeleName
Precaution_1
Comment_1
Precaution_2
Comment_2
Precaution_3
Comment_3
BOLE
OBISO WACHO
KEBELE 01
ANGAMO YODE
AMOBARACHO
ACHAM
TODE TEMEDE
DEMEQE
Migrate to safe
area
Migrate to urban
areas
Migrate to urban
area
Diversification of
livelihood
Migrate to urban
area
Changing of
agriculture to
wages
Report the
problem to higher
officials
To save our seleves
and family members
from the negative
impact of the
disaster
To save our slves
and seekng for job
To get additional
income generating
work opportunity in
urban area.
To minimize house
hold vulnerability
There is no other
option
Begging for food
and cash
Migration to safe
area
Resetlment
Disaster affects
mostly agricultural
practice due to this
changing income
generating activity
To get external
support from higher
officials
Migrate to urban
area
Pray to God
For the seeking of
servival
In order to get acess
of jobs
Because the same
disaster no appear in
the all area
Urban area create
high job opportunity
for labor
Selling of
animal
To sustain their
lives
To get spritual
support from supper
natural power
Migrate to safe
area
To save our
selves and
family members
169
Page 1 of 2

Wereda Disaster
Risk Profile
Data_Collected_Date
Region S.N.N.P
Zone SILTIE
National Disaster Risk Management
Commission (NDRMC)
Tuesday, July 9, 2019
Wereda HULBAREG
Selected Indicator
Capacity: Community Preparedness against Increase in Disaster Intensity
KebeleName
Precaution_1
Comment_1
Precaution_2
Comment_2
Precaution_3
Comment_3
WERABAT SHAMA
BILA WANJA
AMBERCHO GIMBA
ALBEZER ZEMU
SHIDGER
DATE WEZIR 6
BRHAN KITKITA
Pray to God
Migrate to safe
area
Migrate to safe
area
Report the
problem to wereda
officials
Mitagation to safe
area
Good governance
In order to get
support from the
supper natural
power
To protect our
selves from danger
hazared
To save our selves
and family from the
negative impact of
a disaster
To get technical
and financial
support
To save our selves
and family members
from disaster
negative impact
To minimize the
severity of disaster
Migration to safe
area
Restlement
Report the problem
to reponsible bodies
Develop community
group
Mitigation to safe
area
To safe our selves
from the negative
impact and severity
of the disaster
To get safe area and
protect our selves
To recieve extra
support
To tackle the hazards
To safe ourselves
from the negative
impact of the hazard
170
Page 2 of 2
Wereda Disaster
Risk Profile
Data_Collected_Date
Region S.N.N.P
Zone
SILTIE
Selected Indicator
Capacity: Community Preparedness against Disasters
Kebele Name
Precaution 1
Comment 1
Precaution 2
BOLE
OBISO WACHO
Saving household
asset
Saving un
productive asset to
purchase food
item.
To get resources at a
period of disaster and
minimize the negative
impact of its effect.
Because un productive
assets can replace
easily in resource
available time and to
save human being
from humanitarian
risk.
Reduce
expenditure in
non essential
items
Saving house
hold asset for
future
consumption.
KEBELE 01
ANGAMO YODE
Saving house hold
asset
Preventing
livestock from
communal land
To survive the
negative impact of the
disaster
The last year livestock
disease are created, in
which the camels
come from communal
land for grazing
Vaccination
National Disaster Risk Management
Commission (NDRMC)
Tuesday, July 9, 2019
Wereda HULBAREG
Comment 2
To save money
for risk period to
access essential
items
To save
resources for the
period of
emergency and
protect a house
hold from the
impact of a
disaster.
Precaution 3
Comment 3
Vaccination is
diminished the
severity of the
disease
171
Page 1 of 4
Wereda Disaster
Risk Profile
Data_Collected_Date
Region S.N.N.P
Zone
SILTIE
Selected Indicator
Capacity: Community Preparedness against Disasters
Kebele Name
AMOBARACHO
ACHAM
Precaution 1
Following vaccine
companion
Comment 1
Because the
development agent
and animal health
technicians consult us
to vaccinate our
prevent from disease
out break and other
transmitted disease
from our pest
experience it is also
effective
Precaution 2
To improve
drought
resistant crop
TODE TEMEDE
Storing crops for
consumption other
than selling
If their is stored crop
we can prevent the
vulnerability of the
disaster
Giving
vaccination for
animal
DEMEQE
Reduce daily meal
To save food items for
future disaster
Reducing
expenditure on
non essential
item
National Disaster Risk Management
Commission (NDRMC)
Tuesday, July 9, 2019
Wereda HULBAREG
Comment 2
The agricultural
extension service
makes us aware
of about the
impact of
disease and
drought
resistance crops.
Because the
modern medicine
can not care
animal due to
these the
community
choose cultural
practice
To save money
for the time of
disaster
Precaution 3
Applied the
government rural
development policy
Saving money
Saving of
household asset
Comment 3
Because the rural
development
policy initiatives
all the rural
people through
extension service
and the
components in the
policy also more
effective by
changing the
degraded land in
to productive.
If there is money
on hand we can
prevent any
problem
To minimize the
negative impact of
disaster
172
Page 2 of 4

Wereda Disaster
Risk Profile
Data_Collected_Date
Region S.N.N.P
Zone
SILTIE
Selected Indicator
Capacity: Community Preparedness against Disasters
Kebele Name
Precaution 1
Comment 1
Precaution 2
WERABAT SHAMA
Saving household
assets
Saving for the future
disaster period
Minimize daily
house hold
consumption
BILA WANJA
Vaccinate the
livestock
Vaccination is very
important to protect
animal from disease
attack
Selling house
hold assts
AMBERCHO
GIMBA
Production of
perennial crop
To get food at the
time of drought season
Saving house
hold assets
ALBEZER ZEMU
SHIDGER
Saving house hold
asset
To get resource at the
time of disaster and to
avoid the future
negative effects of
disaster
Reduce the
consumption
rate per day of
the family
National Disaster Risk Management
Commission (NDRMC)
Tuesday, July 9, 2019
Wereda HULBAREG
Comment 2
In order to get a
resource for
future disaster
period
A good stock has
a value to
prevent our
selves from the
negative impact
of the disaster
To get access for
food during the
time of shortage
by saving
unproductive
asset
To manage the
future
availability of
food item and
saving future
food stock
Precaution 3
Collect and dump
animal forage for
the time of disease
Minimize daily
meal
Comment 3
In order to protect
livestock from
forage shortage
To save the period
of disaster
173
Page 3 of 4

Wereda Disaster
Risk Profile
Data_Collected_Date
Region S.N.N.P
Zone
SILTIE
Selected Indicator
Capacity: Community Preparedness against Disasters
Kebele Name
DATE WEZIR 6
Precaution 1
Saving house hold
asset
Comment 1
In order to get
resource at the period
of disaster and
minimize its negative
impact
Precaution 2
Store food items
at house hold
BRHAN KITKITA
Saving house hold
asset
To control losses at
good time prevents us
from the negative
effect of disaster at
risk period
Reduce daily
meat
National Disaster Risk Management
Commission (NDRMC)
Tuesday, July 9, 2019
Wereda HULBAREG
Comment 2
To availed food
at the time of
disaster and
minimizes its
negative impact
To save risk
period
Precaution 3
Reduce daily house
hold consumption
Comment 3
To save food item
for the period of
disaster
Preparing
mitigation
measures
dependent on the
type of disaster
If it is possible
taking negative
measures helps us
to control the
severity of
disaster.
174
Page 4 of 4
Wereda Disaster
Risk Profile
Data_Collected_Date
Region S.N.N.P
Zone
SILTIE
National Disaster Risk Management
Commission (NDRMC)
Tuesday, July 9, 2019
Wereda HULBAREG
Selected Indicator
Kebele Name
Hazard: Coping and recovering during last Disaster
ALBEZER ZEMU SHIDGER
Type of Disaster(s)
Coping_Strategy
Livestock disease
Showering the infected one with cold water using Lemon and traditional medicine, vaccinate and treat the infected
Description
Recovery_Strategy
Vaccination before infection is more effective than other measures, shower the infected one is moderately effective and treating
the infected one is less effective.
Description
Community
Participation_Ways
Description
Helping each other through cash contribution and support each other through labor and plough land of the affected person.
Due to high prevalence rate of the disease out break which affects the majority of community member the measure taken by
the community is stack and it can be less effective.
Kebele Name
Type of Disaster(s)
Coping_Strategy
Description
Recovery_Strategy
AMBERCHO GIMBA
Livestock disease
Vaccinate the health one, treat the infected one and shower the infected one using cold water and traditional medicine
Vaccination is more or less effective than treatment but slower the infected one with cold water is more effective to treat the
infected one.
Description
Community
Participation_Ways
Description
Support each other by contributing labor and plough land and contributing crop for the affected community member
Contributing labor as well as crop is more effective at the begging of the incident but when the prevalence rate increases the
supportive mechanism become diminished and it becomes less effective.
175
Page 1 of 7

Wereda Disaster
Risk Profile
Data_Collected_Date
Region S.N.N.P
Zone
SILTIE
Selected Indicator
Kebele Name
Hazard: Coping and recovering during last Disaster
AMOBARACHO ACHAM
Type of Disaster(s)
Coping_Strategy
Livestock disease
Using traditional medicine, vaccination and Treat the infected one
Description
The treatment is more effective than the other measures
Recovery_Strategy
They do not take any measure
National Disaster Risk Management
Commission (NDRMC)
Tuesday, July 9, 2019
Wereda HULBAREG
Description
Community
Participation_Ways
Description
At the result to take any recovery measure after the incident they are not recover from the negative impact of the incident
Social interaction
The social interaction which makes them help each other is very well and due to lack of resource the effectiveness of the
measure are less.
Kebele Name
Type of Disaster(s)
Coping_Strategy
Description
Recovery_Strategy
ANGAMO YODE
Drought, livestock disease and crop disease
To participate other income generating activities
To develop saving culture
Selling of livestock and migrate to safe area
Description
Community
Participation_Ways
Description
To improve livelihood diversification
By collecting money and giving to the vulnerable group
176
Page 2 of 7

Wereda Disaster
Risk Profile
Data_Collected_Date
Region S.N.N.P
Zone
SILTIE
National Disaster Risk Management
Commission (NDRMC)
Tuesday, July 9, 2019
Wereda HULBAREG
Selected Indicator
Kebele Name
Hazard: Coping and recovering during last Disaster
BILA WANJA
Type of Disaster(s)
Coping_Strategy
Description
Livestock disease
shower the the infected one in river at the morning with cold water and vaccinate the health one and treatment for the infected
one.
The shower with cold water is more effective then treatment and vaccination is more effective when it applied before infection
Recovery_Strategy
They take no measures
Description
Community
Participation_Ways
Description
Support each other through cash contribution for restock
Due to the high prevalence of the disease the collaboration decline time to time
Kebele Name
Type of Disaster(s)
Coping_Strategy
Description
Recovery_Strategy
Description
Community
Participation_Ways
Description
BOLE
Livestock diseases
Treatment and vaccination
Vaccination before infection is better from treatment but shower the infected one is more effective than treatment.
Selling house hold assets for livestock purchase, Selling crop products for livestock purchase.
No recovery
Support each other during and after the incident by locally stated by low through each contribution and free labor.
The supportive measures are not effective to recover the missing stock and due to high prevalence rate of the disease and the
supportive culture becomes diminished through time.
177
Page 3 of 7

Wereda Disaster
Risk Profile
Data_Collected_Date
Region S.N.N.P
Zone
SILTIE
National Disaster Risk Management
Commission (NDRMC)
Tuesday, July 9, 2019
Wereda HULBAREG
Selected Indicator
Kebele Name
Hazard: Coping and recovering during last Disaster
BRHAN KITKITA
Type of Disaster(s)
Coping_Strategy
Livestock disease
Vaccinate the health one, treat the infected one and shower the infected one with cold water
Description
Recovery_Strategy
Shower the infected one with cold water is more effective in treat but vaccination before infection is more effective than
treatment.
Description
Community
Participation_Ways
Description
Helping each other through cash contribution and helping each other through animal power and labor contribution
Due to high prevalence of the disease that affects the whole community the present status of support each other become
diminished.
Kebele Name
Type of Disaster(s)
Coping_Strategy
Description
Recovery_Strategy
DATE WEZIR 6
Livestock disease
Vaccinate the health one, treat the infected one and shower the infected one by cold water with traditional medicine and soap
Vaccinate the healthy one is more effective than treatment but shower the infected one is more effective to treat them
Description
Community
Participation_Ways
Description
By contributing cash for the disaster vulnerable group
It is not effective
178
Page 4 of 7
Wereda Disaster
Risk Profile
Data_Collected_Date
Region S.N.N.P
Zone
SILTIE
National Disaster Risk Management
Commission (NDRMC)
Tuesday, July 9, 2019
Wereda HULBAREG
Selected Indicator
Kebele Name
Hazard: Coping and recovering during last Disaster
DEMEQE
Type of Disaster(s)
Coping_Strategy
Livestock disease
Vaccinate the healthy one, treating the infected one and shower the infected one
Description
Showering the infected one with cold water and traditional medicine is more effective than treatment.
Recovery_Strategy
No measures are taken
Description
Community
Participation_Ways
Description
Kebele Name
Type of Disaster(s)
Coping_Strategy
Description
Recovery_Strategy
No recovery
By contribution cash the community restock the affected household and help each other locally what we call it Ritban.
At the beginning of disaster outbreak the collaboration and contributing cash for the affected household to restock their
livestock is strong , but through time due to high prevalence rate of the disease outbreak the supportive strategy becomes
diminished.
KEBELE 01
Livestock disease out break
Vaccination and treat the infected one
The vaccination is more or less effective but the treatment is not as much fruit full and the out break covers a large area and the
supportive mechanism be blocked.
No measure is taken
Description
Community
Participation_Ways
Description
By helping each other through plough the land of the affected house hold.
It is more or less effective depend on the capacity of the community and the security of the problem, but currency high
prevalence rate of the disaster the social interaction and supportive culture become diminished.
179
Page 5 of 7

Wereda Disaster
Risk Profile
Data_Collected_Date
Region S.N.N.P
Zone
SILTIE
National Disaster Risk Management
Commission (NDRMC)
Tuesday, July 9, 2019
Wereda HULBAREG
Selected Indicator
Kebele Name
Hazard: Coping and recovering during last Disaster
OBISO WACHO
Type of Disaster(s)
Coping_Strategy
Livestock disease
Vaccination, shower the infected one with cold water and treat the infected
Description
Recovery_Strategy
Shower the infected one with cold water is more effective to treat infected one, but vaccination before infection is more
effective for the healthy one.
No measure at all
Description
Community
Participation_Ways
Description
Support each other through cash contribution and labor contribution
Due to high prevalence rate of the disease the social interaction and collaboration becomes diminished.
Kebele Name
Type of Disaster(s)
Coping_Strategy
Description
Recovery_Strategy
Description
Community
Participation_Ways
Description
TODE TEMEDE
Animal disease, drought and soil erosion
Vaccination and giving cultural medicine
The effectiveness of these measure are very low due to high number of animal loss
Using coping mechanism to minimize the vulnerability
The activity taken are effective, so we can possible to minimize the vulnerability
By improving cooperation system
Due to cooperation vulnerable group can be minimize
180
Page 6 of 7
Wereda Disaster
Risk Profile
Data_Collected_Date
Region S.N.N.P
Zone
SILTIE
National Disaster Risk Management
Commission (NDRMC)
Tuesday, July 9, 2019
Wereda HULBAREG
Selected Indicator
Kebele Name
Hazard: Coping and recovering during last Disaster
WERABAT SHAMA
Type of Disaster(s)
Coping_Strategy
Description
Recovery_Strategy
Live stock disease
Vaccinate the healthy one, treatment for the infected one and shower the infected one using cold water and traditional
medicine
Shower the infected one with cold water is more effective than the treatment of infected one and vaccinate before infection is
also effective to prevent the prevalence.
Description
Community
Participation_Ways
Description
They have high social interaction
Currently the supportive mechanism become diminished that the out break covers a large area and it attacks a number of animal
at community level.
181
Page 7 of 7
Data_Collected_Date
Region S.N.N.P
Zone SILTIE
Selected Indicator
Capacity: Type Community Participation
Kebele Name
Levels_Comm_Participation
BOLE
OBISO WACHO
High level of cooperation and participation
High level of cooperation and participation
KEBELE 01
ANGAMO YODE
AMOBARACHO
ACHAM
TODE TEMEDE
DEMEQE
WERABAT SHAMA
High social interaction and trust
High level of cooperation and participation
Their is cooperation and participation
High level of cooperative and participation
High level of cooperation and participation
BILA WANJA
High cooperation and participation
AMBERCHO GIMBA
ALBEZER ZEMU
SHIDGER
DATE WEZIR 6
BRHAN KITKITA
Medium level of participation and cooperation
High cooperation and participation
High level of cooperation and participation
High cooperation and participation
Tuesday, July 9, 2019
Wereda HULBAREG
Changes_In_Last_Decade
Increase
Increased
Increase
Decreased
Cooperation be come decreasing
Increase
Increase
Increase
Increase
Increase
Increase
Increase
182
Page 1 of 1
Data_Collected_Date
Region S.N.N.P
Zone SILTIE
Wereda HULBAREG
Tuesday, July 9, 2019
Selected Indicator
Capacity: Recovery from Losses from Disasters - Percentage of Households who
have managed to recover from losses of disasters
Percentage of households who have managed to recover from losses of disasters
Comments
50.63 %
183
Page 1 of 1
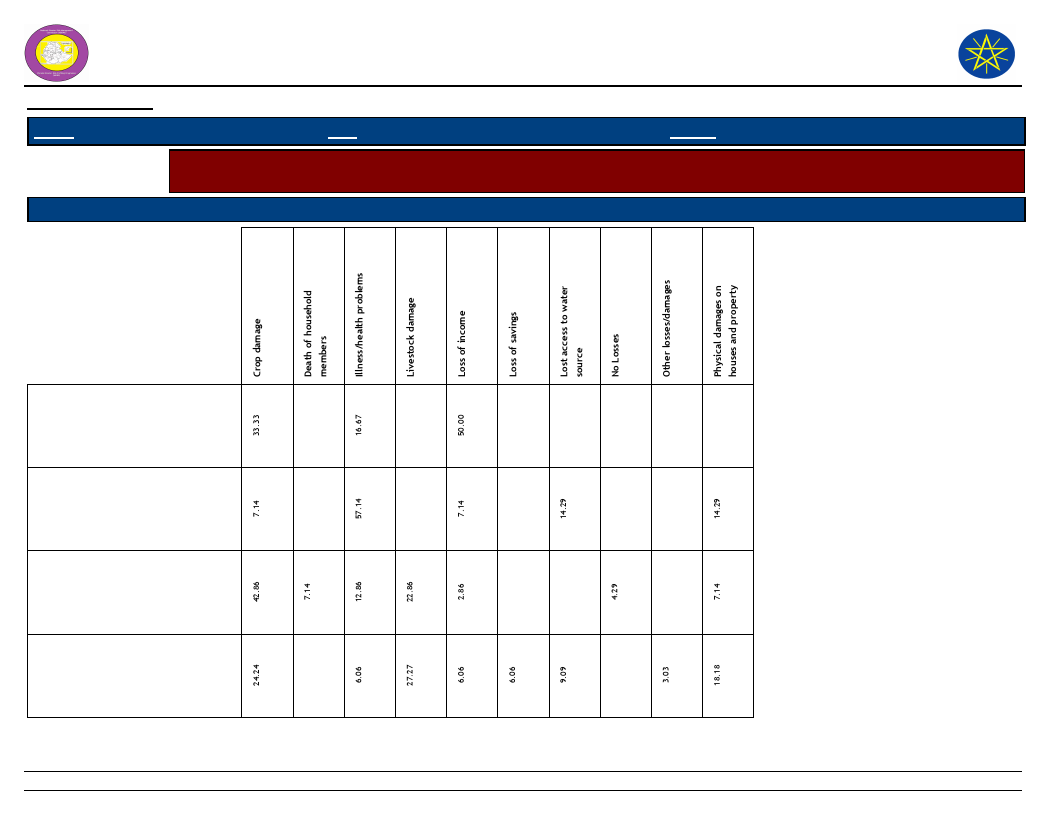
Wereda Disaster
Risk Profile
National Disaster Risk Management
Commission (NDRMC)
Data_Collected_Date
Region S.N.N.P
Zone SILTIE
Wereda HULBAREG
Tuesday, July 9, 2019
Selected Indicator
Capacity: Coping Strategies Adopted by Households - Main coping strategies adopted by households to recover
from respective losses
Type of Coping Strategy Adopted
Type of Loss
Begging for money or for food
Borrowing of food or cash
(including purchasing food on
credit)
Consumption rather than sale
of crop surplus
Increased working hours
184
Page 1 of 5

Wereda Disaster
Risk Profile
National Disaster Risk Management
Commission (NDRMC)
Data_Collected_Date
Region S.N.N.P
Zone SILTIE
Wereda HULBAREG
Tuesday, July 9, 2019
Selected Indicator
Capacity: Coping Strategies Adopted by Households - Main coping strategies adopted by households to recover
from respective losses
Type of Coping Strategy Adopted
Type of Loss
Limit portion size at meals
Long-term / permanent
migration (including distress
migration of whole families)
Others -
Reduce number of meals eaten
in a day
185
Page 2 of 5

Wereda Disaster
Risk Profile
National Disaster Risk Management
Commission (NDRMC)
Data_Collected_Date
Region S.N.N.P
Zone SILTIE
Wereda HULBAREG
Tuesday, July 9, 2019
Selected Indicator
Capacity: Coping Strategies Adopted by Households - Main coping strategies adopted by households to recover
from respective losses
Type of Coping Strategy Adopted
Type of Loss
Reduced expenditure on health
and education (including taking
children out of school)
Reduced expenditure on
non-essential items (beer,
cigarettes, clothes, meat, etc.)
Reduced expenditure on
productive inputs (fertilizer,
seeds, livestock drugs, etc.)
Rely on less preferred and less
expensive food
186
Page 3 of 5

Wereda Disaster
Risk Profile
National Disaster Risk Management
Commission (NDRMC)
Data_Collected_Date
Region S.N.N.P
Zone SILTIE
Wereda HULBAREG
Tuesday, July 9, 2019
Selected Indicator
Capacity: Coping Strategies Adopted by Households - Main coping strategies adopted by households to recover
from respective losses
Type of Coping Strategy Adopted
Type of Loss
Sale of non-productive assets
(Jewelry, clothing, etc.)
Sale of productive assets (land,
farm implements, vehicle, etc.)
Seek alternative or additional
jobs
Sell more livestock than usual
187
Page 4 of 5
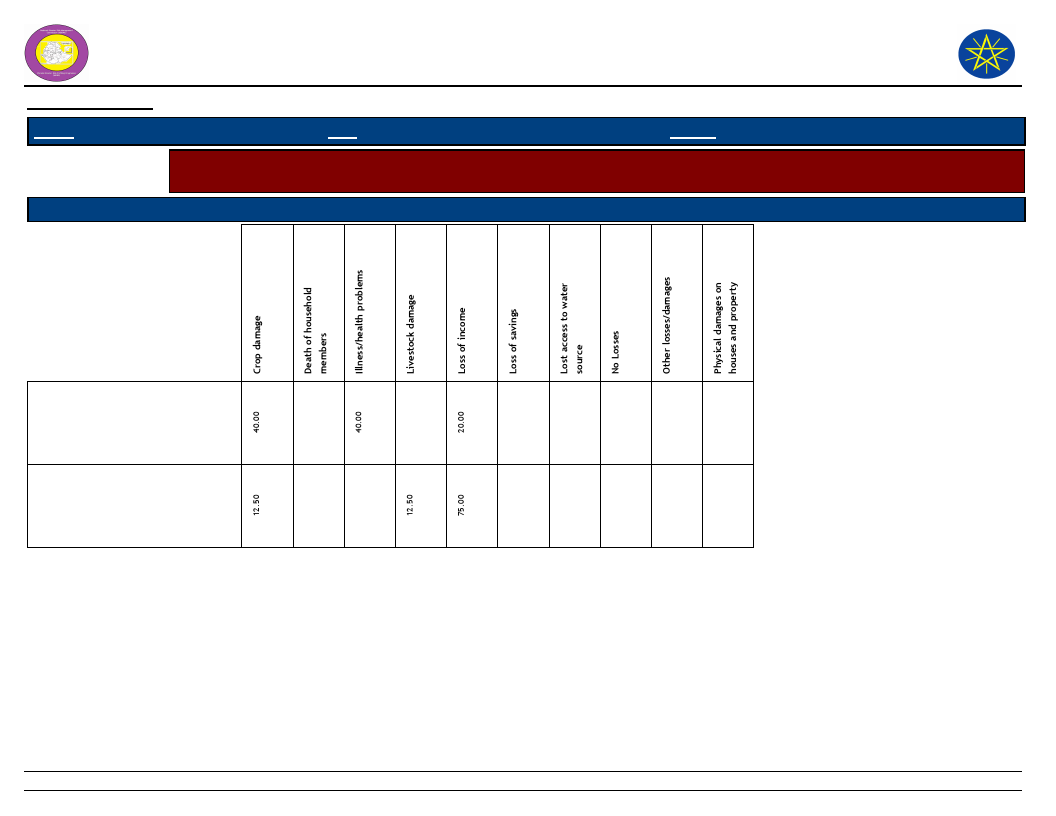
Wereda Disaster
Risk Profile
National Disaster Risk Management
Commission (NDRMC)
Data_Collected_Date
Region S.N.N.P
Zone SILTIE
Wereda HULBAREG
Tuesday, July 9, 2019
Selected Indicator
Capacity: Coping Strategies Adopted by Households - Main coping strategies adopted by households to recover
from respective losses
Type of Coping Strategy Adopted
Type of Loss
Sending children of household
for work
Short-term / seasonal labor
migration
188
Page 5 of 5
Data_Collected_Date
Tuesday, July 9, 2019
Region S.N.N.P
Zone SILTIE
Wereda HULBAREG
Selected Indicator
Capacity: Coping Strategies Adopted by Households - Percentage of households
by frequency of main coping strategies adopted
Type of Coping Strategy Adopted
Frequency of Adoption
Begging for money or for food
Borrowing of food or cash (including purchasing
food on credit)
Consumption rather than sale of crop surplus
Increased working hours
Limit portion size at meals
Long-term / permanent migration (including
distress migration of whole families)
Others -
Reduce number of meals eaten in a day
Reduced expenditure on health and education
(including taking children out of school)
Reduced expenditure on non-essential items
(beer, cigarettes, clothes, meat, etc.)
Reduced expenditure on productive inputs
(fertilizer, seeds, livestock drugs, etc.)
Rely on less preferred and less expensive food
12.50
6.25
27.27
4.55
12.12
6.06
15.38
30.77
100.00
8.49
3.77
64.71
25.00
9.09
100.00
56.25
50.00
66.67
100.00
100.00
23.08
100.00
18.18
6.06
30.77
8.49
23.53
63.21
50.00
11.76
16.04
50.00
189
Page 1 of 2
Data_Collected_Date
Tuesday, July 9, 2019
Region S.N.N.P
Zone SILTIE
Wereda HULBAREG
Selected Indicator
Capacity: Coping Strategies Adopted by Households - Percentage of households
by frequency of main coping strategies adopted
Type of Coping Strategy Adopted
Frequency of Adoption
Sale of non-productive assets (Jewelry, clothing,
etc.)
Sale of productive assets (land, farm implements,
vehicle, etc.)
Seek alternative or additional jobs
Sell more livestock than usual
Sending children of household for work
Short-term / seasonal labor migration
12.77
15.79
40.00
12.50
36.17
5.26
40.00
4.26
62.50
100.00
40.00
40.43
68.42
20.00
60.00
6.38
10.53
25.00
190
Page 2 of 2

Wereda Disaster
Risk Profile
Data_Collected_Date
National Disaster Risk Management
Commission (NDRMC)
Tuesday, July 9, 2019
Region S.N.N.P
Zone SILTIE
Wereda HULBAREG
Selected Indicator
Kebele Name
BOLE
OBISO WACHO
KEBELE 01
ANGAMO YODE
AMOBARACHO
ACHAM
TODE TEMEDE
Capacity: Alternative Livelihood Sources - Alternative livelihood sources suggested by the community
Work_Option_1
Comment_1
Work_Option_2
Comment_2
Work_Option_3
Selling labor work
at urban area
Because we can get
labor work at urban
area that it can not
read skill.
Report the
problem to higher
officials.
Searching of labor
work in urban
area and Saving
house hold asset
Migrate to urban
area
Searching of labor
work
Collect fire wood
and selling
To aware the
government
representatives about
the problem and to
get income options.
Their is an option to
get labor work in near
by zonal capital
To get access of job
opportunity
Because we have no
other option to get
income and labor
work is available at
urban area.
Accessibility of wood
in our area
Selling credit to
establishing
other income
generating
activity.
Seek alternative
or additional jobs
in urban areas.
To diversity our income
source and extend our
options for work /
getting income /
To diversify the income
sources that we get in
urban areas.
Saving house hold
asset
Saving is essential for
the time of risk period
Employing in
urban area
Their is high opportunity
of job in urban area
Petty trade
Comment_3
They can be
improve their
income in
small capital
191
Page 1 of 3
Wereda Disaster
Risk Profile
Data_Collected_Date
National Disaster Risk Management
Commission (NDRMC)
Tuesday, July 9, 2019
Region S.N.N.P
Zone SILTIE
Wereda HULBAREG
Selected Indicator
Kebele Name
DEMEQE
WERABAT SHAMA
BILA WANJA
AMBERCHO GIMBA
ALBEZER ZEMU
SHIDGER
DATE WEZIR 6
Capacity: Alternative Livelihood Sources - Alternative livelihood sources suggested by the community
Work_Option_1
Comment_1
Work_Option_2
Comment_2
Work_Option_3
Seeking support
from family
member out side
the resident
Seeking
alternative
income generating
activity
Searching of labor
worker
Seeking
alternative job at
Keble as well as
urban area
To get support and
recover from the
problem
To diversify our
income source
Because their is labor
work option at urban
area
To get income and
safe our selves from
the negative impact
Searching of labor
work
Seeking
alternative
income generating
activities
Because we can get
labor work at urban
area near zonal
capital
If the first income
source diminished we
must to seek other
alternative income
source for survive
Seeking credit
from financial
institution
Seeking labor
work at urban
area
To run alternative job
for getting income
To get additional
income in urban area
Seeking labor
work in urban
area
Became we have access
to labor work at urban
places near by wereda
center as well as the
near by town Achamo.
Seeks daily labor
in urban area
There is an opportunity
to get labor work in
urban area
Comment_3
192
Page 2 of 3
Wereda Disaster
Risk Profile
Data_Collected_Date
National Disaster Risk Management
Commission (NDRMC)
Tuesday, July 9, 2019
Region S.N.N.P
Zone SILTIE
Wereda HULBAREG
Selected Indicator
Kebele Name
BRHAN KITKITA
Capacity: Alternative Livelihood Sources - Alternative livelihood sources suggested by the community
Work_Option_1
Comment_1
Work_Option_2
Comment_2
Work_Option_3
Seeking daily
labor work
Because we have got
a chance to get labor
in urban area
Seeking labor for
other job
opportunity
To establish income
generating activity to
compromise the loss.
Comment_3
193
Page 3 of 3

Data_Collected_Date
Region S.N.N.P
Zone SILTIE
Wereda HULBAREG
Tuesday, July 9, 2019
Selected Indicator
Type of Disaster
Capacity: Recovery from Losses from Disasters - Percentage of households
recovered from past disasters by type of Disasters
Recovered Percentage
Drought
16.08
Flood
8.54
Crop diseases
27.64
Livestock diseases
27.64
Human diseases
12.06
Storms / hail storm
3.02
Heavy Rain
0.50
Frost / Cold waves
0.50
Conflicts
4.02
194
Page 1 of 1
Data_Collected_Date
Region S.N.N.P
Zone SILTIE
Wereda HULBAREG
Selected Indicator:
Capacity: Recovery from Losses from Disasters - Proportion of households
recovered by type of Losses
Tuesday, July 9, 2019
Type of Loss
Percentage
Physical damages on houses and property
10.61
Crop damage
39.90
Livestock damage
20.20
Death of household members
2.53
Illness/health problems
12.12
Loss of income
5.56
Other losses/damages
3.03
No Losses
6.06
195
Page 1 of 1

Data_Collected_Date
Region S.N.N.P
Zone SILTIE
Tuesday, July 9, 2019
Wereda HULBAREG
Selected Indicator
Capacity: Coping Options if More Resources Available - What coping strategy
could be adopted if more resource were available?
Coping Strategy To Be Adopted
Response (%)
Adaptation of economic activities to hazards season (e.g. cropping cycle, short term
crops, etc.)
Storage of food and other necessities
32.53
40.52
Physical protection of buildings and property
17.17
Changing residence area/migration
3.59
Others (specify)
3.59
None
2.59
196
Page 1 of 1

Data_Collected_Date
Tuesday, July 9, 2019
Region S.N.N.P
Selected Indictor:
Zone SILTIE
Wereda HULBAREG
Capacity: Coping Strategies Adopted by Households - Percentage of households by
major type of coping strategies adopted (at least once)
Coping Strategy Adopted
Main Strategy
Secondary Strategy
Reduced expenditure on non-essential items (beer, cigarettes,
clothes, meat, etc.)
Consumption rather than sale of crop surplus
26.57
8.65
17.39
3.85
Sell more livestock than usual
13.77
5.77
Borrowing of food or cash (including purchasing food on credit)
3.86
4.81
Sale of non-productive assets (Jewelry, clothing, etc.)
0.72
0.96
Sale of productive assets (land, farm implements, vehicle, etc.)
1.21
4.81
Sending children of household for work
2.42
1.92
Reduced expenditure on health and education (including taking
children out of school)
Reduced expenditure on productive inputs (fertilizer, seeds,
livestock drugs, etc.)
Short-term / seasonal labor migration
0.97
40.38
0.97
9.62
1.93
14.42
Long-term / permanent migration (including distress migration of
whole families)
Increased working hours
0.48
1.92
7.97
0.96
Seek alternative or additional jobs
11.35
1.92
Rely on less preferred and less expensive food
4.11
Limit portion size at meals
1.21
197
Page 1 of 2
Data_Collected_Date
Tuesday, July 9, 2019
Region S.N.N.P
Selected Indictor:
Zone SILTIE
Wereda HULBAREG
Capacity: Coping Strategies Adopted by Households - Percentage of households by
major type of coping strategies adopted (at least once)
Coping Strategy Adopted
Main Strategy
Secondary Strategy
Begging for money or for food
1.45
Reduce number of meals eaten in a day
0.48
Others -
3.14
198
Page 2 of 2

Wereda Disaster
Risk Profile
National Disaster Risk Management
Commission (NDRMC)
Data_Collected_Date
Region S.N.N.P
Zone SILTIE
Wereda HULBAREG
Selected Indicator
Capacity: Coping Strategies Adopted by Households - Main coping strategies adopted by households for respective
disasters
Coping Strtegies Adopted
Types of disaters for which HHs in the community adopt the listed
Coping Strtegies
Tuesday, July 9, 2019
Begging for money or for
food
Borrowing of food or cash
(including purchasing food
on credit)
Consumption rather than
sale of crop surplus
199
Page 1 of 6
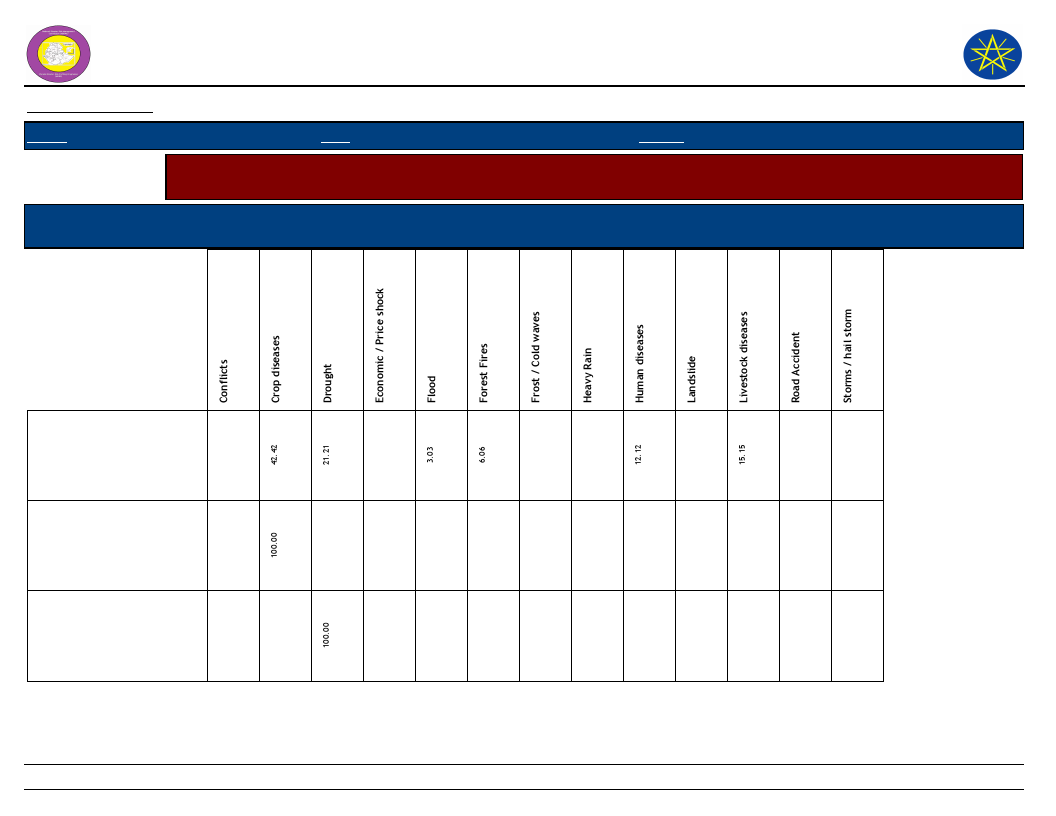
Wereda Disaster
Risk Profile
National Disaster Risk Management
Commission (NDRMC)
Data_Collected_Date
Region S.N.N.P
Zone SILTIE
Wereda HULBAREG
Selected Indicator
Capacity: Coping Strategies Adopted by Households - Main coping strategies adopted by households for respective
disasters
Coping Strtegies Adopted
Types of disaters for which HHs in the community adopt the listed
Coping Strtegies
Tuesday, July 9, 2019
Increased working hours
Limit portion size at meals
Long-term / permanent
migration (including
distress migration of
whole families)
200
Page 2 of 6

Wereda Disaster
Risk Profile
National Disaster Risk Management
Commission (NDRMC)
Data_Collected_Date
Region S.N.N.P
Zone SILTIE
Wereda HULBAREG
Selected Indicator
Capacity: Coping Strategies Adopted by Households - Main coping strategies adopted by households for respective
disasters
Coping Strtegies Adopted
Types of disaters for which HHs in the community adopt the listed
Coping Strtegies
Tuesday, July 9, 2019
Others -
Reduce number of meals
eaten in a day
Reduced expenditure on
health and education
(including taking children
out of school)
201
Page 3 of 6

Wereda Disaster
Risk Profile
National Disaster Risk Management
Commission (NDRMC)
Data_Collected_Date
Region S.N.N.P
Zone SILTIE
Wereda HULBAREG
Selected Indicator
Capacity: Coping Strategies Adopted by Households - Main coping strategies adopted by households for respective
disasters
Coping Strtegies Adopted
Types of disaters for which HHs in the community adopt the listed
Coping Strtegies
Tuesday, July 9, 2019
Reduced expenditure on
non-essential items (beer,
cigarettes, clothes, meat,
etc.)
Reduced expenditure on
productive inputs
(fertilizer, seeds,
livestock drugs, etc.)
Rely on less preferred and
less expensive food
202
Page 4 of 6
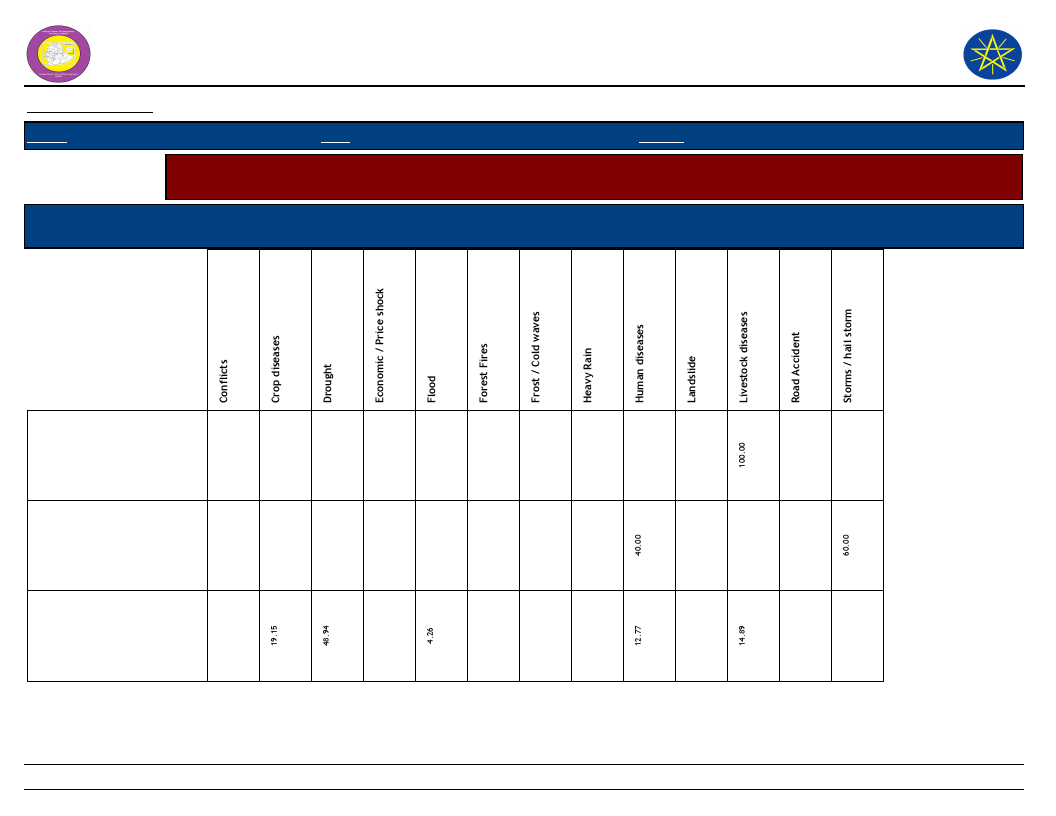
Wereda Disaster
Risk Profile
National Disaster Risk Management
Commission (NDRMC)
Data_Collected_Date
Region S.N.N.P
Zone SILTIE
Wereda HULBAREG
Selected Indicator
Capacity: Coping Strategies Adopted by Households - Main coping strategies adopted by households for respective
disasters
Coping Strtegies Adopted
Types of disaters for which HHs in the community adopt the listed
Coping Strtegies
Tuesday, July 9, 2019
Sale of non-productive
assets (Jewelry, clothing,
etc.)
Sale of productive assets
(land, farm implements,
vehicle, etc.)
Seek alternative or
additional jobs
203
Page 5 of 6
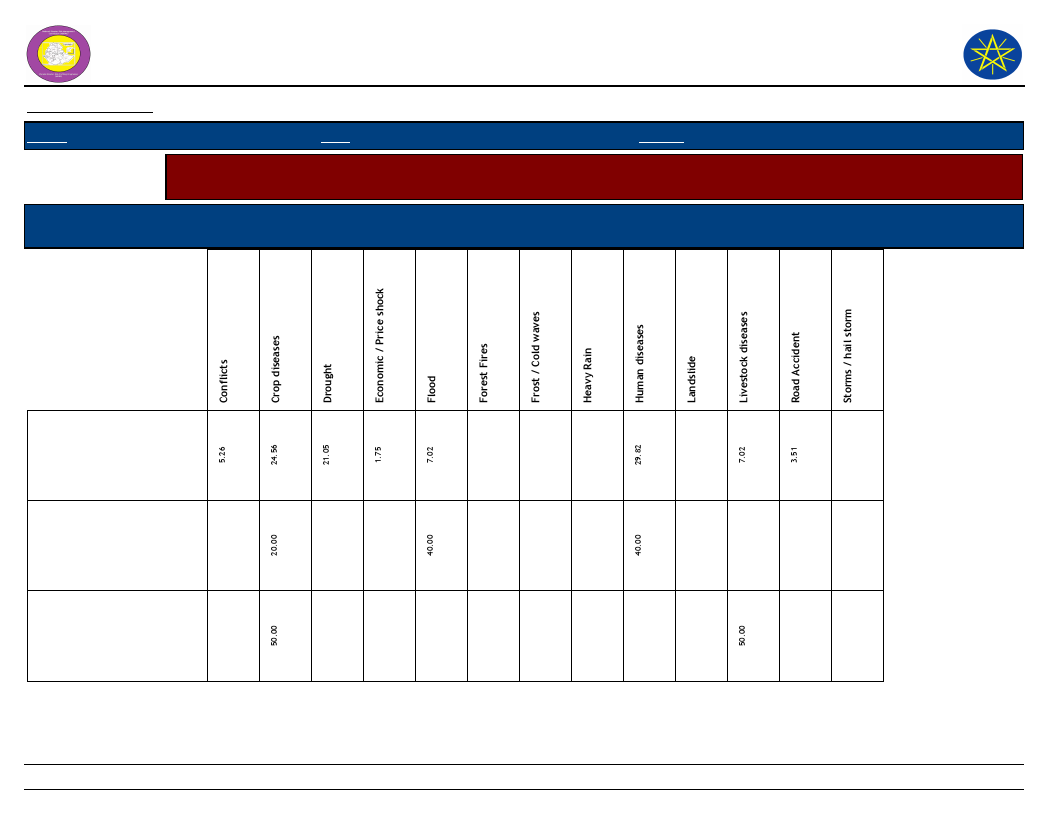
Wereda Disaster
Risk Profile
National Disaster Risk Management
Commission (NDRMC)
Data_Collected_Date
Region S.N.N.P
Zone SILTIE
Wereda HULBAREG
Selected Indicator
Capacity: Coping Strategies Adopted by Households - Main coping strategies adopted by households for respective
disasters
Coping Strtegies Adopted
Types of disaters for which HHs in the community adopt the listed
Coping Strtegies
Tuesday, July 9, 2019
Sell more livestock than
usual
Sending children of
household for work
Short-term / seasonal
labor migration
204
Page 6 of 6
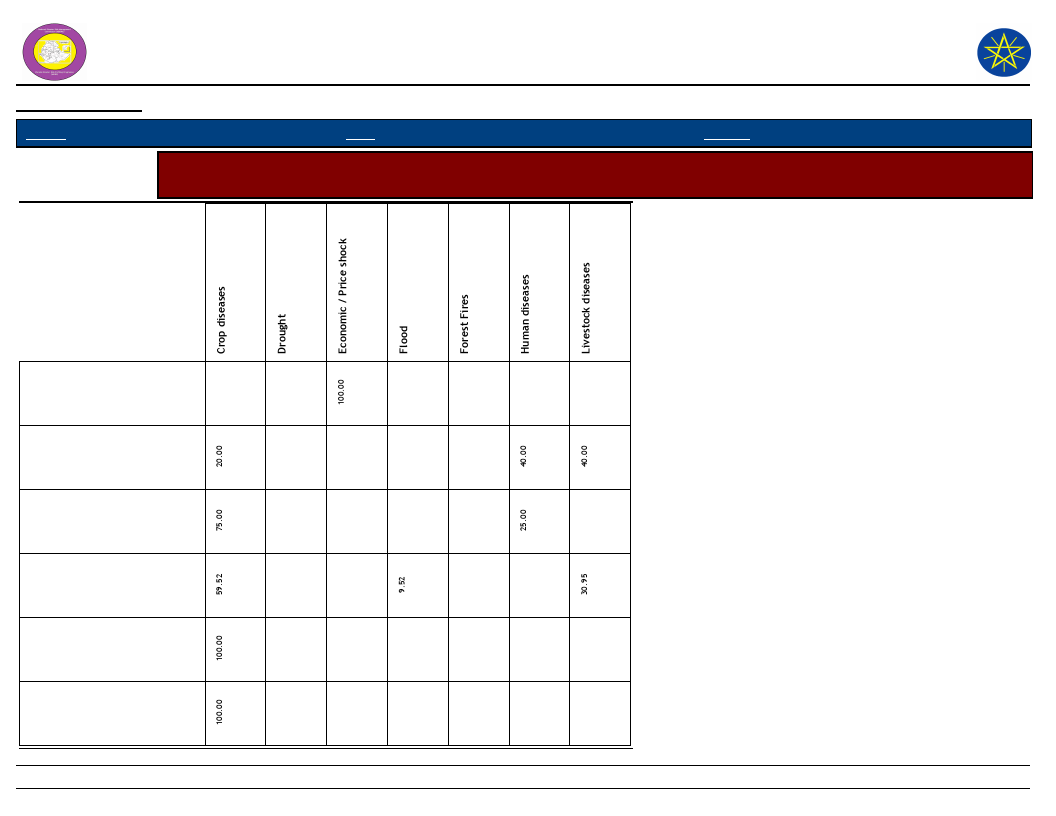
Wereda Disaster Risk
Profile
National Disaster Risk Management
Commission (NDRMC)
Data_Collected_Date
Region S.N.N.P
Zone
SILTIE
Wereda HULBAREG
Tuesday, July 9, 2019
Selected Indicator
Capacity: Coping Strategies Adopted by Households - Secondary coping strategies adopted by households for
respective disasters
Begging for money or for
food
Borrowing of food or cash
(including purchasing food
on credit)
Consumption rather than
sale of crop surplus
Increased working hours
Limit portion size at meals
Reduce number of meals
eaten in a day
205
Page 1 of 3

Wereda Disaster Risk
Profile
National Disaster Risk Management
Commission (NDRMC)
Data_Collected_Date
Region S.N.N.P
Zone
SILTIE
Wereda HULBAREG
Tuesday, July 9, 2019
Selected Indicator
Capacity: Coping Strategies Adopted by Households - Secondary coping strategies adopted by households for
respective disasters
Reduced expenditure on
health and education
(including taking children
Reduced expenditure on
non-essential items (beer,
cigarettes, clothes, meat,
Rely on less preferred and
less expensive food
Sale of productive assets
(land, farm implements,
vehicle, etc.)
Seek alternative or
additional jobs
Sell more livestock than
usual
206
Page 2 of 3

Wereda Disaster Risk
Profile
National Disaster Risk Management
Commission (NDRMC)
Data_Collected_Date
Region S.N.N.P
Zone
SILTIE
Wereda HULBAREG
Tuesday, July 9, 2019
Selected Indicator
Capacity: Coping Strategies Adopted by Households - Secondary coping strategies adopted by households for
respective disasters
Sending children of
household for work
207
Page 3 of 3
WDRP Indicators
Community
Perceptions and Suggestions
208
Wereda Disaster
Risk Profile
Data_Collected_Date
National Disaster Risk Management
Commission (NDRMC)
Tuesday, July 9, 2019
Region S.N.N.P
Zone
SILTIE
Wereda HULBAREG
Selected Indicator
Kebele Name
Interventions: Community Perception on Mediums to Influence DRM Actors - Community perception on the
effectiveness of institutional channels to use to influence DRM actors
Institution_1
Process_Description
Institution_2 Process_Description
Institution_3
Process_Description
BOLE
OBISO WACHO
KEBELE 01
ANGAMO YODE
Community leader
Community
leaders
First the community
were discussed on
report to community
leader and leader
evaluated and
combine the issue
and report to Keble
combine members.
THE community
discussed on the
issue that happen
and report to Keble
chair man.
Report the
problem to
community leader
Community leader
First the community
is discussed on the
problem at Keble
/gote/ level and
report to community
leader.
To discussed the
community and
selecting the
problem to report
the leaders
Keble combine
member
Keble combine
members evaluate
and combine the
issues and report to
wereda.
Wereda
administration
Wereda administration
evaluates the issues of
the community and find
a solution.
Keble chair
man
Report the
problem to
Keble leaders
The Keble chair man
evaluate the issues of
the community and
discussed with Keble
food security
member.
The community
leader combined the
problem and report to
the Keble leader.
Development
agent
Report the
problem to
development
agent
The development agent
combine the issues of
the community and
report to wereda
officials
The Keble leaders
discussed on the issue
and consult the
development agent.
Keble leader
By meeting on the
Keble and selecting
the problem to report
to the Keble leader
209
Page 1 of 6

Wereda Disaster
Risk Profile
Data_Collected_Date
National Disaster Risk Management
Commission (NDRMC)
Tuesday, July 9, 2019
Region S.N.N.P
Zone
SILTIE
Wereda HULBAREG
Selected Indicator
Kebele Name
Interventions: Community Perception on Mediums to Influence DRM Actors - Community perception on the
effectiveness of institutional channels to use to influence DRM actors
Institution_1
Process_Description
Institution_2 Process_Description
Institution_3
Process_Description
AMOBARACHO
ACHAM
TODE TEMEDE
Community
leaders
Community leaders
are discussed on the
issue and report to
Keble leaders
Community leader
By discussing in
community the
result of discussion
transfer to Keble of
wereda by
community leaders
Keble
representative
Gote leader
Keble leaders are
discussed on the issue
in depth and find the
solution at Keble
level and if the issue
is beyond the
capacity of the Keble
they report to the
wereda by the
channel of
development agent.
If the problem are not
improved by
community leader the
selected problem
report to Gote
leaders
Keble
development
agent
Keble leader
The Keble development
agent combined the
issue of the community
and report to the
Wereda agricultural
and natural resource
development office.
By using different
meeting the problem
that face the
community transferred
to Keble leaders.
210
Page 2 of 6
Wereda Disaster
Risk Profile
Data_Collected_Date
National Disaster Risk Management
Commission (NDRMC)
Tuesday, July 9, 2019
Region S.N.N.P
Zone
SILTIE
Wereda HULBAREG
Selected Indicator
Interventions: Community Perception on Mediums to Influence DRM Actors - Community perception on the
effectiveness of institutional channels to use to influence DRM actors
Kebele Name
DEMEQE
WERABAT SHAMA
Institution_1
Community leader
Process_Description
The community
discussed on the
issue and report to
the community
leaders
Community
leaders
The community
discussed on issue
that happened and
report to community
leader and he/she
combine the issue
and report to Keble
chair man.
Institution_2
Keble cabinet
Process_Description
The community
leaders combine the
issue of the
community and report
to Keble cabinet
members.
Keble chair
man
Keble chair man
evaluate the issue of
the community with
his members and if
the issue is solve at
Keble level he/she
tries to solve and if it
is beyond the
capacity of the Keble
he/she report to
wereda through his
channel.
Institution_3
Wereda Keble
representative
cabin member
and
development
agent
Keble
development
agent
Process_Description
The Keble cabin
members discussed the
issue of the community
and combined and
report the wereda
administration and line
sector by development
agent and wereda cabin
member of Keble
representative.
Keble development
agent combine the
issue raised by the
Keble that is evaluated
by Keble administrative
members and report to
wereda line sector.
211
Page 3 of 6

Wereda Disaster
Risk Profile
Data_Collected_Date
National Disaster Risk Management
Commission (NDRMC)
Tuesday, July 9, 2019
Region S.N.N.P
Zone
SILTIE
Wereda HULBAREG
Selected Indicator
Interventions: Community Perception on Mediums to Influence DRM Actors - Community perception on the
effectiveness of institutional channels to use to influence DRM actors
Kebele Name
BILA WANJA
Institution_1
Community
leaders
AMBERCHO GIMBA
Community
leaders
Process_Description
The community
discussed on the
issue and report to
community leaders.
Every issue that is
happened in
community is frist
adressed by the
community leaders
and if it is beyond
the capacity of
community leaders
they report the
issues to Keble chair
man.
Institution_2
Keble chair
man
Process_Description
The community
leaders combine the
issue of the
community and report
to Keble leaders.
Institution_3
Keble
development
agent
Keble chair
man
Keble chair man
evaluates the issues
of the community and
find a solution
discussed with his
colleagues and if the
issue needs future
external support
he/she reports the
issue to wereda
administration.
Keble
development
agent
Process_Description
The Keble leaders were
discussed on the issue
of the community
which is reported by
their representatives
and if the issues are
beyond their capacity
to solve report to
wereda through the
development agent.
The development agent
with Keble
administrative combine
members discussed on
the issues and combine
and report to wereda.
212
Page 4 of 6

Wereda Disaster
Risk Profile
Data_Collected_Date
National Disaster Risk Management
Commission (NDRMC)
Tuesday, July 9, 2019
Region S.N.N.P
Zone
SILTIE
Wereda HULBAREG
Selected Indicator
Interventions: Community Perception on Mediums to Influence DRM Actors - Community perception on the
effectiveness of institutional channels to use to influence DRM actors
Kebele Name
ALBEZER ZEMU
SHIDGER
DATE WEZIR 6
Institution_1
Keble chair man
Community
leaders
Process_Description
The community
discussed on the
problem it happens
and report to Keble
chair man
Institution_2 Process_Description
Wereda Cabine
The Keble chair man
evaluate the issues
and report to wereda
cabine
Institution_3
Wereda
officials
Community leaders
discussed on issues
that is happened in
the community and
report to Keble chair
man
Keble chair
man
Keble chair man
combine the issues of
the community and
discussed with its
member and report to
Wereda
administration or line
sectors.
Keble
development
agent
Process_Description
The Keble assigned
wereda cabine
members discussed on
the issues with Keble
development agents
and cabine the issues
and report to wereda
administration office.
Keble development
agent as a Keble
member discussed on
the issues of the
community and report
to Wereda line sectors
for further
investigation.
213
Page 5 of 6
Wereda Disaster
Risk Profile
Data_Collected_Date
National Disaster Risk Management
Commission (NDRMC)
Tuesday, July 9, 2019
Region S.N.N.P
Zone
SILTIE
Wereda HULBAREG
Selected Indicator
Interventions: Community Perception on Mediums to Influence DRM Actors - Community perception on the
effectiveness of institutional channels to use to influence DRM actors
Kebele Name
BRHAN KITKITA
Institution_1
Community
representative
Process_Description
The community first
discussed on the
problem faced and
report to community
leader at Keble level
Institution_2
Keble chair
man
Process_Description
The community
leaders combine the
issues of the
community and report
to Keble chair man
Institution_3
Keble
development
agent
Process_Description
Keble chair man
evaluate the issues of
the community and
discussed with Keble
development agent and
if it is not some at
Keble level that
development agent
combine and report to
Wereda office
214
Page 6 of 6
Data_Collected_Date
Region S.N.N.P
Zone
SILTIE
Tuesday, July 9, 2019
Wereda HULBAREG
Selected Indicator
Interventions: Community Perception on their Knowledge used in DRM Process -
Perception of the community on how their knowledge influences the priorities
and measures of DRM actors
KebeleName
Community_Suggestions
BOLE
OBISO WACHO
KEBELE 01
ANGAMO YODE
AMOBARACHO
ACHAM
TODE TEMEDE
DEMEQE
WERABAT SHAMA
BILA WANJA
AMBERCHO GIMBA
ALBEZER ZEMU
SHIDGER
DATE WEZIR 6
Our suggestion and knowledge is became influential on the priorities and measures
forced by authorities and other risk management institution working in the
community.
We hope it will accepted by the management institutions that it can reduce the
negative impact of disaster.
It is more accepted by higher official because it address the issue of the community
and its solution.
Our idea not influence on management institution because they could be reduce
the impact of disaster
We hope it is more accepted and applicable by the authorities that it solves the
over all vulnerability of the community by the disaster.
Our knowledge and suggestion has not much influence by the authorities and other
risk management institutions.
We have a full confidence that our suggestion and knowledge has influential on the
priorities and measures taken by the authorities and other risk management
institutions working in the community that we raise basic alternative helps us to
preventing preparing for and responding to disaster.
We hope our community suggestion and knowledge has influence the priorities and
measure taken by the authorities because it address the the issue of the community
that makes us vulnerable to disaster.
We hope our suggestion are important and accepted by government and non
government organization
We hope our suggestion and knowledge become influential on authorities and other
risk management institution priorities and measures working in the community
because it address disaster mitigation strategy also the basic problem the
community that aggravates vulnerability.
We have an indigenous knowledge that we get from our families and develop
through time and this is more accepted by the authority and other development
actors.
Our suggestion and knowledge can influence the priorities and measures taken by
the authorities and other risk management institution working in the area, because
it is basic to preventing, preparing for and responding to disaster.
215
Page 1 of 2

Data_Collected_Date
Region S.N.N.P
Zone
SILTIE
Tuesday, July 9, 2019
Wereda HULBAREG
Selected Indicator
Interventions: Community Perception on their Knowledge used in DRM Process -
Perception of the community on how their knowledge influences the priorities
and measures of DRM actors
KebeleName
Community_Suggestions
BRHAN KITKITA
It is more accepted to the authority and other management institution
216
Page 2 of 2
Wereda Disaster Risk
Profile
National Disaster Risk Management
Commission (NDRMC)
Data_Collected_Date
Region S.N.N.P
Zone SILTIE
Wereda HULBAREG
Tuesday, July 9, 2019
Selected Indicator
Interventions: Suggestions to DRM Actors in the Area - Community suggested measures to DRM actors in the area
for effective DRM actions
Kebele Name
ALBEZER ZEMU
SHIDGER
Measure 1
Develop of sensor of
ownership between
community and
other actors
Comment 1
To respond,
preventing for
disaster in
collaboration
with sense of
commitment.
Measure 2
All stakeholders should
develop consensus and
share responsibility
AMBERCHO
GIMBA
Capacitate the
poorest of poor
house hold through
the provision of
inputs
Because the
severity of
disaster is higher
on poorest of
poor house hold
Establishing alternative
income generating
activity at Keble level
Comment 2
To avoid conflict
makes integration
that leads to a
good result for
any activities.
Measure 3
Apply disaster
prevention and
preparedness
policy in the
community and
develop
controlling
mechanism
Because
diversification of
house hold income
is essential to
preventing,
preparing for and
responding to
disaster
Constructing all
weather road at
Keble level
Comment 3
To minimize the
root cause of
disaster and to
rehabilitate the
environment to
get a positive
result and makes
it conducive for
human being and
other domestic
and wild animal.
Access to road
facilitates
income access
for the rural
society.
217
Page 1 of 5

Wereda Disaster Risk
Profile
National Disaster Risk Management
Commission (NDRMC)
Data_Collected_Date
Region S.N.N.P
Zone SILTIE
Wereda HULBAREG
Tuesday, July 9, 2019
Selected Indicator
Interventions: Suggestions to DRM Actors in the Area - Community suggested measures to DRM actors in the area
for effective DRM actions
Kebele Name
AMOBARACHO
ACHAM
Measure 1
Applied land use
policy
Comment 1
Because it
essential to
control land
degradation and
global warming
Measure 2
Controlling
deforestation
ANGAMO YODE
Facilitating the
accessibility of
livestock medicine
BILA WANJA
Force to the people
to conserve the
environment
through soil water
conservation
activities
Because in the
last year the
number of
livestock that
could be died
increased due to
un effectiveness
of medicine
To minimize
production and to
control
environmental
degradation loss
of top soil.
Expansion of
vaccination
Control deforestation
Comment 2
Because it is
essential to
minimize global
warming and
contribute to
climate change
relicense green
economy.
Vaccination
minimize the death
of livestock
Measure 3
Controlling the
relief aid
Comment 3
In order to
address the
vulnerable group
of the
community.
To control global
warming and
environmental
destruction
Assign health
extension worker
at Keble level
To get the health
extension service
and control
human disease
prevalence.
218
Page 2 of 5
Wereda Disaster Risk
Profile
National Disaster Risk Management
Commission (NDRMC)
Data_Collected_Date
Region S.N.N.P
Zone SILTIE
Wereda HULBAREG
Tuesday, July 9, 2019
Selected Indicator
Interventions: Suggestions to DRM Actors in the Area - Community suggested measures to DRM actors in the area
for effective DRM actions
Kebele Name
BRHAN KITKITA
Measure 1
Establishing a new
job creation
institution
DATE WEZIR 6
Establish irrigation
scheme at Keble
level
DEMEQE
Establishing
alternative job
opportunity at
Keble level
Comment 1
In order to
diversification
our income
generating
activities
In order to
minimize rain
feed agriculture
dependency and
to produce
perennial crops
through out the
year.
Dependency on a
single income
generating
activity is more
vulnerable to
disaster and to
diversity income
source makes us
less vulnerable to
disaster.
Measure 2
Establishing irrigation
scheme
Establish alternative
job opportunity at
Keble level
Constructing road for
market access
Comment 2
To prevent annual
and perennial
crops at any time
trough out the year
Measure 3
Establishing
saving and credit
organization
Comment 3
Essential to a
period of risk
To engaged in
alternative job and
to get money to
maximize income
Establishing
health center and
assign health
worker at Keble
level
To perennial
disaster
prevalence and
to get health
extension service
Road facilitates
access to different
income sources
and linkage to
urban area.
Establishing
water point for
irrigation and
human
consumption
To minimize rain
dependent
agriculture and
to produce crop
by artificial rain
fall helps us to
reduce disasters
vulnerability
219
Page 3 of 5
Wereda Disaster Risk
Profile
National Disaster Risk Management
Commission (NDRMC)
Data_Collected_Date
Region S.N.N.P
Zone SILTIE
Wereda HULBAREG
Tuesday, July 9, 2019
Selected Indicator
Interventions: Suggestions to DRM Actors in the Area - Community suggested measures to DRM actors in the area
for effective DRM actions
Kebele Name
KEBELE 01
Measure 1
Established early
warning committee
at Keble level
OBISO WACHO
Establishing saving
and credit
institution at Keble
level
TODE TEMEDE
Availability of pure
water
Comment 1
They are more
responsible and
better off the
rural community
in order to get
information and
aware the
community to
prevent, prepare
and respond to
disaster.
Saving is essential
for getting cash
at the time of
risk and other
impacts.
In Keble the main
disaster created
by the cause of
lack of pure
water
Measure 2
Providing improved
agricultural inputs in
affordable price
Established food stock
at Keble level/food
store/
Expansion of animal
health center
Comment 2
Because improved
and drought and
disease resistant
agricultural inputs
are more
productive and
essential for food
security.
Measure 3
Providing relief
aid for those who
affected by the
hazard
Comment 3
Because if the
disaster effect is
beyond the
capacity of the
community relief
aid is essential to
minimize
humanitarian
risk.
To get food item at
the period of food
shortage and
disaster
The severity of the
disease are
minimized f it is
prevented on time
affection
Construction of
road
Road is the base
of all risk
minimizing
activities
220
Page 4 of 5
Wereda Disaster Risk
Profile
National Disaster Risk Management
Commission (NDRMC)
Data_Collected_Date
Region S.N.N.P
Zone SILTIE
Wereda HULBAREG
Tuesday, July 9, 2019
Selected Indicator
Interventions: Suggestions to DRM Actors in the Area - Community suggested measures to DRM actors in the area
for effective DRM actions
Kebele Name
WERABAT
SHAMA
Measure 1
Establishing
alternative income
generating
institution at Keble
level
Comment 1
To diversify
income source is
essential to
minimize the
negative impact
of disaster
Measure 2
Decrease the price of
agricultural inputs
BOLE
Strength Keble early
warning
management system
through systematic
way by establishing
early warning
indicator system
Because to be
more effective in
preventing,
preparing for and
responding to
disaster early
warning
indicators should
be established at
Keble level.
Establishing alternative
job opportunity
Comment 2
To save surplus
products for the
time of disaster by
minimizing
searching products
for non food items
such as
contribution and
input credit.
Diversity our
income.
Measure 3
Established
irrigation
agricultural
inputs
Constructing road
and
electrification
Comment 3
To minimize the
dependency of
rain feed
agriculture
The availability
of basic
infrastructure at
Keble level is
essential to
reduce the
negative impact
of disaster and
increase job
opportunity.
221
Page 5 of 5

Wereda Disaster Risk
Profile
National Disaster Risk Management
Commission (NDRMC)
Data_Collected_Date
Region S.N.N.P
Zone SILTIE
Wereda HULBAREG
Tuesday, July 9, 2019
Selected Indicator
Economic Vulnerability: Community Suggestions to Improve Economic Situation - Community suggested measures
to improve the economic situation of the area
KebeleName
Measure 1
Comment 1
Measure 2
Comment 2
Measure 3 Comment 3
BOLE
OBISO WACHO
KEBELE 01
ANGAMO YODE
AMOBARACHO
ACHAM
Market linkages
Construction of
irrigation scheme
Establishing local
market
The invention of new
technology
Establishing saving and
credit organization
It essential to get a good
price for our products and
facilitate transaction
Improve input out
put balance
To evaluate crop at dry
season and to minimize
rain dependency
Expansion of
infrastructure
Market is essential to get
opportunity for selling
and purchasing good
To increase productivity
In order to
maximize our
profit against the
cost the price of
improved
agricultural input
should be
decrease.
To diversify house
hold income
Access to
irrigation
water
In order to
produce
annual and
perennial
crop with out
rain
dependency.
Development
of
mechanized
agriculture
activity
To increase
productivity
Access to credit in order
to diversify and
development agent.
Establishing
infrastructure such
as road and
electricity
In order to get
options of market
and other income
generating
activity.
222
Page 1 of 3
Wereda Disaster Risk
Profile
National Disaster Risk Management
Commission (NDRMC)
Data_Collected_Date
Region S.N.N.P
Zone SILTIE
Wereda HULBAREG
Tuesday, July 9, 2019
Selected Indicator
Economic Vulnerability: Community Suggestions to Improve Economic Situation - Community suggested measures
to improve the economic situation of the area
KebeleName
Measure 1
Comment 1
Measure 2
Comment 2
Measure 3 Comment 3
TODE TEMEDE
DEMEQE
Increasing of
productivity due to
accessibility of fertilizer
Fertilizer increases the
productivity of crops
Establishing irrigation
scheme at Keble level
It increase our income by
providing cash crops at
dry season
WERABAT SHAMA Establish market linkage
To control seasonal
market price fluctuation
BILA WANJA
Decrease the cost of
improved seed and
fertilizer
In order to accessible all
community members
Construction of
irrigation dam
Establishing saving
and credit
organization at
Keble level
Establish
alternative income
source at Keble
level to engaged at
off season
Accessible the
improved perennial
crop seeding to the
area
Many households
engage on
irrigation
development
It is essential to
increase our
income by saving
at the period of
availability
To generate
additional income
and to diversify
source of income
To produce cash
crop and
independent from
annual crop
production
Establishing
alternative
income
generating
organization
at Keble level
Establish
irrigation
scheme for
crop
production
Introduce a
newly
technology to
the area
especially
wheat
harvesting
technology
To diversify
our income
source helps
us to
increase
To minimize
rain
dependent
agriculture
To minimize
the work load
and to save
wastage of
time
223
Page 2 of 3

Wereda Disaster Risk
Profile
National Disaster Risk Management
Commission (NDRMC)
Data_Collected_Date
Region S.N.N.P
Zone SILTIE
Wereda HULBAREG
Tuesday, July 9, 2019
Selected Indicator
Economic Vulnerability: Community Suggestions to Improve Economic Situation - Community suggested measures
to improve the economic situation of the area
KebeleName
Measure 1
Comment 1
Measure 2
Comment 2
Measure 3 Comment 3
AMBERCHO
GIMBA
ALBEZER ZEMU
SHIDGER
Development of water
projects for irrigation
and domestic
consumption
To produce crops at any
time and improve our
income and health
situation
The price of agricultural
input decrease
To maximize the income
at the expense of
outcomes
DATE WEZIR 6
BRHAN KITKITA
Establish saving and
credit organization
Establishing alternative
job opportunity in the
area
To save and borrow cash
for additional income
To get additional income
Construction of all
weather road
Establishing market
linkage for our
product
Establish water
harvesting system
at Keble level
Construction of
road for market
linkage
To access for good
price for our
products
strengthening
market linkage.
To get a good
price for our
products
To produce crop at
any time to
maximize income
To get market
access for our
products
Establishing
alternative
income
generating
projects
To minimize
agriculture
dependent
life situation
Constructing
water
projects for
domestic use
and irrigation
To produce
crops at dry
season to get
income
Establish
electrification
at Keble level
To save cost
for fuel
Electrification
To control
deforestation
for fuel wood
224
Page 3 of 3

Wereda Disaster
Risk Profile
Data_Collected_Date
National Disaster Risk
Management Comission (NDRMC)
Tuesday, July 9, 2019
Region S.N.N.P
Zone SILTIE
Selected Indicator
Community Awareness of Disaster Risk Management System and Actors
Kebele Name
ALBEZER ZEMU SHIDGER
Institution 1
Responsibility
Activity
Keble chair man
Run the over all activity at Keble level
Mobilize the community and identify hazard affected people
Institution 2
Responsibility
Activity
Elders
Consult and advise the community members
Participate in identification of vulnerable group
Institution 3
Responsibility
Activity
Kebele Name
Youth representative
Discussed on the issue of youth at any Keble meeting
Raise the issues of youth in committee meeting
AMBERCHO GIMBA
Institution 1
Responsibility
Activity
Keble chair man
Chair the over all activities at Keble level
Confirm the selected vulnerable group for relief aid
Institution 2
Responsibility
Activity
Keble agricultural development agent
Provision of agricultural extension service
Consult the community and participate in vulnerable group selection
Institution 3
Responsibility
Activity
Keble health extension worker
Provision of health extension service
Consult the community in health issue and involve in hazard vulnerable selection
Wereda HULBAREG
225
Page 1 of 7

Wereda Disaster
Risk Profile
Data_Collected_Date
National Disaster Risk
Management Comission (NDRMC)
Tuesday, July 9, 2019
Region S.N.N.P
Zone SILTIE
Selected Indicator
Community Awareness of Disaster Risk Management System and Actors
Kebele Name
AMOBARACHO ACHAM
Wereda HULBAREG
Institution 1
Responsibility
Activity
Institution 2
Responsibility
Activity
Agricultural development agent
Give support to the rural peasants through agricultural extension service
They are not as such functional , they under take their activity after hazard in client selection for relief aid and other
support.
Health extension worker
Applied the sixteen health extension package in rural community
Institution 3
Responsibility
Keble chair man
He/she responsible to chair the food security tax force
Activity
Kebele Name
ANGAMO YODE
Institution 1
Responsibility
Activity
Productive safety net program
Make food secured
Water shade management and help to scope the disaster
Institution 2
Responsibility
Activity
Institution 3
Responsibility
Activity
226
Page 2 of 7

Wereda Disaster
Risk Profile
Data_Collected_Date
National Disaster Risk
Management Comission (NDRMC)
Tuesday, July 9, 2019
Region S.N.N.P
Zone SILTIE
Selected Indicator
Community Awareness of Disaster Risk Management System and Actors
Kebele Name
BILA WANJA
Institution 1
Responsibility
Activity
Agricultural development agent office
Provide agricultural extension service rural community
Provision of improved inputs, asses the hazard exposure of the community
Institution 2
Responsibility
Activity
Keble chair man
Manage the over all activities at Keble level
Select the vulnerable group through community participation
Institution 3
Responsibility
Activity
Kebele Name
Keble health center
Provide health extension service to rural community
Train the community about human health and participation in food security committee
BOLE
Institution 1
Responsibility
Activity
Keble combine members
Run over an administrative activities
Involve in disaster affected household selection and summarize
Institution 2
Responsibility
Activity
Keble development agent
Provision of agricultural extension service
Involve in disaster affected household selection and reporting to Wereda
Institution 3
Responsibility
Activity
Youth representative
Explain youth issues in public meeting and else where
Participate in disaster affected beneficiary identification
Wereda HULBAREG
227
Page 3 of 7
Wereda Disaster
Risk Profile
Data_Collected_Date
National Disaster Risk
Management Comission (NDRMC)
Tuesday, July 9, 2019
Region S.N.N.P
Zone SILTIE
Selected Indicator
Community Awareness of Disaster Risk Management System and Actors
Kebele Name
BRHAN KITKITA
Institution 1
Responsibility
Activity
Keble development
Agricultural extension service
Identify hazard vulnerable house hold and provide extension service
Institution 2
Responsibility
Activity
Keble chair man
Keble administration service
Manage the over all activities at Keble including disaster issues
Institution 3
Responsibility
Activity
Kebele Name
Elders representative
Consult and manage the community
Participate in hazards vulnerable group selection
DATE WEZIR 6
Institution 1
Responsibility
Activity
Keble chair man
Run the over all activities of the Keble
Perform administrative activities such as client selection for aid
Institution 2
Responsibility
Activity
Keble development agent
Provision of agricultural extension service
Consult the community in agricultural extension and participate in credit selection for Keble
Institution 3
Responsibility
Activity
Keble health extension service
Provision of health extension service
Currently no activities are perform
Wereda
HULBAREG
228
Page 4 of 7

Wereda Disaster
Risk Profile
Data_Collected_Date
National Disaster Risk
Management Comission (NDRMC)
Tuesday, July 9, 2019
Region S.N.N.P
Zone SILTIE
Selected Indicator
Community Awareness of Disaster Risk Management System and Actors
Kebele Name
DEMEQE
Wereda
Institution 1
Responsibility
Activity
Keble leader
Managing the Keble activity
Plan and implement development activity, identify and support disaster affect
Institution 2
Responsibility
Activity
Development agent
Provision of agricultural extension service to the community
Supporting the community in agricultural extension service participation in disaster affected people
Institution 3
Responsibility
Activity
Kebele Name
Women representative
Raise the issue of women in public meeting
Involve in disaster vulnerable people selection
KEBELE 01
Institution 1
Responsibility
Activity
Keble development agent office
Representative to agricultural extension service
Provide extension service, identify hazards and vulnerable group.
Institution 2
Responsibility
Activity
Health extension
Health extension service
Participate in beneficiary selection for aid support.
Institution 3
Responsibility
Activity
Education
Teaching
Participate in beneficiary selection for support.
HULBAREG
229
Page 5 of 7

Wereda Disaster
Risk Profile
Data_Collected_Date
Region S.N.N.P
Zone SILTIE
Selected Indicator
Community Awareness of Disaster Risk Management System and Actors
Kebele Name
OBISO WACHO
Institution 1
Responsibility
Activity
Keble chair man
Keble leader and mobilize the over all activity
Combine the hazards vulnerable community members data.
Institution 2
Responsibility
Activity
Keble development agent
Agricultural extension service for the community
Identify the rises and report to wereda
Institution 3
Responsibility
Activity
Kebele Name
Women representative
Raise the over all women s issue at any meeting
Participate in vulnerable group selection
TODE TEMEDE
Institution 1
Responsibility
Activity
Productive safety net program
To prevent hazard and helping the vulnerable group
Practicing water shade management
Institution 2
Responsibility
Activity
Institution 3
Responsibility
Activity
National Disaster Risk
Management Comission (NDRMC)
Tuesday, July 9, 2019
Wereda HULBAREG
230
Page 6 of 7
Wereda Disaster
Risk Profile
Data_Collected_Date
National Disaster Risk
Management Comission (NDRMC)
Tuesday, July 9, 2019
Region S.N.N.P
Zone SILTIE
Selected Indicator
Community Awareness of Disaster Risk Management System and Actors
Kebele Name
WERABAT SHAMA
Wereda
Institution 1
Responsibility
Activity
Keble Administration
To run the over all activities of the Keble
Perform over all administration role and identify disaster affected people from the community.
Institution 2
Responsibility
Activity
Keble Development agent
Support the the community through agricultural extension
Provide agricultural extension service and participate in disaster affected client selection.
Institution 3
Responsibility
Activity
Keble health extension worker
Provide health extension service to the community.
Provide health extension service and participate in disaster affected client selection.
HULBAREG
231
Page 7 of 7

Wereda Disaster
Risk Profile
National Disaster Risk Management
Commission (NDRMC)
Data_Collected_Date
Tuesday, July 9, 2019
Region S.N.N.P
Zone SILTIE
Wereda HULBAREG
Selected Indicator
Community Perception of DRM System and Actors - Perception of the community on the effectiveness of DRM
system in helping them to prevent, cope and recover from disasters
KebeleName
Prevention
Coping
Recovery
Overall_Effectiveness
ALBEZER ZEMU SHIDGER
They are not fully functional
and their activities to
prevent disaster is less help
full
AMBERCHO GIMBA
Their activities are not
effective to prevent the
negative impact of disasters.
AMOBARACHO ACHAM
They are not perform their
responsibility in a regular
manner before, during and
after hazards.
ANGAMO YODE
The effectiveness of the
program not full fill due to
lack of experience by the
beneficiaries
It is more or less effective
to help us to cope during
disaster
Their activities are more
effective to cope during a
disaster by providing relief
aid.
They report the problems as
soon as it appears and it
helps us to minimize the
negative impact of hazards.
To improve or established
productive safety net
program and agricultural
extension service
232
Their activities are more
focused on to support
the vulnerable group at
the time of disaster and
it is less effective to
recover from a disaster
Their activities are not
beyond the coping during
disaster and recovery
with their activities is
less but in some case
seed compensation help
us to replant the damage
crop.
Their activities are so
important to recover
from the disaster by
getting relief aid and
other support from
internal and external
bodies.
Less integration, less sense
of ownership and less
consensus
Individualism, loss
transparency during client
selection, resource
limitation and less
awareness.
Limitation of resource and
lack of awareness
Lack of resource and
awareness
Page 1 of 4

Wereda Disaster
Risk Profile
National Disaster Risk Management
Commission (NDRMC)
Data_Collected_Date
Tuesday, July 9, 2019
Region S.N.N.P
Zone SILTIE
Wereda HULBAREG
Selected Indicator
Community Perception of DRM System and Actors - Perception of the community on the effectiveness of DRM
system in helping them to prevent, cope and recover from disasters
KebeleName
Prevention
Coping
Recovery
Overall_Effectiveness
BILA WANJA
BRHAN KITKITA
DATE WEZIR 6
DEMEQE
In our perception their
activity is more focus on
responding to hazard and
their activities are not as
such effective in order to
prevent disaster
Their activities are not as
such effective to help us to
prevent disaster
Their activities are less
effective to preventing
disaster because they focus
on in responding disaster
during it happen.
Their activity is not effective
to preventing disaster
Their activities at the time
of disaster is effective in
selection of the affected
people through community
participation and provide
relief aid for the vulnerable
groups.
Their activity is more
effective to respond to
disaster
Their activities help us to
cope during a disaster
through the provision of
relief aid
Their activity is more
effective to help us to cope
during a disaster by
providing relief aid
They should be aware of the
general disaster prevention
and preparedness activities
/lack of awareness,
limitation of resource and
less sense of ownership /
Not effective to recovery
it is more focused on
provision of relief aid
Their activities are more
or less effective that we
get free seed to replant
our crop land.
Their activity is more or
less effective to recover
from a disaster by
providing free seed to
replant the damaged
crop land
Less attention to disaster
and its effect and limitation
of resource
They are less transport in
their activities, they give
less alternative to their
responsibility and shortage
of budget.
Awareness problem and
resource limitation
233
Page 2 of 4
Wereda Disaster
Risk Profile
National Disaster Risk Management
Commission (NDRMC)
Data_Collected_Date
Tuesday, July 9, 2019
Region S.N.N.P
Zone SILTIE
Wereda HULBAREG
Selected Indicator
Community Perception of DRM System and Actors - Perception of the community on the effectiveness of DRM
system in helping them to prevent, cope and recover from disasters
KebeleName
KEBELE 01
OBISO WACHO
TODE TEMEDE
Prevention
Their activities and measures
are less effective to prevent
disasters.
They are more or less
effective to prevent the
disaster it can happen ,
example - construction of
latrine, drainage of mosquito
breading site, agro forestry
practice, soil and water
conservation.
The effectiveness of the
activity some hoe it is good
for preventing vulnerability
Coping
Their activities are more or
less effective that help us
to cope during disaster.
Their activities help us to
cope during disaster
through the provision of
food aid and other support.
The effectiveness of safety
net activity to cope during
disaster
Recovery
Their activities are not
beyond coping during
disasters by providing
relief aid, the recovery
activities are absent.
In recovery side their
activities are less
effective that it helps us
get seed compensation
to replace the damage
crop.
Overall_Effectiveness
Resource limitation, less
attention was given to the
recovery activities and they
are not motivated to
perform their activities.
Resource limitation and lack
of awareness about the
incident of disaster.
The safety net activity
effective to prevent
disaster but not access in
all area
Lack of awareness
234
Page 3 of 4

Wereda Disaster
Risk Profile
National Disaster Risk Management
Commission (NDRMC)
Data_Collected_Date
Tuesday, July 9, 2019
Region S.N.N.P
Zone SILTIE
Wereda HULBAREG
Selected Indicator
Community Perception of DRM System and Actors - Perception of the community on the effectiveness of DRM
system in helping them to prevent, cope and recover from disasters
KebeleName
WERABAT SHAMA
BOLE
Prevention
They are not such effective
to preventing disaster they
are more or less effective to
cope during a disaster.
Their activities are more or
less effective to prevent
disaster by aware people to
save their assets and collect
their crops properly
/awareness creation /.
Coping
Their activities such as the
selection of clients for
relief aid, productive safety
net program helps to cope
during a disaster.
Their activities are more
effective by helping the
people cope during disaster
through the provision of
food aid and other support.
Recovery
Their activity are not
effective to recover from
a disaster but in some
case productive safety
net program client
become develop house
hold asset at house hold
level become graduate
and they recover from
disaster risk.
Their activities help us
to recover from a
disaster by identifying
the vulnerable group and
facilitate credit service
and other supports such
as free seed to restock
the damage crop land.
Overall_Effectiveness
Limitation of resource
Resource limitation and
work load.
235
Page 4 of 4
Data_Collected_Date
Region S.N.N.P
Zone SILTIE
Wereda HULBAREG
Tuesday, July 9, 2019
Selected Indicator
Major Public Interventions Desired - Percentage of households by type of
intervention desired
Major public interventions desired by the community
Degree of Importance for the community
Access to markets
1st
2nd
3rd
1.15
4.90
5.73
Access to roads
17.21
17.55
12.33
Agricultural inputs (fertilizer, improved seeds, etc.)
12.43
11.84
16.08
Better job
19.31
17.76
14.10
Cash transfers/social assistance
8.99
8.78
1.76
Cash-for-work activities (not employment)
0.76
0.61
1.54
Enhance access to schools / School feeding for children
0.00
0.20
0.88
Food-for-work activities
4.02
5.51
14.54
Medical assistance / access to health facilities
0.76
3.06
2.42
Micro-credit programmes
3.06
2.04
1.76
Other
0.38
1.02
1.76
Rental subsidies
0.76
0.20
0.22
School fees for children
0.38
1.43
0.00
Subsidized food
2.10
0.20
3.52
Subsidized health care
4.78
13.27
13.00
236
Page 1 of 2
Data_Collected_Date
Region S.N.N.P
Zone SILTIE
Wereda HULBAREG
Tuesday, July 9, 2019
Selected Indicator
Major Public Interventions Desired - Percentage of households by type of
intervention desired
Major public interventions desired by the community
Degree of Importance for the community
Supplementary feeding for women and young children
1st
2nd
3rd
1.34
0.82
1.54
Veterinary facilities
0.00
0.20
2.20
Food aid
22.56
10.61
6.61
237
Page 2 of 2
WDRP Indicators
Other Community Characteristics
238
Wereda Disaster
Risk Profile
Data_Collected_Date
Region S.N.N.P
Zone SILTIE
Selected Indicator
Capacity: Community Based Organizations in the Wereda
Name_Of_Organization
Est._Year
Formal/Informal
Kebele Name
URSACO
ANGAMO YODE
1998
Formal
Kebele Name BOLE
Farmers cooperation organization
2002
Formal
Kebele Name
Edir
Kebele Name
Edir
KEBELE 01
OBISO WACHO
1977
Dont know
exact time
Informal
Informal
National Disaster Risk Management
Commission (NDRMC)
Tuesday, July 9, 2019
Wereda HULBAREG
Type of Members
Women
Man, women and
youth
Elders and youth
Women, men and
elders
Activity
Saving and credit activity
Provision of agricultural inputs and
consumption food.
Support each other at funeral ceremony
Support each other at the time of death for
funeral.
239
Page 1 of 1
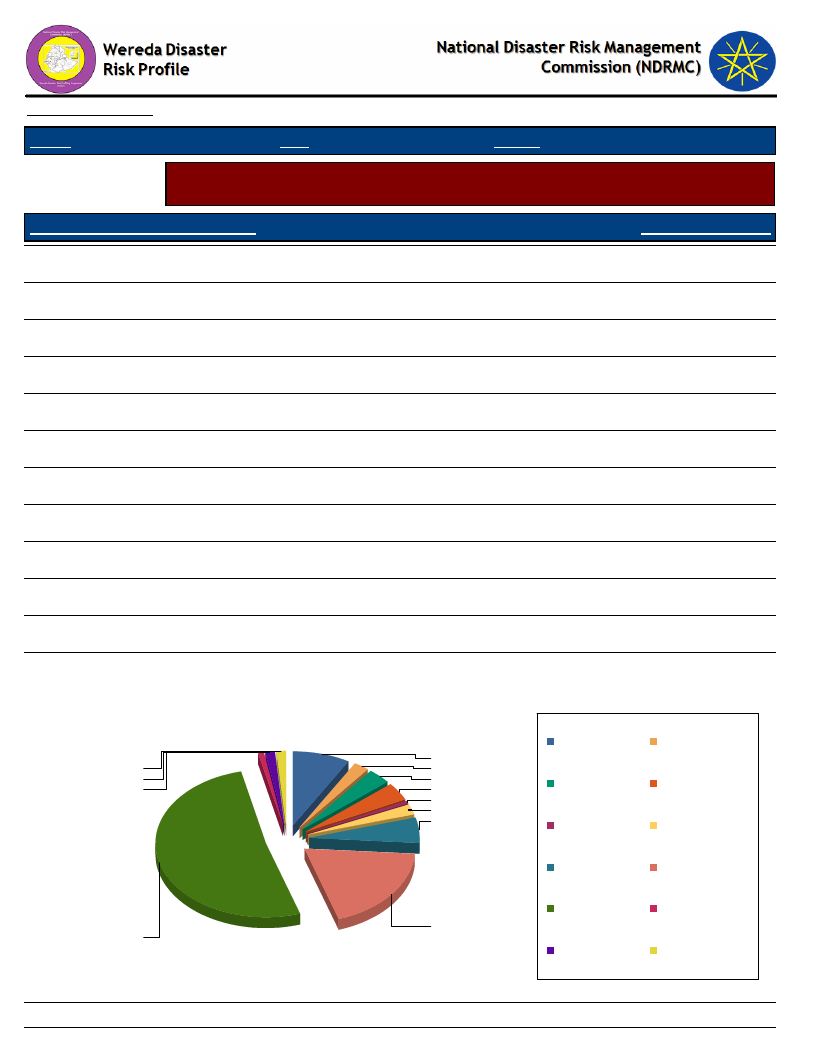
Data_Collected_Date
Region S.N.N.P
Zone SILTIE
Wereda HULBAREG
Tuesday, July 9, 2019
Selected Indicator
Supporting Agencies against Disasters - Percentage of households by supporting
institutions to handle or recover from disaster damages
Supporting Agencies Against Disasters
Response_Percentage
National or local authorities
20.85
International NGOs (e.g. UN organizations, ICRC, etc.)
2.21
Local NGOs
6.09
Family members in the same community
2.40
Friends and neighbors in the same community
4.24
Family members outside the community
3.69
Friends outside the community
0.55
Support via contacts working for the authorities
1.66
Support via contacts working for NGOs
1.29
Religious sources such as the mosque
0.92
None
56.09
DK
9.23
1.7
1.3
0.9
56.1
Supporting Agencies Against Disasters
9.2
2.4
3.7
4.2
0.6
2.2
6.1
20.9
Family members in the
DK
same community
Family members outside
the community
Friends and neighbors in
the same community
Friends outside the
community
International NGOs (e.g.
UN organizations, ICRC,
etc.)
Local NGOs
National or local
authorities
None
Support via contacts
working for NGOs
Religious sources such
as the mosque
Support via contacts
working for the
authorities
240
Page 1 of 1
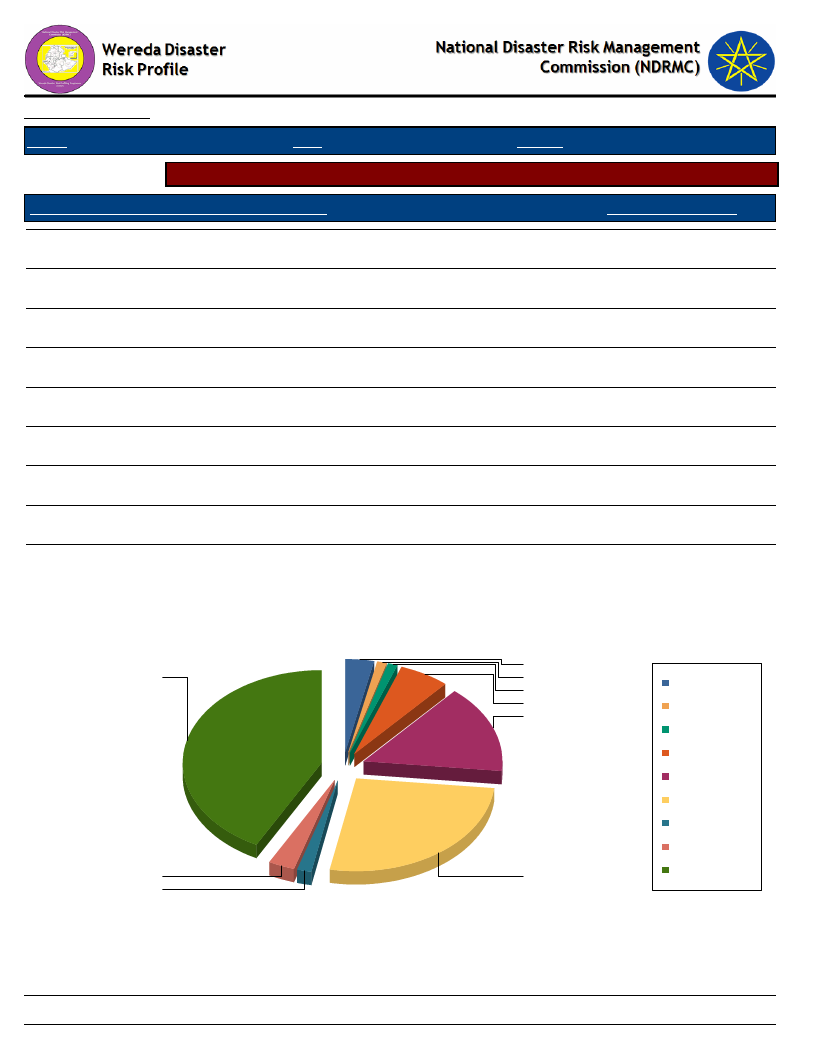
Data_Collected_Date
Region S.N.N.P
Zone SILTIE
Tuesday, July 9, 2019
Wereda HULBAREG
Selected Indicator
Types of support received by households during disasters
Type of Support Provided By Supporting Agencies
Response_Percentage
Emergency aid (food, water, shelter, etc.)
26.19
Capital for re-construction of house and property
5.95
New house
2.98
Access to loan for re-construction
1.19
Access to capital or loan for adaptation/protection measures
3.37
Assets such as livestock replenishment
0.99
Other
42.26
DK
15.28
NA
1.79
Type of Support Provided By Supporting Agencies
3
42
1
Access to capital or loan
for adaptation/protection
1
measures
6
Access to loan for
re-construction
15
Assets such as livestock
replenishment
Capital for
re-construction of house
and property
DK
Emergency aid (food,
water, shelter, etc.)
NA
New house
Other
3
26
2
241
Page 1 of 1
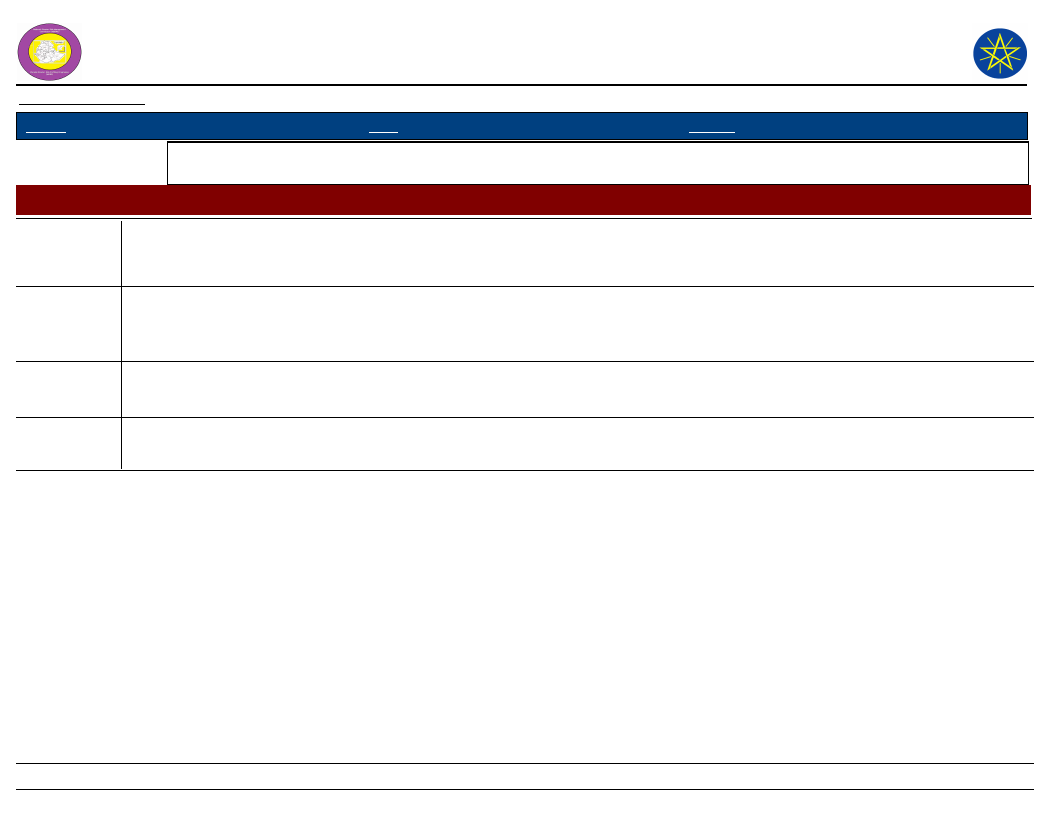
Wereda Disaster
Risk Profile
Data_Collected_Date
National Disaster Risk Management
Commission (NDRMC)
Tuesday, July 9, 2019
Region S.N.N.P
Zone SILTIE
Wereda HULBAREG
Selected Indicator
Government Actors in the Field of Disaster Risk Management - Government actors and their activities in the field
of Disaster Risk Managements
Government Institution
Wereda Health Office
Activity
Dealing with about periodic complain
Description
Activity
Description
Activity
Description
Activity
Description
Dealing about disaster prone catchment area and disease prevention mechanism
In disease prevention mechanism all committee members have a stated meeting period and they were discussed about the top ten
disease and their prevention methods and the implementation strategy.
Readiness in medical equipment, facilitate logistics and access to health organization center
According to the agro - ecology and disaster vulnerability characteristics of the wereda Keble the committee were discussed and
equipped the health center
Giving a fast response as soon as a need is raised from any part of the Wereda Keble health center
Answering any question which is raised from any part of the Wereda Keble
242
Page 1 of 1
Data_Collected_Date
Tuesday, July 9, 2019
Region S.N.N.P
Zone SILTIE
Wereda HULBAREG
Selected
Indicator
Non-Government Actors in the Field of Disaster Risk Management - Non-government
actors and their activities in the field of Disaster Risk Management
Non Governmental Actors
in the Wereda
Activities
Goal ethiopia
Support the wereda health center and the rural community in the recovery
of OTP and SC child feeding
Giving food and clothe for non- parent students
CDA
Help dis parent kids by food, cloths and educational material
Giving aid for vulnerable students like education , material, food and
clothe
SLM
Practice on water shade management activities to minimize soil erosion
and preventing water pollution
243
Page 1 of 1
Wereda Disaster Risk
Profile
Data_Collected_Date
National Disaster Risk Management
Commission (NDRMC)
July 09, 2019
Region S.N.N.P
Selected Indicator:
Zone
SILTIE
Interventions: Community Suggestions to Development Actors
Wereda HULBAREG
Kebele Name
Type Of Disaster 1
Early Warning Indicator
Preparedness Measure
Type Of Disaster 2
Early Warning Indicator
Preparedness Measure
BOLE
Drought
No traditional early warning indicators
No preparedness measures
Human disease
No traditional early warning indicators
No preparedness measures
Type Of Disaster 3
Early Warning Indicator
Preparedness Measure
Type Of Disaster 4
Early Warning Indicator
Preparedness Measure
Animal disease
Extended drought season and the coming
of camels from pastoralist area
Vaccination, isolation of animal from
camels contact
Kebele Name
Type Of Disaster 1
Early Warning Indicator
Preparedness Measure
Type Of Disaster 2
Early Warning Indicator
Preparedness Measure
OBISO WACHO
Drought
Extended dry season and a number of rat a given
area
To saving house hold asset and livestock to
purchase food item
Human disease
Un usual weather condition
Pray to God /Allah / and drain out water in
logging area
Type Of Disaster 3
Early Warning Indicator
Preparedness Measure
Type Of Disaster 4
Early Warning Indicator
Preparedness Measure
Animal disease
Un usual sound of hyena at night time
Vaccinate the stock and pray to God
/Allah /
244
Page 1 of 7

Region S.N.N.P
Selected Indicator:
Zone
SILTIE
Interventions: Community Suggestions to Development Actors
Wereda HULBAREG
Kebele Name
Type Of Disaster 1
Early Warning Indicator
Preparedness Measure
Type Of Disaster 2
Early Warning Indicator
Preparedness Measure
KEBELE 01
Drought
Extended dry season, spring and river
Saving of house hold consumption good and
animal pasture
Human disease outbreak
Hearing unusual hyena sound at night time
Vaccination and praying
Type Of Disaster 3
Early Warning Indicator
Preparedness Measure
Type Of Disaster 4
Early Warning Indicator
Preparedness Measure
Livestock disease outbreak
Hearing unusual hyena sound at night time
Vaccination and praying
Kebele Name
Type Of Disaster 1
Early Warning Indicator
Preparedness Measure
Type Of Disaster 2
Early Warning Indicator
Preparedness Measure
ANGAMO YODE
Drought
If the level of rain fall decreased over the last
year
To construct water harvesting system
Livestock disease
In-migration of Camels
Staying livestock in home rather than communal
land for grazing
Type Of Disaster 3
Early Warning Indicator
Preparedness Measure
Type Of Disaster 4
Early Warning Indicator
Preparedness Measure
245
Page 2 of 7

Region S.N.N.P
Selected Indicator:
Zone
SILTIE
Interventions: Community Suggestions to Development Actors
Wereda HULBAREG
Kebele Name
Type Of Disaster 1
Early Warning Indicator
Preparedness Measure
AMOBARACHO ACHAM
Drought
Extended dry season, delaines of rain season and
high rain fall
Saving of the house hold asset
Type Of Disaster 3
Early Warning Indicator
Preparedness Measure
Human disease
Presence of water logging area and using
Mosquito net
Type Of Disaster 2
Early Warning Indicator
Preparedness Measure
Livestock disease
The coming of camels from pastoralist area, death
of livestock and infected number of livestock
Vaccinate the livestock and isolation of the
infected one
Type Of Disaster 4
Early Warning Indicator
Preparedness Measure
Kebele Name
Type Of Disaster 1
Early Warning Indicator
Preparedness Measure
Type Of Disaster 2
Early Warning Indicator
Preparedness Measure
TODE TEMEDE
Animal disease
In migration of camels
Vaccinate the animal and not sending of animal to
communal area
Drought
The magnitude of rain fall of last year if last year
has high rain fall there is drought
Saving and storing of crops rather than selling
Type Of Disaster 3
Early Warning Indicator
Preparedness Measure
Type Of Disaster 4
Early Warning Indicator
Preparedness Measure
Flood
If their is an irregular rain fall
Preparation of cut off drain in living house
and farming land area
246
Page 3 of 7

Region S.N.N.P
Selected Indicator:
Zone
SILTIE
Interventions: Community Suggestions to Development Actors
Wereda HULBAREG
Kebele Name
Type Of Disaster 1
Early Warning Indicator
Preparedness Measure
Type Of Disaster 2
Early Warning Indicator
DEMEQE
Drought
No traditional early warning indicators
Saving household asset and reduce daily
consumption rate
Human disease
No traditional early warning indicators
Type Of Disaster 3
Early Warning Indicator
Preparedness Measure
Type Of Disaster 4
Early Warning Indicator
Animal disease
No traditional early warning indicators
Vaccination
Preparedness Measure
Preparedness Measure
Kebele Name
Type Of Disaster 1
Early Warning Indicator
Preparedness Measure
Type Of Disaster 2
Early Warning Indicator
Preparedness Measure
WERABAT SHAMA
Drought
Extended dry season and heavy rain fall
Saving household asset and minimize the current
consumption rate
Human disease
No early warning indicators
Type Of Disaster 3
Early Warning Indicator
Preparedness Measure
Type Of Disaster 4
Early Warning Indicator
Preparedness Measure
Animal disease
Wind direction, coming of Camels in the
area and extended dry season
Using traditional medicine to prevent the
infection, vaccinate the healthy one and
isolate from camel contact.
247
Page 4 of 7

Region S.N.N.P
Selected Indicator:
Zone
SILTIE
Interventions: Community Suggestions to Development Actors
Wereda HULBAREG
Kebele Name
Type Of Disaster 1
Early Warning Indicator
Preparedness Measure
Type Of Disaster 2
Early Warning Indicator
Preparedness Measure
Kebele Name
Type Of Disaster 1
Early Warning Indicator
Preparedness Measure
BILA WANJA
Drought
Damage high amount of crop and extended dry
season
Selling of livestock and purchase crop products for
future stock and renting cultivated land
Human disease
AMBERCHO GIMBA
Drought
No early warning indictor
No measure take
Type Of Disaster 3
Early Warning Indicator
Preparedness Measure
Type Of Disaster 4
Early Warning Indicator
Preparedness Measure
Livestock disease
The coming of camels from pastoralist
area
Vaccinate domestic animals
Flood
Extended dry season
Construction of cut off drain and dry out
excess water from crop land
Type Of Disaster 3
Early Warning Indicator
Preparedness Measure
Animal disease
No early warning indictor
No measure take
Type Of Disaster 2
Early Warning Indicator
Preparedness Measure
Human disease
No early warning indictor
No measure take
Type Of Disaster 4
Early Warning Indicator
Preparedness Measure
Flood
No early warning indictor
No measure take
248
Page 5 of 7

Region S.N.N.P
Selected Indicator:
Zone
SILTIE
Interventions: Community Suggestions to Development Actors
Wereda HULBAREG
Kebele Name
Type Of Disaster 1
Early Warning Indicator
Preparedness Measure
Type Of Disaster 2
Early Warning Indicator
Preparedness Measure
ALBEZER ZEMU SHIDGER
Drought
Delaines of rain season
Saving house hold asset and reduce expenditure
on non- essential item
Livestock disease
Extend dry season, the coming of camels the area
and the presence of worm in livestock drinking
wVaactceirn.ate the stock and isolate the infected
Type Of Disaster 3
Early Warning Indicator
Preparedness Measure
Type Of Disaster 4
Early Warning Indicator
Preparedness Measure
Human disease
The presence of food shortage and
mosquito breading site
Treat the infected and drain out water
logging area
Kebele Name
Type Of Disaster 1
Early Warning Indicator
Preparedness Measure
Type Of Disaster 2
Early Warning Indicator
Preparedness Measure
DATE WEZIR 6
Drought
Presence of chilly weather and a huge number of
rat in a given area
Save house hold asset and reduce daily
consumption
Human disease
No traditional early warning indicator
Type Of Disaster 3
Early Warning Indicator
Preparedness Measure
Type Of Disaster 4
Early Warning Indicator
Preparedness Measure
Animal disease
Extended dry season makes us to forecast
or judge the coming of Camels
Vaccination and preparing traditional
medicine
249
Page 6 of 7

Region S.N.N.P
Selected Indicator:
Zone
SILTIE
Interventions: Community Suggestions to Development Actors
Wereda HULBAREG
Kebele Name
Type Of Disaster 1
Early Warning Indicator
Preparedness Measure
Type Of Disaster 2
Early Warning Indicator
Preparedness Measure
BRHAN KITKITA
Drought
Extended dry season and heavy rain fall
Preparing false banana, saving house hold asset
and decrease daily meat
Livestock disease
Coming of camels from pastoralist area
Vaccinate the healthy one and isolation the
livestock from camel contact
Type Of Disaster 3
Early Warning Indicator
Preparedness Measure
Type Of Disaster 4
Early Warning Indicator
Preparedness Measure
Human disease
The presence of water logging area
Avoid mosquito breading site
Crop disease
A good stand of crop at present
No preparedness
250
Page 7 of 7
Wereda Disaster Risk
Profile
Data_Collected_Date
Region S.N.N.P
Zone
SILTIE
National Disaster Risk Management
Commission (NDRMC)
Tuesday, July 9, 2019
Wereda HULBAREG
Selected Indicator
Wereda Strengths, weaknesses, opportunites and treats (SWOT) Analysis
Kebele Name
ALBEZER ZEMU
SHIDGER
Strength
- Production of drought
resistant perennial crops
- High social interaction
Weakness
- Lack of awareness
- Illiteracy
AMBERCHO
GIMBA
- High social instruction
- Interesting to diversify
their income
- Illiteracy
- Lack of awareness
AMOBARACHO
ACHAM
- High social interaction
- Trust
- Less saving culture
- Lack of awareness
ANGAMO YODE
- No depend on forest for
income generating
- The culture of water
shed management
- The land scope of the
Keble
- Lack of awareness
Opportunity
- Government attention to
control environmental
degradation and climate
change through productive
safety net program
- Government attention to
water harvesting strategy at
Keble level and community
level
- Government attention to
reduce climate change through
physical and biological soil and
water conservation activities
- Government attention to
water harvesting program
- Disaster risk management
strategy and attention to water
project
- Environmental protection
and rehabilitation programs by
productive safety net program
- Accessibility of road
- Dam construction
Threat
- Lack of funding
- Lack of funding for
development projects
- New type of disaster
- Lack of funding by
external NGO
- The climate change
condition that damage
perennial crop
- Lack of pure drinking
water
- Lack of funding
251
Page 1 of 3

Wereda Disaster Risk
Profile
Data_Collected_Date
Region S.N.N.P
Zone
SILTIE
National Disaster Risk Management
Commission (NDRMC)
Tuesday, July 9, 2019
Wereda HULBAREG
Selected Indicator
Wereda Strengths, weaknesses, opportunites and treats (SWOT) Analysis
Kebele Name
BILA WANJA
Strength
- High social interaction
- To reduce disaster risk by
keeping crop products
Weakness
- Miss perception about the
disaster
- Lack of awareness
BRHAN KITKITA
- High social interaction
- Fore casting trend
- Lack of awareness
- Low saving culture
DATE WEZIR 6
- High social interaction
- Diversify crop production
culture
- Population growth
- Lack of awareness
DEMEQE
- High social interaction
- Illiteracy, lack of
awareness and poor saving
culture
Opportunity
- Irrigation scheme
construction
- Government attention on
rural development and water
harvesting
- Government attention to
environmental protection
- Water harvesting strategy
that enhance community as
well as house hold water access
- Government attention to
environmental protection
policy through soil and water
conservation activities
- Government attention to
establish productive safety net
program
- Government attention to
support the rural poor house
hold through cash for work
problem and their work can
protect the environment.
Threat
- The movement of
pastoralist from place to
place with their camels
- The appearance of
frosty weather
- Lack of funding for rural
projects
- The presences of new
type of disaster
- Lack of funding for
project
- Increase new disaster
- Lack of funding for
development project,
global warming and lack of
infrastructure
252
Page 2 of 3

Wereda Disaster Risk
Profile
Data_Collected_Date
Region S.N.N.P
Zone
SILTIE
National Disaster Risk Management
Commission (NDRMC)
Tuesday, July 9, 2019
Wereda HULBAREG
Selected Indicator
Wereda Strengths, weaknesses, opportunites and treats (SWOT) Analysis
Kebele Name
KEBELE 01
Strength
- The habit for water shade
management
- High social cooperation
Weakness
- Less saving culture
- Lack of awareness
OBISO WACHO
- High social interaction
- Create alternative job
- Illiteracy
- Lack of awareness
TODE TEMEDE
- High social interaction
WERABAT SHAMA
- High social interaction
- High collaboration
- Lack of awareness
- Lack of awareness
- Dependency attitude
BOLE
- High social interaction
- Culture of perennial crop
production
- Lack of awareness
- Illiteracy
Opportunity
- Government rural
development policy /water
harvesting strategy/
- Environmental protection
activity through productivity
safety net program
- Government attention to
reduce disaster risk /relief
aid/.
- To established
environmental protection,
productive safety net program
and community mobilization
- Existence of safety net
program
- Government attention to
climate relicense green
economy
- Government attention to
water harvesting program
- Environmental protection and
water conservation
- For rural road expansion and
other infrastructure
Threat
- Lack of funding by NOG
and GO
- Safe weather
- Absence of proper
description to control
camels migration from
pastoralist area.
- Lack of funding to
construct irrigation scheme
and electrification.
- Lack of funding
- Lack of funding for
development project
- Climate change
- Lack of funding for
development project
- Create new disasters
253
Page 3 of 3